


Description
Logan GARP / March 2016
Six
Coulter
Avenue
•
Suite
2000
•
Suburban
Square
•
Ardmore, PA
19003
•
800.215.1100
•
610.642.7100
(Fax)
Logan Capital GARP: 1st Quarter 2016 Review & A Look Ahead(a)
To borrow a quote from Charles Dickens
“it was best of times and it was the worst of
times…” as the first quarter of 2016 was a
roller coaster ride for investors with the S&P
500 declining by 11% by the second week
of February and then rallying back to finish
slightly positive for the quarter. We are pleased
to report that our portfolios held up particularly
well in the downturn at the start of the year
and finished ahead of the index for the quarter.
Although volatility is just part of the investing
landscape, investors seem more on edge this
year than in the last few years. With regard to
volatility, we would like to point out that going
back to 1980 the S&P 500 Index had intrayear drops averaging 15.7% and even with
these drops, annual returns have been positive
27 of 36 years. In fact, last August’s decline
of 10% was the first decline of that magnitude
since 2011.
Volatility as measured by the VIX Index has been relatively mild over the last few years, averaging a level of 21.7. To put this reading into context, during the economic crisis of 2008 the VIX reached a high of 80.9. The main culprits for the anxiety and volatility this quarter were fears of a global economic slowdown – particularly in China – fears of rising interest rates in the U.S 2015 and falling commodity prices which were interpreted to mean that global growth was slowing. Regarding interest rates in the U.S., after several years of holding rates steady, the Federal Reserve raised rates by 25 basis points in December. This led to uncertainty regarding how quickly rates would rise in 2016.
At the end of 2015 and early 2016 forecasters generally were looking for rates to increase (a ) three or four times during 2016. However, as economic indicators around the world began to soften, Federal Reserve officials stated that they would be more cautious in raising rates quickly in order not to harm the economies both here and abroad. At the start of the second quarter of 2016, economists are now looking for rates to be increased maybe once – or not at all – this year. While investors in the U.S.
were wary of interest rate hikes, investors in Europe were looking at declining interest rates as well as rates that in some cases were turning negative. This falling rate environment over the last year has led to money flowing from domestic equity funds to funds overseas. The Investment Company Institute, according to the Wall Street Journal, estimated that U.S.
stock funds suffered outflows of $23.0 billion while foreign funds had inflows of $25.1 Billion. It appears investors believe that since the U.S. equity markets benefitted from dovish interest rate policy by the Federal Reserve here at home, markets overseas will also react favorably to an accommodative interest rate policy by the European Central Bank.
We are not so sure this is the case as managing several different political systems, ethnic groups and economies is inherently more difficult than managing one country. In fact, as Greece has moved to the back burner in terms of being a threat to the stability of the European Union, Great Britain now is seen as the next threat as voters there consider a proposal to withdraw from the European Union. This vote is scheduled for June 23, 2016 so this topic will be a focus of conversation over then next few months.
We continue to believe that the U.S. is the most attractive place to invest over the long term. GARP results discussed herein should be read in conjunction with the attached performance and disclosures. Securities offered through National Securities Corporation, Member FINRA/SIPC www.logancapital.com . www.logancapital.com Here at home, things are in fairly good shape. Consumers are in in the best shape they have been in certain areas over the last few years. Household net worth is at the highest level it has been going back to 1990. Household debt levels as a percentage of disposable income are 10.1% down from 13.2% in the fourth quarter of 2007, the lowest level since 1980.
Although wage growth has been lackluster over the last few years, unemployment has fallen to 5%, the lowest level since 1970. The University of Michigan Consumer Confidence level was at 91 level compared to the average level of 85 going back to 1970. Lower energy prices and an improving housing market have also helped consumers feel better about their economic situation. In the corporate sector, businesses are in good shape financially and corporate cash (as a percent of current assets) is near all-time highs.
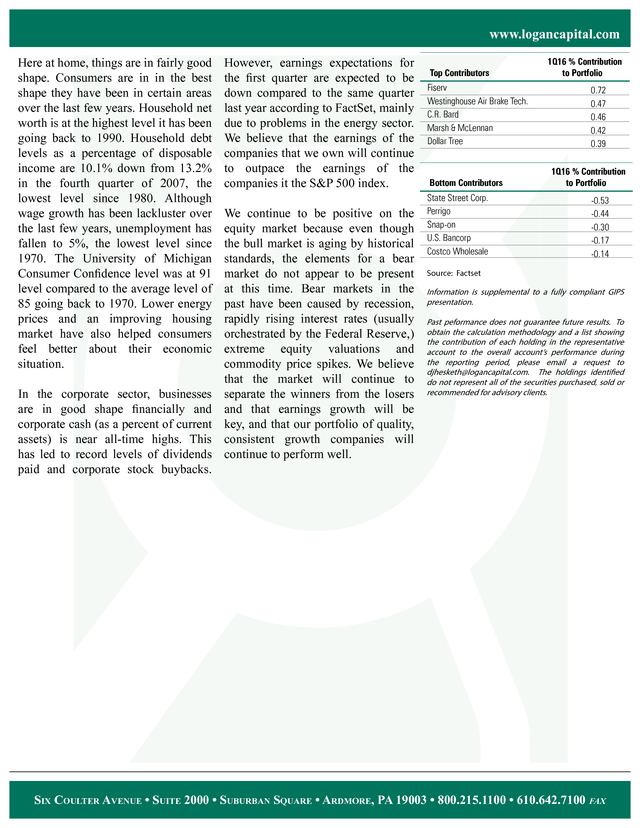
This has led to record levels of dividends paid and corporate stock buybacks. However, earnings expectations for the first quarter are expected to be down compared to the same quarter last year according to FactSet, mainly due to problems in the energy sector. We believe that the earnings of the companies that we own will continue to outpace the earnings of the companies it the S&P 500 index. We continue to be positive on the equity market because even though the bull market is aging by historical standards, the elements for a bear market do not appear to be present at this time. Bear markets in the past have been caused by recession, rapidly rising interest rates (usually orchestrated by the Federal Reserve,) extreme equity valuations and commodity price spikes. We believe that the market will continue to separate the winners from the losers and that earnings growth will be key, and that our portfolio of quality, consistent growth companies will continue to perform well. Top Contributors Fiserv Westinghouse Air Brake Tech. C.R.
Bard Marsh & McLennan Dollar Tree Bottom Contributors State Street Corp. Perrigo Snap-on U.S. Bancorp Costco Wholesale 1Q16 % Contribution to Portfolio 0.72 0.47 0.46 0.42 0.39 1Q16 % Contribution to Portfolio -0.53 -0.44 -0.30 -0.17 -0.14 Source: Factset Information is supplemental to a fully compliant GIPS presentation. Past peformance does not guarantee future results. To obtain the calculation methodology and a list showing the contribution of each holding in the representative account to the overall account’s performance during the reporting period, please email a request to djhesketh@logancapital.com.
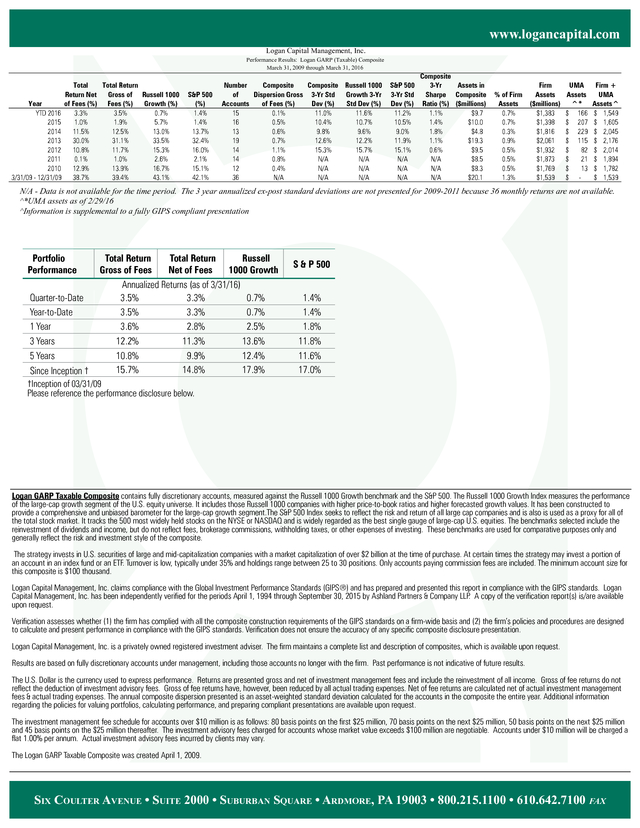
The holdings identified do not represent all of the securities purchased, sold or recommended for advisory clients. Six Coulter Avenue • Suite 2000 • Suburban Square • Ardmore, PA 19003 • 800.215.1100 • 610.642.7100 fax . www.logancapital.com Logan Capital Management, Inc. Performance Results: Logan GARP (Taxable) Composite March 31, 2009 through March 31, 2016 Year YTD 2016 2015 2014 2013 2012 2011 2010 3/31/09 - 12/31/09 Total Total Return Return Net Gross of Russell 1000 of Fees (%) Fees (%) Growth (%) 3.3% 3.5% 0.7% 1.0% 1.9% 5.7% 11.5% 12.5% 13.0% 30.0% 31.1% 33.5% 10.8% 11.7% 15.3% 0.1% 1.0% 2.6% 12.9% 13.9% 16.7% 38.7% 39.4% 43.1% S&P 500 (%) 1.4% 1.4% 13.7% 32.4% 16.0% 2.1% 15.1% 42.1% Number Composite Composite Russell 1000 of Dispersion Gross 3-Yr Std Growth 3-Yr Accounts of Fees (%) Dev (%) Std Dev (%) 15 0.1% 11.0% 11.6% 16 0.5% 10.4% 10.7% 13 0.6% 9.8% 9.6% 19 0.7% 12.6% 12.2% 14 1.1% 15.3% 15.7% 14 0.8% N/A N/A 12 0.4% N/A N/A 36 N/A N/A N/A S&P 500 3-Yr Std Dev (%) 11.2% 10.5% 9.0% 11.9% 15.1% N/A N/A N/A Composite 3-Yr Assets in Sharpe Composite Ratio (%) ($millions) 1.1% $9.7 1.4% $10.0 1.8% $4.8 1.1% $19.3 0.6% $9.5 N/A $8.5 N/A $8.3 N/A $20.1 % of Firm Assets 0.7% 0.7% 0.3% 0.9% 0.5% 0.5% 0.5% 1.3% Firm Assets ($millions) $1,383 $1,398 $1,816 $2,061 $1,932 $1,873 $1,769 $1,539 UMA Assets ^* $ 166 $ 207 $ 229 $ 115 $ 82 $ 21 $ 13 $ - Firm + UMA Assets^ $ 1,549 $ 1,605 $ 2,045 $ 2,176 $ 2,014 $ 1,894 $ 1,782 $ 1,539 N/A - Data is not available for the time period. The 3 year annualized ex-post standard deviations are not presented for 2009-2011 because 36 monthly returns are not available. ^*UMA assets as of 2/29/16 ^Information is supplemental to a fully GIPS compliant presentation Portfolio Performance Quarter-to-Date Year-to-Date 1 Year 3 Years 5 Years Since Inception † Total Return Total Return Russell Gross of Fees Net of Fees 1000 Growth Annualized Returns (as of 3/31/16) 3.5% 3.3% 0.7% 3.5% 3.3% 0.7% 3.6% 2.8% 2.5% 12.2% 11.3% 13.6% 10.8% 9.9% 12.4% 15.7% 14.8% 17.9% S & P 500 1.4% 1.4% 1.8% 11.8% 11.6% 17.0% †Inception of 03/31/09 Please reference the performance disclosure below. Logan GARP Taxable Composite contains fully discretionary accounts, measured against the Russell 1000 Growth benchmark and the S&P 500. The Russell 1000 Growth Index measures the performance of the large-cap growth segment of the U.S. equity universe.
It includes those Russell 1000 companies with higher price-to-book ratios and higher forecasted growth values. It has been constructed to provide a comprehensive and unbiased barometer for the large-cap growth segment.The S&P 500 Index seeks to reflect the risk and return of all large cap companies and is also is used as a proxy for all of the total stock market. It tracks the 500 most widely held stocks on the NYSE or NASDAQ and is widely regarded as the best single gauge of large-cap U.S.
equities. The benchmarks selected include the reinvestment of dividends and income, but do not reflect fees, brokerage commissions, withholding taxes, or other expenses of investing. These benchmarks are used for comparative purposes only and generally reflect the risk and investment style of the composite. The strategy invests in U.S.
securities of large and mid-capitalization companies with a market capitalization of over $2 billion at the time of purchase. At certain times the strategy may invest a portion of an account in an index fund or an ETF. Turnover is low, typically under 35% and holdings range between 25 to 30 positions.
Only accounts paying commission fees are included. The minimum account size for this composite is $100 thousand. Logan Capital Management, Inc. claims compliance with the Global Investment Performance Standards (GIPS®) and has prepared and presented this report in compliance with the GIPS standards.
Logan Capital Management, Inc. has been independently verified for the periods April 1, 1994 through September 30, 2015 by Ashland Partners & Company LLP. A copy of the verification report(s) is/are available upon request. Verification assesses whether (1) the firm has complied with all the composite construction requirements of the GIPS standards on a firm-wide basis and (2) the firm’s policies and procedures are designed to calculate and present performance in compliance with the GIPS standards.
Verification does not ensure the accuracy of any specific composite disclosure presentation. Logan Capital Management, Inc. is a privately owned registered investment adviser. The firm maintains a complete list and description of composites, which is available upon request. Results are based on fully discretionary accounts under management, including those accounts no longer with the firm.
Past performance is not indicative of future results. The U.S. Dollar is the currency used to express performance. Returns are presented gross and net of investment management fees and include the reinvestment of all income.
Gross of fee returns do not reflect the deduction of investment advisory fees. Gross of fee returns have, however, been reduced by all actual trading expenses. Net of fee returns are calculated net of actual investment management fees & actual trading expenses.
The annual composite dispersion presented is an asset-weighted standard deviation calculated for the accounts in the composite the entire year. Additional information regarding the policies for valuing portfolios, calculating performance, and preparing compliant presentations are available upon request. The investment management fee schedule for accounts over $10 million is as follows: 80 basis points on the first $25 million, 70 basis points on the next $25 million, 50 basis points on the next $25 million and 45 basis points on the $25 million thereafter. The investment advisory fees charged for accounts whose market value exceeds $100 million are negotiable.
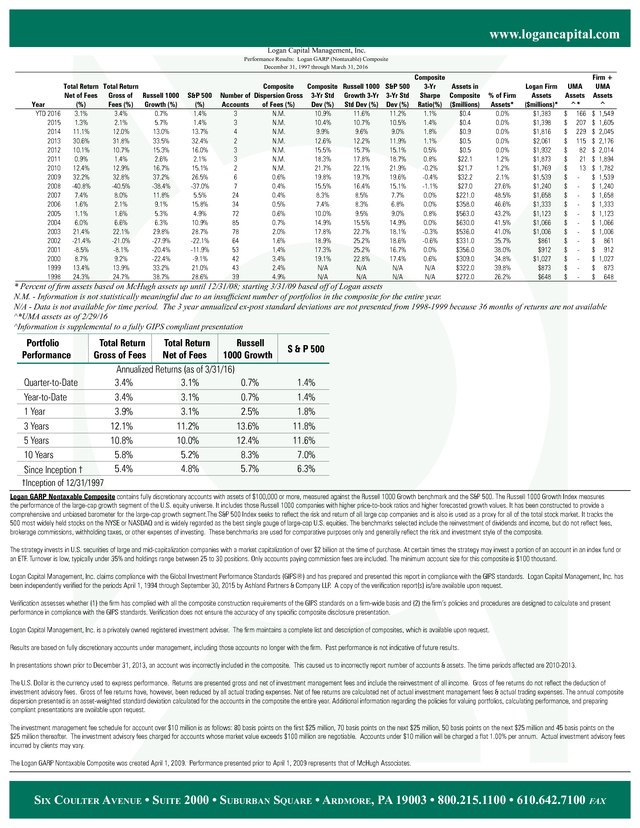
Accounts under $10 million will be charged a flat 1.00% per annum. Actual investment advisory fees incurred by clients may vary. The Logan GARP Taxable Composite was created April 1, 2009. Six Coulter Avenue • Suite 2000 • Suburban Square • Ardmore, PA 19003 • 800.215.1100 • 610.642.7100 fax . www.logancapital.com Logan Capital Management, Inc. Performance Results: Logan GARP (Nontaxable) Composite December 31, 1997 through March 31, 2016 Year YTD 2016 2015 2014 2013 2012 2011 2010 2009 2008 2007 2006 2005 2004 2003 2002 2001 2000 1999 1998 Total Return Total Return Net of Fees Gross of Russell 1000 Growth (%) (%) Fees (%) 3.1% 3.4% 0.7% 1.3% 2.1% 5.7% 11.1% 12.0% 13.0% 30.6% 31.8% 33.5% 10.1% 10.7% 15.3% 0.9% 1.4% 2.6% 12.4% 12.9% 16.7% 32.2% 32.8% 37.2% -40.8% -40.5% -38.4% 7.4% 8.0% 11.8% 1.6% 2.1% 9.1% 1.1% 1.6% 5.3% 6.0% 6.6% 6.3% 21.4% 22.1% 29.8% -21.4% -21.0% -27.9% -8.5% -8.1% -20.4% 8.7% 9.2% -22.4% 13.4% 13.9% 33.2% 24.3% 24.7% 38.7% S&P 500 (%) 1.4% 1.4% 13.7% 32.4% 16.0% 2.1% 15.1% 26.5% -37.0% 5.5% 15.8% 4.9% 10.9% 28.7% -22.1% -11.9% -9.1% 21.0% 28.6% Composite Composite Russell 1000 S&P 500 Number of Dispersion Gross 3-Yr Std Growth 3-Yr 3-Yr Std Accounts of Fees (%) Dev (%) Std Dev (%) Dev (%) 3 N.M. 10.9% 11.6% 11.2% 3 N.M. 10.4% 10.7% 10.5% 4 N.M. 9.9% 9.6% 9.0% 2 N.M. 12.6% 12.2% 11.9% 3 N.M. 15.5% 15.7% 15.1% 3 N.M. 18.3% 17.8% 18.7% 2 N.M. 21.7% 22.1% 21.9% 6 0.6% 19.8% 19.7% 19.6% 7 0.4% 15.5% 16.4% 15.1% 24 0.4% 8.3% 8.5% 7.7% 34 0.5% 7.4% 8.3% 6.8% 72 0.6% 10.0% 9.5% 9.0% 85 0.7% 14.9% 15.5% 14.9% 78 2.0% 17.8% 22.7% 18.1% 64 1.6% 18.9% 25.2% 18.6% 53 1.4% 17.3% 25.2% 16.7% 42 3.4% 19.1% 22.8% 17.4% 43 2.4% N/A N/A N/A 39 4.9% N/A N/A N/A Composite 3-Yr Assets in Sharpe Composite Ratio(%) ($millions) 1.1% $0.4 1.4% $0.4 1.8% $0.9 1.1% $0.5 0.5% $0.5 0.8% $22.1 -0.2% $21.7 -0.4% $32.2 -1.1% $27.0 0.0% $221.0 0.0% $358.0 0.8% $563.0 0.0% $630.0 -0.3% $536.0 -0.6% $331.0 0.0% $356.0 0.6% $309.0 N/A $322.0 N/A $272.0 % of Firm Assets* 0.0% 0.0% 0.0% 0.0% 0.0% 1.2% 1.2% 2.1% 27.6% 48.5% 46.6% 43.2% 41.5% 41.0% 35.7% 38.0% 34.8% 39.8% 26.2% Logan Firm Assets ($millions)* $1,383 $1,398 $1,816 $2,061 $1,932 $1,873 $1,769 $1,539 $1,240 $1,658 $1,333 $1,123 $1,066 $1,006 $861 $912 $1,027 $873 $648 UMA Assets ^* $ 166 $ 207 $ 229 $ 115 $ 82 $ 21 $ 13 $ $ $ $ $ $ $ $ $ $ $ $ - Firm + UMA Assets ^ $ 1,549 $ 1,605 $ 2,045 $ 2,176 $ 2,014 $ 1,894 $ 1,782 $ 1,539 $ 1,240 $ 1,658 $ 1,333 $ 1,123 $ 1,066 $ 1,006 $ 861 $ 912 $ 1,027 $ 873 $ 648 * Percent of firm assets based on McHugh assets up until 12/31/08; starting 3/31/09 based off of Logan assets N.M. - Information is not statistically meaningful due to an insufficient number of portfolios in the composite for the entire year. N/A - Data is not available for time period. The 3 year annualized ex-post standard deviations are not presented from 1998-1999 because 36 months of returns are not available ^*UMA assets as of 2/29/16 ^Information is supplemental to a fully GIPS compliant presentation Portfolio Performance Quarter-to-Date Year-to-Date 1 Year 3 Years 5 Years 10 Years Since Inception † Total Return Total Return Russell Gross of Fees Net of Fees 1000 Growth Annualized Returns (as of 3/31/16) 3.4% 3.1% 0.7% 3.4% 3.1% 0.7% 3.9% 3.1% 2.5% 12.1% 11.2% 13.6% 10.8% 10.0% 12.4% 5.8% 5.2% 8.3% 5.4% 4.8% 5.7% S & P 500 1.4% 1.4% 1.8% 11.8% 11.6% 7.0% 6.3% †Inception of 12/31/1997 Logan GARP Nontaxable Composite contains fully discretionary accounts with assets of $100,000 or more, measured against the Russell 1000 Growth benchmark and the S&P 500. The Russell 1000 Growth Index measures the performance of the large-cap growth segment of the U.S.
equity universe. It includes those Russell 1000 companies with higher price-to-book ratios and higher forecasted growth values. It has been constructed to provide a comprehensive and unbiased barometer for the large-cap growth segment.The S&P 500 Index seeks to reflect the risk and return of all large cap companies and is also is used as a proxy for all of the total stock market.
It tracks the 500 most widely held stocks on the NYSE or NASDAQ and is widely regarded as the best single gauge of large-cap U.S. equities. The benchmarks selected include the reinvestment of dividends and income, but do not reflect fees, brokerage commissions, withholding taxes, or other expenses of investing.
These benchmarks are used for comparative purposes only and generally reflect the risk and investment style of the composite. The strategy invests in U.S. securities of large and mid-capitalization companies with a market capitalization of over $2 billion at the time of purchase. At certain times the strategy may invest a portion of an account in an index fund or an ETF.
Turnover is low, typically under 35% and holdings range between 25 to 30 positions. Only accounts paying commission fees are included. The minimum account size for this composite is $100 thousand. Logan Capital Management, Inc.
claims compliance with the Global Investment Performance Standards (GIPS®) and has prepared and presented this report in compliance with the GIPS standards. Logan Capital Management, Inc. has been independently verified for the periods April 1, 1994 through September 30, 2015 by Ashland Partners & Company LLP.
A copy of the verification report(s) is/are available upon request. Verification assesses whether (1) the firm has complied with all the composite construction requirements of the GIPS standards on a firm-wide basis and (2) the firm’s policies and procedures are designed to calculate and present performance in compliance with the GIPS standards. Verification does not ensure the accuracy of any specific composite disclosure presentation. Logan Capital Management, Inc. is a privately owned registered investment adviser.
The firm maintains a complete list and description of composites, which is available upon request. Results are based on fully discretionary accounts under management, including those accounts no longer with the firm. Past performance is not indicative of future results. In presentations shown prior to December 31, 2013, an account was incorrectly included in the composite. This caused us to incorrectly report number of accounts & assets.
The time periods affected are 2010-2013. The U.S. Dollar is the currency used to express performance. Returns are presented gross and net of investment management fees and include the reinvestment of all income.
Gross of fee returns do not reflect the deduction of investment advisory fees. Gross of fee returns have, however, been reduced by all actual trading expenses. Net of fee returns are calculated net of actual investment management fees & actual trading expenses.
The annual composite dispersion presented is an asset-weighted standard deviation calculated for the accounts in the composite the entire year. Additional information regarding the policies for valuing portfolios, calculating performance, and preparing compliant presentations are available upon request. The investment management fee schedule for account over $10 million is as follows: 80 basis points on the first $25 million, 70 basis points on the next $25 million, 50 basis points on the next $25 million and 45 basis points on the $25 million thereafter. The investment advisory fees charged for accounts whose market value exceeds $100 million are negotiable.
Accounts under $10 million will be charged a flat 1.00% per annum. Actual investment advisory fees incurred by clients may vary. The Logan GARP Nontaxable Composite was created April 1, 2009. Performance presented prior to April 1, 2009 represents that of McHugh Associates. Six Coulter Avenue • Suite 2000 • Suburban Square • Ardmore, PA 19003 • 800.215.1100 • 610.642.7100 fax .
Volatility as measured by the VIX Index has been relatively mild over the last few years, averaging a level of 21.7. To put this reading into context, during the economic crisis of 2008 the VIX reached a high of 80.9. The main culprits for the anxiety and volatility this quarter were fears of a global economic slowdown – particularly in China – fears of rising interest rates in the U.S 2015 and falling commodity prices which were interpreted to mean that global growth was slowing. Regarding interest rates in the U.S., after several years of holding rates steady, the Federal Reserve raised rates by 25 basis points in December. This led to uncertainty regarding how quickly rates would rise in 2016.
At the end of 2015 and early 2016 forecasters generally were looking for rates to increase (a ) three or four times during 2016. However, as economic indicators around the world began to soften, Federal Reserve officials stated that they would be more cautious in raising rates quickly in order not to harm the economies both here and abroad. At the start of the second quarter of 2016, economists are now looking for rates to be increased maybe once – or not at all – this year. While investors in the U.S.
were wary of interest rate hikes, investors in Europe were looking at declining interest rates as well as rates that in some cases were turning negative. This falling rate environment over the last year has led to money flowing from domestic equity funds to funds overseas. The Investment Company Institute, according to the Wall Street Journal, estimated that U.S.
stock funds suffered outflows of $23.0 billion while foreign funds had inflows of $25.1 Billion. It appears investors believe that since the U.S. equity markets benefitted from dovish interest rate policy by the Federal Reserve here at home, markets overseas will also react favorably to an accommodative interest rate policy by the European Central Bank.
We are not so sure this is the case as managing several different political systems, ethnic groups and economies is inherently more difficult than managing one country. In fact, as Greece has moved to the back burner in terms of being a threat to the stability of the European Union, Great Britain now is seen as the next threat as voters there consider a proposal to withdraw from the European Union. This vote is scheduled for June 23, 2016 so this topic will be a focus of conversation over then next few months.
We continue to believe that the U.S. is the most attractive place to invest over the long term. GARP results discussed herein should be read in conjunction with the attached performance and disclosures. Securities offered through National Securities Corporation, Member FINRA/SIPC www.logancapital.com . www.logancapital.com Here at home, things are in fairly good shape. Consumers are in in the best shape they have been in certain areas over the last few years. Household net worth is at the highest level it has been going back to 1990. Household debt levels as a percentage of disposable income are 10.1% down from 13.2% in the fourth quarter of 2007, the lowest level since 1980.
Although wage growth has been lackluster over the last few years, unemployment has fallen to 5%, the lowest level since 1970. The University of Michigan Consumer Confidence level was at 91 level compared to the average level of 85 going back to 1970. Lower energy prices and an improving housing market have also helped consumers feel better about their economic situation. In the corporate sector, businesses are in good shape financially and corporate cash (as a percent of current assets) is near all-time highs.
This has led to record levels of dividends paid and corporate stock buybacks. However, earnings expectations for the first quarter are expected to be down compared to the same quarter last year according to FactSet, mainly due to problems in the energy sector. We believe that the earnings of the companies that we own will continue to outpace the earnings of the companies it the S&P 500 index. We continue to be positive on the equity market because even though the bull market is aging by historical standards, the elements for a bear market do not appear to be present at this time. Bear markets in the past have been caused by recession, rapidly rising interest rates (usually orchestrated by the Federal Reserve,) extreme equity valuations and commodity price spikes. We believe that the market will continue to separate the winners from the losers and that earnings growth will be key, and that our portfolio of quality, consistent growth companies will continue to perform well. Top Contributors Fiserv Westinghouse Air Brake Tech. C.R.
Bard Marsh & McLennan Dollar Tree Bottom Contributors State Street Corp. Perrigo Snap-on U.S. Bancorp Costco Wholesale 1Q16 % Contribution to Portfolio 0.72 0.47 0.46 0.42 0.39 1Q16 % Contribution to Portfolio -0.53 -0.44 -0.30 -0.17 -0.14 Source: Factset Information is supplemental to a fully compliant GIPS presentation. Past peformance does not guarantee future results. To obtain the calculation methodology and a list showing the contribution of each holding in the representative account to the overall account’s performance during the reporting period, please email a request to djhesketh@logancapital.com.
The holdings identified do not represent all of the securities purchased, sold or recommended for advisory clients. Six Coulter Avenue • Suite 2000 • Suburban Square • Ardmore, PA 19003 • 800.215.1100 • 610.642.7100 fax . www.logancapital.com Logan Capital Management, Inc. Performance Results: Logan GARP (Taxable) Composite March 31, 2009 through March 31, 2016 Year YTD 2016 2015 2014 2013 2012 2011 2010 3/31/09 - 12/31/09 Total Total Return Return Net Gross of Russell 1000 of Fees (%) Fees (%) Growth (%) 3.3% 3.5% 0.7% 1.0% 1.9% 5.7% 11.5% 12.5% 13.0% 30.0% 31.1% 33.5% 10.8% 11.7% 15.3% 0.1% 1.0% 2.6% 12.9% 13.9% 16.7% 38.7% 39.4% 43.1% S&P 500 (%) 1.4% 1.4% 13.7% 32.4% 16.0% 2.1% 15.1% 42.1% Number Composite Composite Russell 1000 of Dispersion Gross 3-Yr Std Growth 3-Yr Accounts of Fees (%) Dev (%) Std Dev (%) 15 0.1% 11.0% 11.6% 16 0.5% 10.4% 10.7% 13 0.6% 9.8% 9.6% 19 0.7% 12.6% 12.2% 14 1.1% 15.3% 15.7% 14 0.8% N/A N/A 12 0.4% N/A N/A 36 N/A N/A N/A S&P 500 3-Yr Std Dev (%) 11.2% 10.5% 9.0% 11.9% 15.1% N/A N/A N/A Composite 3-Yr Assets in Sharpe Composite Ratio (%) ($millions) 1.1% $9.7 1.4% $10.0 1.8% $4.8 1.1% $19.3 0.6% $9.5 N/A $8.5 N/A $8.3 N/A $20.1 % of Firm Assets 0.7% 0.7% 0.3% 0.9% 0.5% 0.5% 0.5% 1.3% Firm Assets ($millions) $1,383 $1,398 $1,816 $2,061 $1,932 $1,873 $1,769 $1,539 UMA Assets ^* $ 166 $ 207 $ 229 $ 115 $ 82 $ 21 $ 13 $ - Firm + UMA Assets^ $ 1,549 $ 1,605 $ 2,045 $ 2,176 $ 2,014 $ 1,894 $ 1,782 $ 1,539 N/A - Data is not available for the time period. The 3 year annualized ex-post standard deviations are not presented for 2009-2011 because 36 monthly returns are not available. ^*UMA assets as of 2/29/16 ^Information is supplemental to a fully GIPS compliant presentation Portfolio Performance Quarter-to-Date Year-to-Date 1 Year 3 Years 5 Years Since Inception † Total Return Total Return Russell Gross of Fees Net of Fees 1000 Growth Annualized Returns (as of 3/31/16) 3.5% 3.3% 0.7% 3.5% 3.3% 0.7% 3.6% 2.8% 2.5% 12.2% 11.3% 13.6% 10.8% 9.9% 12.4% 15.7% 14.8% 17.9% S & P 500 1.4% 1.4% 1.8% 11.8% 11.6% 17.0% †Inception of 03/31/09 Please reference the performance disclosure below. Logan GARP Taxable Composite contains fully discretionary accounts, measured against the Russell 1000 Growth benchmark and the S&P 500. The Russell 1000 Growth Index measures the performance of the large-cap growth segment of the U.S. equity universe.
It includes those Russell 1000 companies with higher price-to-book ratios and higher forecasted growth values. It has been constructed to provide a comprehensive and unbiased barometer for the large-cap growth segment.The S&P 500 Index seeks to reflect the risk and return of all large cap companies and is also is used as a proxy for all of the total stock market. It tracks the 500 most widely held stocks on the NYSE or NASDAQ and is widely regarded as the best single gauge of large-cap U.S.
equities. The benchmarks selected include the reinvestment of dividends and income, but do not reflect fees, brokerage commissions, withholding taxes, or other expenses of investing. These benchmarks are used for comparative purposes only and generally reflect the risk and investment style of the composite. The strategy invests in U.S.
securities of large and mid-capitalization companies with a market capitalization of over $2 billion at the time of purchase. At certain times the strategy may invest a portion of an account in an index fund or an ETF. Turnover is low, typically under 35% and holdings range between 25 to 30 positions.
Only accounts paying commission fees are included. The minimum account size for this composite is $100 thousand. Logan Capital Management, Inc. claims compliance with the Global Investment Performance Standards (GIPS®) and has prepared and presented this report in compliance with the GIPS standards.
Logan Capital Management, Inc. has been independently verified for the periods April 1, 1994 through September 30, 2015 by Ashland Partners & Company LLP. A copy of the verification report(s) is/are available upon request. Verification assesses whether (1) the firm has complied with all the composite construction requirements of the GIPS standards on a firm-wide basis and (2) the firm’s policies and procedures are designed to calculate and present performance in compliance with the GIPS standards.
Verification does not ensure the accuracy of any specific composite disclosure presentation. Logan Capital Management, Inc. is a privately owned registered investment adviser. The firm maintains a complete list and description of composites, which is available upon request. Results are based on fully discretionary accounts under management, including those accounts no longer with the firm.
Past performance is not indicative of future results. The U.S. Dollar is the currency used to express performance. Returns are presented gross and net of investment management fees and include the reinvestment of all income.
Gross of fee returns do not reflect the deduction of investment advisory fees. Gross of fee returns have, however, been reduced by all actual trading expenses. Net of fee returns are calculated net of actual investment management fees & actual trading expenses.
The annual composite dispersion presented is an asset-weighted standard deviation calculated for the accounts in the composite the entire year. Additional information regarding the policies for valuing portfolios, calculating performance, and preparing compliant presentations are available upon request. The investment management fee schedule for accounts over $10 million is as follows: 80 basis points on the first $25 million, 70 basis points on the next $25 million, 50 basis points on the next $25 million and 45 basis points on the $25 million thereafter. The investment advisory fees charged for accounts whose market value exceeds $100 million are negotiable.
Accounts under $10 million will be charged a flat 1.00% per annum. Actual investment advisory fees incurred by clients may vary. The Logan GARP Taxable Composite was created April 1, 2009. Six Coulter Avenue • Suite 2000 • Suburban Square • Ardmore, PA 19003 • 800.215.1100 • 610.642.7100 fax . www.logancapital.com Logan Capital Management, Inc. Performance Results: Logan GARP (Nontaxable) Composite December 31, 1997 through March 31, 2016 Year YTD 2016 2015 2014 2013 2012 2011 2010 2009 2008 2007 2006 2005 2004 2003 2002 2001 2000 1999 1998 Total Return Total Return Net of Fees Gross of Russell 1000 Growth (%) (%) Fees (%) 3.1% 3.4% 0.7% 1.3% 2.1% 5.7% 11.1% 12.0% 13.0% 30.6% 31.8% 33.5% 10.1% 10.7% 15.3% 0.9% 1.4% 2.6% 12.4% 12.9% 16.7% 32.2% 32.8% 37.2% -40.8% -40.5% -38.4% 7.4% 8.0% 11.8% 1.6% 2.1% 9.1% 1.1% 1.6% 5.3% 6.0% 6.6% 6.3% 21.4% 22.1% 29.8% -21.4% -21.0% -27.9% -8.5% -8.1% -20.4% 8.7% 9.2% -22.4% 13.4% 13.9% 33.2% 24.3% 24.7% 38.7% S&P 500 (%) 1.4% 1.4% 13.7% 32.4% 16.0% 2.1% 15.1% 26.5% -37.0% 5.5% 15.8% 4.9% 10.9% 28.7% -22.1% -11.9% -9.1% 21.0% 28.6% Composite Composite Russell 1000 S&P 500 Number of Dispersion Gross 3-Yr Std Growth 3-Yr 3-Yr Std Accounts of Fees (%) Dev (%) Std Dev (%) Dev (%) 3 N.M. 10.9% 11.6% 11.2% 3 N.M. 10.4% 10.7% 10.5% 4 N.M. 9.9% 9.6% 9.0% 2 N.M. 12.6% 12.2% 11.9% 3 N.M. 15.5% 15.7% 15.1% 3 N.M. 18.3% 17.8% 18.7% 2 N.M. 21.7% 22.1% 21.9% 6 0.6% 19.8% 19.7% 19.6% 7 0.4% 15.5% 16.4% 15.1% 24 0.4% 8.3% 8.5% 7.7% 34 0.5% 7.4% 8.3% 6.8% 72 0.6% 10.0% 9.5% 9.0% 85 0.7% 14.9% 15.5% 14.9% 78 2.0% 17.8% 22.7% 18.1% 64 1.6% 18.9% 25.2% 18.6% 53 1.4% 17.3% 25.2% 16.7% 42 3.4% 19.1% 22.8% 17.4% 43 2.4% N/A N/A N/A 39 4.9% N/A N/A N/A Composite 3-Yr Assets in Sharpe Composite Ratio(%) ($millions) 1.1% $0.4 1.4% $0.4 1.8% $0.9 1.1% $0.5 0.5% $0.5 0.8% $22.1 -0.2% $21.7 -0.4% $32.2 -1.1% $27.0 0.0% $221.0 0.0% $358.0 0.8% $563.0 0.0% $630.0 -0.3% $536.0 -0.6% $331.0 0.0% $356.0 0.6% $309.0 N/A $322.0 N/A $272.0 % of Firm Assets* 0.0% 0.0% 0.0% 0.0% 0.0% 1.2% 1.2% 2.1% 27.6% 48.5% 46.6% 43.2% 41.5% 41.0% 35.7% 38.0% 34.8% 39.8% 26.2% Logan Firm Assets ($millions)* $1,383 $1,398 $1,816 $2,061 $1,932 $1,873 $1,769 $1,539 $1,240 $1,658 $1,333 $1,123 $1,066 $1,006 $861 $912 $1,027 $873 $648 UMA Assets ^* $ 166 $ 207 $ 229 $ 115 $ 82 $ 21 $ 13 $ $ $ $ $ $ $ $ $ $ $ $ - Firm + UMA Assets ^ $ 1,549 $ 1,605 $ 2,045 $ 2,176 $ 2,014 $ 1,894 $ 1,782 $ 1,539 $ 1,240 $ 1,658 $ 1,333 $ 1,123 $ 1,066 $ 1,006 $ 861 $ 912 $ 1,027 $ 873 $ 648 * Percent of firm assets based on McHugh assets up until 12/31/08; starting 3/31/09 based off of Logan assets N.M. - Information is not statistically meaningful due to an insufficient number of portfolios in the composite for the entire year. N/A - Data is not available for time period. The 3 year annualized ex-post standard deviations are not presented from 1998-1999 because 36 months of returns are not available ^*UMA assets as of 2/29/16 ^Information is supplemental to a fully GIPS compliant presentation Portfolio Performance Quarter-to-Date Year-to-Date 1 Year 3 Years 5 Years 10 Years Since Inception † Total Return Total Return Russell Gross of Fees Net of Fees 1000 Growth Annualized Returns (as of 3/31/16) 3.4% 3.1% 0.7% 3.4% 3.1% 0.7% 3.9% 3.1% 2.5% 12.1% 11.2% 13.6% 10.8% 10.0% 12.4% 5.8% 5.2% 8.3% 5.4% 4.8% 5.7% S & P 500 1.4% 1.4% 1.8% 11.8% 11.6% 7.0% 6.3% †Inception of 12/31/1997 Logan GARP Nontaxable Composite contains fully discretionary accounts with assets of $100,000 or more, measured against the Russell 1000 Growth benchmark and the S&P 500. The Russell 1000 Growth Index measures the performance of the large-cap growth segment of the U.S.
equity universe. It includes those Russell 1000 companies with higher price-to-book ratios and higher forecasted growth values. It has been constructed to provide a comprehensive and unbiased barometer for the large-cap growth segment.The S&P 500 Index seeks to reflect the risk and return of all large cap companies and is also is used as a proxy for all of the total stock market.
It tracks the 500 most widely held stocks on the NYSE or NASDAQ and is widely regarded as the best single gauge of large-cap U.S. equities. The benchmarks selected include the reinvestment of dividends and income, but do not reflect fees, brokerage commissions, withholding taxes, or other expenses of investing.
These benchmarks are used for comparative purposes only and generally reflect the risk and investment style of the composite. The strategy invests in U.S. securities of large and mid-capitalization companies with a market capitalization of over $2 billion at the time of purchase. At certain times the strategy may invest a portion of an account in an index fund or an ETF.
Turnover is low, typically under 35% and holdings range between 25 to 30 positions. Only accounts paying commission fees are included. The minimum account size for this composite is $100 thousand. Logan Capital Management, Inc.
claims compliance with the Global Investment Performance Standards (GIPS®) and has prepared and presented this report in compliance with the GIPS standards. Logan Capital Management, Inc. has been independently verified for the periods April 1, 1994 through September 30, 2015 by Ashland Partners & Company LLP.
A copy of the verification report(s) is/are available upon request. Verification assesses whether (1) the firm has complied with all the composite construction requirements of the GIPS standards on a firm-wide basis and (2) the firm’s policies and procedures are designed to calculate and present performance in compliance with the GIPS standards. Verification does not ensure the accuracy of any specific composite disclosure presentation. Logan Capital Management, Inc. is a privately owned registered investment adviser.
The firm maintains a complete list and description of composites, which is available upon request. Results are based on fully discretionary accounts under management, including those accounts no longer with the firm. Past performance is not indicative of future results. In presentations shown prior to December 31, 2013, an account was incorrectly included in the composite. This caused us to incorrectly report number of accounts & assets.
The time periods affected are 2010-2013. The U.S. Dollar is the currency used to express performance. Returns are presented gross and net of investment management fees and include the reinvestment of all income.
Gross of fee returns do not reflect the deduction of investment advisory fees. Gross of fee returns have, however, been reduced by all actual trading expenses. Net of fee returns are calculated net of actual investment management fees & actual trading expenses.
The annual composite dispersion presented is an asset-weighted standard deviation calculated for the accounts in the composite the entire year. Additional information regarding the policies for valuing portfolios, calculating performance, and preparing compliant presentations are available upon request. The investment management fee schedule for account over $10 million is as follows: 80 basis points on the first $25 million, 70 basis points on the next $25 million, 50 basis points on the next $25 million and 45 basis points on the $25 million thereafter. The investment advisory fees charged for accounts whose market value exceeds $100 million are negotiable.
Accounts under $10 million will be charged a flat 1.00% per annum. Actual investment advisory fees incurred by clients may vary. The Logan GARP Nontaxable Composite was created April 1, 2009. Performance presented prior to April 1, 2009 represents that of McHugh Associates. Six Coulter Avenue • Suite 2000 • Suburban Square • Ardmore, PA 19003 • 800.215.1100 • 610.642.7100 fax .


