


Description
THE LPL FINANCIAL OPPORTUNITY
September 11th, 2015
LPL Financial Member FINRA/SIPC
Member FINRA/SIPC
1
. NOTICES
SAFE HARBOR DISCLOSURE
Statements in this presentation regarding LPL Financial Holdings Inc.'s (the “Company”) future financial and operating results, outlook, growth, plans, strategies, future market position, ability and plans to repurchase shares and pay dividends in the
future, and goals, including forecasts and statements relating to future efficiency gains, scale and projected expenses, and future results of the Company’s cash sweep programs, including the statements on the slides entitled “LPL’s agile business
model provides flexibility to manage potential environmental changes”, “LPL’s anticipated cost outlook has improved”, “Latent earnings potential has existed in the Company’s business model from rising interest rates”, “LPL’s capital-light model has
supported shareholder capital returns”, “LPL’s operating principles that guide toward long-term shareholder value creation”, “In 2015, LPL remains focused on executing core opportunities within its existing business model”, “LPL believes that it has
limited financial exposure from alternative investments under the DOL proposal as written”, “LPL’s cash sweep revenue potential has grown over time”, “ICA bank spread outlook”, “2015 run-rate cash sweep revenue opportunity”, “LPL has potential for
more than $300M of additional Adjusted EBITDA in 2016 with interest rate increases”, and “LPL is positioned to capture positive leverage from rising interest rates”, as well as any other statements that are not related to present facts or current
conditions or that are not purely historical, constitute forward-looking statements. These forward-looking statements are based on the Company's historical performance and its plans, estimates and expectations as of September 11, 2015. Forwardlooking statements are not guarantees that the future results, plans, intentions or expectations expressed or implied by the Company will be achieved. Matters subject to forward-looking statements involve known and unknown risks and uncertainties,
including economic, legislative, regulatory, competitive and other factors, which may cause actual financial or operating results, levels of activity, or the timing of events to be materially different than those expressed or implied by forward-looking
statements.
Important factors that could cause or contribute to such differences include: changes in general economic and financial market conditions, including retail investor sentiment; fluctuations in the value of advisory and brokerage assets; fluctuations in levels of net new advisory assets and the related impact on fee revenue; fluctuations in the percentage of mass affluent investors served by the Company, effects of competition in the financial services industry; changes in the number of the Company's financial advisors and institutions, their ability to market effectively financial products and services, and the success of the Company’s initiatives designed to engage them; the Company's strategy in managing program fees; changes in the growth of the Company's fee-based business; finalization and implementation of the Department of Labor’s proposed fiduciary rule; the effect of current, pending and future legislation, regulation and regulatory actions, including disciplinary actions imposed by federal or state securities regulators or self-regulatory organizations; the costs of settling and remediating issues related to pending or future regulatory matters; changes in interest rates and fees payable by banks participating in the Company's cash sweep programs, including the Company's success in negotiating agreements with current or additional counterparties; the performance of third party service providers to which business processes are transitioned from the Company; the Company’s success in negotiating and developing commercial arrangements with third party technology providers that will enable the Company to realize the improvements and efficiencies expected to result from such technology, including with respect to supervision and oversight of advisor activities; the Company’s ability to control operating risks, information technology systems risks and sourcing risks; the Company's success in integrating the operations of acquired businesses; and the other factors set forth in Part I, “Item 1A. Risk Factors” in the Company's 2014 Annual Report on Form 10-K as may be amended or updated in its quarterly reports on Form 10-Q. Except as required by law, the Company specifically disclaims any obligation to update any forward-looking statements as a result of future developments, even if its estimates change, and you should not rely on those statements as representing the Company's views after September 11, 2015. NON-GAAP FINANCIAL MEASURES Adjusted Earnings represent net income before: (a) employee share-based compensation expense, (b) amortization of intangible assets resulting from various acquisitions, (c) debt extinguishment costs, (d) restructuring and conversion costs, (e) equity issuance and related offering costs and (f) other.
Reconciling items are tax effected using the income tax rates in effect for the applicable period, adjusted for any potentially non-deductible amounts. Adjusted Earnings per share represents Adjusted Earnings divided by weighted average outstanding shares on a fully diluted basis. The Company prepares Adjusted Earnings and Adjusted Earnings per share to eliminate the effects of items that it does not consider indicative of its core operating performance.
The Company believes these measures provide investors with greater transparency by helping illustrate the underlying financial and business trends relating to results of operations and financial condition and comparability between current and prior periods. Adjusted EBITDA is defined as EBITDA (net income plus interest expense, income tax expense, depreciation and amortization), further adjusted to exclude certain non-cash charges and other adjustments. The Company presents adjusted EBITDA because the Company considers it a useful financial metric in assessing the Company's operating performance from period to period by excluding certain items that the Company believes are not representative of its core business, such as certain material non-cash items and other adjustments that are outside the control of management. Adjusted earnings, adjusted earnings per share, and adjusted EBITDA are not measures of the Company's financial performance under GAAP and should not be considered as an alternative to net income or earnings per share or any other performance measure derived in accordance with GAAP, or as an alternative to cash flows from operating activities as a measure of profitability or liquidity. In addition, adjusted EBITDA can differ significantly from company to company depending on long-term strategic decisions regarding capital structure, the tax jurisdictions in which companies operate, and capital investments. You can find additional related information, including a reconciliation of such non-GAAP measures for the year ended December 31, 2014 within the Company’s Annual Report, under "Item 7.
Management's Discussion and Analysis of Financial Condition and Results of Operations—How We Evaluate Our Business." A reconciliation of Adjusted Earnings to GAAP measures is also set forth in the Appendix to this presentation. Gross Profit is calculated as net revenues less production expenses. Production expenses consist of the following expense categories from the Company’s consolidated statements of income: (i) commission and advisory and (ii) brokerage, clearing, and exchange. All other expense categories, including depreciation and amortization, are considered general and administrative in nature.
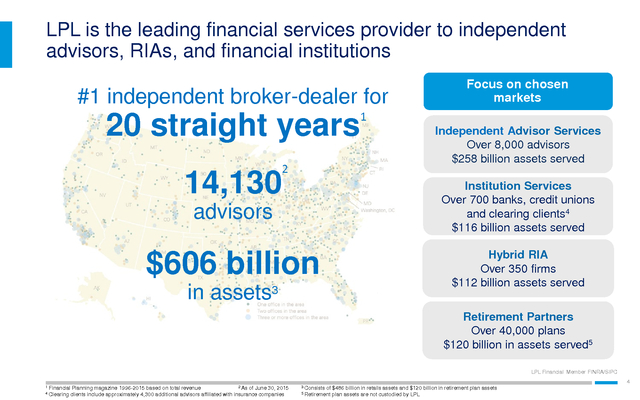
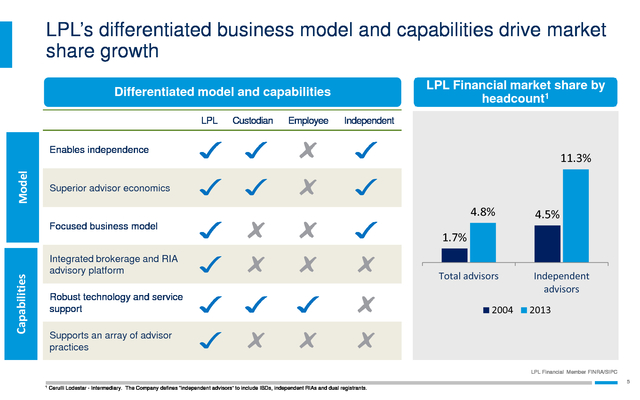
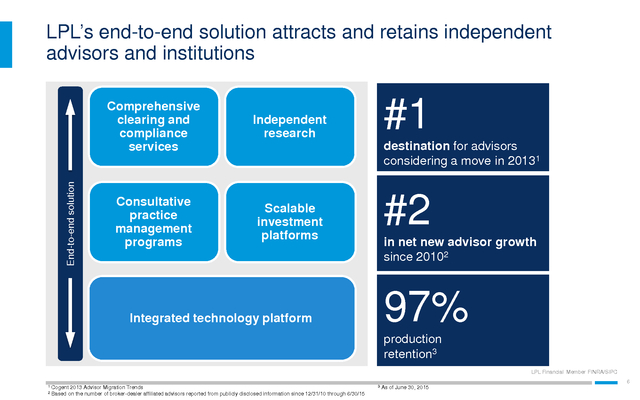
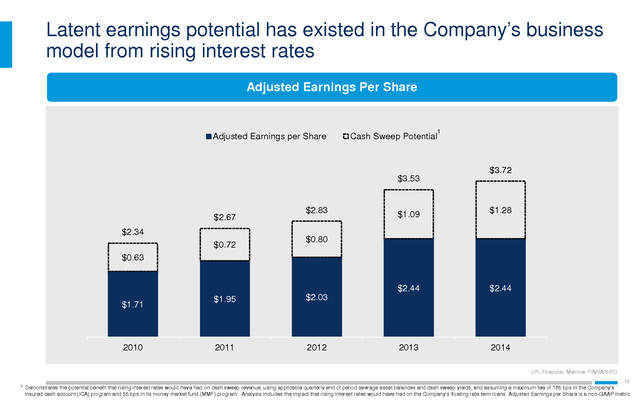
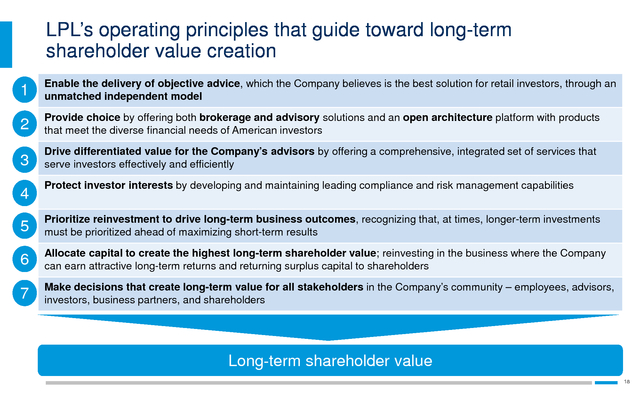
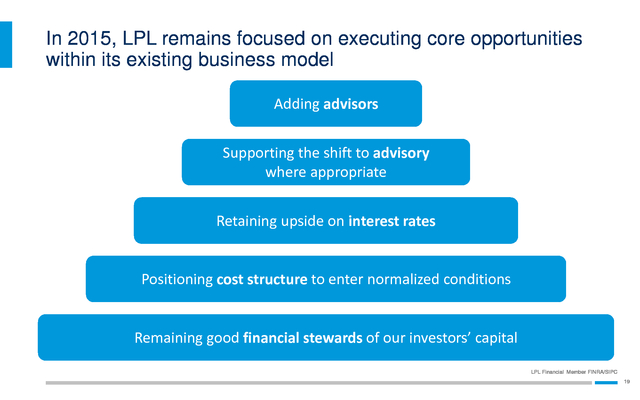
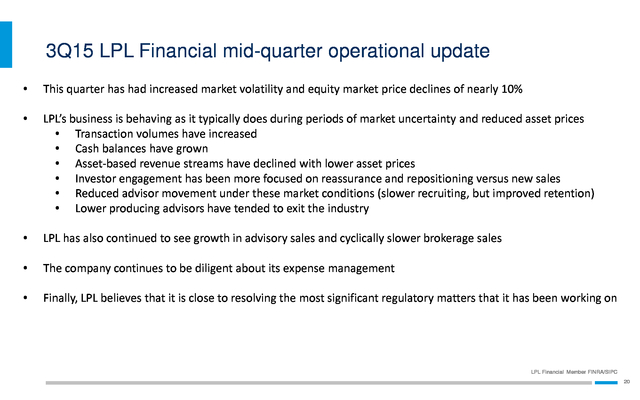
Because the Company’s gross profit amounts do not include any depreciation and amortization expense, the Company considers its gross profit amounts to be non-GAAP measures that may not be comparable to those of others in its industry. LPL Financial Member FINRA/SIPC 2 . Key messages • Differentiated value proposition drives advisor growth • Scale of advisory and brokerage offerings provides flexibility to manage change • Financial performance demonstrates business growth and earnings potential LPL Financial Member FINRA/SIPC 3 . LPL is the leading financial services provider to independent advisors, RIAs, and financial institutions #1 independent broker-dealer for 20 straight years 14,130 2 Focus on chosen markets 1 Independent Advisor Services Over 8,000 advisors $258 billion assets served advisors Institution Services Over 700 banks, credit unions and clearing clients4 $116 billion assets served $606 billion Hybrid RIA Over 350 firms $112 billion assets served in assets3 Retirement Partners Over 40,000 plans $120 billion in assets served5 LPL Financial Member FINRA/SIPC 4 1 2 As of June 30, 2015 Financial Planning magazine 1996-2015 based on total revenue 4 Clearing clients include approximately 4,300 additional advisors affiliated with insurance companies 3 Consists of $486 billion in retails assets and $120 billion in retirement plan assets 5 Retirement plan assets are not custodied by LPL . LPL’s differentiated business model and capabilities drive market share growth LPL Financial market share by headcount1 Differentiated model and capabilities LPL Custodian Employee Independent Model Enables independence 11.3% Superior advisor economics 4.8% Focused business model Capabilities Integrated brokerage and RIA advisory platform Robust technology and service support 4.5% 1.7% Total advisors 2004 Independent advisors 2013 Supports an array of advisor practices LPL Financial Member FINRA/SIPC 5 1 Cerulli Lodestar - Intermediary. The Company defines “independent advisors” to include IBDs, independent RIAs and dual registrants. . LPL’s end-to-end solution attracts and retains independent advisors and institutions End-to-end solution Comprehensive clearing and compliance services Consultative practice management programs #1 Independent research Scalable investment platforms destination for advisors considering a move in 20131 #2 in net new advisor growth since 20102 97% Integrated technology platform production retention3 LPL Financial Member FINRA/SIPC 6 1 2 Cogent 2013 Advisor Migration Trends Based on the number of broker-dealer affiliated advisors reported from publicly disclosed information since 12/31/10 through 6/30/15 3 As of June 30, 2015 . LPL’s differentiated model and capabilities combine with favorable industry trends to generate strong recruiting Retail Asset Market Share by Channel1 Net New Advisors2 (Q1’11 – Q2’15) ($ in trillions) n/a $14 1,744 1,686 1,427 921 152 65 $9 69% 31% 2008 (112) 61% 66% (2,272) 39% 34% 2013 Independent 2018E Employee Edward Jones LPL Financial Raymond James Merrill Lynch UBS Ameriprise Wells Fargo Morgan Stanley LPL Financial Member FINRA/SIPC 7 1 Cerulli: “The State of U.S. Retail and Institutional Asset Management 2014”. The Company defines “independent advisors” to include IBDs, independent RIAs and dual registrants 2 Based on the number of broker-dealer affiliated advisors reported from publicly disclosed information since December 31st, 2010, inclusive of acquisitions . Key messages • Differentiated value proposition drives advisor growth • Scale of advisory and brokerage offerings provides flexibility to manage change • Financial performance demonstrates business growth and earnings potential LPL Financial Member FINRA/SIPC 8 . LPL operates at scale across both brokerage and advisory businesses Total Brokerage & Advisory Client Assets of $486 billion (as of June 30, 2015) $299 $150 $187 $87 $149 $100 2Q15 Brokerage Assets Retirement Assets 2Q15 Advisory Assets Non-Retirement Assets LPL Financial Member FINRA/SIPC 9 . LPL has been building its advisory business for many years and are benefitting from the marketplace trend towards advisory 2000 1990 1991 – LPL Launches its first advisory platform, enabling advisors to build advisory portfolios Mid ‘90s– LPL establishes Advisory Consulting Team, providing advisory-oriented training and support to LPL advisors Today 2010 2004 – LPL launches “centrally managed” platforms, enabling advisors to use 3rd party portfolio managers 2008 – LPL launches Hybrid RIA Platform 2014 – LPL’s 7 advisory offerings serve all levels of wealth, generating industry-leading growth LPL Financial Advisory Business (2014) 90% 38% 62% of advisors licensed for advisory business of client assets were in advisory accounts of gross asset sales1 were advisory LPL Financial Member FINRA/SIPC 10 1 Gross asset sales include advisory offerings, mutual funds, variable annuities, fixed annuities, group annuities, and alternative investments but excludes equity, fixed income, and insurance sales . LPL’s rate of net new advisory asset growth was the highest among publicly-traded peers TTM Q2’15 Net New Advisory Asset Growth Rate1 11% 9% 8% 7% 5% LPL Financial TD Ameritrade Ameriprise - Wealth Management Morgan Stanley Wealth Management Charles Schwab LPL Financial Member FINRA/SIPC 11 1 Based on trailing twelve month net flows reported from publicly disclosed information as of June 30, 2015, inclusive of acquisitions . LPL’s agile business model provides flexibility to manage potential environmental changes Potential environmental change Potential impact Department of Labor proposal / heightened regulatory standards • Product substitution • Cost to comply with final rule • Further acceleration of shift industry to advisory • Industry consolidation Marketplace shift from brokerage toward advisory • Growth of the Company’s hybrid RIA platform and broader advisory offerings • Improved LPLA economics Emergence of robo-advice • • • • Reassessment of value proposition Market expansion strategy for advisors Improved productivity of advisors Increased use of the Company’s centrally managed platforms LPL Financial Member FINRA/SIPC 12 . Key messages • Differentiated value proposition drives advisor growth • Scale of advisory and brokerage offerings provides flexibility to manage change • Financial performance demonstrates business growth and earnings potential LPL Financial Member FINRA/SIPC 13 . LPL’s steady asset growth has driven topline performance Assets1 Gross Profit ($ in billions) ($ in billions) Brokerage Advisory $475 $486 $176 $187 $438 $373 $316 $330 $93 $102 $223 $229 $152 $122 $251 $287 $299 2011 2012 2013 2014 Brokerage Assets = 7% CAGR2 Advisory Assets = 17% $1.03 2010 2010 $0.94 $1.11 2011 2012 $1.25 $1.33 $1.36 2013 2014 TTM Q2'15 $299 Q2'15 Gross Profit ex Cash Sweep Revenue = 10% CAGR2 CAGR2 LPL Financial Member FINRA/SIPC 14 1 Advisory and brokerage assets are comprised of assets that are custodied, networked, and non-networked and reflect market movement in addition to new assets, inclusive of new business development and net of attrition. Insured cash 2 Compound annual growth rate from 12/31/10 to 6/30/15 account and money market account balances are also included in advisory and brokerage assets . LPL’s anticipated cost outlook has improved Year-over-Year Core G&A Growth Rate Excluding Regulatory Charges 13% 7.5-8.5% Anticipated lower growth rate than in 2015 2015 Outlook 2016 Outlook 5% 2013 Ex-Reg. Regulatory $616 $8 2014 $648 $36 Core G&A ($ in mm) $697-703M Lower than 2014 TBD Meaningfully lower than 20151 LPL Financial Member FINRA/SIPC 15 1 The Company operates in a complex and highly regulated industry, and its regulatory charges are unpredictable quarter to quarter. . Latent earnings potential has existed in the Company’s business model from rising interest rates Adjusted Earnings Per Share Adjusted Earnings per Share 1 Cash Sweep Potential $3.72 $3.53 $2.83 $2.34 $0.72 $1.09 $1.28 $2.44 $2.67 $2.44 2013 2014 $0.80 $0.63 $1.71 2010 $1.95 $2.03 2011 2012 LPL Financial Member FINRA/SIPC 1 16 Demonstrates the potential benefit that rising interest rates would have had on cash sweep revenue, using applicable quarterly end of period average asset balances and cash sweep yields, and assuming a maximum fee of 185 bps in the Company’s insured cash account (ICA) program and 55 bps in its money market fund (MMF) program. Analysis includes the impact that rising interest rates would have had on the Company’s floating rate term loans. Adjusted Earnings per Share is a non-GAAP metric. . LPL’s capital-light model has supported shareholder capital returns Return of Capital Fully Diluted Shares (in millions) Share Repurchases (in millions) Dividends $448 $371 $249 $287 $96 $68 $164 112 111 106 $89 $199 $219 $275 102 98 $116 $89 2011 $48 2012 2013 2014 YTD Q2'15 2011 2012 2013 2014 YTD Q2'15 Return of capital per share $0.79 $4.04 $2.71 $3.65 2012 includes a special dividend of $223 million $1.68 LPL Financial Member FINRA/SIPC 17 . LPL’s operating principles that guide toward long-term shareholder value creation 1 Enable the delivery of objective advice, which the Company believes is the best solution for retail investors, through an unmatched independent model 2 Provide choice by offering both brokerage and advisory solutions and an open architecture platform with products that meet the diverse financial needs of American investors 3 Drive differentiated value for the Company’s advisors by offering a comprehensive, integrated set of services that serve investors effectively and efficiently 4 Protect investor interests by developing and maintaining leading compliance and risk management capabilities 5 Prioritize reinvestment to drive long-term business outcomes, recognizing that, at times, longer-term investments must be prioritized ahead of maximizing short-term results 6 Allocate capital to create the highest long-term shareholder value; reinvesting in the business where the Company can earn attractive long-term returns and returning surplus capital to shareholders 7 Make decisions that create long-term value for all stakeholders in the Company’s community – employees, advisors, investors, business partners, and shareholders Long-term shareholder value LPL Financial Member FINRA/SIPC 18 . In 2015, LPL remains focused on executing core opportunities within its existing business model Adding advisors Supporting the shift to advisory where appropriate Retaining upside on interest rates Positioning cost structure to enter normalized conditions Remaining good financial stewards of our investors’ capital LPL Financial Member FINRA/SIPC 19 . 3Q15 LPL Financial mid-quarter operational update • This quarter has had increased market volatility and equity market price declines of nearly 10% • LPL’s business is behaving as it typically does during periods of market uncertainty and reduced asset prices • Transaction volumes have increased • Cash balances have grown • Asset-based revenue streams have declined with lower asset prices • Investor engagement has been more focused on reassurance and repositioning versus new sales • Reduced advisor movement under these market conditions (slower recruiting, but improved retention) • Lower producing advisors have tended to exit the industry • LPL has also continued to see growth in advisory sales and cyclically slower brokerage sales • The company continues to be diligent about its expense management • Finally, LPL believes that it is close to resolving the most significant regulatory matters that it has been working on LPL Financial Member FINRA/SIPC 20 . APPENDIX LPL Financial Member FINRA/SIPC 21 . Adjusted Earnings per Share grew 7% year-over-year, largely driven by business expansion and share buybacks Adjusted Earnings Per Share: Q2’14 vs. Q2’15 $0.02 $0.03 $0.02 $0.01 ($0.03) ($0.01) $0.65 $0.61 Q2'14 Adjusted EPS Business Expansion (1) Benefit from TTM Promotional Expense Regulatory Charges Share Buybacks Net Commissions Sales(2) Cash Sweep Revenue Q2'15 Adjusted EPS Note: Adjusted Earnings per Share and Gross Profit are non-GAAP metrics. (1) Business expansion consists of a) Gross Profit growth excluding net commission sales and cash sweep revenue which contributed $0.07 per share, less b) Core G&A expense growth which reduced adjusted earnings by $0.05 per share. Core G&A expenses are defined as total operating expenses, including the pre-tax earnings adjustments, but excluding the following expenses: commission and advisory, promotional, depreciation and amortization, and brokerage, clearing, and exchange. (2) Represents commission sales revenue less commission sales expense. LPL Financial Member FINRA/SIPC 22 . Excluding commissions from alternative investments, Q2’15 commissions revenue increased 3% sequentially, driven by VA and mutual fund trail growth Total Quarterly Commission Revenue ($ in millions) QOQ YOY (3%) (5%) $535 $520 $528 $523 $510 $67 $43 $51 $67 $37 $42 $72 $34 $63 $73 $35 $59 $68 $36 $32 (7%) 1% 3% (46%) (16%) (37%) $154 $154 $153 $151 $158 5% 3% $220 $220 $206 $205 $216 5% (2%) Q1'15 Q2'15 Q2'14 Variable annuities Q3'14 Mutual funds Q4'14 Alternative investments Fixed annuities Equities, Fixed Income, Insurance & Other Quarterly Commission Revenue Excluding Alternative Investments ($ in millions) Q2’14 Q3’14 Q4’14 Q1’15 $484 $478 $464 $465 Q2’15 3% $478 LPL Financial Member FINRA/SIPC 23 . LPL is the 7th largest advisory asset manager Q1 2015 Advisory Assets1 (in billions) $801 $611 $433 $351 $226 Morgan Merrill Lynch Wells Fargo Stanley Wealth Management UBS $187 Fidelity Schwab $184 $180 2 LPL Financial Ameriprise $148 $140 Raymond James Edward Jones LPL Financial Member FINRA/SIPC 24 1 Cerulli Associates – Lodestar Database as of March 31st, 2015 2 Represent the Company’s fee-based assets on its corporate and hybrid RIA platforms . LPL views growth of assets and gross profits as more representative of business growth than revenue growth Asset, Revenue(1) and Gross Profit(2) Growth Under accounting standards, advisory fees charged to investors by advisors on the Company’s hybrid RIA platform are not reflected on its income statement (unlike advisory fees charged for the Company’s corporate advisory platform business). 17% 14% 12% 12% 11% 9% 9% 8% 9% 8% 7% 6% 3% Asset Revenue Gross Growth Growth Profit Growth Asset Revenue Gross Growth Growth Profit Growth Asset Revenue Gross Growth Growth Profit Growth TTM Q2'14 TTM Q3'14 TTM Q4'14 Asset Revenue Gross Growth Growth Profit Growth TTM Q1'15 4% 2% Asset Revenue Gross Growth Growth Profit Growth TTM Q2'15 LPL Financial Member FINRA/SIPC 25 1 Revenue growth included cash sweep revenue. 2 Gross Profit growth has excluded cash sweep revenue for purposes of this comparison. Gross profit is a non-GAAP metric. . Recurring gross profit* of >75% has created financial stability and minimized dependency on sales commissions Revenue % Recurring Gross Profit % of Gross Profit Recurring Gross Profit Advisory 1,338 99% 231 17% 229 Sales commissions 1,181 0% 120 9% - Trailing commissions 937 100% 115 9% 115 Cash sweep 100 100% 100 8% 100 Other asset based 377 96% 357 27% 344 Transaction and fee 370 63% 340 26% 214 Interest and other 71 32% 62 4% 20 1,326 100% 1,022 2014 Components ($ in millions) <25% >75% 2014 Gross Profit Recurring Transactional Total % Recurring 4,373 68% *Gross profit is a Non-GAAP financial metric Note: The 2014 gross profit breakdown applies a refined cost allocation methodology that was implemented in 2015. The gross profit breakdown methodology differs from the 2013 gross profit breakdown methodology that was included in a presentation dated December 10, 2014 (“The LPL Financial Opportunity”) posted on LPL’s website in connection with the Goldman Sachs investor conference held on December 10, 2014. Applying the updated methodology to 2013 yields gross profit distribution of 17% Advisory, 9% Sales Commissions, 9% Trail Commissions, 34% Asset Based, 27% Transaction and Fees, and 4% Interest and Other. 77% LPL Financial Member FINRA/SIPC 26 . LPL believes that it has limited financial exposure from alternative investments under the DOL proposal as written Alternative investment sales as a percentage of total gross profit (2014 total of $1,326M) ~5% (~$65 million) Percentage of alternative investment sales that are made in brokerage retirement accounts ~40% Alternative investment sales in brokerage retirement accounts as a share of total gross profit ~2% (~$26 million) Variable cost projected to be eliminated due to reduced manual alternative investments processing and compliance ~25% of gross profit reduction (~$6 million) Substitute products potential contribution to gross profit* At least 1% ($13 million+) Potential EBIT impact $7 million or less ($26M - $6M - $13M+) LPL Financial Member FINRA/SIPC 27 *Substitute product contribution to gross profit is likely to phase in over several years due to trailing commissions and attachment revenue, whereas alternative investments accrue to gross profit at the time of sale . LPL’s product mix reflects the greater percentage of mass affluent investors that it serves relative to wirehouse or regional firms 10% 12% 28% 25% 36% ~65% Mass Affluent (<$500K) 52% 44% 39% 21% 18% 13% LPL Regional <$100K $100-500K 2% Wirehouse $500K-2M >$2M LPL Financial Member FINRA/SIPC 28 1 Cerulli Advisor Metrics 2014 . LPL’s cash sweep revenue potential has grown over time Cash Sweep Revenue ($ in millions) Cash Sweep Revenue Cash Sweep Potential $17 $162 $176 $231 $262 $145 $135 $120 $120 $127 $138 $120 $100 2009 2010 2011 2012 2013 2014 $24.8 $24.1 50 42 $201 2008 Average Cash Sweep Balances ($bn) $19.4 $20.3 $18.7 57 64 $21.5 $22.8 Average Cash Sweep Yield (bps) 113 61 62 LPL Financial Member FINRA/SIPC 29 Note: The revenue potential assumes a maximum fee of 185 bps in the insured cash account (ICA) program and 55 bps in the money market fund (MMF) program. . ICA bank spread outlook  Certain ICA bank contracts established in 2008 provide fees that are above market. As these contracts gradually reset to market rates, the weighted average bank spread over FFER has and will continue to decline  If FFER remains flat in 2015, the result would be a ~$20 mm revenue and EBITDA headwind based on 2Q15 cash balances  The Company expects a ~22 bps step-down in its bank spread in Q1 2016  The anticipated 2016 ending bank spread is approximately within the range of current market rates  As interest rates rise, the Company may incur additional interest expense related to its loan facilities Beginning of Year FFER1 2015 10 2016 (pro forma) 13 1 As Beginning of the Year Bank Spread1 + + 45 35 = = ICA Fee1 ~55 ~48 Change in FFER + + ~3 tbd Change in bank spread due to volume shift between contracts3 Bank Spread Compression2 - ~13 ~22 + + ~3 tbd = = Estimated Ending ICA Fee4 FFER needed to achieve 185 bps ICA target fee 5,6 EBITDA upside from rise in interest rate ($mm)7 ~48 ~260 ~$270 ~26 ~305 ~$310 of January 1st of the applicable year bank spread compression is an estimate; historically a majority of bank spread compression has occurred in the first quarter Bank spread may increase or decrease as asset balances shift among banks with differing yields 4 The ICA fee is based on average customer asset balances for the prior four quarters inclusive of Q2’15 and assumes a flat FFER. An increase in balances may lead to further ICA bank fee compression 5 Please see pages 21 - 22 of the Company’s Q2 2015 Financial Supplement, which is posted on the LPL Financial Investor Relations website under the Events section and provides additional information regarding the effect of a rising FFER on the ICA program 6 Based on 2Q15 balances and contracts, if maximum bank spread compression occurs, the minimum FFER rate required to maximize fees could increase up to approximately 350 bps LPL Financial Member FINRA/SIPC 7 Does not include the potential to incur additional interest expense related to the Company’s loan facilities as interest rates rise 30 2 2016 3 . 2015 run-rate cash sweep opportunity ICA MMF Total $17.4 $6.8 $24.2 Fee1 (bps) 48 9 37 Assumed max fee (bps) 185 55 145 Potential annualized incremental EBITDA ($ in mm)2 $239 $32 $271 Assets1 ($ in bn) ICA upside from FFER will be recognized incrementally and immediately as FFER improves LPL Financial Member FINRA/SIPC 31 1 Based on the average balances and fees for the prior four quarters, inclusive of Q2’15 2 As interest rates rise, the Company may incur additional interest expense related to its loan facilities . LPL has potential for more than $300M of additional Adjusted EBITDA in 2016 with interest rate increases1 LPL’s 2016 Cash Sweep Revenue Potential (projections in millions) 2014 Adjusted EBITDA = $517M 2014 Cash Sweep Revenue = $100M $108 $80 $31 $46 $25 $13 $33 $55 $77 +25 bps +50 bps +75 bps $130 $31 $99 $151 $31 $120 $173 $31 $142 $195 $31 $164 $217 $31 $186 $239 $31 $208 $260 $31 $229 $282 $31 $251 $304 $308 $31 $31 $273 $277 +100 bps +125 bps +150 bps +175 bps +200 bps +225 bps +250 bps +275 bps +300 bps +305 bps2 Increase to Federal Reserve Effective Funds Rate (“FFER”) ICA MMK 1 Assumes no change to the average customer asset balances as of the end of Q2’15 and the Q2’15 FFER of 12.6 basis points. An increase in customer asset balances could lead to further bank fee compression. Assumes the expected 2016 ICA bank spread step-down of 22 basis point from Q2’15 ICA rate. Does not include the potential to incur additional expense related to the Company’s loan facilities due to an interest rates rise.
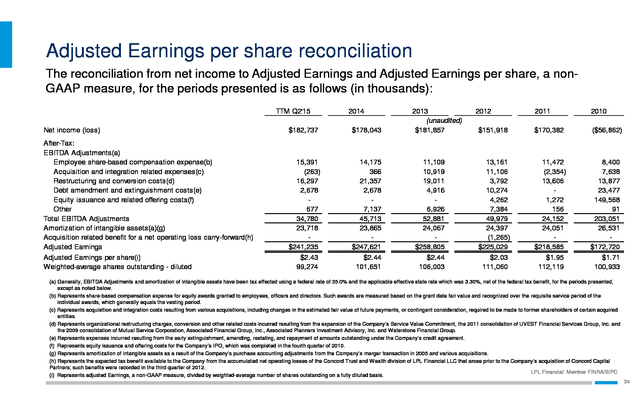
An increase of 305 bps increases would achieve the Company’s 185 bps ICA target fee. 2 Assuming a maximum compression in the fees from banks that participate in the Company's insured cash account (“ICA”) program, normalized FFER would need to increase to a maximum of approximately 3.50% in order for the Company to realize its 185 basis point target fee. Please see pages 21-22 of the Company’s Q2 2015 Financial Supplement, which is posted on the LPL Financial Investor Relations website under the Events section, for additional information on the effect of a rising FFER on the Company’s ICA bank fee program. LPL Financial Member FINRA/SIPC 32 . LPL is positioned to capture positive leverage from rising interest rates Projected Impact of Increased Interest Rates Assumption: FFER increases 100 bps in 20161 ($ in millions) $130 ~13x positive leverage to interest rate increases, which could provide stability and improve the leverage ratio, as calculated pursuant to the Company’s credit agreement $10 Cash Sweep Revenue Interest Payment on Debt LPL Financial Member FINRA/SIPC 33 1 Assumes no change to the average customer asset balances as of the end of Q2’15 and the Q2’15 FFER of 12.6 basis points. An increase in customer asset balances could lead to further bank fee compression. Assumes the expected 2016 ICA bank spread step-down of 22 basis point from Q2’15 ICA rate. . Adjusted Earnings per share reconciliation The reconciliation from net income to Adjusted Earnings and Adjusted Earnings per share, a nonGAAP measure, for the periods presented is as follows (in thousands): TTM Q2'15 2014 Net income (loss) $182,737 $178,043 After-Tax: EBITDA Adjustments(a) Employee share-based compensation expense(b) Acquisition and integration related expenses(c) Restructuring and conversion costs(d) Debt amendment and extinguishment costs(e) Equity issuance and related offering costs(f) Other Total EBITDA Adjustments Amortization of intangible assets(a)(g) Acquisition related benefit for a net operating loss carry-forward(h) Adjusted Earnings Adjusted Earnings per share(i) Weighted-average shares outstanding - diluted 15,391 (263) 16,297 2,678 677 34,780 23,718 $241,235 $2.43 99,274 14,175 366 21,357 2,678 7,137 45,713 23,865 $247,621 $2.44 101,651 2013 (unaudited) $181,857 11,109 10,919 19,011 4,916 6,926 52,881 24,067 $258,805 $2.44 106,003 2012 2011 2010 $151,918 $170,382 ($56,862) 13,161 11,106 3,792 10,274 4,262 7,384 49,979 24,397 (1,265) $225,029 $2.03 111,060 11,472 (2,354) 13,606 1,272 156 24,152 24,051 $218,585 $1.95 112,119 8,400 7,638 13,877 23,477 149,568 91 203,051 26,531 $172,720 $1.71 100,933 (a) Generally, EBITDA Adjustments and amortization of intangible assets have been tax effected using a federal rate of 35.0% and the applicable effective state rate which was 3.30%, net of the federal tax benefit, for the periods presented, except as noted below. (b) Represents share-based compensation expense for equity awards granted to employees, officers and directors. Such awards are measured based on the grant date fair value and recognized over the requisite service period of the individual awards, which generally equals the vesting period. (c) Represents acquisition and integration costs resulting from various acquisitions, including changes in the estimated fair value of future payments, or contingent consideration, required to be made to former shareholders of certain acquired entities. (d) Represents organizational restructuring charges, conversion and other related costs incurred resulting from the expansion of the Company’s Service Value Commitment, the 2011 consolidation of UVEST Financial Services Group, Inc. and the 2009 consolidation of Mutual Service Corporation, Associated Financial Group, Inc., Associated Planners Investment Advisory, Inc. and Waterstone Financial Group. (e) Represents expenses incurred resulting from the early extinguishment, amending, restating, and repayment of amounts outstanding under the Company’s credit agreement. (f) Represents equity issuance and offering costs for the Company’s IPO, which was completed in the fourth quarter of 2010. (g) Represents amortization of intangible assets as a result of the Company’s purchase accounting adjustments from the Company’s merger transaction in 2005 and various acquisitions. (h) Represents the expected tax benefit available to the Company from the accumulated net operating losses of the Concord Trust and Wealth division of LPL Financial LLC that arose prior to the Company’s acquisition of Concord Capital Partners; such benefits were recorded in the third quarter of 2012. LPL Financial Member FINRA/SIPC (i) Represents adjusted Earnings, a non-GAAP measure, divided by weighted-average number of shares outstanding on a fully diluted basis. 34 .
Important factors that could cause or contribute to such differences include: changes in general economic and financial market conditions, including retail investor sentiment; fluctuations in the value of advisory and brokerage assets; fluctuations in levels of net new advisory assets and the related impact on fee revenue; fluctuations in the percentage of mass affluent investors served by the Company, effects of competition in the financial services industry; changes in the number of the Company's financial advisors and institutions, their ability to market effectively financial products and services, and the success of the Company’s initiatives designed to engage them; the Company's strategy in managing program fees; changes in the growth of the Company's fee-based business; finalization and implementation of the Department of Labor’s proposed fiduciary rule; the effect of current, pending and future legislation, regulation and regulatory actions, including disciplinary actions imposed by federal or state securities regulators or self-regulatory organizations; the costs of settling and remediating issues related to pending or future regulatory matters; changes in interest rates and fees payable by banks participating in the Company's cash sweep programs, including the Company's success in negotiating agreements with current or additional counterparties; the performance of third party service providers to which business processes are transitioned from the Company; the Company’s success in negotiating and developing commercial arrangements with third party technology providers that will enable the Company to realize the improvements and efficiencies expected to result from such technology, including with respect to supervision and oversight of advisor activities; the Company’s ability to control operating risks, information technology systems risks and sourcing risks; the Company's success in integrating the operations of acquired businesses; and the other factors set forth in Part I, “Item 1A. Risk Factors” in the Company's 2014 Annual Report on Form 10-K as may be amended or updated in its quarterly reports on Form 10-Q. Except as required by law, the Company specifically disclaims any obligation to update any forward-looking statements as a result of future developments, even if its estimates change, and you should not rely on those statements as representing the Company's views after September 11, 2015. NON-GAAP FINANCIAL MEASURES Adjusted Earnings represent net income before: (a) employee share-based compensation expense, (b) amortization of intangible assets resulting from various acquisitions, (c) debt extinguishment costs, (d) restructuring and conversion costs, (e) equity issuance and related offering costs and (f) other.
Reconciling items are tax effected using the income tax rates in effect for the applicable period, adjusted for any potentially non-deductible amounts. Adjusted Earnings per share represents Adjusted Earnings divided by weighted average outstanding shares on a fully diluted basis. The Company prepares Adjusted Earnings and Adjusted Earnings per share to eliminate the effects of items that it does not consider indicative of its core operating performance.
The Company believes these measures provide investors with greater transparency by helping illustrate the underlying financial and business trends relating to results of operations and financial condition and comparability between current and prior periods. Adjusted EBITDA is defined as EBITDA (net income plus interest expense, income tax expense, depreciation and amortization), further adjusted to exclude certain non-cash charges and other adjustments. The Company presents adjusted EBITDA because the Company considers it a useful financial metric in assessing the Company's operating performance from period to period by excluding certain items that the Company believes are not representative of its core business, such as certain material non-cash items and other adjustments that are outside the control of management. Adjusted earnings, adjusted earnings per share, and adjusted EBITDA are not measures of the Company's financial performance under GAAP and should not be considered as an alternative to net income or earnings per share or any other performance measure derived in accordance with GAAP, or as an alternative to cash flows from operating activities as a measure of profitability or liquidity. In addition, adjusted EBITDA can differ significantly from company to company depending on long-term strategic decisions regarding capital structure, the tax jurisdictions in which companies operate, and capital investments. You can find additional related information, including a reconciliation of such non-GAAP measures for the year ended December 31, 2014 within the Company’s Annual Report, under "Item 7.
Management's Discussion and Analysis of Financial Condition and Results of Operations—How We Evaluate Our Business." A reconciliation of Adjusted Earnings to GAAP measures is also set forth in the Appendix to this presentation. Gross Profit is calculated as net revenues less production expenses. Production expenses consist of the following expense categories from the Company’s consolidated statements of income: (i) commission and advisory and (ii) brokerage, clearing, and exchange. All other expense categories, including depreciation and amortization, are considered general and administrative in nature.
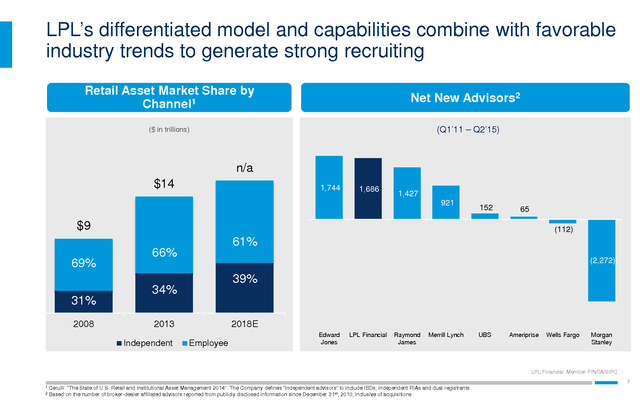
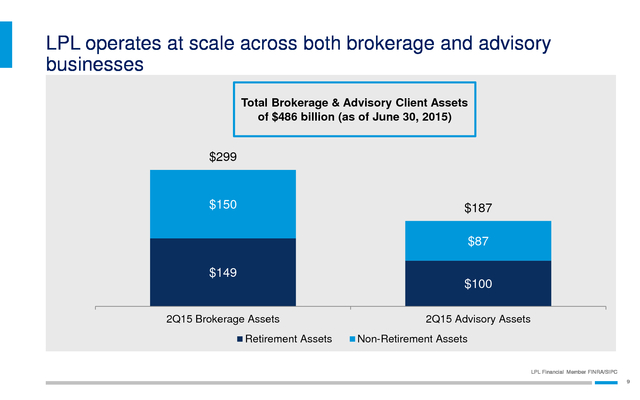
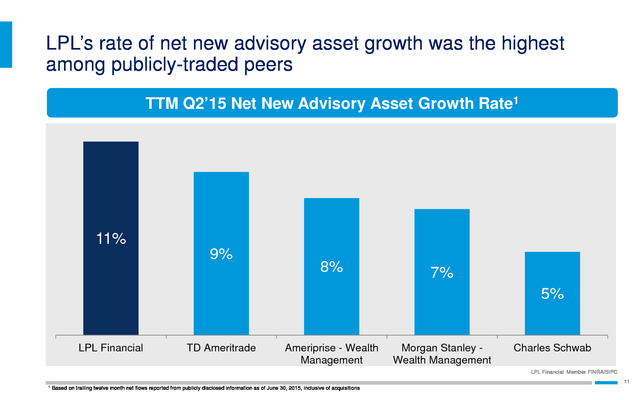
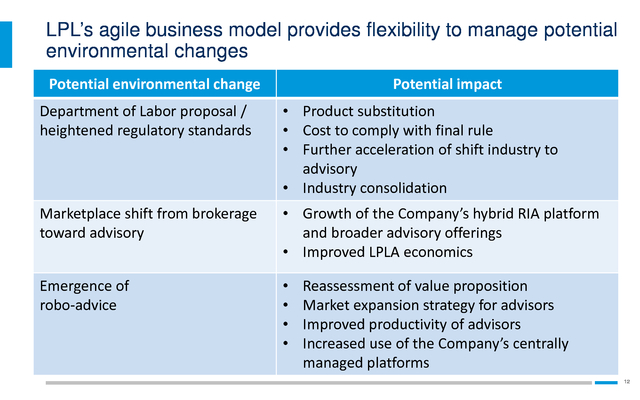
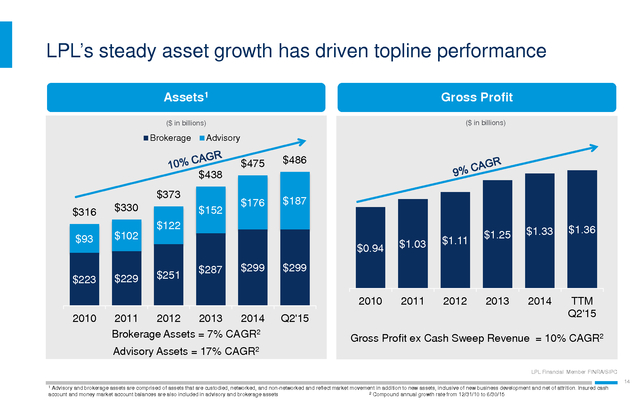
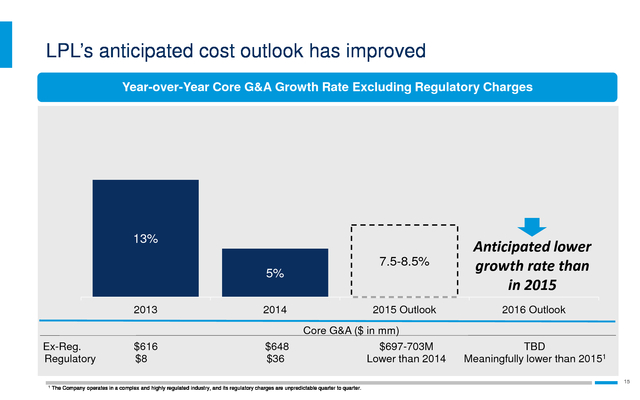
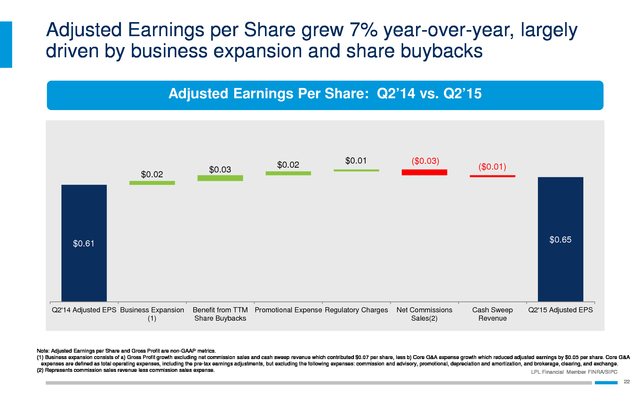
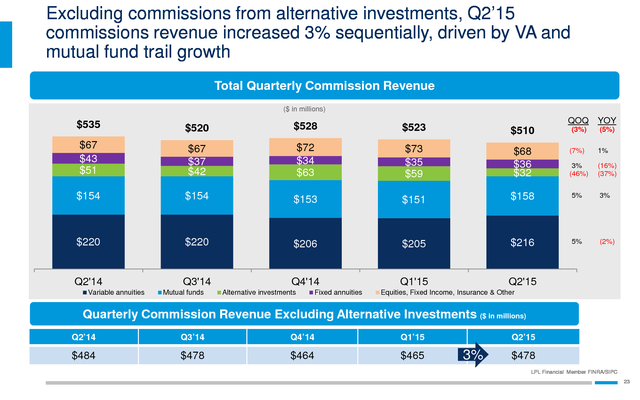
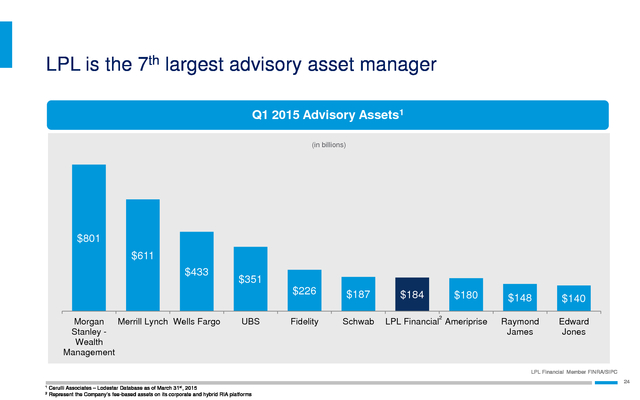
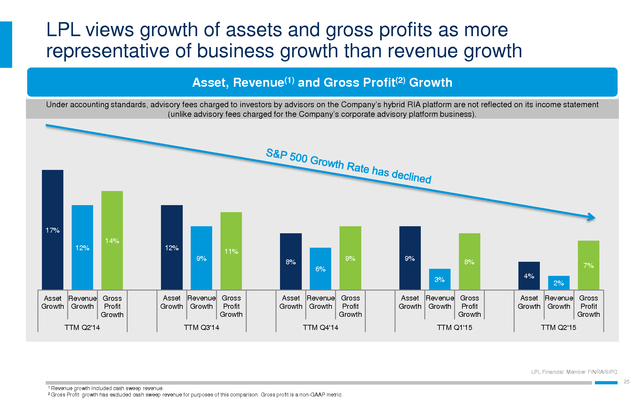
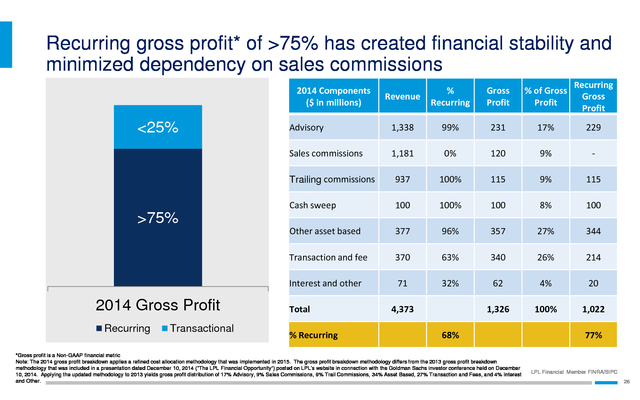
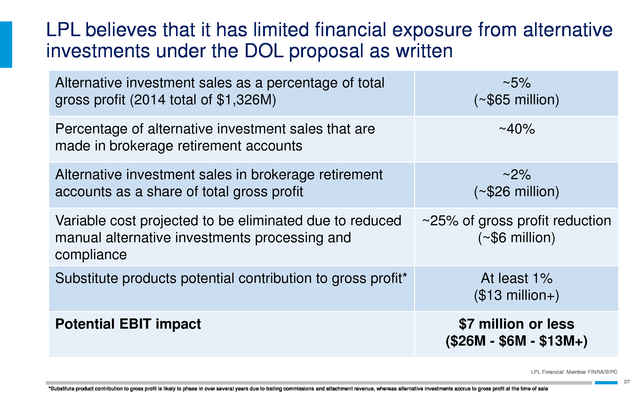
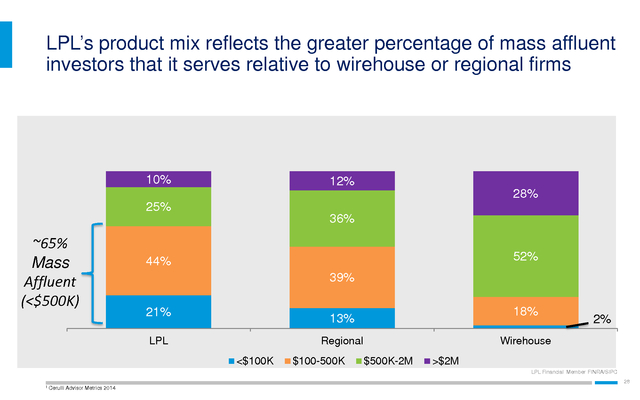
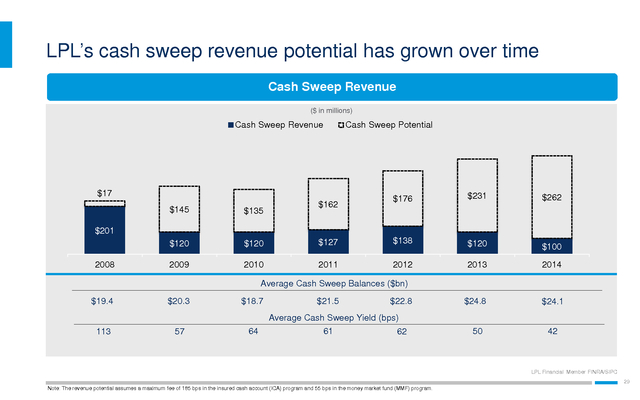
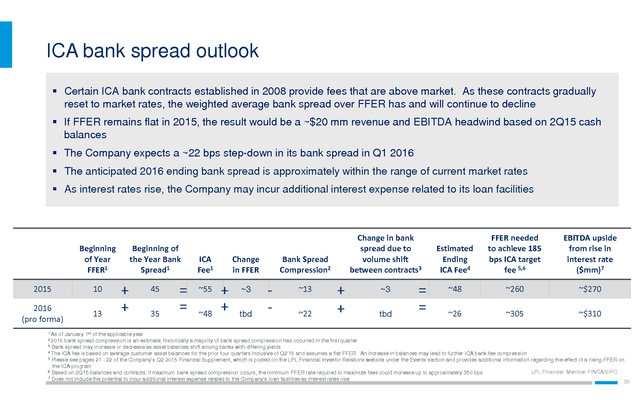
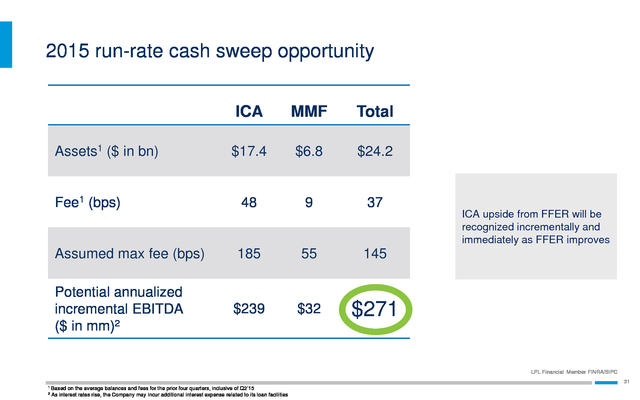
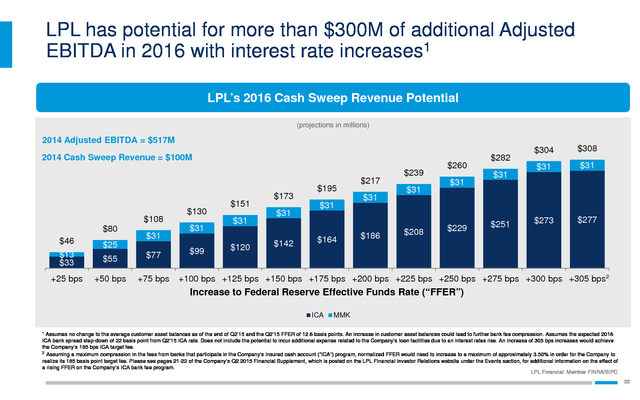
Because the Company’s gross profit amounts do not include any depreciation and amortization expense, the Company considers its gross profit amounts to be non-GAAP measures that may not be comparable to those of others in its industry. LPL Financial Member FINRA/SIPC 2 . Key messages • Differentiated value proposition drives advisor growth • Scale of advisory and brokerage offerings provides flexibility to manage change • Financial performance demonstrates business growth and earnings potential LPL Financial Member FINRA/SIPC 3 . LPL is the leading financial services provider to independent advisors, RIAs, and financial institutions #1 independent broker-dealer for 20 straight years 14,130 2 Focus on chosen markets 1 Independent Advisor Services Over 8,000 advisors $258 billion assets served advisors Institution Services Over 700 banks, credit unions and clearing clients4 $116 billion assets served $606 billion Hybrid RIA Over 350 firms $112 billion assets served in assets3 Retirement Partners Over 40,000 plans $120 billion in assets served5 LPL Financial Member FINRA/SIPC 4 1 2 As of June 30, 2015 Financial Planning magazine 1996-2015 based on total revenue 4 Clearing clients include approximately 4,300 additional advisors affiliated with insurance companies 3 Consists of $486 billion in retails assets and $120 billion in retirement plan assets 5 Retirement plan assets are not custodied by LPL . LPL’s differentiated business model and capabilities drive market share growth LPL Financial market share by headcount1 Differentiated model and capabilities LPL Custodian Employee Independent Model Enables independence 11.3% Superior advisor economics 4.8% Focused business model Capabilities Integrated brokerage and RIA advisory platform Robust technology and service support 4.5% 1.7% Total advisors 2004 Independent advisors 2013 Supports an array of advisor practices LPL Financial Member FINRA/SIPC 5 1 Cerulli Lodestar - Intermediary. The Company defines “independent advisors” to include IBDs, independent RIAs and dual registrants. . LPL’s end-to-end solution attracts and retains independent advisors and institutions End-to-end solution Comprehensive clearing and compliance services Consultative practice management programs #1 Independent research Scalable investment platforms destination for advisors considering a move in 20131 #2 in net new advisor growth since 20102 97% Integrated technology platform production retention3 LPL Financial Member FINRA/SIPC 6 1 2 Cogent 2013 Advisor Migration Trends Based on the number of broker-dealer affiliated advisors reported from publicly disclosed information since 12/31/10 through 6/30/15 3 As of June 30, 2015 . LPL’s differentiated model and capabilities combine with favorable industry trends to generate strong recruiting Retail Asset Market Share by Channel1 Net New Advisors2 (Q1’11 – Q2’15) ($ in trillions) n/a $14 1,744 1,686 1,427 921 152 65 $9 69% 31% 2008 (112) 61% 66% (2,272) 39% 34% 2013 Independent 2018E Employee Edward Jones LPL Financial Raymond James Merrill Lynch UBS Ameriprise Wells Fargo Morgan Stanley LPL Financial Member FINRA/SIPC 7 1 Cerulli: “The State of U.S. Retail and Institutional Asset Management 2014”. The Company defines “independent advisors” to include IBDs, independent RIAs and dual registrants 2 Based on the number of broker-dealer affiliated advisors reported from publicly disclosed information since December 31st, 2010, inclusive of acquisitions . Key messages • Differentiated value proposition drives advisor growth • Scale of advisory and brokerage offerings provides flexibility to manage change • Financial performance demonstrates business growth and earnings potential LPL Financial Member FINRA/SIPC 8 . LPL operates at scale across both brokerage and advisory businesses Total Brokerage & Advisory Client Assets of $486 billion (as of June 30, 2015) $299 $150 $187 $87 $149 $100 2Q15 Brokerage Assets Retirement Assets 2Q15 Advisory Assets Non-Retirement Assets LPL Financial Member FINRA/SIPC 9 . LPL has been building its advisory business for many years and are benefitting from the marketplace trend towards advisory 2000 1990 1991 – LPL Launches its first advisory platform, enabling advisors to build advisory portfolios Mid ‘90s– LPL establishes Advisory Consulting Team, providing advisory-oriented training and support to LPL advisors Today 2010 2004 – LPL launches “centrally managed” platforms, enabling advisors to use 3rd party portfolio managers 2008 – LPL launches Hybrid RIA Platform 2014 – LPL’s 7 advisory offerings serve all levels of wealth, generating industry-leading growth LPL Financial Advisory Business (2014) 90% 38% 62% of advisors licensed for advisory business of client assets were in advisory accounts of gross asset sales1 were advisory LPL Financial Member FINRA/SIPC 10 1 Gross asset sales include advisory offerings, mutual funds, variable annuities, fixed annuities, group annuities, and alternative investments but excludes equity, fixed income, and insurance sales . LPL’s rate of net new advisory asset growth was the highest among publicly-traded peers TTM Q2’15 Net New Advisory Asset Growth Rate1 11% 9% 8% 7% 5% LPL Financial TD Ameritrade Ameriprise - Wealth Management Morgan Stanley Wealth Management Charles Schwab LPL Financial Member FINRA/SIPC 11 1 Based on trailing twelve month net flows reported from publicly disclosed information as of June 30, 2015, inclusive of acquisitions . LPL’s agile business model provides flexibility to manage potential environmental changes Potential environmental change Potential impact Department of Labor proposal / heightened regulatory standards • Product substitution • Cost to comply with final rule • Further acceleration of shift industry to advisory • Industry consolidation Marketplace shift from brokerage toward advisory • Growth of the Company’s hybrid RIA platform and broader advisory offerings • Improved LPLA economics Emergence of robo-advice • • • • Reassessment of value proposition Market expansion strategy for advisors Improved productivity of advisors Increased use of the Company’s centrally managed platforms LPL Financial Member FINRA/SIPC 12 . Key messages • Differentiated value proposition drives advisor growth • Scale of advisory and brokerage offerings provides flexibility to manage change • Financial performance demonstrates business growth and earnings potential LPL Financial Member FINRA/SIPC 13 . LPL’s steady asset growth has driven topline performance Assets1 Gross Profit ($ in billions) ($ in billions) Brokerage Advisory $475 $486 $176 $187 $438 $373 $316 $330 $93 $102 $223 $229 $152 $122 $251 $287 $299 2011 2012 2013 2014 Brokerage Assets = 7% CAGR2 Advisory Assets = 17% $1.03 2010 2010 $0.94 $1.11 2011 2012 $1.25 $1.33 $1.36 2013 2014 TTM Q2'15 $299 Q2'15 Gross Profit ex Cash Sweep Revenue = 10% CAGR2 CAGR2 LPL Financial Member FINRA/SIPC 14 1 Advisory and brokerage assets are comprised of assets that are custodied, networked, and non-networked and reflect market movement in addition to new assets, inclusive of new business development and net of attrition. Insured cash 2 Compound annual growth rate from 12/31/10 to 6/30/15 account and money market account balances are also included in advisory and brokerage assets . LPL’s anticipated cost outlook has improved Year-over-Year Core G&A Growth Rate Excluding Regulatory Charges 13% 7.5-8.5% Anticipated lower growth rate than in 2015 2015 Outlook 2016 Outlook 5% 2013 Ex-Reg. Regulatory $616 $8 2014 $648 $36 Core G&A ($ in mm) $697-703M Lower than 2014 TBD Meaningfully lower than 20151 LPL Financial Member FINRA/SIPC 15 1 The Company operates in a complex and highly regulated industry, and its regulatory charges are unpredictable quarter to quarter. . Latent earnings potential has existed in the Company’s business model from rising interest rates Adjusted Earnings Per Share Adjusted Earnings per Share 1 Cash Sweep Potential $3.72 $3.53 $2.83 $2.34 $0.72 $1.09 $1.28 $2.44 $2.67 $2.44 2013 2014 $0.80 $0.63 $1.71 2010 $1.95 $2.03 2011 2012 LPL Financial Member FINRA/SIPC 1 16 Demonstrates the potential benefit that rising interest rates would have had on cash sweep revenue, using applicable quarterly end of period average asset balances and cash sweep yields, and assuming a maximum fee of 185 bps in the Company’s insured cash account (ICA) program and 55 bps in its money market fund (MMF) program. Analysis includes the impact that rising interest rates would have had on the Company’s floating rate term loans. Adjusted Earnings per Share is a non-GAAP metric. . LPL’s capital-light model has supported shareholder capital returns Return of Capital Fully Diluted Shares (in millions) Share Repurchases (in millions) Dividends $448 $371 $249 $287 $96 $68 $164 112 111 106 $89 $199 $219 $275 102 98 $116 $89 2011 $48 2012 2013 2014 YTD Q2'15 2011 2012 2013 2014 YTD Q2'15 Return of capital per share $0.79 $4.04 $2.71 $3.65 2012 includes a special dividend of $223 million $1.68 LPL Financial Member FINRA/SIPC 17 . LPL’s operating principles that guide toward long-term shareholder value creation 1 Enable the delivery of objective advice, which the Company believes is the best solution for retail investors, through an unmatched independent model 2 Provide choice by offering both brokerage and advisory solutions and an open architecture platform with products that meet the diverse financial needs of American investors 3 Drive differentiated value for the Company’s advisors by offering a comprehensive, integrated set of services that serve investors effectively and efficiently 4 Protect investor interests by developing and maintaining leading compliance and risk management capabilities 5 Prioritize reinvestment to drive long-term business outcomes, recognizing that, at times, longer-term investments must be prioritized ahead of maximizing short-term results 6 Allocate capital to create the highest long-term shareholder value; reinvesting in the business where the Company can earn attractive long-term returns and returning surplus capital to shareholders 7 Make decisions that create long-term value for all stakeholders in the Company’s community – employees, advisors, investors, business partners, and shareholders Long-term shareholder value LPL Financial Member FINRA/SIPC 18 . In 2015, LPL remains focused on executing core opportunities within its existing business model Adding advisors Supporting the shift to advisory where appropriate Retaining upside on interest rates Positioning cost structure to enter normalized conditions Remaining good financial stewards of our investors’ capital LPL Financial Member FINRA/SIPC 19 . 3Q15 LPL Financial mid-quarter operational update • This quarter has had increased market volatility and equity market price declines of nearly 10% • LPL’s business is behaving as it typically does during periods of market uncertainty and reduced asset prices • Transaction volumes have increased • Cash balances have grown • Asset-based revenue streams have declined with lower asset prices • Investor engagement has been more focused on reassurance and repositioning versus new sales • Reduced advisor movement under these market conditions (slower recruiting, but improved retention) • Lower producing advisors have tended to exit the industry • LPL has also continued to see growth in advisory sales and cyclically slower brokerage sales • The company continues to be diligent about its expense management • Finally, LPL believes that it is close to resolving the most significant regulatory matters that it has been working on LPL Financial Member FINRA/SIPC 20 . APPENDIX LPL Financial Member FINRA/SIPC 21 . Adjusted Earnings per Share grew 7% year-over-year, largely driven by business expansion and share buybacks Adjusted Earnings Per Share: Q2’14 vs. Q2’15 $0.02 $0.03 $0.02 $0.01 ($0.03) ($0.01) $0.65 $0.61 Q2'14 Adjusted EPS Business Expansion (1) Benefit from TTM Promotional Expense Regulatory Charges Share Buybacks Net Commissions Sales(2) Cash Sweep Revenue Q2'15 Adjusted EPS Note: Adjusted Earnings per Share and Gross Profit are non-GAAP metrics. (1) Business expansion consists of a) Gross Profit growth excluding net commission sales and cash sweep revenue which contributed $0.07 per share, less b) Core G&A expense growth which reduced adjusted earnings by $0.05 per share. Core G&A expenses are defined as total operating expenses, including the pre-tax earnings adjustments, but excluding the following expenses: commission and advisory, promotional, depreciation and amortization, and brokerage, clearing, and exchange. (2) Represents commission sales revenue less commission sales expense. LPL Financial Member FINRA/SIPC 22 . Excluding commissions from alternative investments, Q2’15 commissions revenue increased 3% sequentially, driven by VA and mutual fund trail growth Total Quarterly Commission Revenue ($ in millions) QOQ YOY (3%) (5%) $535 $520 $528 $523 $510 $67 $43 $51 $67 $37 $42 $72 $34 $63 $73 $35 $59 $68 $36 $32 (7%) 1% 3% (46%) (16%) (37%) $154 $154 $153 $151 $158 5% 3% $220 $220 $206 $205 $216 5% (2%) Q1'15 Q2'15 Q2'14 Variable annuities Q3'14 Mutual funds Q4'14 Alternative investments Fixed annuities Equities, Fixed Income, Insurance & Other Quarterly Commission Revenue Excluding Alternative Investments ($ in millions) Q2’14 Q3’14 Q4’14 Q1’15 $484 $478 $464 $465 Q2’15 3% $478 LPL Financial Member FINRA/SIPC 23 . LPL is the 7th largest advisory asset manager Q1 2015 Advisory Assets1 (in billions) $801 $611 $433 $351 $226 Morgan Merrill Lynch Wells Fargo Stanley Wealth Management UBS $187 Fidelity Schwab $184 $180 2 LPL Financial Ameriprise $148 $140 Raymond James Edward Jones LPL Financial Member FINRA/SIPC 24 1 Cerulli Associates – Lodestar Database as of March 31st, 2015 2 Represent the Company’s fee-based assets on its corporate and hybrid RIA platforms . LPL views growth of assets and gross profits as more representative of business growth than revenue growth Asset, Revenue(1) and Gross Profit(2) Growth Under accounting standards, advisory fees charged to investors by advisors on the Company’s hybrid RIA platform are not reflected on its income statement (unlike advisory fees charged for the Company’s corporate advisory platform business). 17% 14% 12% 12% 11% 9% 9% 8% 9% 8% 7% 6% 3% Asset Revenue Gross Growth Growth Profit Growth Asset Revenue Gross Growth Growth Profit Growth Asset Revenue Gross Growth Growth Profit Growth TTM Q2'14 TTM Q3'14 TTM Q4'14 Asset Revenue Gross Growth Growth Profit Growth TTM Q1'15 4% 2% Asset Revenue Gross Growth Growth Profit Growth TTM Q2'15 LPL Financial Member FINRA/SIPC 25 1 Revenue growth included cash sweep revenue. 2 Gross Profit growth has excluded cash sweep revenue for purposes of this comparison. Gross profit is a non-GAAP metric. . Recurring gross profit* of >75% has created financial stability and minimized dependency on sales commissions Revenue % Recurring Gross Profit % of Gross Profit Recurring Gross Profit Advisory 1,338 99% 231 17% 229 Sales commissions 1,181 0% 120 9% - Trailing commissions 937 100% 115 9% 115 Cash sweep 100 100% 100 8% 100 Other asset based 377 96% 357 27% 344 Transaction and fee 370 63% 340 26% 214 Interest and other 71 32% 62 4% 20 1,326 100% 1,022 2014 Components ($ in millions) <25% >75% 2014 Gross Profit Recurring Transactional Total % Recurring 4,373 68% *Gross profit is a Non-GAAP financial metric Note: The 2014 gross profit breakdown applies a refined cost allocation methodology that was implemented in 2015. The gross profit breakdown methodology differs from the 2013 gross profit breakdown methodology that was included in a presentation dated December 10, 2014 (“The LPL Financial Opportunity”) posted on LPL’s website in connection with the Goldman Sachs investor conference held on December 10, 2014. Applying the updated methodology to 2013 yields gross profit distribution of 17% Advisory, 9% Sales Commissions, 9% Trail Commissions, 34% Asset Based, 27% Transaction and Fees, and 4% Interest and Other. 77% LPL Financial Member FINRA/SIPC 26 . LPL believes that it has limited financial exposure from alternative investments under the DOL proposal as written Alternative investment sales as a percentage of total gross profit (2014 total of $1,326M) ~5% (~$65 million) Percentage of alternative investment sales that are made in brokerage retirement accounts ~40% Alternative investment sales in brokerage retirement accounts as a share of total gross profit ~2% (~$26 million) Variable cost projected to be eliminated due to reduced manual alternative investments processing and compliance ~25% of gross profit reduction (~$6 million) Substitute products potential contribution to gross profit* At least 1% ($13 million+) Potential EBIT impact $7 million or less ($26M - $6M - $13M+) LPL Financial Member FINRA/SIPC 27 *Substitute product contribution to gross profit is likely to phase in over several years due to trailing commissions and attachment revenue, whereas alternative investments accrue to gross profit at the time of sale . LPL’s product mix reflects the greater percentage of mass affluent investors that it serves relative to wirehouse or regional firms 10% 12% 28% 25% 36% ~65% Mass Affluent (<$500K) 52% 44% 39% 21% 18% 13% LPL Regional <$100K $100-500K 2% Wirehouse $500K-2M >$2M LPL Financial Member FINRA/SIPC 28 1 Cerulli Advisor Metrics 2014 . LPL’s cash sweep revenue potential has grown over time Cash Sweep Revenue ($ in millions) Cash Sweep Revenue Cash Sweep Potential $17 $162 $176 $231 $262 $145 $135 $120 $120 $127 $138 $120 $100 2009 2010 2011 2012 2013 2014 $24.8 $24.1 50 42 $201 2008 Average Cash Sweep Balances ($bn) $19.4 $20.3 $18.7 57 64 $21.5 $22.8 Average Cash Sweep Yield (bps) 113 61 62 LPL Financial Member FINRA/SIPC 29 Note: The revenue potential assumes a maximum fee of 185 bps in the insured cash account (ICA) program and 55 bps in the money market fund (MMF) program. . ICA bank spread outlook  Certain ICA bank contracts established in 2008 provide fees that are above market. As these contracts gradually reset to market rates, the weighted average bank spread over FFER has and will continue to decline  If FFER remains flat in 2015, the result would be a ~$20 mm revenue and EBITDA headwind based on 2Q15 cash balances  The Company expects a ~22 bps step-down in its bank spread in Q1 2016  The anticipated 2016 ending bank spread is approximately within the range of current market rates  As interest rates rise, the Company may incur additional interest expense related to its loan facilities Beginning of Year FFER1 2015 10 2016 (pro forma) 13 1 As Beginning of the Year Bank Spread1 + + 45 35 = = ICA Fee1 ~55 ~48 Change in FFER + + ~3 tbd Change in bank spread due to volume shift between contracts3 Bank Spread Compression2 - ~13 ~22 + + ~3 tbd = = Estimated Ending ICA Fee4 FFER needed to achieve 185 bps ICA target fee 5,6 EBITDA upside from rise in interest rate ($mm)7 ~48 ~260 ~$270 ~26 ~305 ~$310 of January 1st of the applicable year bank spread compression is an estimate; historically a majority of bank spread compression has occurred in the first quarter Bank spread may increase or decrease as asset balances shift among banks with differing yields 4 The ICA fee is based on average customer asset balances for the prior four quarters inclusive of Q2’15 and assumes a flat FFER. An increase in balances may lead to further ICA bank fee compression 5 Please see pages 21 - 22 of the Company’s Q2 2015 Financial Supplement, which is posted on the LPL Financial Investor Relations website under the Events section and provides additional information regarding the effect of a rising FFER on the ICA program 6 Based on 2Q15 balances and contracts, if maximum bank spread compression occurs, the minimum FFER rate required to maximize fees could increase up to approximately 350 bps LPL Financial Member FINRA/SIPC 7 Does not include the potential to incur additional interest expense related to the Company’s loan facilities as interest rates rise 30 2 2016 3 . 2015 run-rate cash sweep opportunity ICA MMF Total $17.4 $6.8 $24.2 Fee1 (bps) 48 9 37 Assumed max fee (bps) 185 55 145 Potential annualized incremental EBITDA ($ in mm)2 $239 $32 $271 Assets1 ($ in bn) ICA upside from FFER will be recognized incrementally and immediately as FFER improves LPL Financial Member FINRA/SIPC 31 1 Based on the average balances and fees for the prior four quarters, inclusive of Q2’15 2 As interest rates rise, the Company may incur additional interest expense related to its loan facilities . LPL has potential for more than $300M of additional Adjusted EBITDA in 2016 with interest rate increases1 LPL’s 2016 Cash Sweep Revenue Potential (projections in millions) 2014 Adjusted EBITDA = $517M 2014 Cash Sweep Revenue = $100M $108 $80 $31 $46 $25 $13 $33 $55 $77 +25 bps +50 bps +75 bps $130 $31 $99 $151 $31 $120 $173 $31 $142 $195 $31 $164 $217 $31 $186 $239 $31 $208 $260 $31 $229 $282 $31 $251 $304 $308 $31 $31 $273 $277 +100 bps +125 bps +150 bps +175 bps +200 bps +225 bps +250 bps +275 bps +300 bps +305 bps2 Increase to Federal Reserve Effective Funds Rate (“FFER”) ICA MMK 1 Assumes no change to the average customer asset balances as of the end of Q2’15 and the Q2’15 FFER of 12.6 basis points. An increase in customer asset balances could lead to further bank fee compression. Assumes the expected 2016 ICA bank spread step-down of 22 basis point from Q2’15 ICA rate. Does not include the potential to incur additional expense related to the Company’s loan facilities due to an interest rates rise.
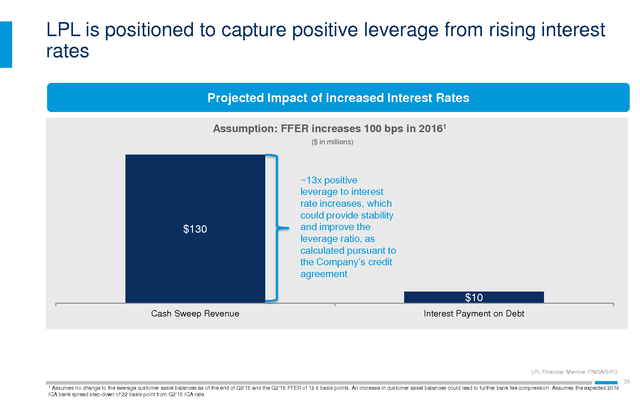
An increase of 305 bps increases would achieve the Company’s 185 bps ICA target fee. 2 Assuming a maximum compression in the fees from banks that participate in the Company's insured cash account (“ICA”) program, normalized FFER would need to increase to a maximum of approximately 3.50% in order for the Company to realize its 185 basis point target fee. Please see pages 21-22 of the Company’s Q2 2015 Financial Supplement, which is posted on the LPL Financial Investor Relations website under the Events section, for additional information on the effect of a rising FFER on the Company’s ICA bank fee program. LPL Financial Member FINRA/SIPC 32 . LPL is positioned to capture positive leverage from rising interest rates Projected Impact of Increased Interest Rates Assumption: FFER increases 100 bps in 20161 ($ in millions) $130 ~13x positive leverage to interest rate increases, which could provide stability and improve the leverage ratio, as calculated pursuant to the Company’s credit agreement $10 Cash Sweep Revenue Interest Payment on Debt LPL Financial Member FINRA/SIPC 33 1 Assumes no change to the average customer asset balances as of the end of Q2’15 and the Q2’15 FFER of 12.6 basis points. An increase in customer asset balances could lead to further bank fee compression. Assumes the expected 2016 ICA bank spread step-down of 22 basis point from Q2’15 ICA rate. . Adjusted Earnings per share reconciliation The reconciliation from net income to Adjusted Earnings and Adjusted Earnings per share, a nonGAAP measure, for the periods presented is as follows (in thousands): TTM Q2'15 2014 Net income (loss) $182,737 $178,043 After-Tax: EBITDA Adjustments(a) Employee share-based compensation expense(b) Acquisition and integration related expenses(c) Restructuring and conversion costs(d) Debt amendment and extinguishment costs(e) Equity issuance and related offering costs(f) Other Total EBITDA Adjustments Amortization of intangible assets(a)(g) Acquisition related benefit for a net operating loss carry-forward(h) Adjusted Earnings Adjusted Earnings per share(i) Weighted-average shares outstanding - diluted 15,391 (263) 16,297 2,678 677 34,780 23,718 $241,235 $2.43 99,274 14,175 366 21,357 2,678 7,137 45,713 23,865 $247,621 $2.44 101,651 2013 (unaudited) $181,857 11,109 10,919 19,011 4,916 6,926 52,881 24,067 $258,805 $2.44 106,003 2012 2011 2010 $151,918 $170,382 ($56,862) 13,161 11,106 3,792 10,274 4,262 7,384 49,979 24,397 (1,265) $225,029 $2.03 111,060 11,472 (2,354) 13,606 1,272 156 24,152 24,051 $218,585 $1.95 112,119 8,400 7,638 13,877 23,477 149,568 91 203,051 26,531 $172,720 $1.71 100,933 (a) Generally, EBITDA Adjustments and amortization of intangible assets have been tax effected using a federal rate of 35.0% and the applicable effective state rate which was 3.30%, net of the federal tax benefit, for the periods presented, except as noted below. (b) Represents share-based compensation expense for equity awards granted to employees, officers and directors. Such awards are measured based on the grant date fair value and recognized over the requisite service period of the individual awards, which generally equals the vesting period. (c) Represents acquisition and integration costs resulting from various acquisitions, including changes in the estimated fair value of future payments, or contingent consideration, required to be made to former shareholders of certain acquired entities. (d) Represents organizational restructuring charges, conversion and other related costs incurred resulting from the expansion of the Company’s Service Value Commitment, the 2011 consolidation of UVEST Financial Services Group, Inc. and the 2009 consolidation of Mutual Service Corporation, Associated Financial Group, Inc., Associated Planners Investment Advisory, Inc. and Waterstone Financial Group. (e) Represents expenses incurred resulting from the early extinguishment, amending, restating, and repayment of amounts outstanding under the Company’s credit agreement. (f) Represents equity issuance and offering costs for the Company’s IPO, which was completed in the fourth quarter of 2010. (g) Represents amortization of intangible assets as a result of the Company’s purchase accounting adjustments from the Company’s merger transaction in 2005 and various acquisitions. (h) Represents the expected tax benefit available to the Company from the accumulated net operating losses of the Concord Trust and Wealth division of LPL Financial LLC that arose prior to the Company’s acquisition of Concord Capital Partners; such benefits were recorded in the third quarter of 2012. LPL Financial Member FINRA/SIPC (i) Represents adjusted Earnings, a non-GAAP measure, divided by weighted-average number of shares outstanding on a fully diluted basis. 34 .


