LPL Financial Announces Fourth Quarter and Full Year 2015 Results – February 11, 2016
LPL Financial


Description
Exhibit 99.1
Investor Relations - Chris Koegel, (617) 897-4574
Media Relations - Brett Weinberg, (980) 321-1904
investor.lpl.com/contactus.cfm
For Immediate Release
LPL Financial Announces Fourth Quarter and Full Year 2015 Results
GAAP Results
• Q4 2015 net income of $27 million, or $0.28 per share; FY 2015 net income of $169 million, or $1.74 per share
• Q4 2015 pre-tax income of $45 million; FY 2015 pre-tax income of $283 million
Non-GAAP Results
• Q4 2015 Adjusted Earnings of $36 million, or $0.37 per share; FY 2015 Adjusted Earnings of $215 million, or
$2.22 per share; includes non-recurring cost of $0.04 per share
• Q4 2015 Adjusted EBITDA of $100 million; FY 2015 Adjusted EBITDA of $489 million
• Q4 2015 gross profit of $322 million; FY 2015 gross profit of $1,358 million
Key Metrics
•
•
•
End of period total brokerage and advisory assets of $476 billion
Q4 2015 net new advisory assets of $3.1 billion; FY 2015 net new advisory assets of $16.7 billion
End of period cash sweep balances of $29.0 billion
Capital Management
• Q4 2015 share repurchases of $250 million for more than 5.6 million shares; FY 2015 share repurchases of
$391 million for more than 8.9 million shares
• Q1 2016 to date share repurchases of $25 million for more than 630 thousand shares
• Q4 2015 dividends of $24 million; FY 2015 dividends of $96 million
SAN DIEGO - February 11, 2016 — LPL Financial Holdings Inc. (NASDAQ: LPLA) (the "Company") today
announced results for its fourth quarter ended December 31, 2015, reporting net income of $27 million, or $0.28 per
share. This compares with $41 million, or $0.43 per share, in the prior quarter and $49 million, or $0.49 per share in
the fourth quarter of 2014. Fourth quarter 2015 adjusted earnings totaled $36 million, or $0.37 per share.
This compares to $53 million, or $0.55 per share, in the prior quarter and $66 million, or $0.66 per share, in the fourth quarter of 2014. “The market environment was volatile and challenging in 2015, particularly for brokerage sales” said Mark Casady, chairman and CEO. “So we focused on bringing assets onto our platform and executing on our operational, efficiency, and capital plans.” Casady continued, “As we move into 2016, market volatility has only increased, and we expect continued pressure on brokerage sales. That being said, we believe our scale and stability give us an advantage in markets like this. We remain focused on growth, delivering on our expense and capital plans, and managing the DOL rule transition.” “The market environment was tough in the fourth quarter, but we made progress on expenses and capital,” said Matt Audette, chief financial officer.
“We managed our expenses slightly lower than our outlook while executing several efficiency initiatives to position us for lower G&A growth in 2016.” Audette continued, “We also completed our debt transaction and the first $250 million of our $500 million share repurchase plan in the fourth quarter. In the first quarter of 2016 to date, we have repurchased another $25 million of our shares. Given the volatile start to the year, we will be flexible and dynamic going forward in our expense and capital plans.” 1 .
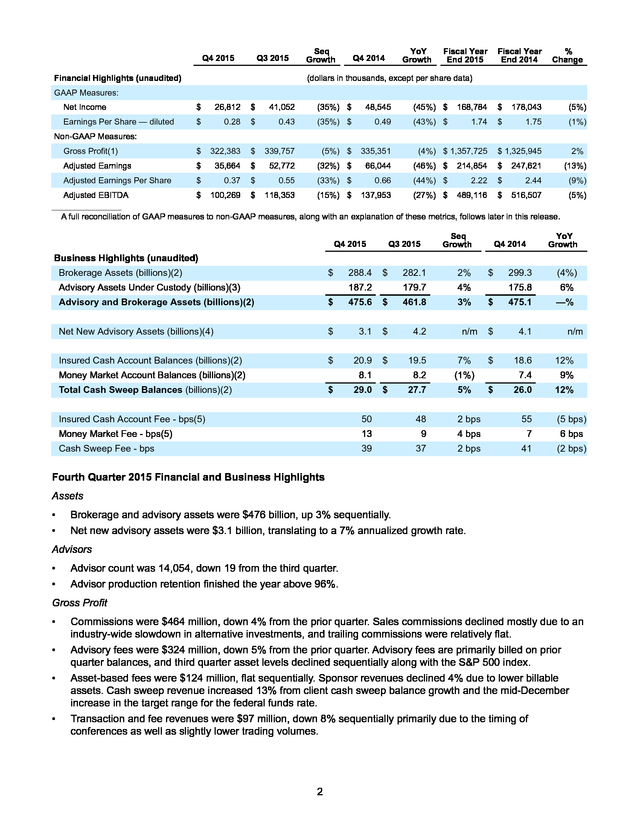
Q4 2015 Q3 2015 Financial Highlights (unaudited) Seq Growth YoY Growth Q4 2014 Fiscal Year End 2015 Fiscal Year End 2014 % Change (dollars in thousands, except per share data) GAAP Measures: Net Income $ 26,812 $ 41,052 (35%) $ 48,545 (45%) $ 168,784 $ 178,043 (5%) Earnings Per Share — diluted $ 0.28 $ 0.43 (35%) $ 0.49 (43%) $ 1.74 $ 1.75 (1%) Gross Profit(1) $ 322,383 $ 339,757 (5%) $ 335,351 Adjusted Earnings $ 35,664 $ 52,772 (32%) $ 66,044 (46%) $ 214,854 $ 247,621 (13%) Adjusted Earnings Per Share $ 0.37 $ 0.55 (33%) $ 0.66 (44%) $ 2.22 $ 2.44 (9%) Adjusted EBITDA $ 100,269 $ 118,353 (15%) $ 137,953 (27%) $ 489,116 $ 516,507 (5%) Non-GAAP Measures: (4%) $ 1,357,725 $ 1,325,945 2% ____________________ A full reconciliation of GAAP measures to non-GAAP measures, along with an explanation of these metrics, follows later in this release. Q4 2015 Seq Growth Q3 2015 YoY Growth Q4 2014 Business Highlights (unaudited) Brokerage Assets (billions)(2) $ Advisory Assets Under Custody (billions)(3) 288.4 $ 187.2 282.1 2% 179.7 4% Advisory and Brokerage Assets (billions)(2) $ 475.6 $ 461.8 3% Net New Advisory Assets (billions)(4) $ 3.1 $ 4.2 Insured Cash Account Balances (billions)(2) $ 20.9 $ 19.5 7% 8.2 (1%) $ 29.0 $ 27.7 5% $ Money Market Account Balances (billions)(2) 8.1 Total Cash Sweep Balances (billions)(2) Insured Cash Account Fee - bps(5) 50 Money Market Fee - bps(5) Cash Sweep Fee - bps n/m 299.3 (4%) 175.8 6% $ 475.1 —% $ 4.1 $ 18.6 7.4 9% $ 26.0 12% 55 n/m 12% 48 2 bps (5 bps) 13 9 4 bps 7 6 bps 39 37 2 bps 41 (2 bps) Fourth Quarter 2015 Financial and Business Highlights Assets • • Brokerage and advisory assets were $476 billion, up 3% sequentially. Net new advisory assets were $3.1 billion, translating to a 7% annualized growth rate. Advisors • • Advisor count was 14,054, down 19 from the third quarter. Advisor production retention finished the year above 96%. Gross Profit • • • • Commissions were $464 million, down 4% from the prior quarter. Sales commissions declined mostly due to an industry-wide slowdown in alternative investments, and trailing commissions were relatively flat. Advisory fees were $324 million, down 5% from the prior quarter. Advisory fees are primarily billed on prior quarter balances, and third quarter asset levels declined sequentially along with the S&P 500 index. Asset-based fees were $124 million, flat sequentially. Sponsor revenues declined 4% due to lower billable assets.
Cash sweep revenue increased 13% from client cash sweep balance growth and the mid-December increase in the target range for the federal funds rate. Transaction and fee revenues were $97 million, down 8% sequentially primarily due to the timing of conferences as well as slightly lower trading volumes. 2 . Expenses • • • • • Core G&A expenses were $179 million, up $8 million sequentially. $4 million of this increase was due to nonrecurring costs, which were mostly severance. The remaining increase was primarily due to annual disclosures and investments in service and technology offset by lower performance-based compensation. For 2015, core G&A expenses were $695 million, below LPL’s expected range of $697 to $703 million. Promotional expenses were $35 million, down $7 million sequentially.
Conference expenses declined $13 million sequentially while increased transition assistance and year-end marketing expenses added $6 million. Regulatory-related charges, which include the cost of restitution and remediation of previously settled regulatory matters, were $8 million, flat sequentially. For 2015, regulatory related expenses totaled $34 million, down $2 million from 2014. Depreciation and amortization of intangibles was $32 million, up $5 million sequentially mostly due to nonrecurring real estate consolidation. Interest expense was $18 million, up $5 million sequentially following LPL’s November debt transaction. Adjusted Earnings • • • Adjusted Earnings were $36 million, or $0.37 per share. These results included $0.04 per share of nonrecurring costs totaling $7 million of pre-tax expense. The non-recurring costs included $4 million of non-recurring core G&A that was primarily related to severance for role eliminations, and $3 million of non-recurring depreciation for real estate consolidation. Historically, these non-recurring costs would have been adjusted out of Adjusted Earnings. Capital Management • • • • • • Completed a $700 million debt transaction on November 20, 2015 and used $150 million to fully pay off the Company's revolving credit facility.
At the end of the fourth quarter, net debt as defined in the Company's credit agreement was $1.9 billion(6), resulting in a leverage ratio of 3.8 times. This compares to a covenant maximum leverage ratio of 5 times. Generated EBITDA as defined in the credit agreement of $111 million in the fourth quarter and $509 million over the trailing twelve months. Completed a $250 million accelerated share repurchase plan on December 15, 2015 - purchasing more than 5.6 million shares at an average price of $44.46. In the first quarter 2016 to date, the Company purchased more than 630,000 additional shares for $25 million with an average price of $39.41. Paid a dividend of $24 million on November 24, 2015. Capital expenditures were $21 million, up $1 million sequentially. The majority of capital expenditures were for technology and for the construction of the Company's new campus in Fort Mill, South Carolina. Conference Call and Additional Information The Company will hold a conference call to discuss its results at 5:00 p.m.
EDT on Thursday, February 11, 2016. The conference call can be accessed by dialing either 877-677-9122 (domestic) or 708-290-1401 (international) and entering passcode 9969864. For additional information, please visit the Company's website to access the Q4 2015 Financial Supplement. The conference call will also be webcast simultaneously on the Investor Relations section of the Company's website (www.lpl.com), where a replay of the call will also be available following the live webcast. A telephonic replay will be available shortly after the call and can be accessed by dialing 855-859-2056 (domestic) or 404-537-3406 (international) and entering passcode 9969864.
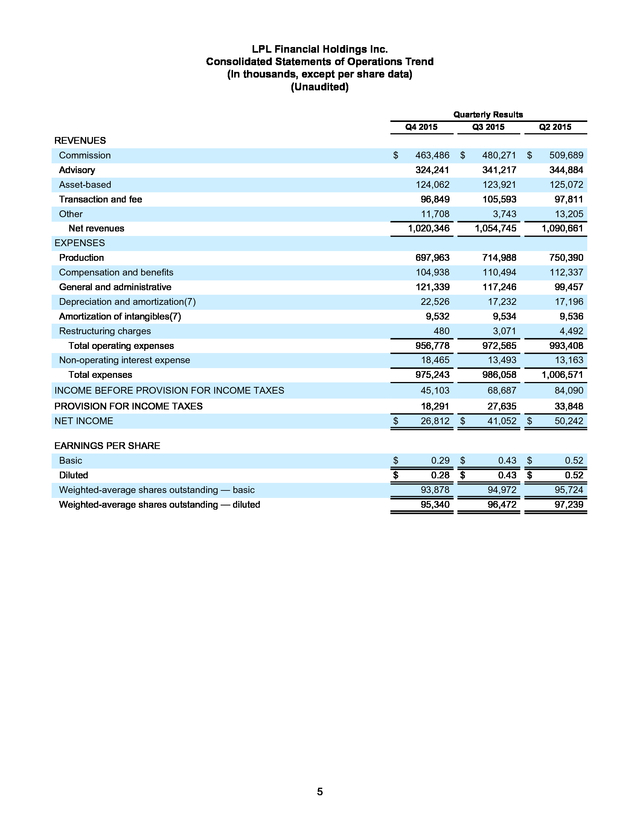
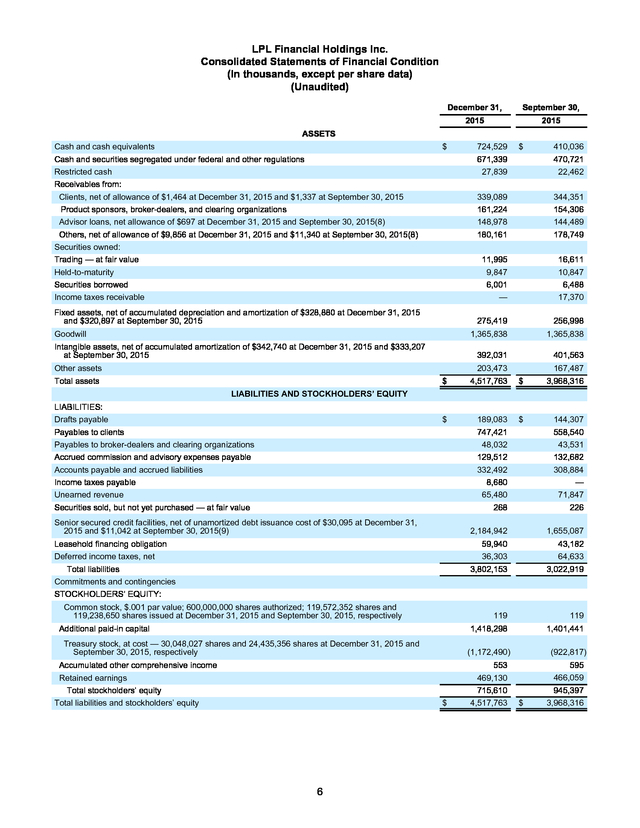
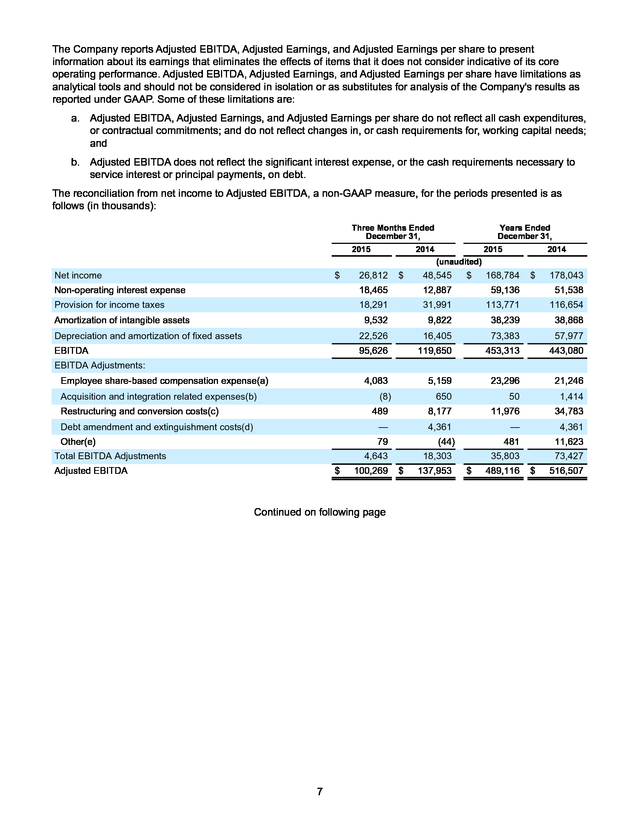
The telephonic replay will be available until 11:59 p.m. EST on February 18, 2016. 3 . LPL Financial Holdings Inc. Consolidated Statements of Operations (In thousands, except per share data) (Unaudited) Three Months Ended December 31, 2015 2014 Years Ended December 31, % Change 2015 2014 % Change Revenues Commission $ 2,118,494 (7)% Advisory $ 324,241 339,943 (5)% 1,352,454 1,337,959 1% Asset-based 124,062 122,101 2% 493,687 476,595 4% 96,849 93,537 4% 401,948 369,821 9% Transaction and fee Other 463,486 $ 528,355 (12)% $ 1,976,845 11,708 20,332 (42)% 50,120 70,793 (29)% 1,020,346 1,104,268 (8)% 4,275,054 4,373,662 (2)% Production 697,963 768,917 (9)% 2,917,329 3,047,717 (4)% Compensation and benefits 104,938 104,370 1% 440,049 421,829 4% General and administrative 121,339 99,209 22 % 452,396 422,441 7% 22,526 16,405 37 % 73,383 57,977 27 % 9,532 9,822 (3)% 38,239 38,868 (2)% 480 8,179 (94)% 11,967 34,652 (65)% 956,778 1,006,902 (5)% 3,933,363 4,023,484 (2)% 18,465 12,887 43 % 59,136 51,538 15 % Net revenues Expenses Depreciation and amortization(7) Amortization of intangibles(7) Restructuring charges Total operating expenses Non-operating interest expense Loss on extinguishment of debt — 3,943 — 3,943 975,243 1,023,732 (5)% 3,992,499 4,078,965 (2)% Income before provision for income taxes 45,103 80,536 (44)% 282,555 294,697 (4)% Provision for income taxes Net income $ 18,291 26,812 $ 31,991 48,545 (43)% (45)% $ 113,771 168,784 $ 116,654 178,043 (2)% (5)% Basic $ 0.29 $ 0.50 (42)% $ 1.77 $ 1.78 (1)% Diluted $ 0.28 $ 0.49 (43)% $ 1.74 $ 1.75 (1)% Total expenses n/m n/m Earnings per share Weighted-average shares outstanding — basic 93,878 97,853 (4)% 95,273 99,847 (5)% Weighted-average shares outstanding — diluted 95,340 99,469 (4)% 96,786 101,651 (5)% 4 . LPL Financial Holdings Inc. Consolidated Statements of Operations Trend (In thousands, except per share data) (Unaudited) Q4 2015 Quarterly Results Q3 2015 Q2 2015 REVENUES Commission $ 463,486 $ 480,271 $ 509,689 Advisory 324,241 341,217 344,884 Asset-based 124,062 123,921 125,072 Transaction and fee 96,849 105,593 97,811 Other 11,708 3,743 13,205 1,020,346 1,054,745 1,090,661 Production 697,963 714,988 750,390 Compensation and benefits 104,938 110,494 112,337 General and administrative 121,339 117,246 99,457 22,526 17,232 17,196 9,532 9,534 9,536 480 3,071 4,492 956,778 972,565 993,408 18,465 13,493 13,163 975,243 986,058 1,006,571 INCOME BEFORE PROVISION FOR INCOME TAXES 45,103 68,687 84,090 PROVISION FOR INCOME TAXES 18,291 27,635 33,848 Net revenues EXPENSES Depreciation and amortization(7) Amortization of intangibles(7) Restructuring charges Total operating expenses Non-operating interest expense Total expenses NET INCOME $ 26,812 $ 41,052 $ 50,242 Basic $ 0.29 $ 0.43 $ 0.52 Diluted $ 0.28 $ 0.43 $ EARNINGS PER SHARE 0.52 Weighted-average shares outstanding — basic 93,878 94,972 95,724 Weighted-average shares outstanding — diluted 95,340 96,472 97,239 5 . LPL Financial Holdings Inc. Consolidated Statements of Financial Condition (In thousands, except per share data) (Unaudited) December 31, September 30, 2015 2015 ASSETS Cash and cash equivalents Cash and securities segregated under federal and other regulations Restricted cash Receivables from: Clients, net of allowance of $1,464 at December 31, 2015 and $1,337 at September 30, 2015 Product sponsors, broker-dealers, and clearing organizations Advisor loans, net allowance of $697 at December 31, 2015 and September 30, 2015(8) Others, net of allowance of $9,856 at December 31, 2015 and $11,340 at September 30, 2015(8) Securities owned: Trading — at fair value Held-to-maturity Securities borrowed Income taxes receivable $ 724,529 671,339 27,839 $ 410,036 470,721 22,462 339,089 161,224 148,978 180,161 11,995 9,847 6,001 16,611 10,847 6,488 — Fixed assets, net of accumulated depreciation and amortization of $328,880 at December 31, 2015 and $320,897 at September 30, 2015 344,351 154,306 144,489 178,749 17,370 275,419 Other assets Total assets $ 1,365,838 392,031 Intangible assets, net of accumulated amortization of $342,740 at December 31, 2015 and $333,207 at September 30, 2015 256,998 1,365,838 Goodwill 401,563 203,473 4,517,763 $ 167,487 3,968,316 LIABILITIES AND STOCKHOLDERS’ EQUITY LIABILITIES: Drafts payable Payables to clients Payables to broker-dealers and clearing organizations Accrued commission and advisory expenses payable Accounts payable and accrued liabilities Income taxes payable Unearned revenue Securities sold, but not yet purchased — at fair value 129,512 332,492 8,680 65,480 268 Additional paid-in capital Treasury stock, at cost — 30,048,027 shares and 24,435,356 shares at December 31, 2015 and September 30, 2015, respectively 119 1,418,298 Common stock, $.001 par value; 600,000,000 shares authorized; 119,572,352 shares and 119,238,650 shares issued at December 31, 2015 and September 30, 2015, respectively 43,182 64,633 3,022,919 119 Leasehold financing obligation Deferred income taxes, net Total liabilities Commitments and contingencies STOCKHOLDERS’ EQUITY: 1,655,087 59,940 36,303 3,802,153 Senior secured credit facilities, net of unamortized debt issuance cost of $30,095 at December 31, 2015 and $11,042 at September 30, 2015(9) 144,307 558,540 43,531 132,682 308,884 — 71,847 226 2,184,942 $ 1,401,441 189,083 747,421 48,032 $ (1,172,490) (922,817) 553 Accumulated other comprehensive income Retained earnings Total stockholders’ equity Total liabilities and stockholders’ equity $ 6 469,130 715,610 4,517,763 $ 595 466,059 945,397 3,968,316 . The Company reports Adjusted EBITDA, Adjusted Earnings, and Adjusted Earnings per share to present information about its earnings that eliminates the effects of items that it does not consider indicative of its core operating performance. Adjusted EBITDA, Adjusted Earnings, and Adjusted Earnings per share have limitations as analytical tools and should not be considered in isolation or as substitutes for analysis of the Company's results as reported under GAAP. Some of these limitations are: a. Adjusted EBITDA, Adjusted Earnings, and Adjusted Earnings per share do not reflect all cash expenditures, or contractual commitments; and do not reflect changes in, or cash requirements for, working capital needs; and b.
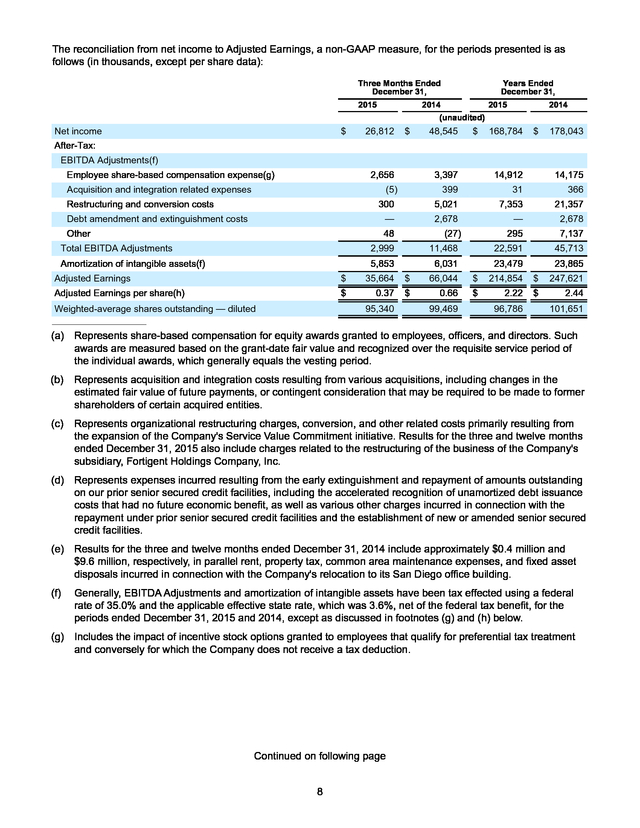
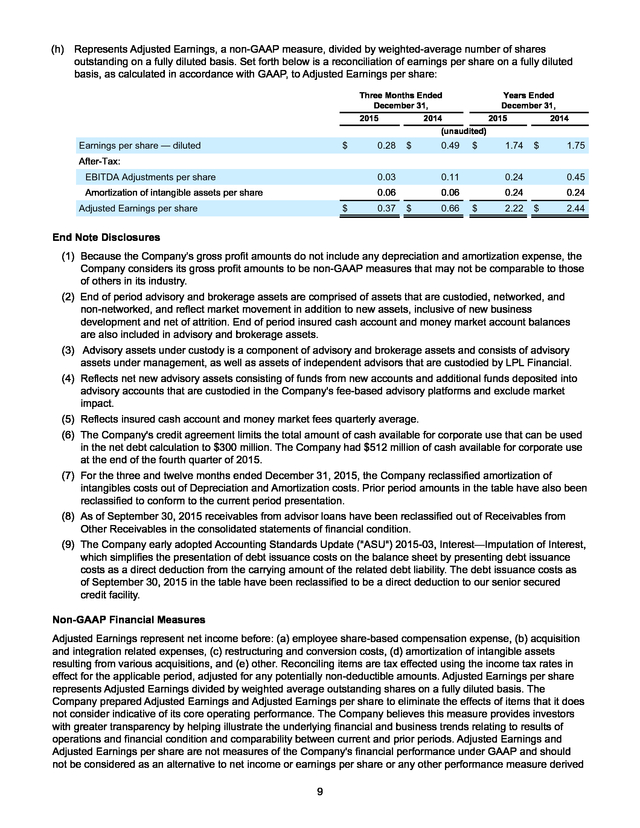
Adjusted EBITDA does not reflect the significant interest expense, or the cash requirements necessary to service interest or principal payments, on debt. The reconciliation from net income to Adjusted EBITDA, a non-GAAP measure, for the periods presented is as follows (in thousands): Three Months Ended December 31, 2015 Years Ended December 31, 2014 2015 2014 (unaudited) Net income $ 26,812 $ 48,545 $ 168,784 $ 178,043 Non-operating interest expense 18,465 12,887 59,136 51,538 Provision for income taxes 18,291 31,991 113,771 116,654 9,532 9,822 38,239 38,868 Amortization of intangible assets Depreciation and amortization of fixed assets 22,526 16,405 73,383 57,977 EBITDA 95,626 119,650 453,313 443,080 4,083 5,159 23,296 21,246 650 50 1,414 489 8,177 11,976 34,783 — 4,361 — 4,361 481 11,623 35,803 73,427 EBITDA Adjustments: Employee share-based compensation expense(a) Acquisition and integration related expenses(b) (8) Restructuring and conversion costs(c) Debt amendment and extinguishment costs(d) Other(e) 79 Total EBITDA Adjustments (44) 4,643 Adjusted EBITDA $ 100,269 Continued on following page 7 18,303 $ 137,953 $ 489,116 $ 516,507 . The reconciliation from net income to Adjusted Earnings, a non-GAAP measure, for the periods presented is as follows (in thousands, except per share data): Three Months Ended December 31, 2015 Net income $ Years Ended December 31, 2014 2015 (unaudited) 26,812 $ 48,545 $ 2014 168,784 $ 178,043 After-Tax: EBITDA Adjustments(f) Employee share-based compensation expense(g) 2,656 Acquisition and integration related expenses 3,397 (5) 14,912 14,175 399 31 366 300 5,021 7,353 21,357 Debt amendment and extinguishment costs — 2,678 Other 48 Restructuring and conversion costs — 2,678 295 (27) 7,137 Total EBITDA Adjustments 2,999 11,468 22,591 45,713 Amortization of intangible assets(f) 5,853 6,031 23,479 23,865 Adjusted Earnings $ 35,664 $ 66,044 $ 214,854 $ 247,621 Adjusted Earnings per share(h) $ 0.37 $ 0.66 $ 2.22 $ 2.44 Weighted-average shares outstanding — diluted 95,340 99,469 96,786 101,651 ___________________________ (a) Represents share-based compensation for equity awards granted to employees, officers, and directors. Such awards are measured based on the grant-date fair value and recognized over the requisite service period of the individual awards, which generally equals the vesting period. (b) Represents acquisition and integration costs resulting from various acquisitions, including changes in the estimated fair value of future payments, or contingent consideration that may be required to be made to former shareholders of certain acquired entities. (c) Represents organizational restructuring charges, conversion, and other related costs primarily resulting from the expansion of the Company's Service Value Commitment initiative. Results for the three and twelve months ended December 31, 2015 also include charges related to the restructuring of the business of the Company's subsidiary, Fortigent Holdings Company, Inc. (d) Represents expenses incurred resulting from the early extinguishment and repayment of amounts outstanding on our prior senior secured credit facilities, including the accelerated recognition of unamortized debt issuance costs that had no future economic benefit, as well as various other charges incurred in connection with the repayment under prior senior secured credit facilities and the establishment of new or amended senior secured credit facilities. (e) Results for the three and twelve months ended December 31, 2014 include approximately $0.4 million and $9.6 million, respectively, in parallel rent, property tax, common area maintenance expenses, and fixed asset disposals incurred in connection with the Company's relocation to its San Diego office building. (f) Generally, EBITDA Adjustments and amortization of intangible assets have been tax effected using a federal rate of 35.0% and the applicable effective state rate, which was 3.6%, net of the federal tax benefit, for the periods ended December 31, 2015 and 2014, except as discussed in footnotes (g) and (h) below. (g) Includes the impact of incentive stock options granted to employees that qualify for preferential tax treatment and conversely for which the Company does not receive a tax deduction. Continued on following page 8 . (h) Represents Adjusted Earnings, a non-GAAP measure, divided by weighted-average number of shares outstanding on a fully diluted basis. Set forth below is a reconciliation of earnings per share on a fully diluted basis, as calculated in accordance with GAAP, to Adjusted Earnings per share: Three Months Ended December 31, 2015 Earnings per share — diluted $ 0.28 Years Ended December 31, 2014 2015 (unaudited) $ 0.49 $ 1.74 2014 $ 1.75 After-Tax: EBITDA Adjustments per share 0.03 0.11 0.24 0.45 Amortization of intangible assets per share 0.06 0.06 0.24 0.24 Adjusted Earnings per share $ 0.37 $ 0.66 $ 2.22 $ 2.44 End Note Disclosures (1) Because the Company’s gross profit amounts do not include any depreciation and amortization expense, the Company considers its gross profit amounts to be non-GAAP measures that may not be comparable to those of others in its industry. (2) End of period advisory and brokerage assets are comprised of assets that are custodied, networked, and non-networked, and reflect market movement in addition to new assets, inclusive of new business development and net of attrition. End of period insured cash account and money market account balances are also included in advisory and brokerage assets. (3) Advisory assets under custody is a component of advisory and brokerage assets and consists of advisory assets under management, as well as assets of independent advisors that are custodied by LPL Financial. (4) Reflects net new advisory assets consisting of funds from new accounts and additional funds deposited into advisory accounts that are custodied in the Company's fee-based advisory platforms and exclude market impact. (5) Reflects insured cash account and money market fees quarterly average. (6) The Company's credit agreement limits the total amount of cash available for corporate use that can be used in the net debt calculation to $300 million. The Company had $512 million of cash available for corporate use at the end of the fourth quarter of 2015. (7) For the three and twelve months ended December 31, 2015, the Company reclassified amortization of intangibles costs out of Depreciation and Amortization costs.
Prior period amounts in the table have also been reclassified to conform to the current period presentation. (8) As of September 30, 2015 receivables from advisor loans have been reclassified out of Receivables from Other Receivables in the consolidated statements of financial condition. (9) The Company early adopted Accounting Standards Update ("ASU") 2015-03, Interest—Imputation of Interest, which simplifies the presentation of debt issuance costs on the balance sheet by presenting debt issuance costs as a direct deduction from the carrying amount of the related debt liability. The debt issuance costs as of September 30, 2015 in the table have been reclassified to be a direct deduction to our senior secured credit facility. Non-GAAP Financial Measures Adjusted Earnings represent net income before: (a) employee share-based compensation expense, (b) acquisition and integration related expenses, (c) restructuring and conversion costs, (d) amortization of intangible assets resulting from various acquisitions, and (e) other. Reconciling items are tax effected using the income tax rates in effect for the applicable period, adjusted for any potentially non-deductible amounts.
Adjusted Earnings per share represents Adjusted Earnings divided by weighted average outstanding shares on a fully diluted basis. The Company prepared Adjusted Earnings and Adjusted Earnings per share to eliminate the effects of items that it does not consider indicative of its core operating performance. The Company believes this measure provides investors with greater transparency by helping illustrate the underlying financial and business trends relating to results of operations and financial condition and comparability between current and prior periods.
Adjusted Earnings and Adjusted Earnings per share are not measures of the Company's financial performance under GAAP and should not be considered as an alternative to net income or earnings per share or any other performance measure derived 9 . in accordance with GAAP, or as an alternative to cash flows from operating activities as a measure of profitability or liquidity. Adjusted EBITDA is defined as EBITDA (net income plus interest expense, income tax expense, depreciation and amortization), further adjusted to exclude certain non-cash charges and other adjustments set forth in the table above. The Company presents Adjusted EBITDA because the Company considers it a useful financial metric in assessing the Company's operating performance from period to period by excluding certain items that the Company believes are not representative of its core business, such as certain material non-cash items and other adjustments that are outside the control of management. Adjusted EBITDA is not a measure of the Company's financial performance under GAAP and should not be considered as an alternative to net income or any other performance measure derived in accordance with GAAP, or as an alternative to cash flows from operating activities as a measure of profitability or liquidity. In addition, Adjusted EBITDA can differ significantly from company to company depending on long-term strategic decisions regarding capital structure, the tax jurisdictions in which companies operate, and capital investments. Gross Profit is calculated as net revenues less production expenses.
Production expenses consist of the following expense categories from the Company’s consolidated statements of income: (i) commission and advisory and (ii) brokerage, clearing, and exchange. All other expense categories, including depreciation and amortization, are considered general and administrative in nature. Because the Company’s gross profit amounts do not include any depreciation and amortization expense, the Company considers its gross profit amounts to be non-GAAP measures that may not be comparable to those of others in its industry. Forward-Looking Statements Statements in this press release regarding the Company's future financial and operating results, growth, business strategies and plans, including statements relating to the Company’s execution of its expense and capital plans, futureexpense growth and management of the Department of Labor rule transition, as well as any other statements that are not related to present facts or current conditions or that are not purely historical, constitute forward-looking statements.
These forward-looking statements are based on the Company's historical performance and its plans, estimates, and expectations as of February 11, 2016. The words “anticipates,” “believes,” “expects,” “may,” “plans,” “predicts,” “will,” and similar expressions are intended to identify forward-looking statements, although not all forward-looking statements contain these identifying words. Forward-looking statements are not guarantees that the future results, plans, intentions or expectations expressed or implied by the Company will be achieved.
Matters subject to forward-looking statements involve known and unknown risks and uncertainties, including economic, legislative, regulatory, competitive, and other factors, which may cause actual financial or operating results, levels of activity, or the timing of events, to be materially different than those expressed or implied by forward-looking statements. Important factors that could cause or contribute to such differences include: changes in general economic and financial market conditions, including retail investor sentiment; fluctuations in the value of advisory and brokerage assets; fluctuations in levels of net new advisory assets and the related impact on fee revenue; effects of competition in the financial services industry; changes in the number of the Company's financial advisors and institutions, and their ability to market effectively financial products and services; changes in interest rates and fees payable by banks participating in the Company's cash sweep program, including the Company's success in negotiating agreements with current or additional counterparties; changes in the growth and profitability of the Company's fee-based business; the effect of current, pending and future legislation, regulation and regulatory actions, including the fiduciary rule proposed by the U.S. Department of Labor and disciplinary actions imposed by federal and state securities regulators or self-regulatory organizations; the costs of settling and remediating issues related to pending or future regulatory matters; execution of the Company's capital management plans; the price and availability of shares and trading volumes of the Company's common stock, which will determine the timing and size of future share repurchases; execution of the Company's expense management plans and its success in realizing the savings and service improvements expected to result from its initiatives and programs, particularly its technological initiatives; the Company's success in negotiating and developing commercial arrangements with thirdparty service providers; the performance of third-party service providers on which the Company relies; the Company's ability to control operating risks, information technology systems risks, and sourcing risks; the Company’s ability to recruit new advisors and attract new business to its platform; and the other factors set forth in Part I, “Item 1A.
Risk Factors” in the Company's 2014 Annual Report on Form 10-K and any subsequent SEC filings. Except as required by law, the Company specifically disclaims any obligation to update any forward-looking statements as a result of developments occurring after the date of this earnings release, even if its estimates change, and you should not rely on those statements as representing the Company's views as of any date subsequent to the date of this press release. 10 . About LPL Financial LPL Financial, a wholly owned subsidiary of LPL Financial Holdings Inc. (NASDAQ:LPLA), is a leader in the retail financial advice market and currently serves $476 billion in advisory and brokerage assets. LPL is one of the fastest growing RIA custodians and is the nation's largest independent broker-dealer (based on total revenues, Financial Planning magazine June 1996-2015). The Company provides proprietary technology, comprehensive clearing and compliance services, practice management programs and training, and independent research to more than 14,000 independent financial advisors and over 700 banks and credit unions, enabling them to help their clients turn life's aspirations into financial realities.
Advisors associated with LPL also service an estimated 40,000 retirement plans with an estimated $118 billion in retirement plan assets, as of December 31, 2015. LPL also supports more than 4,000 financial advisors licensed and affiliated with insurance companies with customized clearing, advisory platforms, and technology solutions. LPL Financial and its affiliates have more than 3,400 employees with primary offices in Boston, Charlotte, and San Diego.
For more information, please visit www.lpl.com. Securities and Advisory Services offered through LPL Financial. A Registered Investment Advisor, Member FINRA/ SIPC. 11 .
This compares to $53 million, or $0.55 per share, in the prior quarter and $66 million, or $0.66 per share, in the fourth quarter of 2014. “The market environment was volatile and challenging in 2015, particularly for brokerage sales” said Mark Casady, chairman and CEO. “So we focused on bringing assets onto our platform and executing on our operational, efficiency, and capital plans.” Casady continued, “As we move into 2016, market volatility has only increased, and we expect continued pressure on brokerage sales. That being said, we believe our scale and stability give us an advantage in markets like this. We remain focused on growth, delivering on our expense and capital plans, and managing the DOL rule transition.” “The market environment was tough in the fourth quarter, but we made progress on expenses and capital,” said Matt Audette, chief financial officer.
“We managed our expenses slightly lower than our outlook while executing several efficiency initiatives to position us for lower G&A growth in 2016.” Audette continued, “We also completed our debt transaction and the first $250 million of our $500 million share repurchase plan in the fourth quarter. In the first quarter of 2016 to date, we have repurchased another $25 million of our shares. Given the volatile start to the year, we will be flexible and dynamic going forward in our expense and capital plans.” 1 .
Q4 2015 Q3 2015 Financial Highlights (unaudited) Seq Growth YoY Growth Q4 2014 Fiscal Year End 2015 Fiscal Year End 2014 % Change (dollars in thousands, except per share data) GAAP Measures: Net Income $ 26,812 $ 41,052 (35%) $ 48,545 (45%) $ 168,784 $ 178,043 (5%) Earnings Per Share — diluted $ 0.28 $ 0.43 (35%) $ 0.49 (43%) $ 1.74 $ 1.75 (1%) Gross Profit(1) $ 322,383 $ 339,757 (5%) $ 335,351 Adjusted Earnings $ 35,664 $ 52,772 (32%) $ 66,044 (46%) $ 214,854 $ 247,621 (13%) Adjusted Earnings Per Share $ 0.37 $ 0.55 (33%) $ 0.66 (44%) $ 2.22 $ 2.44 (9%) Adjusted EBITDA $ 100,269 $ 118,353 (15%) $ 137,953 (27%) $ 489,116 $ 516,507 (5%) Non-GAAP Measures: (4%) $ 1,357,725 $ 1,325,945 2% ____________________ A full reconciliation of GAAP measures to non-GAAP measures, along with an explanation of these metrics, follows later in this release. Q4 2015 Seq Growth Q3 2015 YoY Growth Q4 2014 Business Highlights (unaudited) Brokerage Assets (billions)(2) $ Advisory Assets Under Custody (billions)(3) 288.4 $ 187.2 282.1 2% 179.7 4% Advisory and Brokerage Assets (billions)(2) $ 475.6 $ 461.8 3% Net New Advisory Assets (billions)(4) $ 3.1 $ 4.2 Insured Cash Account Balances (billions)(2) $ 20.9 $ 19.5 7% 8.2 (1%) $ 29.0 $ 27.7 5% $ Money Market Account Balances (billions)(2) 8.1 Total Cash Sweep Balances (billions)(2) Insured Cash Account Fee - bps(5) 50 Money Market Fee - bps(5) Cash Sweep Fee - bps n/m 299.3 (4%) 175.8 6% $ 475.1 —% $ 4.1 $ 18.6 7.4 9% $ 26.0 12% 55 n/m 12% 48 2 bps (5 bps) 13 9 4 bps 7 6 bps 39 37 2 bps 41 (2 bps) Fourth Quarter 2015 Financial and Business Highlights Assets • • Brokerage and advisory assets were $476 billion, up 3% sequentially. Net new advisory assets were $3.1 billion, translating to a 7% annualized growth rate. Advisors • • Advisor count was 14,054, down 19 from the third quarter. Advisor production retention finished the year above 96%. Gross Profit • • • • Commissions were $464 million, down 4% from the prior quarter. Sales commissions declined mostly due to an industry-wide slowdown in alternative investments, and trailing commissions were relatively flat. Advisory fees were $324 million, down 5% from the prior quarter. Advisory fees are primarily billed on prior quarter balances, and third quarter asset levels declined sequentially along with the S&P 500 index. Asset-based fees were $124 million, flat sequentially. Sponsor revenues declined 4% due to lower billable assets.
Cash sweep revenue increased 13% from client cash sweep balance growth and the mid-December increase in the target range for the federal funds rate. Transaction and fee revenues were $97 million, down 8% sequentially primarily due to the timing of conferences as well as slightly lower trading volumes. 2 . Expenses • • • • • Core G&A expenses were $179 million, up $8 million sequentially. $4 million of this increase was due to nonrecurring costs, which were mostly severance. The remaining increase was primarily due to annual disclosures and investments in service and technology offset by lower performance-based compensation. For 2015, core G&A expenses were $695 million, below LPL’s expected range of $697 to $703 million. Promotional expenses were $35 million, down $7 million sequentially.
Conference expenses declined $13 million sequentially while increased transition assistance and year-end marketing expenses added $6 million. Regulatory-related charges, which include the cost of restitution and remediation of previously settled regulatory matters, were $8 million, flat sequentially. For 2015, regulatory related expenses totaled $34 million, down $2 million from 2014. Depreciation and amortization of intangibles was $32 million, up $5 million sequentially mostly due to nonrecurring real estate consolidation. Interest expense was $18 million, up $5 million sequentially following LPL’s November debt transaction. Adjusted Earnings • • • Adjusted Earnings were $36 million, or $0.37 per share. These results included $0.04 per share of nonrecurring costs totaling $7 million of pre-tax expense. The non-recurring costs included $4 million of non-recurring core G&A that was primarily related to severance for role eliminations, and $3 million of non-recurring depreciation for real estate consolidation. Historically, these non-recurring costs would have been adjusted out of Adjusted Earnings. Capital Management • • • • • • Completed a $700 million debt transaction on November 20, 2015 and used $150 million to fully pay off the Company's revolving credit facility.
At the end of the fourth quarter, net debt as defined in the Company's credit agreement was $1.9 billion(6), resulting in a leverage ratio of 3.8 times. This compares to a covenant maximum leverage ratio of 5 times. Generated EBITDA as defined in the credit agreement of $111 million in the fourth quarter and $509 million over the trailing twelve months. Completed a $250 million accelerated share repurchase plan on December 15, 2015 - purchasing more than 5.6 million shares at an average price of $44.46. In the first quarter 2016 to date, the Company purchased more than 630,000 additional shares for $25 million with an average price of $39.41. Paid a dividend of $24 million on November 24, 2015. Capital expenditures were $21 million, up $1 million sequentially. The majority of capital expenditures were for technology and for the construction of the Company's new campus in Fort Mill, South Carolina. Conference Call and Additional Information The Company will hold a conference call to discuss its results at 5:00 p.m.
EDT on Thursday, February 11, 2016. The conference call can be accessed by dialing either 877-677-9122 (domestic) or 708-290-1401 (international) and entering passcode 9969864. For additional information, please visit the Company's website to access the Q4 2015 Financial Supplement. The conference call will also be webcast simultaneously on the Investor Relations section of the Company's website (www.lpl.com), where a replay of the call will also be available following the live webcast. A telephonic replay will be available shortly after the call and can be accessed by dialing 855-859-2056 (domestic) or 404-537-3406 (international) and entering passcode 9969864.
The telephonic replay will be available until 11:59 p.m. EST on February 18, 2016. 3 . LPL Financial Holdings Inc. Consolidated Statements of Operations (In thousands, except per share data) (Unaudited) Three Months Ended December 31, 2015 2014 Years Ended December 31, % Change 2015 2014 % Change Revenues Commission $ 2,118,494 (7)% Advisory $ 324,241 339,943 (5)% 1,352,454 1,337,959 1% Asset-based 124,062 122,101 2% 493,687 476,595 4% 96,849 93,537 4% 401,948 369,821 9% Transaction and fee Other 463,486 $ 528,355 (12)% $ 1,976,845 11,708 20,332 (42)% 50,120 70,793 (29)% 1,020,346 1,104,268 (8)% 4,275,054 4,373,662 (2)% Production 697,963 768,917 (9)% 2,917,329 3,047,717 (4)% Compensation and benefits 104,938 104,370 1% 440,049 421,829 4% General and administrative 121,339 99,209 22 % 452,396 422,441 7% 22,526 16,405 37 % 73,383 57,977 27 % 9,532 9,822 (3)% 38,239 38,868 (2)% 480 8,179 (94)% 11,967 34,652 (65)% 956,778 1,006,902 (5)% 3,933,363 4,023,484 (2)% 18,465 12,887 43 % 59,136 51,538 15 % Net revenues Expenses Depreciation and amortization(7) Amortization of intangibles(7) Restructuring charges Total operating expenses Non-operating interest expense Loss on extinguishment of debt — 3,943 — 3,943 975,243 1,023,732 (5)% 3,992,499 4,078,965 (2)% Income before provision for income taxes 45,103 80,536 (44)% 282,555 294,697 (4)% Provision for income taxes Net income $ 18,291 26,812 $ 31,991 48,545 (43)% (45)% $ 113,771 168,784 $ 116,654 178,043 (2)% (5)% Basic $ 0.29 $ 0.50 (42)% $ 1.77 $ 1.78 (1)% Diluted $ 0.28 $ 0.49 (43)% $ 1.74 $ 1.75 (1)% Total expenses n/m n/m Earnings per share Weighted-average shares outstanding — basic 93,878 97,853 (4)% 95,273 99,847 (5)% Weighted-average shares outstanding — diluted 95,340 99,469 (4)% 96,786 101,651 (5)% 4 . LPL Financial Holdings Inc. Consolidated Statements of Operations Trend (In thousands, except per share data) (Unaudited) Q4 2015 Quarterly Results Q3 2015 Q2 2015 REVENUES Commission $ 463,486 $ 480,271 $ 509,689 Advisory 324,241 341,217 344,884 Asset-based 124,062 123,921 125,072 Transaction and fee 96,849 105,593 97,811 Other 11,708 3,743 13,205 1,020,346 1,054,745 1,090,661 Production 697,963 714,988 750,390 Compensation and benefits 104,938 110,494 112,337 General and administrative 121,339 117,246 99,457 22,526 17,232 17,196 9,532 9,534 9,536 480 3,071 4,492 956,778 972,565 993,408 18,465 13,493 13,163 975,243 986,058 1,006,571 INCOME BEFORE PROVISION FOR INCOME TAXES 45,103 68,687 84,090 PROVISION FOR INCOME TAXES 18,291 27,635 33,848 Net revenues EXPENSES Depreciation and amortization(7) Amortization of intangibles(7) Restructuring charges Total operating expenses Non-operating interest expense Total expenses NET INCOME $ 26,812 $ 41,052 $ 50,242 Basic $ 0.29 $ 0.43 $ 0.52 Diluted $ 0.28 $ 0.43 $ EARNINGS PER SHARE 0.52 Weighted-average shares outstanding — basic 93,878 94,972 95,724 Weighted-average shares outstanding — diluted 95,340 96,472 97,239 5 . LPL Financial Holdings Inc. Consolidated Statements of Financial Condition (In thousands, except per share data) (Unaudited) December 31, September 30, 2015 2015 ASSETS Cash and cash equivalents Cash and securities segregated under federal and other regulations Restricted cash Receivables from: Clients, net of allowance of $1,464 at December 31, 2015 and $1,337 at September 30, 2015 Product sponsors, broker-dealers, and clearing organizations Advisor loans, net allowance of $697 at December 31, 2015 and September 30, 2015(8) Others, net of allowance of $9,856 at December 31, 2015 and $11,340 at September 30, 2015(8) Securities owned: Trading — at fair value Held-to-maturity Securities borrowed Income taxes receivable $ 724,529 671,339 27,839 $ 410,036 470,721 22,462 339,089 161,224 148,978 180,161 11,995 9,847 6,001 16,611 10,847 6,488 — Fixed assets, net of accumulated depreciation and amortization of $328,880 at December 31, 2015 and $320,897 at September 30, 2015 344,351 154,306 144,489 178,749 17,370 275,419 Other assets Total assets $ 1,365,838 392,031 Intangible assets, net of accumulated amortization of $342,740 at December 31, 2015 and $333,207 at September 30, 2015 256,998 1,365,838 Goodwill 401,563 203,473 4,517,763 $ 167,487 3,968,316 LIABILITIES AND STOCKHOLDERS’ EQUITY LIABILITIES: Drafts payable Payables to clients Payables to broker-dealers and clearing organizations Accrued commission and advisory expenses payable Accounts payable and accrued liabilities Income taxes payable Unearned revenue Securities sold, but not yet purchased — at fair value 129,512 332,492 8,680 65,480 268 Additional paid-in capital Treasury stock, at cost — 30,048,027 shares and 24,435,356 shares at December 31, 2015 and September 30, 2015, respectively 119 1,418,298 Common stock, $.001 par value; 600,000,000 shares authorized; 119,572,352 shares and 119,238,650 shares issued at December 31, 2015 and September 30, 2015, respectively 43,182 64,633 3,022,919 119 Leasehold financing obligation Deferred income taxes, net Total liabilities Commitments and contingencies STOCKHOLDERS’ EQUITY: 1,655,087 59,940 36,303 3,802,153 Senior secured credit facilities, net of unamortized debt issuance cost of $30,095 at December 31, 2015 and $11,042 at September 30, 2015(9) 144,307 558,540 43,531 132,682 308,884 — 71,847 226 2,184,942 $ 1,401,441 189,083 747,421 48,032 $ (1,172,490) (922,817) 553 Accumulated other comprehensive income Retained earnings Total stockholders’ equity Total liabilities and stockholders’ equity $ 6 469,130 715,610 4,517,763 $ 595 466,059 945,397 3,968,316 . The Company reports Adjusted EBITDA, Adjusted Earnings, and Adjusted Earnings per share to present information about its earnings that eliminates the effects of items that it does not consider indicative of its core operating performance. Adjusted EBITDA, Adjusted Earnings, and Adjusted Earnings per share have limitations as analytical tools and should not be considered in isolation or as substitutes for analysis of the Company's results as reported under GAAP. Some of these limitations are: a. Adjusted EBITDA, Adjusted Earnings, and Adjusted Earnings per share do not reflect all cash expenditures, or contractual commitments; and do not reflect changes in, or cash requirements for, working capital needs; and b.
Adjusted EBITDA does not reflect the significant interest expense, or the cash requirements necessary to service interest or principal payments, on debt. The reconciliation from net income to Adjusted EBITDA, a non-GAAP measure, for the periods presented is as follows (in thousands): Three Months Ended December 31, 2015 Years Ended December 31, 2014 2015 2014 (unaudited) Net income $ 26,812 $ 48,545 $ 168,784 $ 178,043 Non-operating interest expense 18,465 12,887 59,136 51,538 Provision for income taxes 18,291 31,991 113,771 116,654 9,532 9,822 38,239 38,868 Amortization of intangible assets Depreciation and amortization of fixed assets 22,526 16,405 73,383 57,977 EBITDA 95,626 119,650 453,313 443,080 4,083 5,159 23,296 21,246 650 50 1,414 489 8,177 11,976 34,783 — 4,361 — 4,361 481 11,623 35,803 73,427 EBITDA Adjustments: Employee share-based compensation expense(a) Acquisition and integration related expenses(b) (8) Restructuring and conversion costs(c) Debt amendment and extinguishment costs(d) Other(e) 79 Total EBITDA Adjustments (44) 4,643 Adjusted EBITDA $ 100,269 Continued on following page 7 18,303 $ 137,953 $ 489,116 $ 516,507 . The reconciliation from net income to Adjusted Earnings, a non-GAAP measure, for the periods presented is as follows (in thousands, except per share data): Three Months Ended December 31, 2015 Net income $ Years Ended December 31, 2014 2015 (unaudited) 26,812 $ 48,545 $ 2014 168,784 $ 178,043 After-Tax: EBITDA Adjustments(f) Employee share-based compensation expense(g) 2,656 Acquisition and integration related expenses 3,397 (5) 14,912 14,175 399 31 366 300 5,021 7,353 21,357 Debt amendment and extinguishment costs — 2,678 Other 48 Restructuring and conversion costs — 2,678 295 (27) 7,137 Total EBITDA Adjustments 2,999 11,468 22,591 45,713 Amortization of intangible assets(f) 5,853 6,031 23,479 23,865 Adjusted Earnings $ 35,664 $ 66,044 $ 214,854 $ 247,621 Adjusted Earnings per share(h) $ 0.37 $ 0.66 $ 2.22 $ 2.44 Weighted-average shares outstanding — diluted 95,340 99,469 96,786 101,651 ___________________________ (a) Represents share-based compensation for equity awards granted to employees, officers, and directors. Such awards are measured based on the grant-date fair value and recognized over the requisite service period of the individual awards, which generally equals the vesting period. (b) Represents acquisition and integration costs resulting from various acquisitions, including changes in the estimated fair value of future payments, or contingent consideration that may be required to be made to former shareholders of certain acquired entities. (c) Represents organizational restructuring charges, conversion, and other related costs primarily resulting from the expansion of the Company's Service Value Commitment initiative. Results for the three and twelve months ended December 31, 2015 also include charges related to the restructuring of the business of the Company's subsidiary, Fortigent Holdings Company, Inc. (d) Represents expenses incurred resulting from the early extinguishment and repayment of amounts outstanding on our prior senior secured credit facilities, including the accelerated recognition of unamortized debt issuance costs that had no future economic benefit, as well as various other charges incurred in connection with the repayment under prior senior secured credit facilities and the establishment of new or amended senior secured credit facilities. (e) Results for the three and twelve months ended December 31, 2014 include approximately $0.4 million and $9.6 million, respectively, in parallel rent, property tax, common area maintenance expenses, and fixed asset disposals incurred in connection with the Company's relocation to its San Diego office building. (f) Generally, EBITDA Adjustments and amortization of intangible assets have been tax effected using a federal rate of 35.0% and the applicable effective state rate, which was 3.6%, net of the federal tax benefit, for the periods ended December 31, 2015 and 2014, except as discussed in footnotes (g) and (h) below. (g) Includes the impact of incentive stock options granted to employees that qualify for preferential tax treatment and conversely for which the Company does not receive a tax deduction. Continued on following page 8 . (h) Represents Adjusted Earnings, a non-GAAP measure, divided by weighted-average number of shares outstanding on a fully diluted basis. Set forth below is a reconciliation of earnings per share on a fully diluted basis, as calculated in accordance with GAAP, to Adjusted Earnings per share: Three Months Ended December 31, 2015 Earnings per share — diluted $ 0.28 Years Ended December 31, 2014 2015 (unaudited) $ 0.49 $ 1.74 2014 $ 1.75 After-Tax: EBITDA Adjustments per share 0.03 0.11 0.24 0.45 Amortization of intangible assets per share 0.06 0.06 0.24 0.24 Adjusted Earnings per share $ 0.37 $ 0.66 $ 2.22 $ 2.44 End Note Disclosures (1) Because the Company’s gross profit amounts do not include any depreciation and amortization expense, the Company considers its gross profit amounts to be non-GAAP measures that may not be comparable to those of others in its industry. (2) End of period advisory and brokerage assets are comprised of assets that are custodied, networked, and non-networked, and reflect market movement in addition to new assets, inclusive of new business development and net of attrition. End of period insured cash account and money market account balances are also included in advisory and brokerage assets. (3) Advisory assets under custody is a component of advisory and brokerage assets and consists of advisory assets under management, as well as assets of independent advisors that are custodied by LPL Financial. (4) Reflects net new advisory assets consisting of funds from new accounts and additional funds deposited into advisory accounts that are custodied in the Company's fee-based advisory platforms and exclude market impact. (5) Reflects insured cash account and money market fees quarterly average. (6) The Company's credit agreement limits the total amount of cash available for corporate use that can be used in the net debt calculation to $300 million. The Company had $512 million of cash available for corporate use at the end of the fourth quarter of 2015. (7) For the three and twelve months ended December 31, 2015, the Company reclassified amortization of intangibles costs out of Depreciation and Amortization costs.
Prior period amounts in the table have also been reclassified to conform to the current period presentation. (8) As of September 30, 2015 receivables from advisor loans have been reclassified out of Receivables from Other Receivables in the consolidated statements of financial condition. (9) The Company early adopted Accounting Standards Update ("ASU") 2015-03, Interest—Imputation of Interest, which simplifies the presentation of debt issuance costs on the balance sheet by presenting debt issuance costs as a direct deduction from the carrying amount of the related debt liability. The debt issuance costs as of September 30, 2015 in the table have been reclassified to be a direct deduction to our senior secured credit facility. Non-GAAP Financial Measures Adjusted Earnings represent net income before: (a) employee share-based compensation expense, (b) acquisition and integration related expenses, (c) restructuring and conversion costs, (d) amortization of intangible assets resulting from various acquisitions, and (e) other. Reconciling items are tax effected using the income tax rates in effect for the applicable period, adjusted for any potentially non-deductible amounts.
Adjusted Earnings per share represents Adjusted Earnings divided by weighted average outstanding shares on a fully diluted basis. The Company prepared Adjusted Earnings and Adjusted Earnings per share to eliminate the effects of items that it does not consider indicative of its core operating performance. The Company believes this measure provides investors with greater transparency by helping illustrate the underlying financial and business trends relating to results of operations and financial condition and comparability between current and prior periods.
Adjusted Earnings and Adjusted Earnings per share are not measures of the Company's financial performance under GAAP and should not be considered as an alternative to net income or earnings per share or any other performance measure derived 9 . in accordance with GAAP, or as an alternative to cash flows from operating activities as a measure of profitability or liquidity. Adjusted EBITDA is defined as EBITDA (net income plus interest expense, income tax expense, depreciation and amortization), further adjusted to exclude certain non-cash charges and other adjustments set forth in the table above. The Company presents Adjusted EBITDA because the Company considers it a useful financial metric in assessing the Company's operating performance from period to period by excluding certain items that the Company believes are not representative of its core business, such as certain material non-cash items and other adjustments that are outside the control of management. Adjusted EBITDA is not a measure of the Company's financial performance under GAAP and should not be considered as an alternative to net income or any other performance measure derived in accordance with GAAP, or as an alternative to cash flows from operating activities as a measure of profitability or liquidity. In addition, Adjusted EBITDA can differ significantly from company to company depending on long-term strategic decisions regarding capital structure, the tax jurisdictions in which companies operate, and capital investments. Gross Profit is calculated as net revenues less production expenses.
Production expenses consist of the following expense categories from the Company’s consolidated statements of income: (i) commission and advisory and (ii) brokerage, clearing, and exchange. All other expense categories, including depreciation and amortization, are considered general and administrative in nature. Because the Company’s gross profit amounts do not include any depreciation and amortization expense, the Company considers its gross profit amounts to be non-GAAP measures that may not be comparable to those of others in its industry. Forward-Looking Statements Statements in this press release regarding the Company's future financial and operating results, growth, business strategies and plans, including statements relating to the Company’s execution of its expense and capital plans, futureexpense growth and management of the Department of Labor rule transition, as well as any other statements that are not related to present facts or current conditions or that are not purely historical, constitute forward-looking statements.
These forward-looking statements are based on the Company's historical performance and its plans, estimates, and expectations as of February 11, 2016. The words “anticipates,” “believes,” “expects,” “may,” “plans,” “predicts,” “will,” and similar expressions are intended to identify forward-looking statements, although not all forward-looking statements contain these identifying words. Forward-looking statements are not guarantees that the future results, plans, intentions or expectations expressed or implied by the Company will be achieved.
Matters subject to forward-looking statements involve known and unknown risks and uncertainties, including economic, legislative, regulatory, competitive, and other factors, which may cause actual financial or operating results, levels of activity, or the timing of events, to be materially different than those expressed or implied by forward-looking statements. Important factors that could cause or contribute to such differences include: changes in general economic and financial market conditions, including retail investor sentiment; fluctuations in the value of advisory and brokerage assets; fluctuations in levels of net new advisory assets and the related impact on fee revenue; effects of competition in the financial services industry; changes in the number of the Company's financial advisors and institutions, and their ability to market effectively financial products and services; changes in interest rates and fees payable by banks participating in the Company's cash sweep program, including the Company's success in negotiating agreements with current or additional counterparties; changes in the growth and profitability of the Company's fee-based business; the effect of current, pending and future legislation, regulation and regulatory actions, including the fiduciary rule proposed by the U.S. Department of Labor and disciplinary actions imposed by federal and state securities regulators or self-regulatory organizations; the costs of settling and remediating issues related to pending or future regulatory matters; execution of the Company's capital management plans; the price and availability of shares and trading volumes of the Company's common stock, which will determine the timing and size of future share repurchases; execution of the Company's expense management plans and its success in realizing the savings and service improvements expected to result from its initiatives and programs, particularly its technological initiatives; the Company's success in negotiating and developing commercial arrangements with thirdparty service providers; the performance of third-party service providers on which the Company relies; the Company's ability to control operating risks, information technology systems risks, and sourcing risks; the Company’s ability to recruit new advisors and attract new business to its platform; and the other factors set forth in Part I, “Item 1A.
Risk Factors” in the Company's 2014 Annual Report on Form 10-K and any subsequent SEC filings. Except as required by law, the Company specifically disclaims any obligation to update any forward-looking statements as a result of developments occurring after the date of this earnings release, even if its estimates change, and you should not rely on those statements as representing the Company's views as of any date subsequent to the date of this press release. 10 . About LPL Financial LPL Financial, a wholly owned subsidiary of LPL Financial Holdings Inc. (NASDAQ:LPLA), is a leader in the retail financial advice market and currently serves $476 billion in advisory and brokerage assets. LPL is one of the fastest growing RIA custodians and is the nation's largest independent broker-dealer (based on total revenues, Financial Planning magazine June 1996-2015). The Company provides proprietary technology, comprehensive clearing and compliance services, practice management programs and training, and independent research to more than 14,000 independent financial advisors and over 700 banks and credit unions, enabling them to help their clients turn life's aspirations into financial realities.
Advisors associated with LPL also service an estimated 40,000 retirement plans with an estimated $118 billion in retirement plan assets, as of December 31, 2015. LPL also supports more than 4,000 financial advisors licensed and affiliated with insurance companies with customized clearing, advisory platforms, and technology solutions. LPL Financial and its affiliates have more than 3,400 employees with primary offices in Boston, Charlotte, and San Diego.
For more information, please visit www.lpl.com. Securities and Advisory Services offered through LPL Financial. A Registered Investment Advisor, Member FINRA/ SIPC. 11 .


