


Description
Exhibit 99.1
For Immediate Release
LPL Financial Announces Third Quarter 2015 Results and
Updates Capital and Expense Management Plans
— Established a new leveraged target of ~4x Net Debt / Adjusted EBITDA —
— Increased share repurchase authorization to $500 million —
— Strengthened expense management aimed at improving operating leverage and advisor support —
BOSTON - October 29, 2015 — LPL Financial Holdings Inc. (NASDAQ: LPLA) (the “Company”), parent company
of LPL Financial LLC (“LPL Financial”), today announced its quarterly financial and business results.
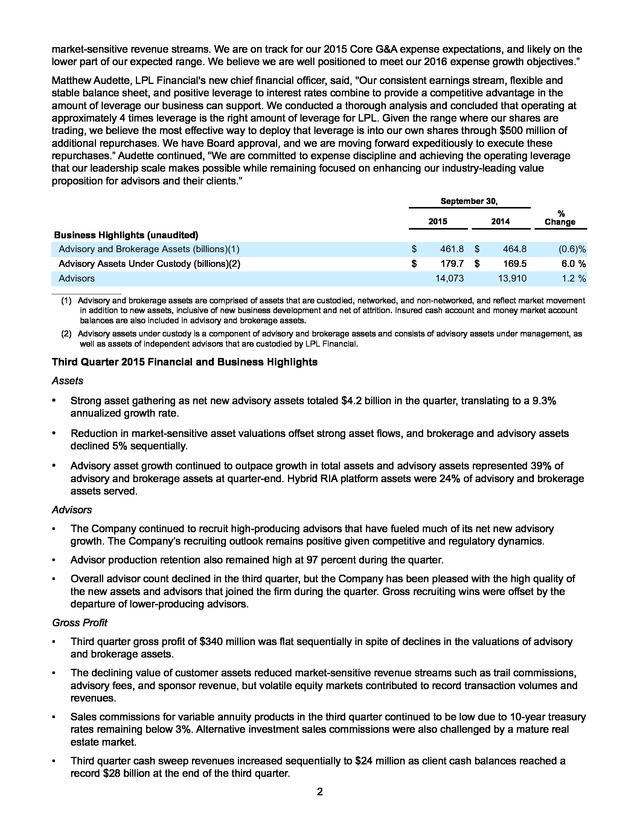
“Our third quarter results were solid and consistent with the market environment,” stated Mark Casady, LPL
chairman and chief executive officer. “Our sales commissions and market-sensitive revenue streams experienced a
cyclical decrease with the market, but we continued to have strong net new advisory asset flows and high
production retention. We also had record transaction volumes and client cash balances during this quarter."
Three Months Ended
September 30,
2015
Nine Months Ended
September 30,
2014
Financial Highlights (unaudited)
%
Change
2015
2014
%
Change
(dollars in thousands, except per share data)
GAAP Measures:
Net Revenue
$ 1,054,745
$ 1,089,234
(3.2)%
$ 3,254,708
$ 3,269,394
Net Income
$
41,052
$
33,272
23.4 %
$
141,972
$
129,498
(0.4)%
9.6 %
Earnings Per Share — diluted
$
0.43
$
0.33
30.3 %
$
1.46
$
1.26
15.9 %
Gross Profit(1)
$
339,757
$
331,143
2.6 %
$ 1,035,342
$
990,594
4.5 %
Adjusted Earnings
$
52,772
$
48,773
8.2 %
$
179,190
$
181,577
(1.3)%
Adjusted Earnings Per Share
$
0.55
$
0.48
14.6 %
$
1.84
$
1.77
4.0 %
Adjusted EBITDA
$
118,352
$
108,878
8.7 %
$
388,846
$
378,554
2.7 %
Non-GAAP Measures:
____________________
A full reconciliation of GAAP measures to non-GAAP measures, along with an explanation of these metrics, follows later in this release.
(1) Because the Company’s gross profit amounts do not include any depreciation and amortization expense, the Company considers its gross
profit amounts to be non-GAAP measures that may not be comparable to those of others in its industry.
Casady continued, “Given the current market and regulatory environment, we are taking advantage of an
opportunity to reposition our capital and expense plans to maximize shareholder returns.
After careful deliberation, we developed a capital allocation strategy to better take advantage of our financial strength and the competitive advantage our capital-light model provides. Our Board has approved what we see as the best combined approach increased leverage to ~4x Adjusted EBITDA and an investment of $500 million in our own shares. We are also committed to lower 2016 Core G&A expense growth at 2 to 4% year-over-year.
This is a significant drop from the previous two years and is possible with our investments in automation and our service and risk management capabilities. Our industry-leading value proposition for advisors and consumers have benefited from our focus on continuous improvement, which continues next year. We also continue to improve our service levels under the leadership of industry veterans Tom Gooley and Tim Hodge, who bring operational excellence and know where to best invest for the highest and greatest impact.” “Adjusted earnings per share for the quarter were $0.55, up $0.07 year-over-year though down $0.10 sequentially,” said Tom Lux, who served as acting chief financial officer during the third quarter.
“Compared to the second quarter, growth in transaction and cash sweep revenue combined with $25 million of share repurchases increased our adjusted earnings per share by $0.03. This growth was offset by sequential headwinds primarily related to the net expense of our annual national advisor conference in the third quarter and cyclically slower sales commissions and 1 . market-sensitive revenue streams. We are on track for our 2015 Core G&A expense expectations, and likely on the lower part of our expected range. We believe we are well positioned to meet our 2016 expense growth objectives.” Matthew Audette, LPL Financial's new chief financial officer, said, "Our consistent earnings stream, flexible and stable balance sheet, and positive leverage to interest rates combine to provide a competitive advantage in the amount of leverage our business can support. We conducted a thorough analysis and concluded that operating at approximately 4 times leverage is the right amount of leverage for LPL.
Given the range where our shares are trading, we believe the most effective way to deploy that leverage is into our own shares through $500 million of additional repurchases. We have Board approval, and we are moving forward expeditiously to execute these repurchases.” Audette continued, “We are committed to expense discipline and achieving the operating leverage that our leadership scale makes possible while remaining focused on enhancing our industry-leading value proposition for advisors and their clients.” September 30, 2015 2014 % Change Business Highlights (unaudited) Advisory and Brokerage Assets (billions)(1) $ 461.8 $ 464.8 (0.6)% Advisory Assets Under Custody (billions)(2) $ 179.7 $ 169.5 6.0 % 13,910 1.2 % Advisors 14,073 ____________________ (1) Advisory and brokerage assets are comprised of assets that are custodied, networked, and non-networked, and reflect market movement in addition to new assets, inclusive of new business development and net of attrition. Insured cash account and money market account balances are also included in advisory and brokerage assets. (2) Advisory assets under custody is a component of advisory and brokerage assets and consists of advisory assets under management, as well as assets of independent advisors that are custodied by LPL Financial. Third Quarter 2015 Financial and Business Highlights Assets • Strong asset gathering as net new advisory assets totaled $4.2 billion in the quarter, translating to a 9.3% annualized growth rate. • Reduction in market-sensitive asset valuations offset strong asset flows, and brokerage and advisory assets declined 5% sequentially. • Advisory asset growth continued to outpace growth in total assets and advisory assets represented 39% of advisory and brokerage assets at quarter-end.
Hybrid RIA platform assets were 24% of advisory and brokerage assets served. Advisors • The Company continued to recruit high-producing advisors that have fueled much of its net new advisory growth. The Company’s recruiting outlook remains positive given competitive and regulatory dynamics. • Advisor production retention also remained high at 97 percent during the quarter. • Overall advisor count declined in the third quarter, but the Company has been pleased with the high quality of the new assets and advisors that joined the firm during the quarter. Gross recruiting wins were offset by the departure of lower-producing advisors. Gross Profit • Third quarter gross profit of $340 million was flat sequentially in spite of declines in the valuations of advisory and brokerage assets. • The declining value of customer assets reduced market-sensitive revenue streams such as trail commissions, advisory fees, and sponsor revenue, but volatile equity markets contributed to record transaction volumes and revenues. • Sales commissions for variable annuity products in the third quarter continued to be low due to 10-year treasury rates remaining below 3%.
Alternative investment sales commissions were also challenged by a mature real estate market. • Third quarter cash sweep revenues increased sequentially to $24 million as client cash balances reached a record $28 billion at the end of the third quarter. 2 . Expenses • Third quarter Core G&A expenses, excluding regulatory charges, were flat sequentially at $171 million and up 5% year-over-year. The Company expects full year 2015 Core G&A expenses to be in its expected range of 7.5 to 8.5% year-over-year growth, and likely in the lower part of that range. • Promotional expenses in the third quarter increased sequentially to $42 million due to the $15 million expense of the Company's annual national advisor conference. • Regulatory-related charges increased by $1 million sequentially to $8 million in the third quarter, as the Company reached agreements to resolve several regulatory matters that it had been working on. Capital Allocation • The Company returned $49 million of capital to shareholders during the third quarter, including $24 million of dividends and $25 million of share repurchases. The Company purchased approximately 600,000 shares at a weighted-average price of $42.12 per share. • Year to date, the Company has returned $213 million of capital to shareholders through $72 million of dividends and $141 million of share repurchases. • The Company's Board of Directors declared a cash dividend of $0.25 per share on the Company's outstanding common stock to be paid on November 24, 2015 to stockholders of record on November 12, 2015. • Capital expenditures for technology to support growth and for the construction of the Company's new campus in Fort Mill, South Carolina totaled $20 million. Updated Capital and Expense Management Plans Capital Management Plans • The Company announced the repositioning of its capital management plan to create greater shareholder value, including: Increased share repurchase authorization to $500 million. Repurchases may be effected in open market or privately negotiated transactions, which may include a combination of an accelerated share repurchase program and open market purchases. Increased target leverage to net debt of approximately 4 times adjusted EBITDA.
The Company is planning to amend its credit agreement to provide for incremental upsizing of its credit facilities by up to $700 million, extension of the maturity of certain or all currently outstanding term B loans (from March 2019 to March 2021), and modification of the restricted payment provisions to enable execution of the full amount of the increased share repurchase authorization. • The Company and Board are committed to moving forward as quickly as possible consistent with best execution, its general operating needs, and any applicable constraints under its credit agreement. Updated Expense Management Plans • The Company announced that it expects 2 to 4% Core G&A growth in 2016 compared to 2015, including: Full-year cost of 2015 investments; Prioritized 2016 investments in the Company's business, including accelerated development of its ClientWorkssm platform; Planned enhancements for its financial advisors, as well as potential costs to comply with the final Department of Labor fiduciary rule; and Efforts and initiatives to keep other Core G&A expenses flat. Conference Call and Additional Information The Company will hold a conference call to discuss its results at 8:00 a.m. EDT on Thursday, October 29, 2015. The conference call can be accessed by dialing either 877-677-9122 (domestic) or 708-290-1401 (international) and entering passcode 52748981. For additional information, please visit the Company's website to access the Q3 2015 Financial Supplement. The conference call will also be webcast simultaneously on the Investor Relations section of the Company's website (www.lpl.com), where a replay of the call will also be available following the live webcast.
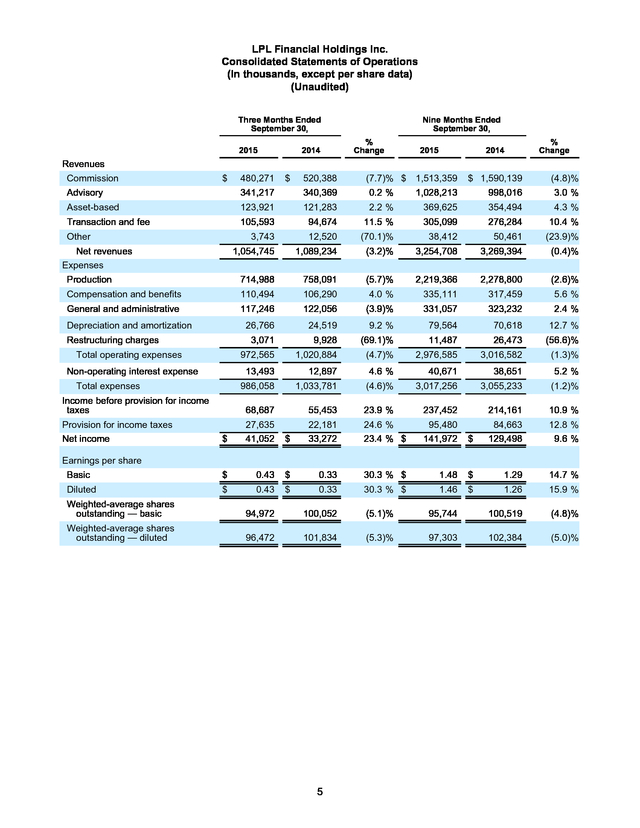
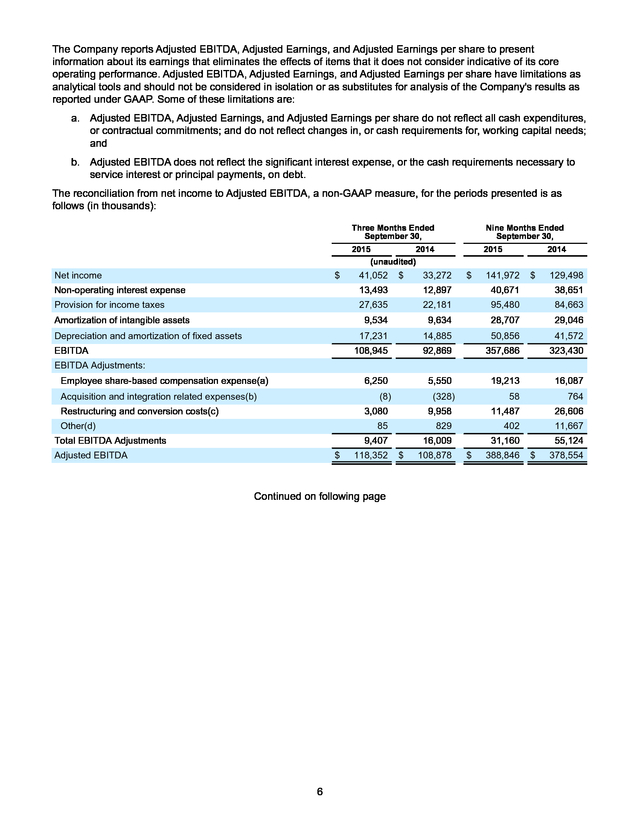
A telephonic replay will be available shortly after the call and can be accessed by dialing 855-859-2056 (domestic) or 404-537-3406 3 . (international) and entering passcode 52748981. The telephonic replay will be available until 11:59 p.m. EST on November 5, 2015. 4 . LPL Financial Holdings Inc. Consolidated Statements of Operations (In thousands, except per share data) (Unaudited) Three Months Ended September 30, 2015 2014 Nine Months Ended September 30, % Change 2015 2014 % Change Revenues Commission $ 480,271 $ 520,388 $ 1,590,139 (4.8)% 0.2 % 1,028,213 998,016 3.0 % 121,283 2.2 % 369,625 354,494 4.3 % 94,674 11.5 % 305,099 276,284 10.4 % Advisory 341,217 340,369 Asset-based 123,921 Transaction and fee 105,593 Other (7.7)% $ 1,513,359 3,743 12,520 (70.1)% 38,412 50,461 (23.9)% 1,054,745 1,089,234 (3.2)% 3,254,708 3,269,394 (0.4)% Production 714,988 758,091 (5.7)% 2,219,366 2,278,800 (2.6)% Compensation and benefits 110,494 106,290 4.0 % 335,111 317,459 5.6 % General and administrative 117,246 122,056 (3.9)% 331,057 323,232 2.4 % 26,766 24,519 9.2 % 79,564 70,618 12.7 % Net revenues Expenses Depreciation and amortization Restructuring charges 3,071 Provision for income taxes Net income 11,487 26,473 (56.6)% (4.7)% 2,976,585 3,016,582 (1.3)% 12,897 4.6 % 40,671 38,651 5.2 % 986,058 1,033,781 (4.6)% 3,017,256 3,055,233 (1.2)% 68,687 Total expenses Income before provision for income taxes (69.1)% 1,020,884 13,493 Non-operating interest expense 9,928 972,565 Total operating expenses 55,453 23.9 % 237,452 214,161 10.9 % $ 27,635 41,052 $ 22,181 33,272 24.6 % 23.4 % $ 95,480 141,972 $ 84,663 129,498 12.8 % 9.6 % Basic $ 0.43 $ 0.33 30.3 % $ 1.48 $ 1.29 14.7 % Diluted $ 0.43 $ 0.33 30.3 % $ 1.46 $ 1.26 15.9 % Earnings per share Weighted-average shares outstanding — basic 94,972 100,052 (5.1)% 95,744 100,519 (4.8)% Weighted-average shares outstanding — diluted 96,472 101,834 (5.3)% 97,303 102,384 (5.0)% 5 . The Company reports Adjusted EBITDA, Adjusted Earnings, and Adjusted Earnings per share to present information about its earnings that eliminates the effects of items that it does not consider indicative of its core operating performance. Adjusted EBITDA, Adjusted Earnings, and Adjusted Earnings per share have limitations as analytical tools and should not be considered in isolation or as substitutes for analysis of the Company's results as reported under GAAP. Some of these limitations are: a. Adjusted EBITDA, Adjusted Earnings, and Adjusted Earnings per share do not reflect all cash expenditures, or contractual commitments; and do not reflect changes in, or cash requirements for, working capital needs; and b.
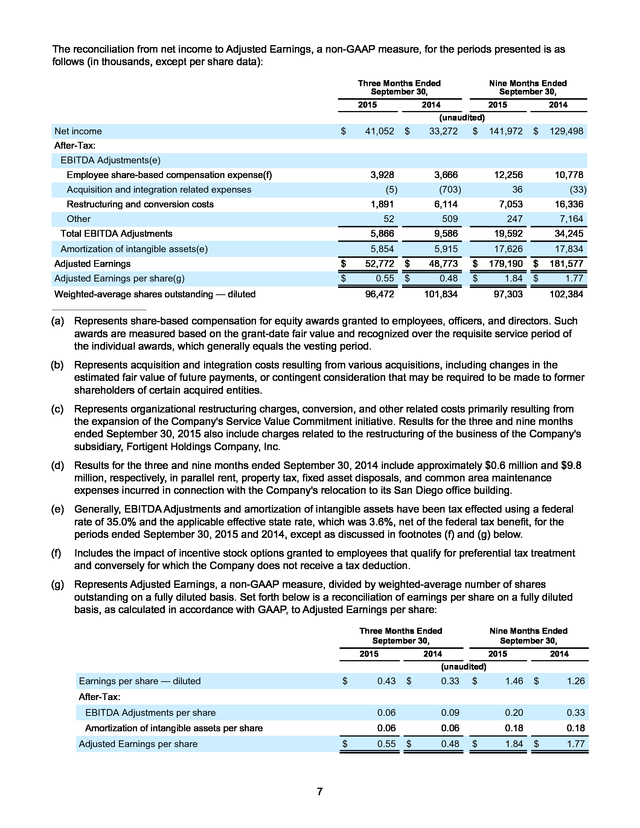
Adjusted EBITDA does not reflect the significant interest expense, or the cash requirements necessary to service interest or principal payments, on debt. The reconciliation from net income to Adjusted EBITDA, a non-GAAP measure, for the periods presented is as follows (in thousands): Three Months Ended September 30, 2015 2014 (unaudited) Net income $ Nine Months Ended September 30, 2015 41,052 $ 33,272 $ 2014 141,972 $ 129,498 Non-operating interest expense 13,493 12,897 40,671 38,651 Provision for income taxes 27,635 22,181 95,480 84,663 9,534 9,634 28,707 29,046 Amortization of intangible assets Depreciation and amortization of fixed assets 17,231 14,885 50,856 41,572 108,945 92,869 357,686 323,430 6,250 EBITDA 5,550 19,213 16,087 58 764 EBITDA Adjustments: Employee share-based compensation expense(a) Acquisition and integration related expenses(b) (8) Restructuring and conversion costs(c) (328) 3,080 Total EBITDA Adjustments 9,958 11,487 26,606 85 Other(d) 829 402 11,667 9,407 Adjusted EBITDA $ 118,352 Continued on following page 6 16,009 $ 108,878 31,160 $ 388,846 55,124 $ 378,554 . The reconciliation from net income to Adjusted Earnings, a non-GAAP measure, for the periods presented is as follows (in thousands, except per share data): Three Months Ended September 30, 2015 Net income $ Nine Months Ended September 30, 2014 2015 (unaudited) 41,052 $ 33,272 $ 2014 141,972 $ 129,498 After-Tax: EBITDA Adjustments(e) Employee share-based compensation expense(f) 3,928 Acquisition and integration related expenses 3,666 (5) Restructuring and conversion costs (703) 1,891 Other 12,256 10,778 36 6,114 (33) 7,053 16,336 52 Amortization of intangible assets(e) 509 247 7,164 5,866 Total EBITDA Adjustments 9,586 19,592 34,245 5,854 5,915 17,626 17,834 Adjusted Earnings $ 52,772 $ 48,773 $ 179,190 $ 181,577 Adjusted Earnings per share(g) $ 0.55 $ 0.48 $ 1.84 $ 1.77 Weighted-average shares outstanding — diluted 96,472 101,834 97,303 102,384 ___________________________ (a) Represents share-based compensation for equity awards granted to employees, officers, and directors. Such awards are measured based on the grant-date fair value and recognized over the requisite service period of the individual awards, which generally equals the vesting period. (b) Represents acquisition and integration costs resulting from various acquisitions, including changes in the estimated fair value of future payments, or contingent consideration that may be required to be made to former shareholders of certain acquired entities. (c) Represents organizational restructuring charges, conversion, and other related costs primarily resulting from the expansion of the Company's Service Value Commitment initiative. Results for the three and nine months ended September 30, 2015 also include charges related to the restructuring of the business of the Company's subsidiary, Fortigent Holdings Company, Inc. (d) Results for the three and nine months ended September 30, 2014 include approximately $0.6 million and $9.8 million, respectively, in parallel rent, property tax, fixed asset disposals, and common area maintenance expenses incurred in connection with the Company's relocation to its San Diego office building. (e) Generally, EBITDA Adjustments and amortization of intangible assets have been tax effected using a federal rate of 35.0% and the applicable effective state rate, which was 3.6%, net of the federal tax benefit, for the periods ended September 30, 2015 and 2014, except as discussed in footnotes (f) and (g) below. (f) Includes the impact of incentive stock options granted to employees that qualify for preferential tax treatment and conversely for which the Company does not receive a tax deduction. (g) Represents Adjusted Earnings, a non-GAAP measure, divided by weighted-average number of shares outstanding on a fully diluted basis. Set forth below is a reconciliation of earnings per share on a fully diluted basis, as calculated in accordance with GAAP, to Adjusted Earnings per share: Three Months Ended September 30, 2015 Earnings per share — diluted $ 0.43 Nine Months Ended September 30, 2014 2015 (unaudited) $ 0.33 $ 1.46 2014 $ 1.26 After-Tax: EBITDA Adjustments per share 0.06 0.09 0.20 0.33 Amortization of intangible assets per share 0.06 0.06 0.18 0.18 Adjusted Earnings per share $ 7 0.55 $ 0.48 $ 1.84 $ 1.77 .
Non-GAAP Financial Measures Adjusted Earnings represent net income before: (a) employee share-based compensation expense, (b) acquisition and integration related expenses, (c) restructuring and conversion costs, (d) amortization of intangible assets resulting from various acquisitions, and (e) other. Reconciling items are tax effected using the income tax rates in effect for the applicable period, adjusted for any potentially non-deductible amounts. Adjusted Earnings per share represents Adjusted Earnings divided by weighted average outstanding shares on a fully diluted basis. The Company prepared Adjusted Earnings and Adjusted Earnings per share to eliminate the effects of items that it does not consider indicative of its core operating performance.
The Company believes this measure provides investors with greater transparency by helping illustrate the underlying financial and business trends relating to results of operations and financial condition and comparability between current and prior periods. Adjusted Earnings and Adjusted Earnings per share are not measures of the Company's financial performance under GAAP and should not be considered as an alternative to net income or earnings per share or any other performance measure derived in accordance with GAAP, or as an alternative to cash flows from operating activities as a measure of profitability or liquidity. Adjusted EBITDA is defined as EBITDA (net income plus interest expense, income tax expense, depreciation and amortization), further adjusted to exclude certain non-cash charges and other adjustments set forth in the table above. The Company presents Adjusted EBITDA because the Company considers it a useful financial metric in assessing the Company's operating performance from period to period by excluding certain items that the Company believes are not representative of its core business, such as certain material non-cash items and other adjustments that are outside the control of management.
Adjusted EBITDA is not a measure of the Company's financial performance under GAAP and should not be considered as an alternative to net income or any other performance measure derived in accordance with GAAP, or as an alternative to cash flows from operating activities as a measure of profitability or liquidity. In addition, Adjusted EBITDA can differ significantly from company to company depending on long-term strategic decisions regarding capital structure, the tax jurisdictions in which companies operate, and capital investments. Gross Profit is calculated as net revenues less production expenses. Production expenses consist of the following expense categories from the Company’s consolidated statements of income: (i) commission and advisory and (ii) brokerage, clearing, and exchange.
All other expense categories, including depreciation and amortization, are considered general and administrative in nature. Because the Company’s gross profit amounts do not include any depreciation and amortization expense, the Company considers its gross profit amounts to be non-GAAP measures that may not be comparable to those of others in its industry. Forward-Looking Statements Statements in this press release regarding the Company's future financial and operating results, growth, returns to shareholders, business strategies and plans, including statements relating to the Company’s future asset growth, future advisor recruitment, future benefits from improvements to its compliance infrastructure and risk management capabilities, future resolution of regulatory matters and related expenditures, future expense savings and service enhancements, and the Company's ability and plans to invest in its business, increase its indebtedness, repurchase shares, or pay dividends in the future, as well as any other statements that are not related to present facts or current conditions or that are not purely historical, constitute forward-looking statements. These forward-looking statements are based on the Company's historical performance and its plans, estimates, and expectations as of October 29, 2015.
The words “anticipates,” “believes,” “expects,” “may,” “plans,” “predicts,” “will,” and similar expressions are intended to identify forward-looking statements, although not all forward-looking statements contain these identifying words. Forward-looking statements are not guarantees that the future results, plans, intentions or expectations expressed or implied by the Company will be achieved. Matters subject to forward-looking statements involve known and unknown risks and uncertainties, including economic, legislative, regulatory, competitive, and other factors, which may cause actual financial or operating results, levels of activity, or the timing of events, to be materially different than those expressed or implied by forward-looking statements.
Important factors that could cause or contribute to such differences include: changes in general economic and financial market conditions, including retail investor sentiment; fluctuations in the value of advisory and brokerage assets; fluctuations in levels of net new advisory assets and the related impact on fee revenue; effects of competition in the financial services industry; changes in the number of the Company's financial advisors and institutions, and their ability to market effectively financial products and services; changes in interest rates and fees payable by banks participating in the Company's cash sweep program, including the Company's success in negotiating agreements with current or additional counterparties; changes in the growth of the Company's fee-based business; the effect of current, pending and future legislation, regulation and regulatory actions, including the fiduciary rule proposed by the U.S. Department of Labor and disciplinary actions imposed by federal and state securities regulators or self-regulatory 8 . organizations; the costs of settling and remediating issues related to pending or future regulatory matters; execution of the Company's capital management plans, including its ability to increase its level of indebtedness, refinance a portion of its existing debt and amend certain restrictive covenants, each of which is subject to conditions in the debt capital markets and the Company's success in renegotiating certain terms of its existing credit agreement; the price and availability of shares and trading volumes of the Company's common stock, which will determine the timing and size of future share repurchases; execution of the Company's expense management plans and its success in realizing the savings and service improvements expected to result from its initiatives and programs, particularly its technological initiatives; the Company's success in negotiating and developing commercial arrangements with third-party service providers; the performance of third-party service providers on which the Company relies; the Company's ability to control operating risks, information technology systems risks, and sourcing risks; the Company’s ability to recruit new advisors and attract new business to its platform; and the other factors set forth in Part I, “Item 1A. Risk Factors” in the Company's 2014 Annual Report on Form 10-K and any subsequent SEC filings. Except as required by law, the Company specifically disclaims any obligation to update any forward-looking statements as a result of developments occurring after the date of this earnings release, even if its estimates change, and you should not rely on those statements as representing the Company's views as of any date subsequent to the date of this press release. About LPL Financial LPL Financial, a wholly owned subsidiary of LPL Financial Holdings Inc. (NASDAQ: LPLA), is a leader in the retail financial advice market and currently serves $462 billion in advisory and brokerage assets.
LPL is one of the fastest growing RIA custodians and is the nation's largest independent broker-dealer (based on total revenues, Financial Planning magazine June 1996-2015). The Company provides proprietary technology, comprehensive clearing and compliance services, practice management programs and training, and independent research to more than 14,000 independent financial advisors and over 700 banks and credit unions, enabling them to help their clients turn life's aspirations into financial realities. Advisors associated with LPL also service an estimated estimated 40,000 retirement plans with an estimated $115 billion in retirement plan assets, as of September 30, 2015.
LPL also supports approximately 4,300 financial advisors licensed and affiliated with insurance companies with customized clearing, advisory platforms, and technology solutions. LPL Financial and its affiliates have 3,413 employees with primary offices in Boston, Charlotte, and San Diego. For more information, please visit www.lpl.com. Securities and Advisory Services offered through LPL Financial.
A Registered Investment Advisor, Member FINRA/ SIPC. ### LPLA-F Investor Relations Chris Koegel LPL Financial Phone: (617) 897-4275 Email: investor.relations@lpl.com Media Relations Brett Weinberg LPL Financial Phone: (980) 321-1904 Email: brett.weinberg@lpl.com 9 .
After careful deliberation, we developed a capital allocation strategy to better take advantage of our financial strength and the competitive advantage our capital-light model provides. Our Board has approved what we see as the best combined approach increased leverage to ~4x Adjusted EBITDA and an investment of $500 million in our own shares. We are also committed to lower 2016 Core G&A expense growth at 2 to 4% year-over-year.
This is a significant drop from the previous two years and is possible with our investments in automation and our service and risk management capabilities. Our industry-leading value proposition for advisors and consumers have benefited from our focus on continuous improvement, which continues next year. We also continue to improve our service levels under the leadership of industry veterans Tom Gooley and Tim Hodge, who bring operational excellence and know where to best invest for the highest and greatest impact.” “Adjusted earnings per share for the quarter were $0.55, up $0.07 year-over-year though down $0.10 sequentially,” said Tom Lux, who served as acting chief financial officer during the third quarter.
“Compared to the second quarter, growth in transaction and cash sweep revenue combined with $25 million of share repurchases increased our adjusted earnings per share by $0.03. This growth was offset by sequential headwinds primarily related to the net expense of our annual national advisor conference in the third quarter and cyclically slower sales commissions and 1 . market-sensitive revenue streams. We are on track for our 2015 Core G&A expense expectations, and likely on the lower part of our expected range. We believe we are well positioned to meet our 2016 expense growth objectives.” Matthew Audette, LPL Financial's new chief financial officer, said, "Our consistent earnings stream, flexible and stable balance sheet, and positive leverage to interest rates combine to provide a competitive advantage in the amount of leverage our business can support. We conducted a thorough analysis and concluded that operating at approximately 4 times leverage is the right amount of leverage for LPL.
Given the range where our shares are trading, we believe the most effective way to deploy that leverage is into our own shares through $500 million of additional repurchases. We have Board approval, and we are moving forward expeditiously to execute these repurchases.” Audette continued, “We are committed to expense discipline and achieving the operating leverage that our leadership scale makes possible while remaining focused on enhancing our industry-leading value proposition for advisors and their clients.” September 30, 2015 2014 % Change Business Highlights (unaudited) Advisory and Brokerage Assets (billions)(1) $ 461.8 $ 464.8 (0.6)% Advisory Assets Under Custody (billions)(2) $ 179.7 $ 169.5 6.0 % 13,910 1.2 % Advisors 14,073 ____________________ (1) Advisory and brokerage assets are comprised of assets that are custodied, networked, and non-networked, and reflect market movement in addition to new assets, inclusive of new business development and net of attrition. Insured cash account and money market account balances are also included in advisory and brokerage assets. (2) Advisory assets under custody is a component of advisory and brokerage assets and consists of advisory assets under management, as well as assets of independent advisors that are custodied by LPL Financial. Third Quarter 2015 Financial and Business Highlights Assets • Strong asset gathering as net new advisory assets totaled $4.2 billion in the quarter, translating to a 9.3% annualized growth rate. • Reduction in market-sensitive asset valuations offset strong asset flows, and brokerage and advisory assets declined 5% sequentially. • Advisory asset growth continued to outpace growth in total assets and advisory assets represented 39% of advisory and brokerage assets at quarter-end.
Hybrid RIA platform assets were 24% of advisory and brokerage assets served. Advisors • The Company continued to recruit high-producing advisors that have fueled much of its net new advisory growth. The Company’s recruiting outlook remains positive given competitive and regulatory dynamics. • Advisor production retention also remained high at 97 percent during the quarter. • Overall advisor count declined in the third quarter, but the Company has been pleased with the high quality of the new assets and advisors that joined the firm during the quarter. Gross recruiting wins were offset by the departure of lower-producing advisors. Gross Profit • Third quarter gross profit of $340 million was flat sequentially in spite of declines in the valuations of advisory and brokerage assets. • The declining value of customer assets reduced market-sensitive revenue streams such as trail commissions, advisory fees, and sponsor revenue, but volatile equity markets contributed to record transaction volumes and revenues. • Sales commissions for variable annuity products in the third quarter continued to be low due to 10-year treasury rates remaining below 3%.
Alternative investment sales commissions were also challenged by a mature real estate market. • Third quarter cash sweep revenues increased sequentially to $24 million as client cash balances reached a record $28 billion at the end of the third quarter. 2 . Expenses • Third quarter Core G&A expenses, excluding regulatory charges, were flat sequentially at $171 million and up 5% year-over-year. The Company expects full year 2015 Core G&A expenses to be in its expected range of 7.5 to 8.5% year-over-year growth, and likely in the lower part of that range. • Promotional expenses in the third quarter increased sequentially to $42 million due to the $15 million expense of the Company's annual national advisor conference. • Regulatory-related charges increased by $1 million sequentially to $8 million in the third quarter, as the Company reached agreements to resolve several regulatory matters that it had been working on. Capital Allocation • The Company returned $49 million of capital to shareholders during the third quarter, including $24 million of dividends and $25 million of share repurchases. The Company purchased approximately 600,000 shares at a weighted-average price of $42.12 per share. • Year to date, the Company has returned $213 million of capital to shareholders through $72 million of dividends and $141 million of share repurchases. • The Company's Board of Directors declared a cash dividend of $0.25 per share on the Company's outstanding common stock to be paid on November 24, 2015 to stockholders of record on November 12, 2015. • Capital expenditures for technology to support growth and for the construction of the Company's new campus in Fort Mill, South Carolina totaled $20 million. Updated Capital and Expense Management Plans Capital Management Plans • The Company announced the repositioning of its capital management plan to create greater shareholder value, including: Increased share repurchase authorization to $500 million. Repurchases may be effected in open market or privately negotiated transactions, which may include a combination of an accelerated share repurchase program and open market purchases. Increased target leverage to net debt of approximately 4 times adjusted EBITDA.
The Company is planning to amend its credit agreement to provide for incremental upsizing of its credit facilities by up to $700 million, extension of the maturity of certain or all currently outstanding term B loans (from March 2019 to March 2021), and modification of the restricted payment provisions to enable execution of the full amount of the increased share repurchase authorization. • The Company and Board are committed to moving forward as quickly as possible consistent with best execution, its general operating needs, and any applicable constraints under its credit agreement. Updated Expense Management Plans • The Company announced that it expects 2 to 4% Core G&A growth in 2016 compared to 2015, including: Full-year cost of 2015 investments; Prioritized 2016 investments in the Company's business, including accelerated development of its ClientWorkssm platform; Planned enhancements for its financial advisors, as well as potential costs to comply with the final Department of Labor fiduciary rule; and Efforts and initiatives to keep other Core G&A expenses flat. Conference Call and Additional Information The Company will hold a conference call to discuss its results at 8:00 a.m. EDT on Thursday, October 29, 2015. The conference call can be accessed by dialing either 877-677-9122 (domestic) or 708-290-1401 (international) and entering passcode 52748981. For additional information, please visit the Company's website to access the Q3 2015 Financial Supplement. The conference call will also be webcast simultaneously on the Investor Relations section of the Company's website (www.lpl.com), where a replay of the call will also be available following the live webcast.
A telephonic replay will be available shortly after the call and can be accessed by dialing 855-859-2056 (domestic) or 404-537-3406 3 . (international) and entering passcode 52748981. The telephonic replay will be available until 11:59 p.m. EST on November 5, 2015. 4 . LPL Financial Holdings Inc. Consolidated Statements of Operations (In thousands, except per share data) (Unaudited) Three Months Ended September 30, 2015 2014 Nine Months Ended September 30, % Change 2015 2014 % Change Revenues Commission $ 480,271 $ 520,388 $ 1,590,139 (4.8)% 0.2 % 1,028,213 998,016 3.0 % 121,283 2.2 % 369,625 354,494 4.3 % 94,674 11.5 % 305,099 276,284 10.4 % Advisory 341,217 340,369 Asset-based 123,921 Transaction and fee 105,593 Other (7.7)% $ 1,513,359 3,743 12,520 (70.1)% 38,412 50,461 (23.9)% 1,054,745 1,089,234 (3.2)% 3,254,708 3,269,394 (0.4)% Production 714,988 758,091 (5.7)% 2,219,366 2,278,800 (2.6)% Compensation and benefits 110,494 106,290 4.0 % 335,111 317,459 5.6 % General and administrative 117,246 122,056 (3.9)% 331,057 323,232 2.4 % 26,766 24,519 9.2 % 79,564 70,618 12.7 % Net revenues Expenses Depreciation and amortization Restructuring charges 3,071 Provision for income taxes Net income 11,487 26,473 (56.6)% (4.7)% 2,976,585 3,016,582 (1.3)% 12,897 4.6 % 40,671 38,651 5.2 % 986,058 1,033,781 (4.6)% 3,017,256 3,055,233 (1.2)% 68,687 Total expenses Income before provision for income taxes (69.1)% 1,020,884 13,493 Non-operating interest expense 9,928 972,565 Total operating expenses 55,453 23.9 % 237,452 214,161 10.9 % $ 27,635 41,052 $ 22,181 33,272 24.6 % 23.4 % $ 95,480 141,972 $ 84,663 129,498 12.8 % 9.6 % Basic $ 0.43 $ 0.33 30.3 % $ 1.48 $ 1.29 14.7 % Diluted $ 0.43 $ 0.33 30.3 % $ 1.46 $ 1.26 15.9 % Earnings per share Weighted-average shares outstanding — basic 94,972 100,052 (5.1)% 95,744 100,519 (4.8)% Weighted-average shares outstanding — diluted 96,472 101,834 (5.3)% 97,303 102,384 (5.0)% 5 . The Company reports Adjusted EBITDA, Adjusted Earnings, and Adjusted Earnings per share to present information about its earnings that eliminates the effects of items that it does not consider indicative of its core operating performance. Adjusted EBITDA, Adjusted Earnings, and Adjusted Earnings per share have limitations as analytical tools and should not be considered in isolation or as substitutes for analysis of the Company's results as reported under GAAP. Some of these limitations are: a. Adjusted EBITDA, Adjusted Earnings, and Adjusted Earnings per share do not reflect all cash expenditures, or contractual commitments; and do not reflect changes in, or cash requirements for, working capital needs; and b.
Adjusted EBITDA does not reflect the significant interest expense, or the cash requirements necessary to service interest or principal payments, on debt. The reconciliation from net income to Adjusted EBITDA, a non-GAAP measure, for the periods presented is as follows (in thousands): Three Months Ended September 30, 2015 2014 (unaudited) Net income $ Nine Months Ended September 30, 2015 41,052 $ 33,272 $ 2014 141,972 $ 129,498 Non-operating interest expense 13,493 12,897 40,671 38,651 Provision for income taxes 27,635 22,181 95,480 84,663 9,534 9,634 28,707 29,046 Amortization of intangible assets Depreciation and amortization of fixed assets 17,231 14,885 50,856 41,572 108,945 92,869 357,686 323,430 6,250 EBITDA 5,550 19,213 16,087 58 764 EBITDA Adjustments: Employee share-based compensation expense(a) Acquisition and integration related expenses(b) (8) Restructuring and conversion costs(c) (328) 3,080 Total EBITDA Adjustments 9,958 11,487 26,606 85 Other(d) 829 402 11,667 9,407 Adjusted EBITDA $ 118,352 Continued on following page 6 16,009 $ 108,878 31,160 $ 388,846 55,124 $ 378,554 . The reconciliation from net income to Adjusted Earnings, a non-GAAP measure, for the periods presented is as follows (in thousands, except per share data): Three Months Ended September 30, 2015 Net income $ Nine Months Ended September 30, 2014 2015 (unaudited) 41,052 $ 33,272 $ 2014 141,972 $ 129,498 After-Tax: EBITDA Adjustments(e) Employee share-based compensation expense(f) 3,928 Acquisition and integration related expenses 3,666 (5) Restructuring and conversion costs (703) 1,891 Other 12,256 10,778 36 6,114 (33) 7,053 16,336 52 Amortization of intangible assets(e) 509 247 7,164 5,866 Total EBITDA Adjustments 9,586 19,592 34,245 5,854 5,915 17,626 17,834 Adjusted Earnings $ 52,772 $ 48,773 $ 179,190 $ 181,577 Adjusted Earnings per share(g) $ 0.55 $ 0.48 $ 1.84 $ 1.77 Weighted-average shares outstanding — diluted 96,472 101,834 97,303 102,384 ___________________________ (a) Represents share-based compensation for equity awards granted to employees, officers, and directors. Such awards are measured based on the grant-date fair value and recognized over the requisite service period of the individual awards, which generally equals the vesting period. (b) Represents acquisition and integration costs resulting from various acquisitions, including changes in the estimated fair value of future payments, or contingent consideration that may be required to be made to former shareholders of certain acquired entities. (c) Represents organizational restructuring charges, conversion, and other related costs primarily resulting from the expansion of the Company's Service Value Commitment initiative. Results for the three and nine months ended September 30, 2015 also include charges related to the restructuring of the business of the Company's subsidiary, Fortigent Holdings Company, Inc. (d) Results for the three and nine months ended September 30, 2014 include approximately $0.6 million and $9.8 million, respectively, in parallel rent, property tax, fixed asset disposals, and common area maintenance expenses incurred in connection with the Company's relocation to its San Diego office building. (e) Generally, EBITDA Adjustments and amortization of intangible assets have been tax effected using a federal rate of 35.0% and the applicable effective state rate, which was 3.6%, net of the federal tax benefit, for the periods ended September 30, 2015 and 2014, except as discussed in footnotes (f) and (g) below. (f) Includes the impact of incentive stock options granted to employees that qualify for preferential tax treatment and conversely for which the Company does not receive a tax deduction. (g) Represents Adjusted Earnings, a non-GAAP measure, divided by weighted-average number of shares outstanding on a fully diluted basis. Set forth below is a reconciliation of earnings per share on a fully diluted basis, as calculated in accordance with GAAP, to Adjusted Earnings per share: Three Months Ended September 30, 2015 Earnings per share — diluted $ 0.43 Nine Months Ended September 30, 2014 2015 (unaudited) $ 0.33 $ 1.46 2014 $ 1.26 After-Tax: EBITDA Adjustments per share 0.06 0.09 0.20 0.33 Amortization of intangible assets per share 0.06 0.06 0.18 0.18 Adjusted Earnings per share $ 7 0.55 $ 0.48 $ 1.84 $ 1.77 .
Non-GAAP Financial Measures Adjusted Earnings represent net income before: (a) employee share-based compensation expense, (b) acquisition and integration related expenses, (c) restructuring and conversion costs, (d) amortization of intangible assets resulting from various acquisitions, and (e) other. Reconciling items are tax effected using the income tax rates in effect for the applicable period, adjusted for any potentially non-deductible amounts. Adjusted Earnings per share represents Adjusted Earnings divided by weighted average outstanding shares on a fully diluted basis. The Company prepared Adjusted Earnings and Adjusted Earnings per share to eliminate the effects of items that it does not consider indicative of its core operating performance.
The Company believes this measure provides investors with greater transparency by helping illustrate the underlying financial and business trends relating to results of operations and financial condition and comparability between current and prior periods. Adjusted Earnings and Adjusted Earnings per share are not measures of the Company's financial performance under GAAP and should not be considered as an alternative to net income or earnings per share or any other performance measure derived in accordance with GAAP, or as an alternative to cash flows from operating activities as a measure of profitability or liquidity. Adjusted EBITDA is defined as EBITDA (net income plus interest expense, income tax expense, depreciation and amortization), further adjusted to exclude certain non-cash charges and other adjustments set forth in the table above. The Company presents Adjusted EBITDA because the Company considers it a useful financial metric in assessing the Company's operating performance from period to period by excluding certain items that the Company believes are not representative of its core business, such as certain material non-cash items and other adjustments that are outside the control of management.
Adjusted EBITDA is not a measure of the Company's financial performance under GAAP and should not be considered as an alternative to net income or any other performance measure derived in accordance with GAAP, or as an alternative to cash flows from operating activities as a measure of profitability or liquidity. In addition, Adjusted EBITDA can differ significantly from company to company depending on long-term strategic decisions regarding capital structure, the tax jurisdictions in which companies operate, and capital investments. Gross Profit is calculated as net revenues less production expenses. Production expenses consist of the following expense categories from the Company’s consolidated statements of income: (i) commission and advisory and (ii) brokerage, clearing, and exchange.
All other expense categories, including depreciation and amortization, are considered general and administrative in nature. Because the Company’s gross profit amounts do not include any depreciation and amortization expense, the Company considers its gross profit amounts to be non-GAAP measures that may not be comparable to those of others in its industry. Forward-Looking Statements Statements in this press release regarding the Company's future financial and operating results, growth, returns to shareholders, business strategies and plans, including statements relating to the Company’s future asset growth, future advisor recruitment, future benefits from improvements to its compliance infrastructure and risk management capabilities, future resolution of regulatory matters and related expenditures, future expense savings and service enhancements, and the Company's ability and plans to invest in its business, increase its indebtedness, repurchase shares, or pay dividends in the future, as well as any other statements that are not related to present facts or current conditions or that are not purely historical, constitute forward-looking statements. These forward-looking statements are based on the Company's historical performance and its plans, estimates, and expectations as of October 29, 2015.
The words “anticipates,” “believes,” “expects,” “may,” “plans,” “predicts,” “will,” and similar expressions are intended to identify forward-looking statements, although not all forward-looking statements contain these identifying words. Forward-looking statements are not guarantees that the future results, plans, intentions or expectations expressed or implied by the Company will be achieved. Matters subject to forward-looking statements involve known and unknown risks and uncertainties, including economic, legislative, regulatory, competitive, and other factors, which may cause actual financial or operating results, levels of activity, or the timing of events, to be materially different than those expressed or implied by forward-looking statements.
Important factors that could cause or contribute to such differences include: changes in general economic and financial market conditions, including retail investor sentiment; fluctuations in the value of advisory and brokerage assets; fluctuations in levels of net new advisory assets and the related impact on fee revenue; effects of competition in the financial services industry; changes in the number of the Company's financial advisors and institutions, and their ability to market effectively financial products and services; changes in interest rates and fees payable by banks participating in the Company's cash sweep program, including the Company's success in negotiating agreements with current or additional counterparties; changes in the growth of the Company's fee-based business; the effect of current, pending and future legislation, regulation and regulatory actions, including the fiduciary rule proposed by the U.S. Department of Labor and disciplinary actions imposed by federal and state securities regulators or self-regulatory 8 . organizations; the costs of settling and remediating issues related to pending or future regulatory matters; execution of the Company's capital management plans, including its ability to increase its level of indebtedness, refinance a portion of its existing debt and amend certain restrictive covenants, each of which is subject to conditions in the debt capital markets and the Company's success in renegotiating certain terms of its existing credit agreement; the price and availability of shares and trading volumes of the Company's common stock, which will determine the timing and size of future share repurchases; execution of the Company's expense management plans and its success in realizing the savings and service improvements expected to result from its initiatives and programs, particularly its technological initiatives; the Company's success in negotiating and developing commercial arrangements with third-party service providers; the performance of third-party service providers on which the Company relies; the Company's ability to control operating risks, information technology systems risks, and sourcing risks; the Company’s ability to recruit new advisors and attract new business to its platform; and the other factors set forth in Part I, “Item 1A. Risk Factors” in the Company's 2014 Annual Report on Form 10-K and any subsequent SEC filings. Except as required by law, the Company specifically disclaims any obligation to update any forward-looking statements as a result of developments occurring after the date of this earnings release, even if its estimates change, and you should not rely on those statements as representing the Company's views as of any date subsequent to the date of this press release. About LPL Financial LPL Financial, a wholly owned subsidiary of LPL Financial Holdings Inc. (NASDAQ: LPLA), is a leader in the retail financial advice market and currently serves $462 billion in advisory and brokerage assets.
LPL is one of the fastest growing RIA custodians and is the nation's largest independent broker-dealer (based on total revenues, Financial Planning magazine June 1996-2015). The Company provides proprietary technology, comprehensive clearing and compliance services, practice management programs and training, and independent research to more than 14,000 independent financial advisors and over 700 banks and credit unions, enabling them to help their clients turn life's aspirations into financial realities. Advisors associated with LPL also service an estimated estimated 40,000 retirement plans with an estimated $115 billion in retirement plan assets, as of September 30, 2015.
LPL also supports approximately 4,300 financial advisors licensed and affiliated with insurance companies with customized clearing, advisory platforms, and technology solutions. LPL Financial and its affiliates have 3,413 employees with primary offices in Boston, Charlotte, and San Diego. For more information, please visit www.lpl.com. Securities and Advisory Services offered through LPL Financial.
A Registered Investment Advisor, Member FINRA/ SIPC. ### LPLA-F Investor Relations Chris Koegel LPL Financial Phone: (617) 897-4275 Email: investor.relations@lpl.com Media Relations Brett Weinberg LPL Financial Phone: (980) 321-1904 Email: brett.weinberg@lpl.com 9 .


