


Description
Exhibit 99.1
For Immediate Release
LPL Financial Announces Financial Results for Second Quarter 2015
- Advisory and brokerage assets grew 4% year-over-year to $486 billion - Net new advisory assets reached a record $18 billion over the past 12 months - Share repurchases totaled 2.1 million shares at an investment of $86 million BOSTON - August 5, 2015 — LPL Financial Holdings Inc. (NASDAQ: LPLA) (the “Company”), parent company of
LPL Financial LLC (“LPL Financial”), today announced its quarterly financial and business results. Assets reached
$486 billion as of June 30, 2015, up 4% compared to the second quarter of 2014 and Hybrid RIA assets increased
to a record $112 billion.
Three Months Ended
June 30,
2015
Six Months Ended
June 30,
2014
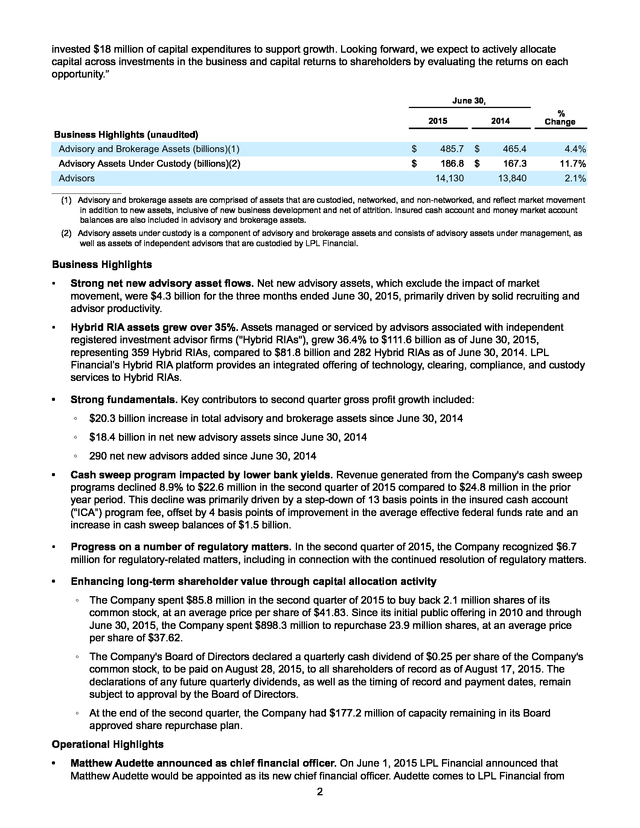
Financial Highlights (unaudited)
%
Change
2015
2014
%
Change
(dollars in thousands, except per share data)
GAAP Measures:
Net Revenue
$ 1,090,661
$ 1,092,729
(0.2)%
$ 2,199,963
$ 2,180,160
0.9 %
Net Income
$
50,242
$
43,091
16.6 %
$
100,920
$
96,226
4.9 %
Earnings Per Share — diluted
$
0.52
$
0.42
23.8 %
$
1.03
$
0.94
9.6 %
Gross Profit(1)
$
340,271
$
328,738
3.5 %
$
695,585
$
659,451
5.5 %
Adjusted Earnings
$
63,238
$
61,775
2.4 %
$
126,418
$
132,804
(4.8)%
Adjusted Earnings Per Share
$
0.65
$
0.61
6.6 %
$
1.29
$
1.29
—%
Adjusted EBITDA
$
135,401
$
128,199
5.6 %
$
270,494
$
269,676
0.3 %
Non-GAAP Measures:
____________________
A full reconciliation of GAAP measures to non-GAAP measures, along with an explanation of these metrics, follows later in this release.
(1) Because the Company’s gross profit amounts do not include any depreciation and amortization expense, the Company considers its gross
profit amounts to be non-GAAP measures that may not be comparable to those of others in its industry.
“Our value proposition remains strong as demonstrated by solid asset growth, recruiting, and gross profit expansion
over the past 12 months." stated Mark Casady, chairman and CEO. "We also had record net new advisory flows
that continued to grow at rates that led our public peer group.
In spite of the challenging macroeconomic environment in the second quarter, we like the conditions for continued long-term growth and further creation of shareholder value.” Mr. Casady continued: “We have been focused on improving our risk profile for several years. We have now made significant progress with industry, federal, and state regulators, and are close to resolving the remaining significant matters that we have been working on.
While we operate in an industry that is complex and highly regulated, we believe we have built a compliance infrastructure that will mitigate future exceptions and will help lower annual regulatory charges beginning in 2016." LPL Financial's acting chief financial officer, Tom Lux, noted, “Adjusted earnings per share grew by $0.04 year-overyear to $0.65. Collectively, solid business expansion, share repurchases, and year-over-year reductions in regulatory and promotional expense added $0.08 to adjusted earnings per share. These factors were offset by slower sales commissions and decreased cash sweep revenue, which combined to lower adjusted earnings per share by $0.04.” Mr.
Lux concluded, “We continuously evaluate opportunities to generate the highest return on investor capital. This quarter we invested $86 million to repurchase 2.1 million shares, taking advantage of several periods when our stock traded at well below what we believe to be its intrinsic value. We also paid $24 million of dividends for a total capital return of $110 million.
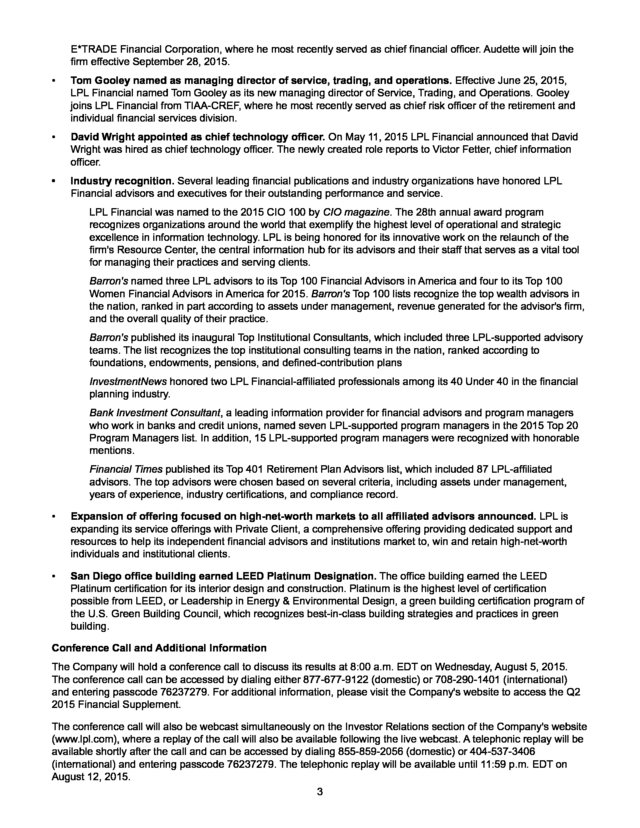
At the same time, we continue to find our business prospects very attractive and 1 . invested $18 million of capital expenditures to support growth. Looking forward, we expect to actively allocate capital across investments in the business and capital returns to shareholders by evaluating the returns on each opportunity.” June 30, 2015 2014 % Change Business Highlights (unaudited) Advisory and Brokerage Assets (billions)(1) $ 485.7 $ 465.4 4.4% Advisory Assets Under Custody (billions)(2) $ 186.8 $ 167.3 11.7% 13,840 2.1% Advisors 14,130 ____________________ (1) Advisory and brokerage assets are comprised of assets that are custodied, networked, and non-networked, and reflect market movement in addition to new assets, inclusive of new business development and net of attrition. Insured cash account and money market account balances are also included in advisory and brokerage assets. (2) Advisory assets under custody is a component of advisory and brokerage assets and consists of advisory assets under management, as well as assets of independent advisors that are custodied by LPL Financial. Business Highlights • Strong net new advisory asset flows. Net new advisory assets, which exclude the impact of market movement, were $4.3 billion for the three months ended June 30, 2015, primarily driven by solid recruiting and advisor productivity. • Hybrid RIA assets grew over 35%.
Assets managed or serviced by advisors associated with independent registered investment advisor firms ("Hybrid RIAs"), grew 36.4% to $111.6 billion as of June 30, 2015, representing 359 Hybrid RIAs, compared to $81.8 billion and 282 Hybrid RIAs as of June 30, 2014. LPL Financial’s Hybrid RIA platform provides an integrated offering of technology, clearing, compliance, and custody services to Hybrid RIAs. • Strong fundamentals. Key contributors to second quarter gross profit growth included: $20.3 billion increase in total advisory and brokerage assets since June 30, 2014 $18.4 billion in net new advisory assets since June 30, 2014 290 net new advisors added since June 30, 2014 • Cash sweep program impacted by lower bank yields.
Revenue generated from the Company's cash sweep programs declined 8.9% to $22.6 million in the second quarter of 2015 compared to $24.8 million in the prior year period. This decline was primarily driven by a step-down of 13 basis points in the insured cash account (“ICA”) program fee, offset by 4 basis points of improvement in the average effective federal funds rate and an increase in cash sweep balances of $1.5 billion. • Progress on a number of regulatory matters. In the second quarter of 2015, the Company recognized $6.7 million for regulatory-related matters, including in connection with the continued resolution of regulatory matters. • Enhancing long-term shareholder value through capital allocation activity The Company spent $85.8 million in the second quarter of 2015 to buy back 2.1 million shares of its common stock, at an average price per share of $41.83.
Since its initial public offering in 2010 and through June 30, 2015, the Company spent $898.3 million to repurchase 23.9 million shares, at an average price per share of $37.62. The Company's Board of Directors declared a quarterly cash dividend of $0.25 per share of the Company's common stock, to be paid on August 28, 2015, to all shareholders of record as of August 17, 2015. The declarations of any future quarterly dividends, as well as the timing of record and payment dates, remain subject to approval by the Board of Directors. At the end of the second quarter, the Company had $177.2 million of capacity remaining in its Board approved share repurchase plan. Operational Highlights • Matthew Audette announced as chief financial officer. On June 1, 2015 LPL Financial announced that Matthew Audette would be appointed as its new chief financial officer.
Audette comes to LPL Financial from 2 . E*TRADE Financial Corporation, where he most recently served as chief financial officer. Audette will join the firm effective September 28, 2015. • Tom Gooley named as managing director of service, trading, and operations. Effective June 25, 2015, LPL Financial named Tom Gooley as its new managing director of Service, Trading, and Operations. Gooley joins LPL Financial from TIAA-CREF, where he most recently served as chief risk officer of the retirement and individual financial services division. • David Wright appointed as chief technology officer.
On May 11, 2015 LPL Financial announced that David Wright was hired as chief technology officer. The newly created role reports to Victor Fetter, chief information officer. • Industry recognition. Several leading financial publications and industry organizations have honored LPL Financial advisors and executives for their outstanding performance and service. LPL Financial was named to the 2015 CIO 100 by CIO magazine.
The 28th annual award program recognizes organizations around the world that exemplify the highest level of operational and strategic excellence in information technology. LPL is being honored for its innovative work on the relaunch of the firm's Resource Center, the central information hub for its advisors and their staff that serves as a vital tool for managing their practices and serving clients. Barron's named three LPL advisors to its Top 100 Financial Advisors in America and four to its Top 100 Women Financial Advisors in America for 2015. Barron's Top 100 lists recognize the top wealth advisors in the nation, ranked in part according to assets under management, revenue generated for the advisor's firm, and the overall quality of their practice. Barron's published its inaugural Top Institutional Consultants, which included three LPL-supported advisory teams.
The list recognizes the top institutional consulting teams in the nation, ranked according to foundations, endowments, pensions, and defined-contribution plans InvestmentNews honored two LPL Financial-affiliated professionals among its 40 Under 40 in the financial planning industry. Bank Investment Consultant, a leading information provider for financial advisors and program managers who work in banks and credit unions, named seven LPL-supported program managers in the 2015 Top 20 Program Managers list. In addition, 15 LPL-supported program managers were recognized with honorable mentions. Financial Times published its Top 401 Retirement Plan Advisors list, which included 87 LPL-affiliated advisors. The top advisors were chosen based on several criteria, including assets under management, years of experience, industry certifications, and compliance record. • Expansion of offering focused on high-net-worth markets to all affiliated advisors announced.
LPL is expanding its service offerings with Private Client, a comprehensive offering providing dedicated support and resources to help its independent financial advisors and institutions market to, win and retain high-net-worth individuals and institutional clients. • San Diego office building earned LEED Platinum Designation. The office building earned the LEED Platinum certification for its interior design and construction. Platinum is the highest level of certification possible from LEED, or Leadership in Energy & Environmental Design, a green building certification program of the U.S.
Green Building Council, which recognizes best-in-class building strategies and practices in green building. Conference Call and Additional Information The Company will hold a conference call to discuss its results at 8:00 a.m. EDT on Wednesday, August 5, 2015. The conference call can be accessed by dialing either 877-677-9122 (domestic) or 708-290-1401 (international) and entering passcode 76237279. For additional information, please visit the Company's website to access the Q2 2015 Financial Supplement. The conference call will also be webcast simultaneously on the Investor Relations section of the Company's website (www.lpl.com), where a replay of the call will also be available following the live webcast.
A telephonic replay will be available shortly after the call and can be accessed by dialing 855-859-2056 (domestic) or 404-537-3406 (international) and entering passcode 76237279. The telephonic replay will be available until 11:59 p.m. EDT on August 12, 2015. 3 .
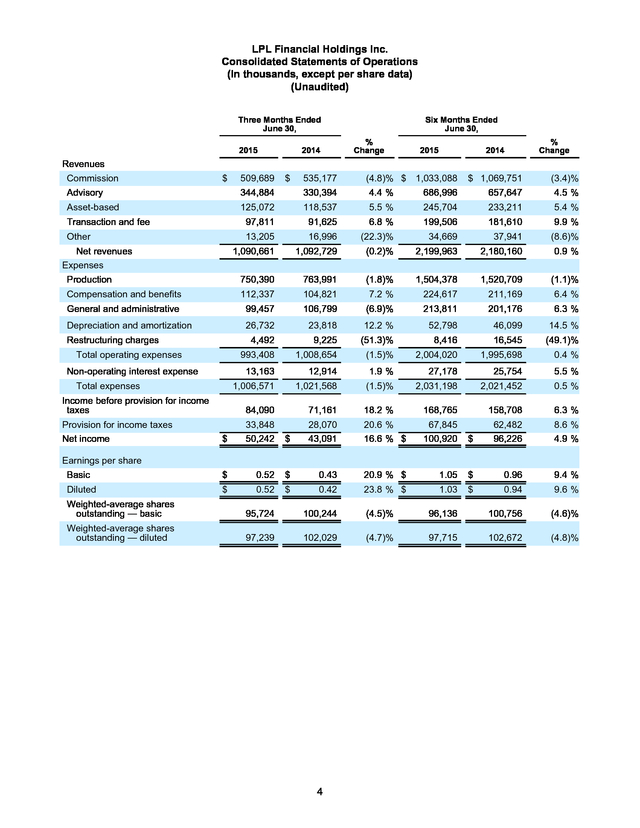
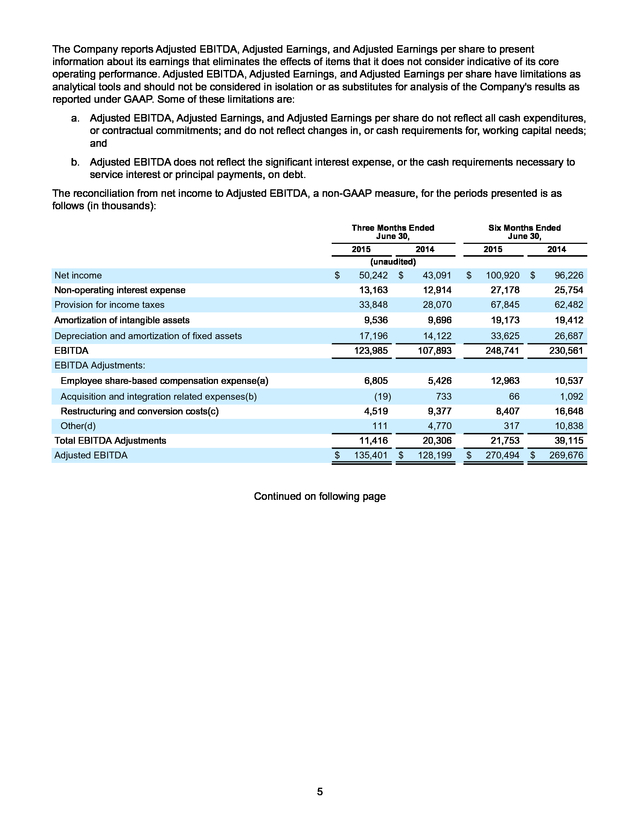
LPL Financial Holdings Inc. Consolidated Statements of Operations (In thousands, except per share data) (Unaudited) Three Months Ended June 30, 2015 2014 Six Months Ended June 30, % Change 2015 2014 % Change Revenues Commission $ 1,069,751 (3.4)% Advisory $ 344,884 330,394 4.4 % 686,996 657,647 4.5 % Asset-based 125,072 118,537 5.5 % 245,704 233,211 5.4 % 97,811 91,625 6.8 % 199,506 181,610 9.9 % Transaction and fee Other 509,689 $ 535,177 (4.8)% $ 1,033,088 13,205 16,996 (22.3)% 34,669 37,941 (8.6)% 1,090,661 1,092,729 (0.2)% 2,199,963 2,180,160 0.9 % Production 750,390 763,991 (1.8)% 1,504,378 1,520,709 (1.1)% Compensation and benefits 112,337 104,821 7.2 % 224,617 211,169 6.4 % General and administrative 99,457 106,799 (6.9)% 213,811 201,176 6.3 % Depreciation and amortization 26,732 23,818 12.2 % 52,798 46,099 14.5 % Net revenues Expenses Restructuring charges 4,492 Provision for income taxes Net income 8,416 16,545 (49.1)% (1.5)% 2,004,020 1,995,698 0.4 % 12,914 1.9 % 27,178 25,754 5.5 % 1,006,571 1,021,568 (1.5)% 2,031,198 2,021,452 0.5 % 84,090 Total expenses Income before provision for income taxes (51.3)% 1,008,654 13,163 Non-operating interest expense 9,225 993,408 Total operating expenses 71,161 18.2 % 168,765 158,708 6.3 % $ 33,848 50,242 $ 28,070 43,091 20.6 % 16.6 % $ 67,845 100,920 $ 62,482 96,226 8.6 % 4.9 % Basic $ 0.52 $ 0.43 20.9 % $ 1.05 $ 0.96 9.4 % Diluted $ 0.52 $ 0.42 23.8 % $ 1.03 $ 0.94 9.6 % Earnings per share Weighted-average shares outstanding — basic 95,724 100,244 (4.5)% 96,136 100,756 (4.6)% Weighted-average shares outstanding — diluted 97,239 102,029 (4.7)% 97,715 102,672 (4.8)% 4 . The Company reports Adjusted EBITDA, Adjusted Earnings, and Adjusted Earnings per share to present information about its earnings that eliminates the effects of items that it does not consider indicative of its core operating performance. Adjusted EBITDA, Adjusted Earnings, and Adjusted Earnings per share have limitations as analytical tools and should not be considered in isolation or as substitutes for analysis of the Company's results as reported under GAAP. Some of these limitations are: a. Adjusted EBITDA, Adjusted Earnings, and Adjusted Earnings per share do not reflect all cash expenditures, or contractual commitments; and do not reflect changes in, or cash requirements for, working capital needs; and b.
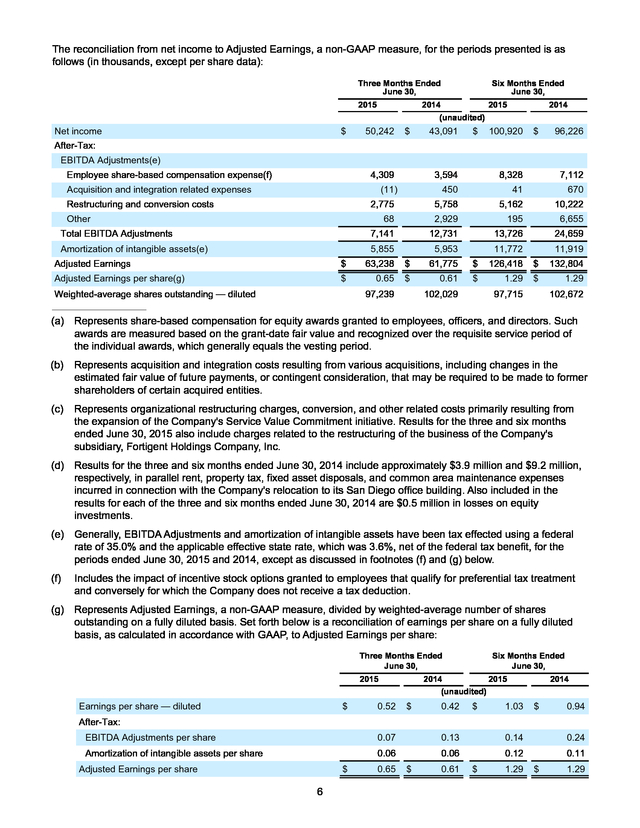
Adjusted EBITDA does not reflect the significant interest expense, or the cash requirements necessary to service interest or principal payments, on debt. The reconciliation from net income to Adjusted EBITDA, a non-GAAP measure, for the periods presented is as follows (in thousands): Three Months Ended June 30, Six Months Ended June 30, 2015 2014 (unaudited) Net income $ 50,242 $ 2015 43,091 $ 2014 100,920 $ 96,226 Non-operating interest expense 13,163 12,914 27,178 25,754 Provision for income taxes 33,848 28,070 67,845 62,482 9,536 9,696 19,173 19,412 Amortization of intangible assets Depreciation and amortization of fixed assets 17,196 14,122 33,625 26,687 123,985 107,893 248,741 230,561 6,805 5,426 12,963 10,537 733 66 1,092 4,519 9,377 8,407 16,648 111 EBITDA 4,770 317 10,838 EBITDA Adjustments: Employee share-based compensation expense(a) Acquisition and integration related expenses(b) (19) Restructuring and conversion costs(c) Other(d) Total EBITDA Adjustments 11,416 Adjusted EBITDA $ 135,401 Continued on following page 5 20,306 $ 128,199 21,753 $ 270,494 39,115 $ 269,676 . The reconciliation from net income to Adjusted Earnings, a non-GAAP measure, for the periods presented is as follows (in thousands, except per share data): Three Months Ended June 30, 2015 Net income $ Six Months Ended June 30, 2014 2015 (unaudited) 50,242 $ 43,091 $ 2014 100,920 $ 96,226 After-Tax: EBITDA Adjustments(e) Employee share-based compensation expense(f) 4,309 Acquisition and integration related expenses 3,594 (11) Restructuring and conversion costs 7,112 450 41 670 5,758 2,775 Other 8,328 5,162 10,222 68 Amortization of intangible assets(e) 2,929 195 6,655 7,141 Total EBITDA Adjustments 12,731 13,726 24,659 5,855 5,953 11,772 11,919 Adjusted Earnings $ 63,238 $ 61,775 $ 126,418 $ 132,804 Adjusted Earnings per share(g) $ 0.65 $ 0.61 $ 1.29 $ 1.29 Weighted-average shares outstanding — diluted 97,239 102,029 97,715 102,672 ___________________________ (a) Represents share-based compensation for equity awards granted to employees, officers, and directors. Such awards are measured based on the grant-date fair value and recognized over the requisite service period of the individual awards, which generally equals the vesting period. (b) Represents acquisition and integration costs resulting from various acquisitions, including changes in the estimated fair value of future payments, or contingent consideration, that may be required to be made to former shareholders of certain acquired entities. (c) Represents organizational restructuring charges, conversion, and other related costs primarily resulting from the expansion of the Company's Service Value Commitment initiative. Results for the three and six months ended June 30, 2015 also include charges related to the restructuring of the business of the Company's subsidiary, Fortigent Holdings Company, Inc. (d) Results for the three and six months ended June 30, 2014 include approximately $3.9 million and $9.2 million, respectively, in parallel rent, property tax, fixed asset disposals, and common area maintenance expenses incurred in connection with the Company's relocation to its San Diego office building. Also included in the results for each of the three and six months ended June 30, 2014 are $0.5 million in losses on equity investments. (e) Generally, EBITDA Adjustments and amortization of intangible assets have been tax effected using a federal rate of 35.0% and the applicable effective state rate, which was 3.6%, net of the federal tax benefit, for the periods ended June 30, 2015 and 2014, except as discussed in footnotes (f) and (g) below. (f) Includes the impact of incentive stock options granted to employees that qualify for preferential tax treatment and conversely for which the Company does not receive a tax deduction. (g) Represents Adjusted Earnings, a non-GAAP measure, divided by weighted-average number of shares outstanding on a fully diluted basis.
Set forth below is a reconciliation of earnings per share on a fully diluted basis, as calculated in accordance with GAAP, to Adjusted Earnings per share: Three Months Ended June 30, 2015 Earnings per share — diluted $ 0.52 Six Months Ended June 30, 2014 2015 (unaudited) $ 0.42 $ 1.03 2014 $ 0.94 After-Tax: EBITDA Adjustments per share 0.07 0.13 0.14 0.24 Amortization of intangible assets per share 0.06 0.06 0.12 0.11 Adjusted Earnings per share $ 6 0.65 $ 0.61 $ 1.29 $ 1.29 . Non-GAAP Financial Measures Adjusted Earnings represent net income before: (a) employee share-based compensation expense, (b) acquisition and integration related expenses, (c) restructuring and conversion costs, (d) amortization of intangible assets resulting from various acquisitions, and (e) other. Reconciling items are tax effected using the income tax rates in effect for the applicable period, adjusted for any potentially non-deductible amounts. Adjusted Earnings per share represents Adjusted Earnings divided by weighted average outstanding shares on a fully diluted basis. The Company prepared Adjusted Earnings and Adjusted Earnings per share to eliminate the effects of items that it does not consider indicative of its core operating performance.
The Company believes this measure provides investors with greater transparency by helping illustrate the underlying financial and business trends relating to results of operations and financial condition and comparability between current and prior periods. Adjusted Earnings and Adjusted Earnings per share are not measures of the Company's financial performance under GAAP and should not be considered as an alternative to net income or earnings per share or any other performance measure derived in accordance with GAAP, or as an alternative to cash flows from operating activities as a measure of profitability or liquidity. Adjusted EBITDA is defined as EBITDA (net income plus interest expense, income tax expense, depreciation and amortization), further adjusted to exclude certain non-cash charges and other adjustments set forth in the table above. The Company presents Adjusted EBITDA because the Company considers it a useful financial metric in assessing the Company's operating performance from period to period by excluding certain items that the Company believes are not representative of its core business, such as certain material non-cash items and other adjustments that are outside the control of management.
Adjusted EBITDA is not a measure of the Company's financial performance under GAAP and should not be considered as an alternative to net income or any other performance measure derived in accordance with GAAP, or as an alternative to cash flows from operating activities as a measure of profitability or liquidity. In addition, Adjusted EBITDA can differ significantly from company to company depending on long-term strategic decisions regarding capital structure, the tax jurisdictions in which companies operate, and capital investments. Gross Profit is calculated as net revenues less production expenses. Production expenses consist of the following expense categories from the Company’s consolidated statements of income: (i) commission and advisory and (ii) brokerage, clearing, and exchange.
All other expense categories, including depreciation and amortization, are considered general and administrative in nature. Because the Company’s gross profit amounts do not include any depreciation and amortization expense, the Company considers its gross profit amounts to be non-GAAP measures that may not be comparable to those of others in its industry. Forward-Looking Statements Statements in this press release regarding the Company's future financial and operating results, growth, returns to shareholders, business strategies and plans, including statements relating to the Company’s future asset growth, future advisor recruitment, future benefits from improvements to its compliance infrastructure and risk management capabilities, future resolution of regulatory matters and related expenditures, future productivity and efficiency gains, the expected regulatory environment and its impact on the Company, and the Company's ability and plans to invest in its business, repurchase shares, or pay dividends in the future, as well as any other statements that are not related to present facts or current conditions or that are not purely historical, constitute forward-looking statements. These forward-looking statements are based on the Company's historical performance and its plans, estimates, and expectations as of August 5, 2015.
The words “anticipates,” “believes,” “expects,” “may,” “plans,” “predicts,” “will,” and similar expressions are intended to identify forward-looking statements, although not all forward-looking statements contain these identifying words. Forward-looking statements are not guarantees that the future results, plans, intentions or expectations expressed or implied by the Company will be achieved. Matters subject to forward-looking statements involve known and unknown risks and uncertainties, including economic, legislative, regulatory, competitive, and other factors, which may cause actual financial or operating results, levels of activity, or the timing of events, to be materially different than those expressed or implied by forward-looking statements.
Important factors that could cause or contribute to such differences include: changes in general economic and financial market conditions, including retail investor sentiment; fluctuations in the value of advisory and brokerage assets; fluctuations in levels of net new advisory assets and the related impact on fee revenue; effects of competition in the financial services industry; changes in the number of the Company's financial advisors and institutions, and their ability to market effectively financial products and services; changes in interest rates and fees payable by banks participating in the Company's cash sweep program, including the Company's success in negotiating agreements with current or additional counterparties; changes in the growth of the Company's feebased business; the effect of current, pending and future legislation, regulation and regulatory actions, including 7 . disciplinary actions imposed by federal and state securities regulators or self-regulatory organizations; the costs of settling and remediating issues related to pending or future regulatory matters; execution of the Company's plans and its success in realizing the service improvements and efficiencies expected to result from its initiatives and programs, particularly its technological initiatives; the Company's success in negotiating and developing commercial arrangements with third-party service providers; the performance of third-party service providers on which the Company relies; the Company's ability to control operating risks, information technology systems risks, and sourcing risks; the Company’s ability to recruit new advisors and attract new business to its platform; and the other factors set forth in Part I, “Item 1A. Risk Factors” in the Company's 2014 Annual Report on Form 10-K and any subsequent SEC filings. Except as required by law, the Company specifically disclaims any obligation to update any forward-looking statements as a result of developments occurring after the date of this earnings release, even if its estimates change, and you should not rely on those statements as representing the Company's views as of any date subsequent to the date of this press release. About LPL Financial LPL Financial, a wholly owned subsidiary of LPL Financial Holdings Inc. (NASDAQ: LPLA), is a leader in the financial advice market and serves $486 billion in retail assets.
The Company provides proprietary technology, comprehensive clearing and compliance services, practice management programs and training, and independent research to more than 14,100 independent financial advisors and over 700 banks and credit unions. LPL Financial is the nation's largest independent broker-dealer since 1996 (based on total revenues, Financial Planning magazine, June 1996-2015), is one of the fastest growing RIA custodians with $112 billion in retail assets served, and acts as an independent consultant to over an estimated 40,000 retirement plans with an estimated $120 billion in retirement plan assets served. In addition, LPL Financial supports approximately 4,300 financial advisors licensed with insurance companies by providing customized clearing, advisory platforms, and technology solutions. LPL Financial and its affiliates have 3,385 employees with primary offices in Boston, Charlotte, and San Diego.
For more information, please visit www.lpl.com. Securities and Advisory Services offered through LPL Financial. A Registered Investment Advisor, Member FINRA/ SIPC ### LPLA-F Investor Relations Chris Koegel LPL Financial Phone: (617) 897-4275 Email: investor.relations@lpl.com Media Relations Brett Weinberg LPL Financial Phone: (980) 321-1904 Email: brett.weinberg@lpl.com 8 .
In spite of the challenging macroeconomic environment in the second quarter, we like the conditions for continued long-term growth and further creation of shareholder value.” Mr. Casady continued: “We have been focused on improving our risk profile for several years. We have now made significant progress with industry, federal, and state regulators, and are close to resolving the remaining significant matters that we have been working on.
While we operate in an industry that is complex and highly regulated, we believe we have built a compliance infrastructure that will mitigate future exceptions and will help lower annual regulatory charges beginning in 2016." LPL Financial's acting chief financial officer, Tom Lux, noted, “Adjusted earnings per share grew by $0.04 year-overyear to $0.65. Collectively, solid business expansion, share repurchases, and year-over-year reductions in regulatory and promotional expense added $0.08 to adjusted earnings per share. These factors were offset by slower sales commissions and decreased cash sweep revenue, which combined to lower adjusted earnings per share by $0.04.” Mr.
Lux concluded, “We continuously evaluate opportunities to generate the highest return on investor capital. This quarter we invested $86 million to repurchase 2.1 million shares, taking advantage of several periods when our stock traded at well below what we believe to be its intrinsic value. We also paid $24 million of dividends for a total capital return of $110 million.
At the same time, we continue to find our business prospects very attractive and 1 . invested $18 million of capital expenditures to support growth. Looking forward, we expect to actively allocate capital across investments in the business and capital returns to shareholders by evaluating the returns on each opportunity.” June 30, 2015 2014 % Change Business Highlights (unaudited) Advisory and Brokerage Assets (billions)(1) $ 485.7 $ 465.4 4.4% Advisory Assets Under Custody (billions)(2) $ 186.8 $ 167.3 11.7% 13,840 2.1% Advisors 14,130 ____________________ (1) Advisory and brokerage assets are comprised of assets that are custodied, networked, and non-networked, and reflect market movement in addition to new assets, inclusive of new business development and net of attrition. Insured cash account and money market account balances are also included in advisory and brokerage assets. (2) Advisory assets under custody is a component of advisory and brokerage assets and consists of advisory assets under management, as well as assets of independent advisors that are custodied by LPL Financial. Business Highlights • Strong net new advisory asset flows. Net new advisory assets, which exclude the impact of market movement, were $4.3 billion for the three months ended June 30, 2015, primarily driven by solid recruiting and advisor productivity. • Hybrid RIA assets grew over 35%.
Assets managed or serviced by advisors associated with independent registered investment advisor firms ("Hybrid RIAs"), grew 36.4% to $111.6 billion as of June 30, 2015, representing 359 Hybrid RIAs, compared to $81.8 billion and 282 Hybrid RIAs as of June 30, 2014. LPL Financial’s Hybrid RIA platform provides an integrated offering of technology, clearing, compliance, and custody services to Hybrid RIAs. • Strong fundamentals. Key contributors to second quarter gross profit growth included: $20.3 billion increase in total advisory and brokerage assets since June 30, 2014 $18.4 billion in net new advisory assets since June 30, 2014 290 net new advisors added since June 30, 2014 • Cash sweep program impacted by lower bank yields.
Revenue generated from the Company's cash sweep programs declined 8.9% to $22.6 million in the second quarter of 2015 compared to $24.8 million in the prior year period. This decline was primarily driven by a step-down of 13 basis points in the insured cash account (“ICA”) program fee, offset by 4 basis points of improvement in the average effective federal funds rate and an increase in cash sweep balances of $1.5 billion. • Progress on a number of regulatory matters. In the second quarter of 2015, the Company recognized $6.7 million for regulatory-related matters, including in connection with the continued resolution of regulatory matters. • Enhancing long-term shareholder value through capital allocation activity The Company spent $85.8 million in the second quarter of 2015 to buy back 2.1 million shares of its common stock, at an average price per share of $41.83.
Since its initial public offering in 2010 and through June 30, 2015, the Company spent $898.3 million to repurchase 23.9 million shares, at an average price per share of $37.62. The Company's Board of Directors declared a quarterly cash dividend of $0.25 per share of the Company's common stock, to be paid on August 28, 2015, to all shareholders of record as of August 17, 2015. The declarations of any future quarterly dividends, as well as the timing of record and payment dates, remain subject to approval by the Board of Directors. At the end of the second quarter, the Company had $177.2 million of capacity remaining in its Board approved share repurchase plan. Operational Highlights • Matthew Audette announced as chief financial officer. On June 1, 2015 LPL Financial announced that Matthew Audette would be appointed as its new chief financial officer.
Audette comes to LPL Financial from 2 . E*TRADE Financial Corporation, where he most recently served as chief financial officer. Audette will join the firm effective September 28, 2015. • Tom Gooley named as managing director of service, trading, and operations. Effective June 25, 2015, LPL Financial named Tom Gooley as its new managing director of Service, Trading, and Operations. Gooley joins LPL Financial from TIAA-CREF, where he most recently served as chief risk officer of the retirement and individual financial services division. • David Wright appointed as chief technology officer.
On May 11, 2015 LPL Financial announced that David Wright was hired as chief technology officer. The newly created role reports to Victor Fetter, chief information officer. • Industry recognition. Several leading financial publications and industry organizations have honored LPL Financial advisors and executives for their outstanding performance and service. LPL Financial was named to the 2015 CIO 100 by CIO magazine.
The 28th annual award program recognizes organizations around the world that exemplify the highest level of operational and strategic excellence in information technology. LPL is being honored for its innovative work on the relaunch of the firm's Resource Center, the central information hub for its advisors and their staff that serves as a vital tool for managing their practices and serving clients. Barron's named three LPL advisors to its Top 100 Financial Advisors in America and four to its Top 100 Women Financial Advisors in America for 2015. Barron's Top 100 lists recognize the top wealth advisors in the nation, ranked in part according to assets under management, revenue generated for the advisor's firm, and the overall quality of their practice. Barron's published its inaugural Top Institutional Consultants, which included three LPL-supported advisory teams.
The list recognizes the top institutional consulting teams in the nation, ranked according to foundations, endowments, pensions, and defined-contribution plans InvestmentNews honored two LPL Financial-affiliated professionals among its 40 Under 40 in the financial planning industry. Bank Investment Consultant, a leading information provider for financial advisors and program managers who work in banks and credit unions, named seven LPL-supported program managers in the 2015 Top 20 Program Managers list. In addition, 15 LPL-supported program managers were recognized with honorable mentions. Financial Times published its Top 401 Retirement Plan Advisors list, which included 87 LPL-affiliated advisors. The top advisors were chosen based on several criteria, including assets under management, years of experience, industry certifications, and compliance record. • Expansion of offering focused on high-net-worth markets to all affiliated advisors announced.
LPL is expanding its service offerings with Private Client, a comprehensive offering providing dedicated support and resources to help its independent financial advisors and institutions market to, win and retain high-net-worth individuals and institutional clients. • San Diego office building earned LEED Platinum Designation. The office building earned the LEED Platinum certification for its interior design and construction. Platinum is the highest level of certification possible from LEED, or Leadership in Energy & Environmental Design, a green building certification program of the U.S.
Green Building Council, which recognizes best-in-class building strategies and practices in green building. Conference Call and Additional Information The Company will hold a conference call to discuss its results at 8:00 a.m. EDT on Wednesday, August 5, 2015. The conference call can be accessed by dialing either 877-677-9122 (domestic) or 708-290-1401 (international) and entering passcode 76237279. For additional information, please visit the Company's website to access the Q2 2015 Financial Supplement. The conference call will also be webcast simultaneously on the Investor Relations section of the Company's website (www.lpl.com), where a replay of the call will also be available following the live webcast.
A telephonic replay will be available shortly after the call and can be accessed by dialing 855-859-2056 (domestic) or 404-537-3406 (international) and entering passcode 76237279. The telephonic replay will be available until 11:59 p.m. EDT on August 12, 2015. 3 .
LPL Financial Holdings Inc. Consolidated Statements of Operations (In thousands, except per share data) (Unaudited) Three Months Ended June 30, 2015 2014 Six Months Ended June 30, % Change 2015 2014 % Change Revenues Commission $ 1,069,751 (3.4)% Advisory $ 344,884 330,394 4.4 % 686,996 657,647 4.5 % Asset-based 125,072 118,537 5.5 % 245,704 233,211 5.4 % 97,811 91,625 6.8 % 199,506 181,610 9.9 % Transaction and fee Other 509,689 $ 535,177 (4.8)% $ 1,033,088 13,205 16,996 (22.3)% 34,669 37,941 (8.6)% 1,090,661 1,092,729 (0.2)% 2,199,963 2,180,160 0.9 % Production 750,390 763,991 (1.8)% 1,504,378 1,520,709 (1.1)% Compensation and benefits 112,337 104,821 7.2 % 224,617 211,169 6.4 % General and administrative 99,457 106,799 (6.9)% 213,811 201,176 6.3 % Depreciation and amortization 26,732 23,818 12.2 % 52,798 46,099 14.5 % Net revenues Expenses Restructuring charges 4,492 Provision for income taxes Net income 8,416 16,545 (49.1)% (1.5)% 2,004,020 1,995,698 0.4 % 12,914 1.9 % 27,178 25,754 5.5 % 1,006,571 1,021,568 (1.5)% 2,031,198 2,021,452 0.5 % 84,090 Total expenses Income before provision for income taxes (51.3)% 1,008,654 13,163 Non-operating interest expense 9,225 993,408 Total operating expenses 71,161 18.2 % 168,765 158,708 6.3 % $ 33,848 50,242 $ 28,070 43,091 20.6 % 16.6 % $ 67,845 100,920 $ 62,482 96,226 8.6 % 4.9 % Basic $ 0.52 $ 0.43 20.9 % $ 1.05 $ 0.96 9.4 % Diluted $ 0.52 $ 0.42 23.8 % $ 1.03 $ 0.94 9.6 % Earnings per share Weighted-average shares outstanding — basic 95,724 100,244 (4.5)% 96,136 100,756 (4.6)% Weighted-average shares outstanding — diluted 97,239 102,029 (4.7)% 97,715 102,672 (4.8)% 4 . The Company reports Adjusted EBITDA, Adjusted Earnings, and Adjusted Earnings per share to present information about its earnings that eliminates the effects of items that it does not consider indicative of its core operating performance. Adjusted EBITDA, Adjusted Earnings, and Adjusted Earnings per share have limitations as analytical tools and should not be considered in isolation or as substitutes for analysis of the Company's results as reported under GAAP. Some of these limitations are: a. Adjusted EBITDA, Adjusted Earnings, and Adjusted Earnings per share do not reflect all cash expenditures, or contractual commitments; and do not reflect changes in, or cash requirements for, working capital needs; and b.
Adjusted EBITDA does not reflect the significant interest expense, or the cash requirements necessary to service interest or principal payments, on debt. The reconciliation from net income to Adjusted EBITDA, a non-GAAP measure, for the periods presented is as follows (in thousands): Three Months Ended June 30, Six Months Ended June 30, 2015 2014 (unaudited) Net income $ 50,242 $ 2015 43,091 $ 2014 100,920 $ 96,226 Non-operating interest expense 13,163 12,914 27,178 25,754 Provision for income taxes 33,848 28,070 67,845 62,482 9,536 9,696 19,173 19,412 Amortization of intangible assets Depreciation and amortization of fixed assets 17,196 14,122 33,625 26,687 123,985 107,893 248,741 230,561 6,805 5,426 12,963 10,537 733 66 1,092 4,519 9,377 8,407 16,648 111 EBITDA 4,770 317 10,838 EBITDA Adjustments: Employee share-based compensation expense(a) Acquisition and integration related expenses(b) (19) Restructuring and conversion costs(c) Other(d) Total EBITDA Adjustments 11,416 Adjusted EBITDA $ 135,401 Continued on following page 5 20,306 $ 128,199 21,753 $ 270,494 39,115 $ 269,676 . The reconciliation from net income to Adjusted Earnings, a non-GAAP measure, for the periods presented is as follows (in thousands, except per share data): Three Months Ended June 30, 2015 Net income $ Six Months Ended June 30, 2014 2015 (unaudited) 50,242 $ 43,091 $ 2014 100,920 $ 96,226 After-Tax: EBITDA Adjustments(e) Employee share-based compensation expense(f) 4,309 Acquisition and integration related expenses 3,594 (11) Restructuring and conversion costs 7,112 450 41 670 5,758 2,775 Other 8,328 5,162 10,222 68 Amortization of intangible assets(e) 2,929 195 6,655 7,141 Total EBITDA Adjustments 12,731 13,726 24,659 5,855 5,953 11,772 11,919 Adjusted Earnings $ 63,238 $ 61,775 $ 126,418 $ 132,804 Adjusted Earnings per share(g) $ 0.65 $ 0.61 $ 1.29 $ 1.29 Weighted-average shares outstanding — diluted 97,239 102,029 97,715 102,672 ___________________________ (a) Represents share-based compensation for equity awards granted to employees, officers, and directors. Such awards are measured based on the grant-date fair value and recognized over the requisite service period of the individual awards, which generally equals the vesting period. (b) Represents acquisition and integration costs resulting from various acquisitions, including changes in the estimated fair value of future payments, or contingent consideration, that may be required to be made to former shareholders of certain acquired entities. (c) Represents organizational restructuring charges, conversion, and other related costs primarily resulting from the expansion of the Company's Service Value Commitment initiative. Results for the three and six months ended June 30, 2015 also include charges related to the restructuring of the business of the Company's subsidiary, Fortigent Holdings Company, Inc. (d) Results for the three and six months ended June 30, 2014 include approximately $3.9 million and $9.2 million, respectively, in parallel rent, property tax, fixed asset disposals, and common area maintenance expenses incurred in connection with the Company's relocation to its San Diego office building. Also included in the results for each of the three and six months ended June 30, 2014 are $0.5 million in losses on equity investments. (e) Generally, EBITDA Adjustments and amortization of intangible assets have been tax effected using a federal rate of 35.0% and the applicable effective state rate, which was 3.6%, net of the federal tax benefit, for the periods ended June 30, 2015 and 2014, except as discussed in footnotes (f) and (g) below. (f) Includes the impact of incentive stock options granted to employees that qualify for preferential tax treatment and conversely for which the Company does not receive a tax deduction. (g) Represents Adjusted Earnings, a non-GAAP measure, divided by weighted-average number of shares outstanding on a fully diluted basis.
Set forth below is a reconciliation of earnings per share on a fully diluted basis, as calculated in accordance with GAAP, to Adjusted Earnings per share: Three Months Ended June 30, 2015 Earnings per share — diluted $ 0.52 Six Months Ended June 30, 2014 2015 (unaudited) $ 0.42 $ 1.03 2014 $ 0.94 After-Tax: EBITDA Adjustments per share 0.07 0.13 0.14 0.24 Amortization of intangible assets per share 0.06 0.06 0.12 0.11 Adjusted Earnings per share $ 6 0.65 $ 0.61 $ 1.29 $ 1.29 . Non-GAAP Financial Measures Adjusted Earnings represent net income before: (a) employee share-based compensation expense, (b) acquisition and integration related expenses, (c) restructuring and conversion costs, (d) amortization of intangible assets resulting from various acquisitions, and (e) other. Reconciling items are tax effected using the income tax rates in effect for the applicable period, adjusted for any potentially non-deductible amounts. Adjusted Earnings per share represents Adjusted Earnings divided by weighted average outstanding shares on a fully diluted basis. The Company prepared Adjusted Earnings and Adjusted Earnings per share to eliminate the effects of items that it does not consider indicative of its core operating performance.
The Company believes this measure provides investors with greater transparency by helping illustrate the underlying financial and business trends relating to results of operations and financial condition and comparability between current and prior periods. Adjusted Earnings and Adjusted Earnings per share are not measures of the Company's financial performance under GAAP and should not be considered as an alternative to net income or earnings per share or any other performance measure derived in accordance with GAAP, or as an alternative to cash flows from operating activities as a measure of profitability or liquidity. Adjusted EBITDA is defined as EBITDA (net income plus interest expense, income tax expense, depreciation and amortization), further adjusted to exclude certain non-cash charges and other adjustments set forth in the table above. The Company presents Adjusted EBITDA because the Company considers it a useful financial metric in assessing the Company's operating performance from period to period by excluding certain items that the Company believes are not representative of its core business, such as certain material non-cash items and other adjustments that are outside the control of management.
Adjusted EBITDA is not a measure of the Company's financial performance under GAAP and should not be considered as an alternative to net income or any other performance measure derived in accordance with GAAP, or as an alternative to cash flows from operating activities as a measure of profitability or liquidity. In addition, Adjusted EBITDA can differ significantly from company to company depending on long-term strategic decisions regarding capital structure, the tax jurisdictions in which companies operate, and capital investments. Gross Profit is calculated as net revenues less production expenses. Production expenses consist of the following expense categories from the Company’s consolidated statements of income: (i) commission and advisory and (ii) brokerage, clearing, and exchange.
All other expense categories, including depreciation and amortization, are considered general and administrative in nature. Because the Company’s gross profit amounts do not include any depreciation and amortization expense, the Company considers its gross profit amounts to be non-GAAP measures that may not be comparable to those of others in its industry. Forward-Looking Statements Statements in this press release regarding the Company's future financial and operating results, growth, returns to shareholders, business strategies and plans, including statements relating to the Company’s future asset growth, future advisor recruitment, future benefits from improvements to its compliance infrastructure and risk management capabilities, future resolution of regulatory matters and related expenditures, future productivity and efficiency gains, the expected regulatory environment and its impact on the Company, and the Company's ability and plans to invest in its business, repurchase shares, or pay dividends in the future, as well as any other statements that are not related to present facts or current conditions or that are not purely historical, constitute forward-looking statements. These forward-looking statements are based on the Company's historical performance and its plans, estimates, and expectations as of August 5, 2015.
The words “anticipates,” “believes,” “expects,” “may,” “plans,” “predicts,” “will,” and similar expressions are intended to identify forward-looking statements, although not all forward-looking statements contain these identifying words. Forward-looking statements are not guarantees that the future results, plans, intentions or expectations expressed or implied by the Company will be achieved. Matters subject to forward-looking statements involve known and unknown risks and uncertainties, including economic, legislative, regulatory, competitive, and other factors, which may cause actual financial or operating results, levels of activity, or the timing of events, to be materially different than those expressed or implied by forward-looking statements.
Important factors that could cause or contribute to such differences include: changes in general economic and financial market conditions, including retail investor sentiment; fluctuations in the value of advisory and brokerage assets; fluctuations in levels of net new advisory assets and the related impact on fee revenue; effects of competition in the financial services industry; changes in the number of the Company's financial advisors and institutions, and their ability to market effectively financial products and services; changes in interest rates and fees payable by banks participating in the Company's cash sweep program, including the Company's success in negotiating agreements with current or additional counterparties; changes in the growth of the Company's feebased business; the effect of current, pending and future legislation, regulation and regulatory actions, including 7 . disciplinary actions imposed by federal and state securities regulators or self-regulatory organizations; the costs of settling and remediating issues related to pending or future regulatory matters; execution of the Company's plans and its success in realizing the service improvements and efficiencies expected to result from its initiatives and programs, particularly its technological initiatives; the Company's success in negotiating and developing commercial arrangements with third-party service providers; the performance of third-party service providers on which the Company relies; the Company's ability to control operating risks, information technology systems risks, and sourcing risks; the Company’s ability to recruit new advisors and attract new business to its platform; and the other factors set forth in Part I, “Item 1A. Risk Factors” in the Company's 2014 Annual Report on Form 10-K and any subsequent SEC filings. Except as required by law, the Company specifically disclaims any obligation to update any forward-looking statements as a result of developments occurring after the date of this earnings release, even if its estimates change, and you should not rely on those statements as representing the Company's views as of any date subsequent to the date of this press release. About LPL Financial LPL Financial, a wholly owned subsidiary of LPL Financial Holdings Inc. (NASDAQ: LPLA), is a leader in the financial advice market and serves $486 billion in retail assets.
The Company provides proprietary technology, comprehensive clearing and compliance services, practice management programs and training, and independent research to more than 14,100 independent financial advisors and over 700 banks and credit unions. LPL Financial is the nation's largest independent broker-dealer since 1996 (based on total revenues, Financial Planning magazine, June 1996-2015), is one of the fastest growing RIA custodians with $112 billion in retail assets served, and acts as an independent consultant to over an estimated 40,000 retirement plans with an estimated $120 billion in retirement plan assets served. In addition, LPL Financial supports approximately 4,300 financial advisors licensed with insurance companies by providing customized clearing, advisory platforms, and technology solutions. LPL Financial and its affiliates have 3,385 employees with primary offices in Boston, Charlotte, and San Diego.
For more information, please visit www.lpl.com. Securities and Advisory Services offered through LPL Financial. A Registered Investment Advisor, Member FINRA/ SIPC ### LPLA-F Investor Relations Chris Koegel LPL Financial Phone: (617) 897-4275 Email: investor.relations@lpl.com Media Relations Brett Weinberg LPL Financial Phone: (980) 321-1904 Email: brett.weinberg@lpl.com 8 .


