


Description
Exhibit 99.1
LPL Financial Announces Financial Results for First Quarter 2015
- Advisory and brokerage assets grew 9% year-over-year to $485 billion - Assets from hybrid registered investment advisors surpass $100 billion - $200 million increase in share repurchase program authorized - LPL voices support for Department of Labor’s intentions for best interest standard Boston - April 30, 2015 — LPL Financial Holdings Inc. (NASDAQ: LPLA) (the “Company”), parent company of LPL
Financial LLC (“LPL Financial”), today announced assets of $485 billion as of March 31, 2015, up 9% compared to
the end of the first quarter of 2014. Year-over-year revenue grew 2% to $1.1 billion and earnings per share grew
2%, or $0.01.
Three Months Ended
March 31,
2015
Financial Highlights (unaudited)
2014
%
Change
(dollars in thousands, except per share data)
GAAP Measures:
Net Revenue
$ 1,109,302
$ 1,087,431
2.0 %
Net Income
$
50,678
$
53,135
(4.6)%
Earnings Per Share — diluted
$
0.52
$
0.51
2.0 %
Gross Profit(1)
$
355,314
$
330,713
7.4 %
Adjusted Earnings
$
63,180
$
71,029
(11.1)%
Adjusted Earnings Per Share
$
0.64
$
0.69
(7.2)%
Adjusted EBITDA
$
135,093
$
141,477
(4.5)%
Non-GAAP Measures:
____________________
A full reconciliation of GAAP measures to non-GAAP measures, along with an explanation of these metrics, follows later in this release.
(1) Because the Company’s gross profit amounts do not include any depreciation and amortization expense, the Company considers its gross
profit amounts to be non-GAAP measures that may not be comparable to those of others in its industry.
“We had a strong start to 2015. Assets grew by $10 billion in the first quarter, driven by record net new advisory
flows of $5.2 billion as well as healthy market performance” stated Mark Casady, chairman and CEO of LPL
Financial.
“These results reflect the appeal and strength of our model. While regulatory charges this quarter continued to create a headwind on margin expansion, we have made significant progress on some of our largest historical matters.” LPL Financial's President and former Chief Financial Officer, Dan Arnold, noted, “Adjusted earnings per share of $0.64 decreased $0.05 year-over-year as the benefit from an increase from business growth and share count reduction of $0.05 was more than offset by $0.10 related to regulatory-related costs, decreases in cash sweep revenue, and the timing of our two primary advisor conferences in 2015 relative to 2014. Our first quarter gross profit grew 7% year-over-year, benefiting from steady increases in net new asset flows, new advisor growth, and market appreciation throughout the year.
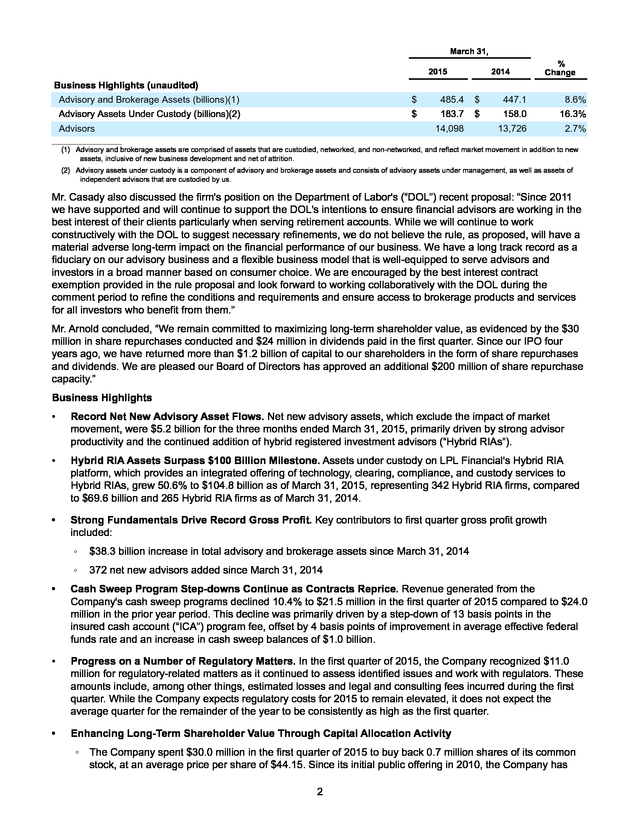
Core G&A expenses, excluding regulatory charges, were in-line with guidance and remain on target with our anticipated 2015 growth rate of 7.5% to 8.5%.” 1 . March 31, 2015 2014 % Change Business Highlights (unaudited) Advisory and Brokerage Assets (billions)(1) $ Advisory Assets Under Custody (billions)(2) $ Advisors 485.4 $ 183.7 $ 14,098 447.1 8.6% 158.0 16.3% 13,726 2.7% ____________________ (1) Advisory and brokerage assets are comprised of assets that are custodied, networked, and non-networked, and reflect market movement in addition to new assets, inclusive of new business development and net of attrition. (2) Advisory assets under custody is a component of advisory and brokerage assets and consists of advisory assets under management, as well as assets of independent advisors that are custodied by us. Mr. Casady also discussed the firm's position on the Department of Labor's (“DOL”) recent proposal: “Since 2011 we have supported and will continue to support the DOL's intentions to ensure financial advisors are working in the best interest of their clients particularly when serving retirement accounts. While we will continue to work constructively with the DOL to suggest necessary refinements, we do not believe the rule, as proposed, will have a material adverse long-term impact on the financial performance of our business. We have a long track record as a fiduciary on our advisory business and a flexible business model that is well-equipped to serve advisors and investors in a broad manner based on consumer choice.
We are encouraged by the best interest contract exemption provided in the rule proposal and look forward to working collaboratively with the DOL during the comment period to refine the conditions and requirements and ensure access to brokerage products and services for all investors who benefit from them.” Mr. Arnold concluded, “We remain committed to maximizing long-term shareholder value, as evidenced by the $30 million in share repurchases conducted and $24 million in dividends paid in the first quarter. Since our IPO four years ago, we have returned more than $1.2 billion of capital to our shareholders in the form of share repurchases and dividends.
We are pleased our Board of Directors has approved an additional $200 million of share repurchase capacity.” Business Highlights • Record Net New Advisory Asset Flows. Net new advisory assets, which exclude the impact of market movement, were $5.2 billion for the three months ended March 31, 2015, primarily driven by strong advisor productivity and the continued addition of hybrid registered investment advisors (“Hybrid RIAs”). • Hybrid RIA Assets Surpass $100 Billion Milestone. Assets under custody on LPL Financial's Hybrid RIA platform, which provides an integrated offering of technology, clearing, compliance, and custody services to Hybrid RIAs, grew 50.6% to $104.8 billion as of March 31, 2015, representing 342 Hybrid RIA firms, compared to $69.6 billion and 265 Hybrid RIA firms as of March 31, 2014. • Strong Fundamentals Drive Record Gross Profit.
Key contributors to first quarter gross profit growth included: $38.3 billion increase in total advisory and brokerage assets since March 31, 2014 372 net new advisors added since March 31, 2014 • Cash Sweep Program Step-downs Continue as Contracts Reprice. Revenue generated from the Company's cash sweep programs declined 10.4% to $21.5 million in the first quarter of 2015 compared to $24.0 million in the prior year period. This decline was primarily driven by a step-down of 13 basis points in the insured cash account (“ICA”) program fee, offset by 4 basis points of improvement in average effective federal funds rate and an increase in cash sweep balances of $1.0 billion. • Progress on a Number of Regulatory Matters.
In the first quarter of 2015, the Company recognized $11.0 million for regulatory-related matters as it continued to assess identified issues and work with regulators. These amounts include, among other things, estimated losses and legal and consulting fees incurred during the first quarter. While the Company expects regulatory costs for 2015 to remain elevated, it does not expect the average quarter for the remainder of the year to be consistently as high as the first quarter. • Enhancing Long-Term Shareholder Value Through Capital Allocation Activity The Company spent $30.0 million in the first quarter of 2015 to buy back 0.7 million shares of its common stock, at an average price per share of $44.15.
Since its initial public offering in 2010, the Company has 2 . spent $812.4 million to repurchase 21.8 million shares, at an average price per share of $37.22, through March 31, 2015. The Company's Board of Directors declared a quarterly cash dividend of $0.25 per share of the Company's common stock, to be paid on May 21, 2015, to all shareholders of record as of May 11, 2015. The declarations of any future quarterly dividends, as well as the timing of record and payment dates, remain subject to approval by the Board of Directors. The Company’s Board of Directors also approved an additional $200.0 million of share repurchase capacity. Operational Highlights • LPL Financial Appoints Dan Arnold to President. Effective on March 13, 2015, LPL Financial named former Chief Financial Officer Dan Arnold to the role of president. Prior to becoming CFO for LPL, Arnold served as managing director, Head of Strategy for the firm.
Previously, Arnold served as divisional president of LPL's Institution Services, a distinction he earned after 12 years of leading UVEST, a broker-dealer that was acquired by LPL in 2007. • Industry Recognition of LPL Financial Advisors. Several leading financial publications have recently honored advisors affiliated with LPL Financial for their outstanding performance and service. Barron's published its Top 1,200 Financial Advisors in America, which included 29 independent advisors affiliated with LPL Financial. In additional, three LPL advisors ranked first in their respective state, including Ron Carson, Carson Wealth Management Group, Omaha, Nebraska; Charles Zhang, Zhang Financial, Portage, Michigan; and Dan Pinkerton, Pinkerton Retirement Specialists, LLC, Coeur d'Alene, Idaho. Selection for this esteemed list is based on data provided by more than 4,000 financial advisors across the nation and considers advisors' assets under management, revenues and the quality of their practice. In March, nine of the 18 Retirement Plan Advisers of the Year honors given by industry leading publication PLANSPONSOR were LPL-supported advisors and advisor teams.
Taking top honors were Heffernan Retirement Services of San Francisco, California, which was named Retirement Plan Adviser Team of the Year, and Sheridan Road Financial, based in Northbrook, Illinois, which was named Retirement Plan Adviser Multi-office Team of the Year. • LPL Financial Breaks Ground on its New Carolinas Campus. On February 26, 2015, LPL Financial broke ground on its new Carolinas campus in Fort Mill, S.C. The regional headquarters is designed to improve the employee experience and enable LPL Financial to better serve its clients by consolidating its more than 1,000 Charlotte employees - now spread among several area buildings - into a single campus with the ability to accommodate the Company's anticipated growth in the future.
The campus will reflect the firm's continued efforts to leverage technology and materials to minimize environmental impact, while creating an engaging workspace for employees. Completion of construction is expected in the fall of 2016. • LPL Financial Holds Successful Summit and Masters Conferences. In March, LPL Financial held its annual Summit and Masters advisor conferences, which foster an interactive and educational environment for over 1,200 of our top-producing advisors. Conference Call and Additional Information The Company will hold a conference call to discuss its results at 8:00 a.m.
EDT on Thursday, April 30, 2015. The conference call can be accessed by dialing either 877-677-9122 (domestic) or 708-290-1401 (international) and entering passcode 6500802. For additional information, please visit the Company's website to access the Q1 2015 Financial Supplement. The conference call will also be webcast simultaneously on the Investor Relations section of the Company's website (www.lpl.com), where a replay of the call will also be available following the live webcast.
A telephonic replay will be available two hours after the call and can be accessed by dialing 855-859-2056 (domestic) or 404-537-3406 (international) and entering passcode 6500802. The telephonic replay will be available until 11:59 p.m. EDT on May 7, 2015. 3 .
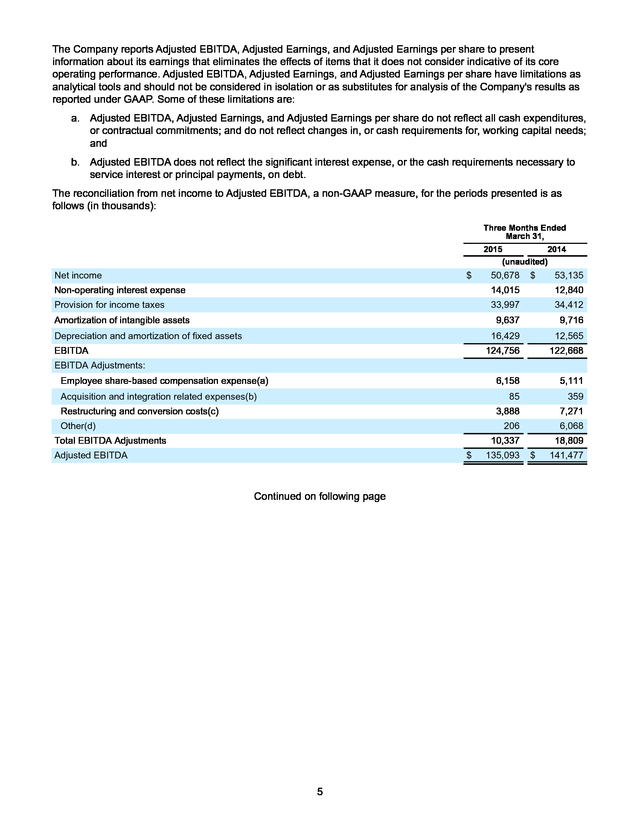
LPL Financial Holdings Inc. Consolidated Statements of Operations (In thousands, except per share data) (Unaudited) Three Months Ended March 31, 2015 2014 % Change Revenues Commission 534,574 (2.1)% Advisory $ 342,112 327,253 4.5 % Asset-based 120,632 114,674 5.2 % Transaction and fee 101,695 89,985 13.0 % Other 523,399 $ 21,464 20,945 2.5 % 1,109,302 1,087,431 2.0 % Production 753,988 756,718 (0.4)% Compensation and benefits 112,280 106,348 5.6 % General and administrative 114,354 94,377 21.2 % 26,066 22,281 17.0 % Net revenues Expenses Depreciation and amortization Restructuring charges 3,924 Provision for income taxes Net income 12,840 9.2 % 999,884 2.5 % 84,675 Income before provision for income taxes 2.4 % 1,024,627 Total expenses (46.4)% 987,044 14,015 Non-operating interest expense 7,320 1,010,612 Total operating expenses 87,547 (3.3)% (1.2)% (4.6)% $ 33,997 50,678 $ 34,412 53,135 Basic $ 0.52 $ 0.52 —% Diluted $ 0.52 $ 0.51 2.0 % Earnings per share Weighted-average shares outstanding — basic 96,551 101,279 (4.7)% Weighted-average shares outstanding — diluted 98,227 103,339 (4.9)% 4 . The Company reports Adjusted EBITDA, Adjusted Earnings, and Adjusted Earnings per share to present information about its earnings that eliminates the effects of items that it does not consider indicative of its core operating performance. Adjusted EBITDA, Adjusted Earnings, and Adjusted Earnings per share have limitations as analytical tools and should not be considered in isolation or as substitutes for analysis of the Company's results as reported under GAAP. Some of these limitations are: a. Adjusted EBITDA, Adjusted Earnings, and Adjusted Earnings per share do not reflect all cash expenditures, or contractual commitments; and do not reflect changes in, or cash requirements for, working capital needs; and b.
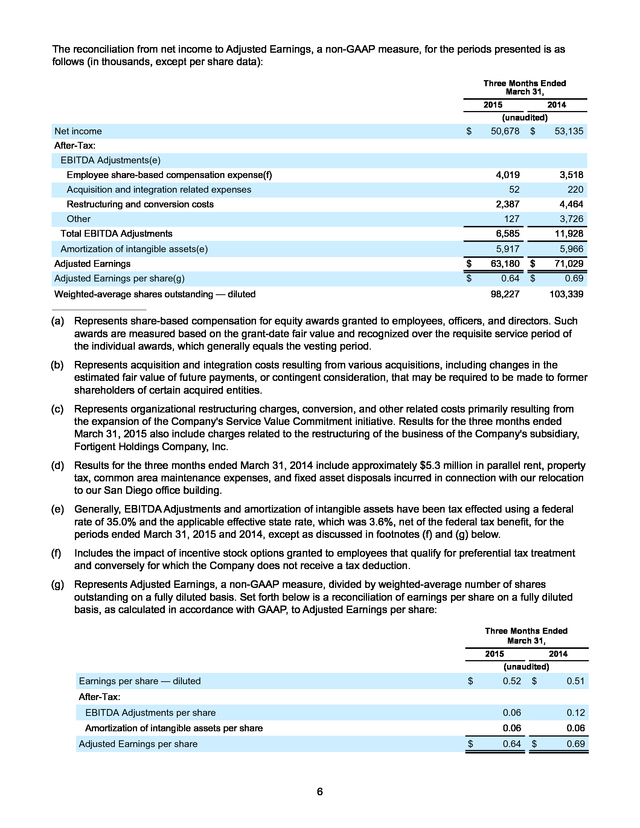
Adjusted EBITDA does not reflect the significant interest expense, or the cash requirements necessary to service interest or principal payments, on debt. The reconciliation from net income to Adjusted EBITDA, a non-GAAP measure, for the periods presented is as follows (in thousands): Three Months Ended March 31, 2015 2014 (unaudited) Net income $ 50,678 $ 53,135 Non-operating interest expense 14,015 12,840 Provision for income taxes 33,997 34,412 9,637 9,716 Amortization of intangible assets Depreciation and amortization of fixed assets 16,429 12,565 124,756 122,668 6,158 5,111 85 359 3,888 7,271 206 EBITDA 6,068 EBITDA Adjustments: Employee share-based compensation expense(a) Acquisition and integration related expenses(b) Restructuring and conversion costs(c) Other(d) Total EBITDA Adjustments 10,337 Adjusted EBITDA $ Continued on following page 5 135,093 18,809 $ 141,477 . The reconciliation from net income to Adjusted Earnings, a non-GAAP measure, for the periods presented is as follows (in thousands, except per share data): Three Months Ended March 31, 2015 2014 (unaudited) Net income $ 50,678 $ 53,135 After-Tax: EBITDA Adjustments(e) Employee share-based compensation expense(f) 4,019 Acquisition and integration related expenses 3,518 52 Other 220 2,387 Restructuring and conversion costs 4,464 127 Amortization of intangible assets(e) 3,726 6,585 Total EBITDA Adjustments 11,928 5,917 5,966 Adjusted Earnings $ 63,180 $ 71,029 Adjusted Earnings per share(g) $ 0.64 $ 0.69 Weighted-average shares outstanding — diluted 98,227 103,339 ___________________________ (a) Represents share-based compensation for equity awards granted to employees, officers, and directors. Such awards are measured based on the grant-date fair value and recognized over the requisite service period of the individual awards, which generally equals the vesting period. (b) Represents acquisition and integration costs resulting from various acquisitions, including changes in the estimated fair value of future payments, or contingent consideration, that may be required to be made to former shareholders of certain acquired entities. (c) Represents organizational restructuring charges, conversion, and other related costs primarily resulting from the expansion of the Company's Service Value Commitment initiative. Results for the three months ended March 31, 2015 also include charges related to the restructuring of the business of the Company's subsidiary, Fortigent Holdings Company, Inc. (d) Results for the three months ended March 31, 2014 include approximately $5.3 million in parallel rent, property tax, common area maintenance expenses, and fixed asset disposals incurred in connection with our relocation to our San Diego office building. (e) Generally, EBITDA Adjustments and amortization of intangible assets have been tax effected using a federal rate of 35.0% and the applicable effective state rate, which was 3.6%, net of the federal tax benefit, for the periods ended March 31, 2015 and 2014, except as discussed in footnotes (f) and (g) below. (f) Includes the impact of incentive stock options granted to employees that qualify for preferential tax treatment and conversely for which the Company does not receive a tax deduction. (g) Represents Adjusted Earnings, a non-GAAP measure, divided by weighted-average number of shares outstanding on a fully diluted basis. Set forth below is a reconciliation of earnings per share on a fully diluted basis, as calculated in accordance with GAAP, to Adjusted Earnings per share: Three Months Ended March 31, 2015 2014 (unaudited) Earnings per share — diluted $ 0.52 $ 0.51 After-Tax: EBITDA Adjustments per share 0.06 0.12 Amortization of intangible assets per share 0.06 0.06 Adjusted Earnings per share $ 6 0.64 $ 0.69 .
Non-GAAP Financial Measures Adjusted Earnings represent net income before: (a) employee share-based compensation expense, (b) acquisition and integration related expenses, (c) restructuring and conversion costs, (d) amortization of intangible assets resulting from various acquisitions, and (e) other. Reconciling items are tax effected using the income tax rates in effect for the applicable period, adjusted for any potentially non-deductible amounts. Adjusted Earnings per share represents Adjusted Earnings divided by weighted average outstanding shares on a fully diluted basis. The Company prepared Adjusted Earnings and Adjusted Earnings per share to eliminate the effects of items that it does not consider indicative of its core operating performance.
The Company believes this measure provides investors with greater transparency by helping illustrate the underlying financial and business trends relating to results of operations and financial condition and comparability between current and prior periods. Adjusted Earnings and Adjusted Earnings per share are not measures of the Company's financial performance under GAAP and should not be considered as an alternative to net income or earnings per share or any other performance measure derived in accordance with GAAP, or as an alternative to cash flows from operating activities as a measure of profitability or liquidity. Adjusted EBITDA is defined as EBITDA (net income plus interest expense, income tax expense, depreciation and amortization), further adjusted to exclude certain non-cash charges and other adjustments set forth in the table above. The Company presents Adjusted EBITDA because the Company considers it a useful financial metric in assessing the Company's operating performance from period to period by excluding certain items that the Company believes are not representative of its core business, such as certain material non-cash items and other adjustments that are outside the control of management.
Adjusted EBITDA is not a measure of the Company's financial performance under GAAP and should not be considered as an alternative to net income or any other performance measure derived in accordance with GAAP, or as an alternative to cash flows from operating activities as a measure of profitability or liquidity. In addition, Adjusted EBITDA can differ significantly from company to company depending on long-term strategic decisions regarding capital structure, the tax jurisdictions in which companies operate, and capital investments. Gross Profit is calculated as net revenues less production expenses. Production expenses consist of the following expense categories from the Company’s consolidated statements of income: (i) commission and advisory and (ii) brokerage, clearing, and exchange.
All other expense categories, including depreciation and amortization, are considered general and administrative in nature. Because the Company’s gross profit amounts do not include any depreciation and amortization expense, the Company considers its gross profit amounts to be non-GAAP measures that may not be comparable to those of others in its industry. Forward-Looking Statements Statements in this press release regarding the Company's future financial and operating results, growth, business strategies and plans, including statements relating to the Company’s future asset growth, future advisor recruitment, future improvements to the Company's risk management capabilities, the Company’s ability to realize benefits from improved risk management capabilities and the timing and amount of related expenditures, future resolution of regulatory matters and related expenditures, future productivity and efficiency gains, the expected regulatory environment and its impact on the Company, and the Company's ability and plans to repurchase shares or pay dividends in the future, as well as any other statements that are not related to present facts or current conditions or that are not purely historical, constitute forward-looking statements. These forward-looking statements are based on the Company's historical performance and its plans, estimates, and expectations as of April 30, 2015.
The words “anticipates,” “believes,” “expects,” “may,” “plans,” “predicts,” “will,” and similar expressions are intended to identify forward-looking statements, although not all forward-looking statements contain these identifying words. Forwardlooking statements are not guarantees that the future results, plans, intentions or expectations expressed or implied by the Company will be achieved. Matters subject to forward-looking statements involve known and unknown risks and uncertainties, including economic, legislative, regulatory, competitive, and other factors, which may cause actual financial or operating results, levels of activity, or the timing of events, to be materially different than those expressed or implied by forward-looking statements.
Important factors that could cause or contribute to such differences include: changes in general economic and financial market conditions, including retail investor sentiment; fluctuations in the value of advisory and brokerage assets; fluctuations in levels of net new advisory assets and the related impact on fee revenue; effects of competition in the financial services industry; changes in the number of the Company's financial advisors and institutions, and their ability to market effectively financial products and services; changes in interest rates and fees payable by banks participating in the Company's cash sweep program, including the Company's success in negotiating agreements with current or additional counterparties; changes in the growth of the Company's fee-based business; the effect of current, pending and 7 . future legislation, regulation and regulatory actions, including disciplinary actions imposed by securities regulators or self-regulatory organizations; the costs of settling and remediating issues related to pending or future regulatory matters; the Company's success in integrating the operations of acquired businesses; execution of the Company's plans related to its Service Value Commitment initiative, including the Company's ability to successfully transform and transition business processes to third-party service providers; the Company's success in negotiating and developing commercial arrangements with third-party service providers that will enable the Company to realize the service improvements and efficiencies expected to result from its Service Value Commitment initiative; the performance of third-party service providers to which business processes are transitioned from the Company; the Company's ability to control operating risks, information technology systems risks, and sourcing risks; the Company’s ability to recruit new advisors and attract new business to its platform; and the other factors set forth in Part I, “Item 1A. Risk Factors” in the Company's 2014 Annual Report on Form 10-K and any subsequent SEC filings. Except as required by law, the Company specifically disclaims any obligation to update any forward-looking statements as a result of developments occurring after the date of this earnings release, even if its estimates change, and you should not rely on those statements as representing the Company's views as of any date subsequent to the date of this press release. About LPL Financial LPL Financial, a wholly owned subsidiary of LPL Financial Holdings Inc. (NASDAQ: LPLA), is a leader in the financial advice market and serves $485 billion in retail assets.
The Company provides proprietary technology, comprehensive clearing and compliance services, practice management programs and training, and independent research to more than 14,000 independent financial advisors and over 700 banks and credit unions. LPL Financial is the nation's largest independent broker-dealer since 1996 (based on total revenues, Financial Planning magazine, June 1996-2014), is one of the fastest growing RIA custodians with $105 billion in retail assets served, and acts as an independent consultant to over an estimated 40,000 retirement plans with an estimated $120 billion in retirement plan assets served. In addition, LPL Financial supports approximately 4,300 financial advisors licensed with insurance companies by providing customized clearing, advisory platforms, and technology solutions. LPL Financial and its affiliates have 3,352 employees with primary offices in Boston, Charlotte, and San Diego.
For more information, please visit www.lpl.com. Securities and Advisory Services offered through LPL Financial. A Registered Investment Advisor, Member FINRA/ SIPC ### LPLA-F Investor Relations Chris Koegel LPL Financial Phone: (617) 897-4275 Email: investor.relations@lpl.com Media Relations Brett Weinberg LPL Financial Phone: (980) 321-1904 Email: brett.weinberg@lpl.com 8 .
“These results reflect the appeal and strength of our model. While regulatory charges this quarter continued to create a headwind on margin expansion, we have made significant progress on some of our largest historical matters.” LPL Financial's President and former Chief Financial Officer, Dan Arnold, noted, “Adjusted earnings per share of $0.64 decreased $0.05 year-over-year as the benefit from an increase from business growth and share count reduction of $0.05 was more than offset by $0.10 related to regulatory-related costs, decreases in cash sweep revenue, and the timing of our two primary advisor conferences in 2015 relative to 2014. Our first quarter gross profit grew 7% year-over-year, benefiting from steady increases in net new asset flows, new advisor growth, and market appreciation throughout the year.
Core G&A expenses, excluding regulatory charges, were in-line with guidance and remain on target with our anticipated 2015 growth rate of 7.5% to 8.5%.” 1 . March 31, 2015 2014 % Change Business Highlights (unaudited) Advisory and Brokerage Assets (billions)(1) $ Advisory Assets Under Custody (billions)(2) $ Advisors 485.4 $ 183.7 $ 14,098 447.1 8.6% 158.0 16.3% 13,726 2.7% ____________________ (1) Advisory and brokerage assets are comprised of assets that are custodied, networked, and non-networked, and reflect market movement in addition to new assets, inclusive of new business development and net of attrition. (2) Advisory assets under custody is a component of advisory and brokerage assets and consists of advisory assets under management, as well as assets of independent advisors that are custodied by us. Mr. Casady also discussed the firm's position on the Department of Labor's (“DOL”) recent proposal: “Since 2011 we have supported and will continue to support the DOL's intentions to ensure financial advisors are working in the best interest of their clients particularly when serving retirement accounts. While we will continue to work constructively with the DOL to suggest necessary refinements, we do not believe the rule, as proposed, will have a material adverse long-term impact on the financial performance of our business. We have a long track record as a fiduciary on our advisory business and a flexible business model that is well-equipped to serve advisors and investors in a broad manner based on consumer choice.
We are encouraged by the best interest contract exemption provided in the rule proposal and look forward to working collaboratively with the DOL during the comment period to refine the conditions and requirements and ensure access to brokerage products and services for all investors who benefit from them.” Mr. Arnold concluded, “We remain committed to maximizing long-term shareholder value, as evidenced by the $30 million in share repurchases conducted and $24 million in dividends paid in the first quarter. Since our IPO four years ago, we have returned more than $1.2 billion of capital to our shareholders in the form of share repurchases and dividends.
We are pleased our Board of Directors has approved an additional $200 million of share repurchase capacity.” Business Highlights • Record Net New Advisory Asset Flows. Net new advisory assets, which exclude the impact of market movement, were $5.2 billion for the three months ended March 31, 2015, primarily driven by strong advisor productivity and the continued addition of hybrid registered investment advisors (“Hybrid RIAs”). • Hybrid RIA Assets Surpass $100 Billion Milestone. Assets under custody on LPL Financial's Hybrid RIA platform, which provides an integrated offering of technology, clearing, compliance, and custody services to Hybrid RIAs, grew 50.6% to $104.8 billion as of March 31, 2015, representing 342 Hybrid RIA firms, compared to $69.6 billion and 265 Hybrid RIA firms as of March 31, 2014. • Strong Fundamentals Drive Record Gross Profit.
Key contributors to first quarter gross profit growth included: $38.3 billion increase in total advisory and brokerage assets since March 31, 2014 372 net new advisors added since March 31, 2014 • Cash Sweep Program Step-downs Continue as Contracts Reprice. Revenue generated from the Company's cash sweep programs declined 10.4% to $21.5 million in the first quarter of 2015 compared to $24.0 million in the prior year period. This decline was primarily driven by a step-down of 13 basis points in the insured cash account (“ICA”) program fee, offset by 4 basis points of improvement in average effective federal funds rate and an increase in cash sweep balances of $1.0 billion. • Progress on a Number of Regulatory Matters.
In the first quarter of 2015, the Company recognized $11.0 million for regulatory-related matters as it continued to assess identified issues and work with regulators. These amounts include, among other things, estimated losses and legal and consulting fees incurred during the first quarter. While the Company expects regulatory costs for 2015 to remain elevated, it does not expect the average quarter for the remainder of the year to be consistently as high as the first quarter. • Enhancing Long-Term Shareholder Value Through Capital Allocation Activity The Company spent $30.0 million in the first quarter of 2015 to buy back 0.7 million shares of its common stock, at an average price per share of $44.15.
Since its initial public offering in 2010, the Company has 2 . spent $812.4 million to repurchase 21.8 million shares, at an average price per share of $37.22, through March 31, 2015. The Company's Board of Directors declared a quarterly cash dividend of $0.25 per share of the Company's common stock, to be paid on May 21, 2015, to all shareholders of record as of May 11, 2015. The declarations of any future quarterly dividends, as well as the timing of record and payment dates, remain subject to approval by the Board of Directors. The Company’s Board of Directors also approved an additional $200.0 million of share repurchase capacity. Operational Highlights • LPL Financial Appoints Dan Arnold to President. Effective on March 13, 2015, LPL Financial named former Chief Financial Officer Dan Arnold to the role of president. Prior to becoming CFO for LPL, Arnold served as managing director, Head of Strategy for the firm.
Previously, Arnold served as divisional president of LPL's Institution Services, a distinction he earned after 12 years of leading UVEST, a broker-dealer that was acquired by LPL in 2007. • Industry Recognition of LPL Financial Advisors. Several leading financial publications have recently honored advisors affiliated with LPL Financial for their outstanding performance and service. Barron's published its Top 1,200 Financial Advisors in America, which included 29 independent advisors affiliated with LPL Financial. In additional, three LPL advisors ranked first in their respective state, including Ron Carson, Carson Wealth Management Group, Omaha, Nebraska; Charles Zhang, Zhang Financial, Portage, Michigan; and Dan Pinkerton, Pinkerton Retirement Specialists, LLC, Coeur d'Alene, Idaho. Selection for this esteemed list is based on data provided by more than 4,000 financial advisors across the nation and considers advisors' assets under management, revenues and the quality of their practice. In March, nine of the 18 Retirement Plan Advisers of the Year honors given by industry leading publication PLANSPONSOR were LPL-supported advisors and advisor teams.
Taking top honors were Heffernan Retirement Services of San Francisco, California, which was named Retirement Plan Adviser Team of the Year, and Sheridan Road Financial, based in Northbrook, Illinois, which was named Retirement Plan Adviser Multi-office Team of the Year. • LPL Financial Breaks Ground on its New Carolinas Campus. On February 26, 2015, LPL Financial broke ground on its new Carolinas campus in Fort Mill, S.C. The regional headquarters is designed to improve the employee experience and enable LPL Financial to better serve its clients by consolidating its more than 1,000 Charlotte employees - now spread among several area buildings - into a single campus with the ability to accommodate the Company's anticipated growth in the future.
The campus will reflect the firm's continued efforts to leverage technology and materials to minimize environmental impact, while creating an engaging workspace for employees. Completion of construction is expected in the fall of 2016. • LPL Financial Holds Successful Summit and Masters Conferences. In March, LPL Financial held its annual Summit and Masters advisor conferences, which foster an interactive and educational environment for over 1,200 of our top-producing advisors. Conference Call and Additional Information The Company will hold a conference call to discuss its results at 8:00 a.m.
EDT on Thursday, April 30, 2015. The conference call can be accessed by dialing either 877-677-9122 (domestic) or 708-290-1401 (international) and entering passcode 6500802. For additional information, please visit the Company's website to access the Q1 2015 Financial Supplement. The conference call will also be webcast simultaneously on the Investor Relations section of the Company's website (www.lpl.com), where a replay of the call will also be available following the live webcast.
A telephonic replay will be available two hours after the call and can be accessed by dialing 855-859-2056 (domestic) or 404-537-3406 (international) and entering passcode 6500802. The telephonic replay will be available until 11:59 p.m. EDT on May 7, 2015. 3 .
LPL Financial Holdings Inc. Consolidated Statements of Operations (In thousands, except per share data) (Unaudited) Three Months Ended March 31, 2015 2014 % Change Revenues Commission 534,574 (2.1)% Advisory $ 342,112 327,253 4.5 % Asset-based 120,632 114,674 5.2 % Transaction and fee 101,695 89,985 13.0 % Other 523,399 $ 21,464 20,945 2.5 % 1,109,302 1,087,431 2.0 % Production 753,988 756,718 (0.4)% Compensation and benefits 112,280 106,348 5.6 % General and administrative 114,354 94,377 21.2 % 26,066 22,281 17.0 % Net revenues Expenses Depreciation and amortization Restructuring charges 3,924 Provision for income taxes Net income 12,840 9.2 % 999,884 2.5 % 84,675 Income before provision for income taxes 2.4 % 1,024,627 Total expenses (46.4)% 987,044 14,015 Non-operating interest expense 7,320 1,010,612 Total operating expenses 87,547 (3.3)% (1.2)% (4.6)% $ 33,997 50,678 $ 34,412 53,135 Basic $ 0.52 $ 0.52 —% Diluted $ 0.52 $ 0.51 2.0 % Earnings per share Weighted-average shares outstanding — basic 96,551 101,279 (4.7)% Weighted-average shares outstanding — diluted 98,227 103,339 (4.9)% 4 . The Company reports Adjusted EBITDA, Adjusted Earnings, and Adjusted Earnings per share to present information about its earnings that eliminates the effects of items that it does not consider indicative of its core operating performance. Adjusted EBITDA, Adjusted Earnings, and Adjusted Earnings per share have limitations as analytical tools and should not be considered in isolation or as substitutes for analysis of the Company's results as reported under GAAP. Some of these limitations are: a. Adjusted EBITDA, Adjusted Earnings, and Adjusted Earnings per share do not reflect all cash expenditures, or contractual commitments; and do not reflect changes in, or cash requirements for, working capital needs; and b.
Adjusted EBITDA does not reflect the significant interest expense, or the cash requirements necessary to service interest or principal payments, on debt. The reconciliation from net income to Adjusted EBITDA, a non-GAAP measure, for the periods presented is as follows (in thousands): Three Months Ended March 31, 2015 2014 (unaudited) Net income $ 50,678 $ 53,135 Non-operating interest expense 14,015 12,840 Provision for income taxes 33,997 34,412 9,637 9,716 Amortization of intangible assets Depreciation and amortization of fixed assets 16,429 12,565 124,756 122,668 6,158 5,111 85 359 3,888 7,271 206 EBITDA 6,068 EBITDA Adjustments: Employee share-based compensation expense(a) Acquisition and integration related expenses(b) Restructuring and conversion costs(c) Other(d) Total EBITDA Adjustments 10,337 Adjusted EBITDA $ Continued on following page 5 135,093 18,809 $ 141,477 . The reconciliation from net income to Adjusted Earnings, a non-GAAP measure, for the periods presented is as follows (in thousands, except per share data): Three Months Ended March 31, 2015 2014 (unaudited) Net income $ 50,678 $ 53,135 After-Tax: EBITDA Adjustments(e) Employee share-based compensation expense(f) 4,019 Acquisition and integration related expenses 3,518 52 Other 220 2,387 Restructuring and conversion costs 4,464 127 Amortization of intangible assets(e) 3,726 6,585 Total EBITDA Adjustments 11,928 5,917 5,966 Adjusted Earnings $ 63,180 $ 71,029 Adjusted Earnings per share(g) $ 0.64 $ 0.69 Weighted-average shares outstanding — diluted 98,227 103,339 ___________________________ (a) Represents share-based compensation for equity awards granted to employees, officers, and directors. Such awards are measured based on the grant-date fair value and recognized over the requisite service period of the individual awards, which generally equals the vesting period. (b) Represents acquisition and integration costs resulting from various acquisitions, including changes in the estimated fair value of future payments, or contingent consideration, that may be required to be made to former shareholders of certain acquired entities. (c) Represents organizational restructuring charges, conversion, and other related costs primarily resulting from the expansion of the Company's Service Value Commitment initiative. Results for the three months ended March 31, 2015 also include charges related to the restructuring of the business of the Company's subsidiary, Fortigent Holdings Company, Inc. (d) Results for the three months ended March 31, 2014 include approximately $5.3 million in parallel rent, property tax, common area maintenance expenses, and fixed asset disposals incurred in connection with our relocation to our San Diego office building. (e) Generally, EBITDA Adjustments and amortization of intangible assets have been tax effected using a federal rate of 35.0% and the applicable effective state rate, which was 3.6%, net of the federal tax benefit, for the periods ended March 31, 2015 and 2014, except as discussed in footnotes (f) and (g) below. (f) Includes the impact of incentive stock options granted to employees that qualify for preferential tax treatment and conversely for which the Company does not receive a tax deduction. (g) Represents Adjusted Earnings, a non-GAAP measure, divided by weighted-average number of shares outstanding on a fully diluted basis. Set forth below is a reconciliation of earnings per share on a fully diluted basis, as calculated in accordance with GAAP, to Adjusted Earnings per share: Three Months Ended March 31, 2015 2014 (unaudited) Earnings per share — diluted $ 0.52 $ 0.51 After-Tax: EBITDA Adjustments per share 0.06 0.12 Amortization of intangible assets per share 0.06 0.06 Adjusted Earnings per share $ 6 0.64 $ 0.69 .
Non-GAAP Financial Measures Adjusted Earnings represent net income before: (a) employee share-based compensation expense, (b) acquisition and integration related expenses, (c) restructuring and conversion costs, (d) amortization of intangible assets resulting from various acquisitions, and (e) other. Reconciling items are tax effected using the income tax rates in effect for the applicable period, adjusted for any potentially non-deductible amounts. Adjusted Earnings per share represents Adjusted Earnings divided by weighted average outstanding shares on a fully diluted basis. The Company prepared Adjusted Earnings and Adjusted Earnings per share to eliminate the effects of items that it does not consider indicative of its core operating performance.
The Company believes this measure provides investors with greater transparency by helping illustrate the underlying financial and business trends relating to results of operations and financial condition and comparability between current and prior periods. Adjusted Earnings and Adjusted Earnings per share are not measures of the Company's financial performance under GAAP and should not be considered as an alternative to net income or earnings per share or any other performance measure derived in accordance with GAAP, or as an alternative to cash flows from operating activities as a measure of profitability or liquidity. Adjusted EBITDA is defined as EBITDA (net income plus interest expense, income tax expense, depreciation and amortization), further adjusted to exclude certain non-cash charges and other adjustments set forth in the table above. The Company presents Adjusted EBITDA because the Company considers it a useful financial metric in assessing the Company's operating performance from period to period by excluding certain items that the Company believes are not representative of its core business, such as certain material non-cash items and other adjustments that are outside the control of management.
Adjusted EBITDA is not a measure of the Company's financial performance under GAAP and should not be considered as an alternative to net income or any other performance measure derived in accordance with GAAP, or as an alternative to cash flows from operating activities as a measure of profitability or liquidity. In addition, Adjusted EBITDA can differ significantly from company to company depending on long-term strategic decisions regarding capital structure, the tax jurisdictions in which companies operate, and capital investments. Gross Profit is calculated as net revenues less production expenses. Production expenses consist of the following expense categories from the Company’s consolidated statements of income: (i) commission and advisory and (ii) brokerage, clearing, and exchange.
All other expense categories, including depreciation and amortization, are considered general and administrative in nature. Because the Company’s gross profit amounts do not include any depreciation and amortization expense, the Company considers its gross profit amounts to be non-GAAP measures that may not be comparable to those of others in its industry. Forward-Looking Statements Statements in this press release regarding the Company's future financial and operating results, growth, business strategies and plans, including statements relating to the Company’s future asset growth, future advisor recruitment, future improvements to the Company's risk management capabilities, the Company’s ability to realize benefits from improved risk management capabilities and the timing and amount of related expenditures, future resolution of regulatory matters and related expenditures, future productivity and efficiency gains, the expected regulatory environment and its impact on the Company, and the Company's ability and plans to repurchase shares or pay dividends in the future, as well as any other statements that are not related to present facts or current conditions or that are not purely historical, constitute forward-looking statements. These forward-looking statements are based on the Company's historical performance and its plans, estimates, and expectations as of April 30, 2015.
The words “anticipates,” “believes,” “expects,” “may,” “plans,” “predicts,” “will,” and similar expressions are intended to identify forward-looking statements, although not all forward-looking statements contain these identifying words. Forwardlooking statements are not guarantees that the future results, plans, intentions or expectations expressed or implied by the Company will be achieved. Matters subject to forward-looking statements involve known and unknown risks and uncertainties, including economic, legislative, regulatory, competitive, and other factors, which may cause actual financial or operating results, levels of activity, or the timing of events, to be materially different than those expressed or implied by forward-looking statements.
Important factors that could cause or contribute to such differences include: changes in general economic and financial market conditions, including retail investor sentiment; fluctuations in the value of advisory and brokerage assets; fluctuations in levels of net new advisory assets and the related impact on fee revenue; effects of competition in the financial services industry; changes in the number of the Company's financial advisors and institutions, and their ability to market effectively financial products and services; changes in interest rates and fees payable by banks participating in the Company's cash sweep program, including the Company's success in negotiating agreements with current or additional counterparties; changes in the growth of the Company's fee-based business; the effect of current, pending and 7 . future legislation, regulation and regulatory actions, including disciplinary actions imposed by securities regulators or self-regulatory organizations; the costs of settling and remediating issues related to pending or future regulatory matters; the Company's success in integrating the operations of acquired businesses; execution of the Company's plans related to its Service Value Commitment initiative, including the Company's ability to successfully transform and transition business processes to third-party service providers; the Company's success in negotiating and developing commercial arrangements with third-party service providers that will enable the Company to realize the service improvements and efficiencies expected to result from its Service Value Commitment initiative; the performance of third-party service providers to which business processes are transitioned from the Company; the Company's ability to control operating risks, information technology systems risks, and sourcing risks; the Company’s ability to recruit new advisors and attract new business to its platform; and the other factors set forth in Part I, “Item 1A. Risk Factors” in the Company's 2014 Annual Report on Form 10-K and any subsequent SEC filings. Except as required by law, the Company specifically disclaims any obligation to update any forward-looking statements as a result of developments occurring after the date of this earnings release, even if its estimates change, and you should not rely on those statements as representing the Company's views as of any date subsequent to the date of this press release. About LPL Financial LPL Financial, a wholly owned subsidiary of LPL Financial Holdings Inc. (NASDAQ: LPLA), is a leader in the financial advice market and serves $485 billion in retail assets.
The Company provides proprietary technology, comprehensive clearing and compliance services, practice management programs and training, and independent research to more than 14,000 independent financial advisors and over 700 banks and credit unions. LPL Financial is the nation's largest independent broker-dealer since 1996 (based on total revenues, Financial Planning magazine, June 1996-2014), is one of the fastest growing RIA custodians with $105 billion in retail assets served, and acts as an independent consultant to over an estimated 40,000 retirement plans with an estimated $120 billion in retirement plan assets served. In addition, LPL Financial supports approximately 4,300 financial advisors licensed with insurance companies by providing customized clearing, advisory platforms, and technology solutions. LPL Financial and its affiliates have 3,352 employees with primary offices in Boston, Charlotte, and San Diego.
For more information, please visit www.lpl.com. Securities and Advisory Services offered through LPL Financial. A Registered Investment Advisor, Member FINRA/ SIPC ### LPLA-F Investor Relations Chris Koegel LPL Financial Phone: (617) 897-4275 Email: investor.relations@lpl.com Media Relations Brett Weinberg LPL Financial Phone: (980) 321-1904 Email: brett.weinberg@lpl.com 8 .


