First Trust Preferred Securities and Income Fund – as of December 31, 2015
First Trust Portfolios


Description
First Trust
Preferred Securities and Income Fund
AS OF 12/31/15
PREFERRED SECURITIES/INCOME
FUND HIGHLIGHTS
INVESTMENT OBJECTIVES
â– Potential for attractive yield to shareholders from earned
income.
â– Historically, according to the NY Society of Security Analysts,
preferred securities dividends are higher than those paid by
common equities, with an income stream generally more
stable than common stock dividends because of their “fixed”
nature. As with any security, there can be no assurance of
future performance or that any company will continue to pay
or increase dividends.
â– Experienced investment team with an average of 15 years of
broad investment experience in fixed-income and hybrid
preferred securities in the areas of portfolio management,
trading and research.
The First Trust Preferred Securities and Income Fund (“the Fund”) seeks to provide current income and total return. The Fund seeks
to achieve its investment objectives by investing, under normal market conditions, at least 80% of its net assets (including
investment borrowings) in preferred securities and other securities with similar economic characteristics. There can be no
assurance the Fund will achieve its investment objectives.
AVERAGE ANNUAL TOTAL RETURNS
A
C
F
I
R3
FPEAX
FPECX
FPEFX
FPEIX
FPERX
5.13%
4.63%
5.46%
5.63%
5.13%
5.06%
4.63%
4.93%
5.63%
-0.09%
ALPHA4
STANDARD
DEVIATION5
33738A107
33738A115
33738A123
33738A131
33738A149
YTD
1 Year
Annualized Net Expense
Since Inception
Ratio*
3 Year
02/25/11
02/25/11
03/02/11
01/11/11
03/02/11
2.09%
1.89%
2.14%
2.19%
2.02%
5.18%
4.39%
5.34%
5.48%
4.92%
5.18%
4.39%
5.34%
5.48%
4.92%
3.65%
2.88%
3.74%
3.95%
3.41%
6.48%
5.72%
6.66%
6.91%
6.11%
1.40%
2.15%
1.30%
1.15%
1.65%
BofA Merrill Lynch Fixed Rate
Preferred Securities Index
N/A
3.46%
7.58%
7.58%
6.16%
7.04%
N/A
BofA Merrill Lynch U.S.
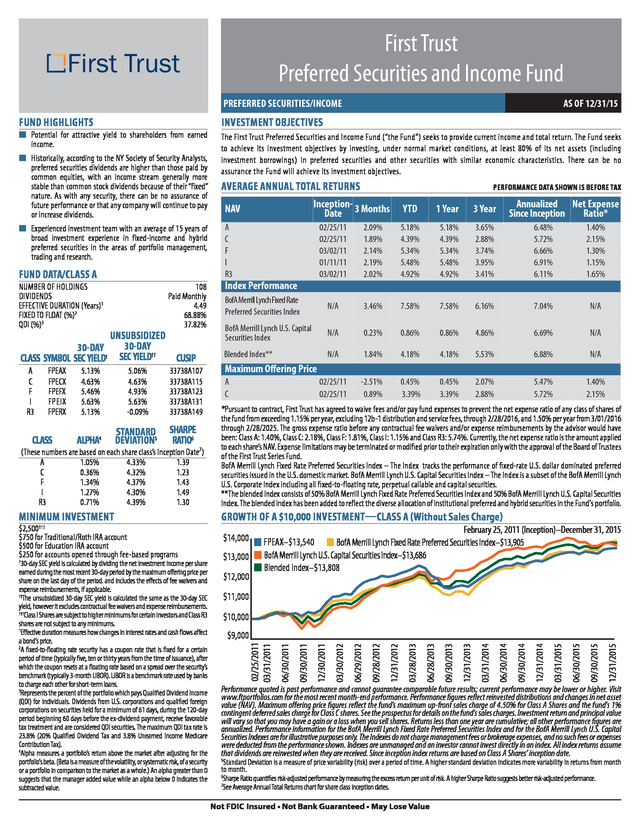
Capital Securities Index N/A 0.23% 0.86% 0.86% 4.86% 6.69% N/A Blended Index** N/A 1.84% 4.18% 4.18% 5.53% 6.88% N/A 02/25/11 02/25/11 -2.51% 0.89% 0.45% 3.39% 0.45% 3.39% 2.07% 2.88% 5.47% 5.72% 1.40% 2.15% Index Performance 108 Paid Monthly 4.49 68.88% 37.82% UNSUBSIDIZED 30-DAY 30-DAY CLASS SYMBOL SEC YIELD† SEC YIELD†† CUSIP A C F I R3 Inception- 3 Months Date NAV FUND DATA/CLASS A NUMBER OF HOLDINGS DIVIDENDS EFFECTIVE DURATION (Years)1 FIXED TO FLOAT (%)2 QDI (%)3 PERFORMANCE DATA SHOWN IS BEFORE TAX Maximum Offering Price A C (These numbers are based on each share class’s Inception Date7) A 1.05% 4.33% 1.39 C 0.36% 4.32% 1.23 F 1.34% 4.37% 1.43 I 1.27% 4.30% 1.49 R3 0.71% 4.39% 1.30 *Pursuant to contract, First Trust has agreed to waive fees and/or pay fund expenses to prevent the net expense ratio of any class of shares of the fund from exceeding 1.15% per year, excluding 12b-1 distribution and service fees, through 2/28/2016, and 1.50% per year from 3/01/2016 through 2/28/2025. The gross expense ratio before any contractual fee waivers and/or expense reimbursements by the advisor would have been: Class A: 1.40%, Class C: 2.18%, Class F: 1.81%, Class I: 1.15% and Class R3: 5.74%. Currently, the net expense ratio is the amount applied to each share’s NAV.
Expense limitations may be terminated or modiï¬ed prior to their expiration only with the approval of the Board of Trustees of the First Trust Series Fund. BofA Merrill Lynch Fixed Rate Preferred Securities Index – The Index tracks the performance of ï¬xed-rate U.S. dollar dominated preferred securities issued in the U.S. domestic market.
BofA Merrill Lynch U.S. Capital Securities Index – The Index is a subset of the BofA Merrill Lynch U.S. Corporate Index including all ï¬xed-to-floating rate, perpetual callable and capital securities. **The blended index consists of 50% BofA Merrill Lynch Fixed Rate Preferred Securities Index and 50% BofA Merrill Lynch U.S.
Capital Securities Index. The blended index has been added to reflect the diverse allocation of institutional preferred and hybrid securities in the Fund's portfolio. MINIMUM INVESTMENT GROWTH OF A $10,000 INVESTMENTïš¼CLASS A ïš®Without Sales Charge $2,500††† $750 for Traditional/Roth IRA account $500 for Education IRA account $250 for accounts opened through fee-based programs $14,000 $13,000 † $12,000 $11,000 $10,000 12/31/2015 09/30/2015 06/30/2015 03/31/2015 12/31/2014 09/30/2014 06/30/2014 03/31/2014 12/31/2013 09/30/2013 06/28/2013 03/28/2013 12/31/2012 09/28/2012 06/29/2012 03/30/2012 12/30/2011 $9,000 02/25/2011 03/31/2011 30-day SEC yield is calculated by dividing the net investment income per share earned during the most recent 30-day period by the maximum offering price per share on the last day of the period. and includes the effects of fee waivers and expense reimbursements, if applicable. ††The unsubsidized 30-day SEC yield is calculated the same as the 30-day SEC yield, however it excludes contractual fee waivers and expense reimbursements. †††Class I Shares are subject to higher minimums for certain investors and Class R3 shares are not subject to any minimums. 1 Effective duration measures how changes in interest rates and cash flows affect a bond’s price. 2 A ï¬xed-to-floating rate security has a coupon rate that is ï¬xed for a certain period of time (typically ï¬ve, ten or thirty years from the time of issuance), after which the coupon resets at a floating rate based on a spread over the security’s benchmark (typically 3-month LIBOR).
LIBOR is a benchmark rate used by banks to charge each other for short-term loans. 3 Represents the percent of the portfolio which pays Qualiï¬ed Dividend Income (QDI) for individuals. Dividends from U.S. corporations and qualiï¬ed foreign corporations on securities held for a minimum of 61 days, during the 120-day period beginning 60 days before the ex-dividend payment, receive favorable tax treatment and are considered QDI securities.
The maximum QDI tax rate is 23.8% (20% Qualiï¬ed Dividend Tax and 3.8% Unearned Income Medicare Contribution Tax). 4 Alpha measures a portfolio’s return above the market after adjusting for the portfolio’s beta. (Beta is a measure of the volatility, or systematic risk, of a security or a portfolio in comparison to the market as a whole.) An alpha greater than 0 suggests that the manager added value while an alpha below 0 indicates the subtracted value. February 25, 2011 (Inception)–December 31, 2015 FPEAX–$13,540 BofA Merrill Lynch Fixed Rate Preferred Securities Index–$13,905 BofA Merrill Lynch U.S. Capital Securities Index–$13,686 Blended Index–$13,808 09/30/2011 SHARPE RATIO6 06/30/2011 CLASS Performance quoted is past performance and cannot guarantee comparable future results; current performance may be lower or higher.
Visit www.ftportfolios.com for the most recent month-end performance. Performance ï¬gures reflect reinvested distributions and changes in net asset value (NAV). Maximum offering price ï¬gures reflect the fund's maximum up-front sales charge of 4.50% for Class A Shares and the fund's 1% contingent deferred sales charge for Class C shares.
See the prospectus for details on the fund's sales charges. Investment return and principal value will vary so that you may have a gain or a loss when you sell shares. Returns less than one year are cumulative; all other performance ï¬gures are annualized.
Performance information for the BofA Merrill Lynch Fixed Rate Preferred Securities Index and for the BofA Merrill Lynch U.S. Capital Securities Indexes are for illustrative purposes only. The Indexes do not charge management fees or brokerage expenses, and no such fees or expenses were deducted from the performance shown.
Indexes are unmanaged and an investor cannot invest directly in an index. All index returns assume that dividends are reinvested when they are received. Since inception index returns are based on Class A Shares’ inception date. 5 Standard Deviation is a measure of price variability (risk) over a period of time.
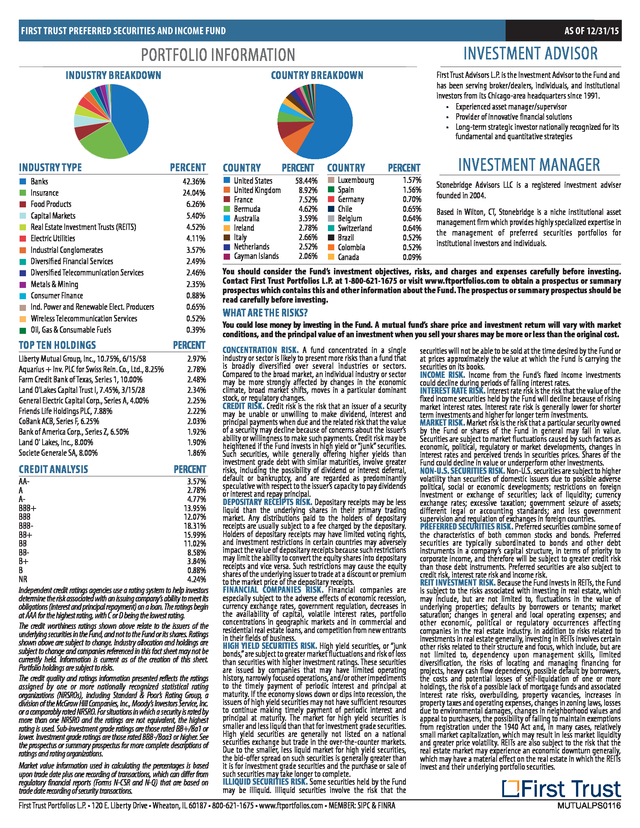
A higher standard deviation indicates more variability in returns from month to month. 6 Sharpe Ratio quantiï¬es risk-adjusted performance by measuring the excess return per unit of risk. A higher Sharpe Ratio suggests better risk-adjusted performance. 7 See Average Annual Total Returns chart for share class inception dates. Not FDIC Insured • Not Bank Guaranteed • May Lose Value . FIRST TRUST PREFERRED SECURITIES AND INCOME FUND AS OF 12/31/15 INVESTMENT ADVISOR PORTFOLIO INFORMATION INDUSTRY BREAKDOWN INDUSTRY TYPE n n n n n n n n n n n n n n Banks Insurance Food Products Capital Markets Real Estate Investment Trusts (REITS) Electric Utilities Industrial Conglomerates Diversiï¬ed Financial Services Diversiï¬ed Telecommunication Services Metals & Mining Consumer Finance Ind. Power and Renewable Elect. Producers Wireless Telecommunication Services Oil, Gas & Consumable Fuels TOP TEN HOLDINGS Liberty Mutual Group, Inc., 10.75%, 6/15/58 Aquarius + Inv. PLC for Swiss Rein.
Co., Ltd., 8.25% Farm Credit Bank of Texas, Series 1, 10.00% Land O'Lakes Capital Trust I, 7.45%, 3/15/28 General Electric Capital Corp., Series A, 4.00% Friends Life Holdings PLC, 7.88% CoBank ACB, Series F, 6.25% Bank of America Corp., Series Z, 6.50% Land O' Lakes, Inc., 8.00% Societe Generale SA, 8.00% CREDIT ANALYSIS COUNTRY BREAKDOWN PERCENT 42.36% 24.04% 6.26% 5.40% 4.52% 4.11% 3.57% 2.49% 2.46% 2.35% 0.88% 0.65% 0.52% 0.39% PERCENT 2.97% 2.78% 2.48% 2.34% 2.25% 2.22% 2.03% 1.92% 1.90% 1.86% PERCENT 3.57% AA2.78% A 4.77% A13.95% BBB+ 12.07% BBB 18.31% BBB15.99% BB+ 11.02% BB 8.58% BB3.84% B+ 0.88% B 4.24% NR Independent credit ratings agencies use a rating system to help investors determine the risk associated with an issuing company’s ability to meet its obligations (interest and principal repayment) on a loan. The ratings begin at AAA for the highest rating, with C or D being the lowest rating. The credit worthiness ratings shown above relate to the issuers of the underlying securities in the Fund, and not to the Fund or its shares. Ratings shown above are subject to change.
Industry allocation and holdings are subject to change and companies referenced in this fact sheet may not be currently held. Information is current as of the creation of this sheet. Portfolio holdings are subject to risks. The credit quality and ratings information presented reflects the ratings assigned by one or more nationally recognized statistical rating organizations (NRSROs), including Standard & Poor’s Rating Group, a division of the McGraw Hill Companies, Inc., Moody’s Investors Service, Inc. or a comparably rated NRSRO. For situations in which a security is rated by more than one NRSRO and the ratings are not equivalent, the highest rating is used.
Sub-investment grade ratings are those rated BB+/Ba1 or lower. Investment grade ratings are those rated BBB-/Baa3 or higher. See the prospectus or summary prospectus for more complete descriptions of ratings and rating organizations. Market value information used in calculating the percentages is based upon trade date plus one recording of transactions, which can differ from regulatory financial reports (Forms N-CSR and N-Q) that are based on trade date recording of security transactions. COUNTRY n n n n n n n n n United States United Kingdom France Bermuda Australia Ireland Italy Netherlands Cayman Islands PERCENT 58.44% 8.92% 7.52% 4.62% 3.59% 2.78% 2.66% 2.52% 2.06% COUNTRY n Luxembourg n Spain n Germany n Chile n n n n First Trust Advisors L.P.
is the Investment Advisor to the Fund and has been serving broker/dealers, individuals, and institutional investors from its Chicago-area headquarters since 1991. • Experienced asset manager/supervisor • Provider of innovative financial solutions • Long-term strategic investor nationally recognized for its fundamental and quantitative strategies PERCENT Belgium Switzerland Brazil Colombia Canada 1.57% 1.56% 0.70% 0.65% 0.64% 0.64% 0.52% 0.52% 0.09% INVESTMENT MANAGER Stonebridge Advisors LLC is a registered investment adviser founded in 2004. Based in Wilton, CT, Stonebridge is a niche institutional asset management firm which provides highly specialized expertise in the management of preferred securities portfolios for institutional investors and individuals. You should consider the Fund’s investment objectives, risks, and charges and expenses carefully before investing. Contact First Trust Portfolios L.P. at 1-800-621-1675 or visit www.ftportfolios.com to obtain a prospectus or summary prospectus which contains this and other information about the Fund. The prospectus or summary prospectus should be read carefully before investing. WHAT ARE THE RISKS? You could lose money by investing in the Fund.
A mutual fund’s share price and investment return will vary with market conditions, and the principal value of an investment when you sell your shares may be more or less than the original cost. CONCENTRATION RISK. A fund concentrated in a single industry or sector is likely to present more risks than a fund that is broadly diversified over several industries or sectors. Compared to the broad market, an individual industry or sector may be more strongly affected by changes in the economic climate, broad market shifts, moves in a particular dominant stock, or regulatory changes. CREDIT RISK. Credit risk is the risk that an issuer of a security may be unable or unwilling to make dividend, interest and principal payments when due and the related risk that the value of a security may decline because of concerns about the issuer’s ability or willingness to make such payments.
Credit risk may be heightened if the Fund invests in high yield or “junk” securities. Such securities, while generally offering higher yields than investment grade debt with similar maturities, involve greater risks, including the possibility of dividend or interest deferral, default or bankruptcy, and are regarded as predominantly speculative with respect to the issuer’s capacity to pay dividends or interest and repay principal. DEPOSITARY RECEIPTS RISK. Depositary receipts may be less liquid than the underlying shares in their primary trading market. Any distributions paid to the holders of depositary receipts are usually subject to a fee charged by the depositary. Holders of depositary receipts may have limited voting rights, and investment restrictions in certain countries may adversely impact the value of depositary receipts because such restrictions may limit the ability to convert the equity shares into depositary receipts and vice versa.
Such restrictions may cause the equity shares of the underlying issuer to trade at a discount or premium to the market price of the depositary receipts. FINANCIAL COMPANIES RISK. Financial companies are especially subject to the adverse effects of economic recession, currency exchange rates, government regulation, decreases in the availability of capital, volatile interest rates, portfolio concentrations in geographic markets and in commercial and residential real estate loans, and competition from new entrants in their fields of business. HIGH YIELD SECURITIES RISK. High yield securities, or “junk bonds,” are subject to greater market fluctuations and risk of loss than securities with higher investment ratings.
These securities are issued by companies that may have limited operating history, narrowly focused operations, and/or other impediments to the timely payment of periodic interest and principal at maturity. If the economy slows down or dips into recession, the issuers of high yield securities may not have sufficient resources to continue making timely payment of periodic interest and principal at maturity. The market for high yield securities is smaller and less liquid than that for investment grade securities. High yield securities are generally not listed on a national securities exchange but trade in the over-the-counter markets. Due to the smaller, less liquid market for high yield securities, the bid-offer spread on such securities is generally greater than it is for investment grade securities and the purchase or sale of such securities may take longer to complete. ILLIQUID SECURITIES RISK.
Some securities held by the Fund may be illiquid. Illiquid securities involve the risk that the First Trust Portfolios L.P. • 120 E.
Liberty Drive • Wheaton, IL 60187 • 800-621-1675 • www.ftportfolios.com • MEMBER: SIPC & FINRA securities will not be able to be sold at the time desired by the Fund or at prices approximately the value at which the Fund is carrying the securities on its books. INCOME RISK. Income from the Fund’s fixed income investments could decline during periods of falling interest rates. INTEREST RATE RISK. Interest rate risk is the risk that the value of the fixed income securities held by the Fund will decline because of rising market interest rates.
Interest rate risk is generally lower for shorter term investments and higher for longer term investments. MARKET RISK. Market risk is the risk that a particular security owned by the Fund or shares of the Fund in general may fall in value. Securities are subject to market fluctuations caused by such factors as economic, political, regulatory or market developments, changes in interest rates and perceived trends in securities prices. Shares of the Fund could decline in value or underperform other investments. NON-U.S.
SECURITIES RISK. Non-U.S. securities are subject to higher volatility than securities of domestic issuers due to possible adverse political, social or economic developments; restrictions on foreign investment or exchange of securities; lack of liquidity; currency exchange rates; excessive taxation; government seizure of assets; different legal or accounting standards; and less government supervision and regulation of exchanges in foreign countries. PREFERRED SECURITIES RISK.
Preferred securities combine some of the characteristics of both common stocks and bonds. Preferred securities are typically subordinated to bonds and other debt instruments in a company’s capital structure, in terms of priority to corporate income, and therefore will be subject to greater credit risk than those debt instruments. Preferred securities are also subject to credit risk, interest rate risk and income risk. REIT INVESTMENT RISK.
Because the Fund invests in REITs, the Fund is subject to the risks associated with investing in real estate, which may include, but are not limited to, fluctuations in the value of underlying properties; defaults by borrowers or tenants; market saturation; changes in general and local operating expenses; and other economic, political or regulatory occurrences affecting companies in the real estate industry. In addition to risks related to investments in real estate generally, investing in REITs involves certain other risks related to their structure and focus, which include, but are not limited to, dependency upon management skills, limited diversification, the risks of locating and managing financing for projects, heavy cash flow dependency, possible default by borrowers, the costs and potential losses of self-liquidation of one or more holdings, the risk of a possible lack of mortgage funds and associated interest rate risks, overbuilding, property vacancies, increases in property taxes and operating expenses, changes in zoning laws, losses due to environmental damages, changes in neighborhood values and appeal to purchasers, the possibility of failing to maintain exemptions from registration under the 1940 Act and, in many cases, relatively small market capitalization, which may result in less market liquidity and greater price volatility. REITs are also subject to the risk that the real estate market may experience an economic downturn generally, which may have a material effect on the real estate in which the REITs invest and their underlying portfolio securities. MUTUALPS0116 .
Capital Securities Index N/A 0.23% 0.86% 0.86% 4.86% 6.69% N/A Blended Index** N/A 1.84% 4.18% 4.18% 5.53% 6.88% N/A 02/25/11 02/25/11 -2.51% 0.89% 0.45% 3.39% 0.45% 3.39% 2.07% 2.88% 5.47% 5.72% 1.40% 2.15% Index Performance 108 Paid Monthly 4.49 68.88% 37.82% UNSUBSIDIZED 30-DAY 30-DAY CLASS SYMBOL SEC YIELD† SEC YIELD†† CUSIP A C F I R3 Inception- 3 Months Date NAV FUND DATA/CLASS A NUMBER OF HOLDINGS DIVIDENDS EFFECTIVE DURATION (Years)1 FIXED TO FLOAT (%)2 QDI (%)3 PERFORMANCE DATA SHOWN IS BEFORE TAX Maximum Offering Price A C (These numbers are based on each share class’s Inception Date7) A 1.05% 4.33% 1.39 C 0.36% 4.32% 1.23 F 1.34% 4.37% 1.43 I 1.27% 4.30% 1.49 R3 0.71% 4.39% 1.30 *Pursuant to contract, First Trust has agreed to waive fees and/or pay fund expenses to prevent the net expense ratio of any class of shares of the fund from exceeding 1.15% per year, excluding 12b-1 distribution and service fees, through 2/28/2016, and 1.50% per year from 3/01/2016 through 2/28/2025. The gross expense ratio before any contractual fee waivers and/or expense reimbursements by the advisor would have been: Class A: 1.40%, Class C: 2.18%, Class F: 1.81%, Class I: 1.15% and Class R3: 5.74%. Currently, the net expense ratio is the amount applied to each share’s NAV.
Expense limitations may be terminated or modiï¬ed prior to their expiration only with the approval of the Board of Trustees of the First Trust Series Fund. BofA Merrill Lynch Fixed Rate Preferred Securities Index – The Index tracks the performance of ï¬xed-rate U.S. dollar dominated preferred securities issued in the U.S. domestic market.
BofA Merrill Lynch U.S. Capital Securities Index – The Index is a subset of the BofA Merrill Lynch U.S. Corporate Index including all ï¬xed-to-floating rate, perpetual callable and capital securities. **The blended index consists of 50% BofA Merrill Lynch Fixed Rate Preferred Securities Index and 50% BofA Merrill Lynch U.S.
Capital Securities Index. The blended index has been added to reflect the diverse allocation of institutional preferred and hybrid securities in the Fund's portfolio. MINIMUM INVESTMENT GROWTH OF A $10,000 INVESTMENTïš¼CLASS A ïš®Without Sales Charge $2,500††† $750 for Traditional/Roth IRA account $500 for Education IRA account $250 for accounts opened through fee-based programs $14,000 $13,000 † $12,000 $11,000 $10,000 12/31/2015 09/30/2015 06/30/2015 03/31/2015 12/31/2014 09/30/2014 06/30/2014 03/31/2014 12/31/2013 09/30/2013 06/28/2013 03/28/2013 12/31/2012 09/28/2012 06/29/2012 03/30/2012 12/30/2011 $9,000 02/25/2011 03/31/2011 30-day SEC yield is calculated by dividing the net investment income per share earned during the most recent 30-day period by the maximum offering price per share on the last day of the period. and includes the effects of fee waivers and expense reimbursements, if applicable. ††The unsubsidized 30-day SEC yield is calculated the same as the 30-day SEC yield, however it excludes contractual fee waivers and expense reimbursements. †††Class I Shares are subject to higher minimums for certain investors and Class R3 shares are not subject to any minimums. 1 Effective duration measures how changes in interest rates and cash flows affect a bond’s price. 2 A ï¬xed-to-floating rate security has a coupon rate that is ï¬xed for a certain period of time (typically ï¬ve, ten or thirty years from the time of issuance), after which the coupon resets at a floating rate based on a spread over the security’s benchmark (typically 3-month LIBOR).
LIBOR is a benchmark rate used by banks to charge each other for short-term loans. 3 Represents the percent of the portfolio which pays Qualiï¬ed Dividend Income (QDI) for individuals. Dividends from U.S. corporations and qualiï¬ed foreign corporations on securities held for a minimum of 61 days, during the 120-day period beginning 60 days before the ex-dividend payment, receive favorable tax treatment and are considered QDI securities.
The maximum QDI tax rate is 23.8% (20% Qualiï¬ed Dividend Tax and 3.8% Unearned Income Medicare Contribution Tax). 4 Alpha measures a portfolio’s return above the market after adjusting for the portfolio’s beta. (Beta is a measure of the volatility, or systematic risk, of a security or a portfolio in comparison to the market as a whole.) An alpha greater than 0 suggests that the manager added value while an alpha below 0 indicates the subtracted value. February 25, 2011 (Inception)–December 31, 2015 FPEAX–$13,540 BofA Merrill Lynch Fixed Rate Preferred Securities Index–$13,905 BofA Merrill Lynch U.S. Capital Securities Index–$13,686 Blended Index–$13,808 09/30/2011 SHARPE RATIO6 06/30/2011 CLASS Performance quoted is past performance and cannot guarantee comparable future results; current performance may be lower or higher.
Visit www.ftportfolios.com for the most recent month-end performance. Performance ï¬gures reflect reinvested distributions and changes in net asset value (NAV). Maximum offering price ï¬gures reflect the fund's maximum up-front sales charge of 4.50% for Class A Shares and the fund's 1% contingent deferred sales charge for Class C shares.
See the prospectus for details on the fund's sales charges. Investment return and principal value will vary so that you may have a gain or a loss when you sell shares. Returns less than one year are cumulative; all other performance ï¬gures are annualized.
Performance information for the BofA Merrill Lynch Fixed Rate Preferred Securities Index and for the BofA Merrill Lynch U.S. Capital Securities Indexes are for illustrative purposes only. The Indexes do not charge management fees or brokerage expenses, and no such fees or expenses were deducted from the performance shown.
Indexes are unmanaged and an investor cannot invest directly in an index. All index returns assume that dividends are reinvested when they are received. Since inception index returns are based on Class A Shares’ inception date. 5 Standard Deviation is a measure of price variability (risk) over a period of time.
A higher standard deviation indicates more variability in returns from month to month. 6 Sharpe Ratio quantiï¬es risk-adjusted performance by measuring the excess return per unit of risk. A higher Sharpe Ratio suggests better risk-adjusted performance. 7 See Average Annual Total Returns chart for share class inception dates. Not FDIC Insured • Not Bank Guaranteed • May Lose Value . FIRST TRUST PREFERRED SECURITIES AND INCOME FUND AS OF 12/31/15 INVESTMENT ADVISOR PORTFOLIO INFORMATION INDUSTRY BREAKDOWN INDUSTRY TYPE n n n n n n n n n n n n n n Banks Insurance Food Products Capital Markets Real Estate Investment Trusts (REITS) Electric Utilities Industrial Conglomerates Diversiï¬ed Financial Services Diversiï¬ed Telecommunication Services Metals & Mining Consumer Finance Ind. Power and Renewable Elect. Producers Wireless Telecommunication Services Oil, Gas & Consumable Fuels TOP TEN HOLDINGS Liberty Mutual Group, Inc., 10.75%, 6/15/58 Aquarius + Inv. PLC for Swiss Rein.
Co., Ltd., 8.25% Farm Credit Bank of Texas, Series 1, 10.00% Land O'Lakes Capital Trust I, 7.45%, 3/15/28 General Electric Capital Corp., Series A, 4.00% Friends Life Holdings PLC, 7.88% CoBank ACB, Series F, 6.25% Bank of America Corp., Series Z, 6.50% Land O' Lakes, Inc., 8.00% Societe Generale SA, 8.00% CREDIT ANALYSIS COUNTRY BREAKDOWN PERCENT 42.36% 24.04% 6.26% 5.40% 4.52% 4.11% 3.57% 2.49% 2.46% 2.35% 0.88% 0.65% 0.52% 0.39% PERCENT 2.97% 2.78% 2.48% 2.34% 2.25% 2.22% 2.03% 1.92% 1.90% 1.86% PERCENT 3.57% AA2.78% A 4.77% A13.95% BBB+ 12.07% BBB 18.31% BBB15.99% BB+ 11.02% BB 8.58% BB3.84% B+ 0.88% B 4.24% NR Independent credit ratings agencies use a rating system to help investors determine the risk associated with an issuing company’s ability to meet its obligations (interest and principal repayment) on a loan. The ratings begin at AAA for the highest rating, with C or D being the lowest rating. The credit worthiness ratings shown above relate to the issuers of the underlying securities in the Fund, and not to the Fund or its shares. Ratings shown above are subject to change.
Industry allocation and holdings are subject to change and companies referenced in this fact sheet may not be currently held. Information is current as of the creation of this sheet. Portfolio holdings are subject to risks. The credit quality and ratings information presented reflects the ratings assigned by one or more nationally recognized statistical rating organizations (NRSROs), including Standard & Poor’s Rating Group, a division of the McGraw Hill Companies, Inc., Moody’s Investors Service, Inc. or a comparably rated NRSRO. For situations in which a security is rated by more than one NRSRO and the ratings are not equivalent, the highest rating is used.
Sub-investment grade ratings are those rated BB+/Ba1 or lower. Investment grade ratings are those rated BBB-/Baa3 or higher. See the prospectus or summary prospectus for more complete descriptions of ratings and rating organizations. Market value information used in calculating the percentages is based upon trade date plus one recording of transactions, which can differ from regulatory financial reports (Forms N-CSR and N-Q) that are based on trade date recording of security transactions. COUNTRY n n n n n n n n n United States United Kingdom France Bermuda Australia Ireland Italy Netherlands Cayman Islands PERCENT 58.44% 8.92% 7.52% 4.62% 3.59% 2.78% 2.66% 2.52% 2.06% COUNTRY n Luxembourg n Spain n Germany n Chile n n n n First Trust Advisors L.P.
is the Investment Advisor to the Fund and has been serving broker/dealers, individuals, and institutional investors from its Chicago-area headquarters since 1991. • Experienced asset manager/supervisor • Provider of innovative financial solutions • Long-term strategic investor nationally recognized for its fundamental and quantitative strategies PERCENT Belgium Switzerland Brazil Colombia Canada 1.57% 1.56% 0.70% 0.65% 0.64% 0.64% 0.52% 0.52% 0.09% INVESTMENT MANAGER Stonebridge Advisors LLC is a registered investment adviser founded in 2004. Based in Wilton, CT, Stonebridge is a niche institutional asset management firm which provides highly specialized expertise in the management of preferred securities portfolios for institutional investors and individuals. You should consider the Fund’s investment objectives, risks, and charges and expenses carefully before investing. Contact First Trust Portfolios L.P. at 1-800-621-1675 or visit www.ftportfolios.com to obtain a prospectus or summary prospectus which contains this and other information about the Fund. The prospectus or summary prospectus should be read carefully before investing. WHAT ARE THE RISKS? You could lose money by investing in the Fund.
A mutual fund’s share price and investment return will vary with market conditions, and the principal value of an investment when you sell your shares may be more or less than the original cost. CONCENTRATION RISK. A fund concentrated in a single industry or sector is likely to present more risks than a fund that is broadly diversified over several industries or sectors. Compared to the broad market, an individual industry or sector may be more strongly affected by changes in the economic climate, broad market shifts, moves in a particular dominant stock, or regulatory changes. CREDIT RISK. Credit risk is the risk that an issuer of a security may be unable or unwilling to make dividend, interest and principal payments when due and the related risk that the value of a security may decline because of concerns about the issuer’s ability or willingness to make such payments.
Credit risk may be heightened if the Fund invests in high yield or “junk” securities. Such securities, while generally offering higher yields than investment grade debt with similar maturities, involve greater risks, including the possibility of dividend or interest deferral, default or bankruptcy, and are regarded as predominantly speculative with respect to the issuer’s capacity to pay dividends or interest and repay principal. DEPOSITARY RECEIPTS RISK. Depositary receipts may be less liquid than the underlying shares in their primary trading market. Any distributions paid to the holders of depositary receipts are usually subject to a fee charged by the depositary. Holders of depositary receipts may have limited voting rights, and investment restrictions in certain countries may adversely impact the value of depositary receipts because such restrictions may limit the ability to convert the equity shares into depositary receipts and vice versa.
Such restrictions may cause the equity shares of the underlying issuer to trade at a discount or premium to the market price of the depositary receipts. FINANCIAL COMPANIES RISK. Financial companies are especially subject to the adverse effects of economic recession, currency exchange rates, government regulation, decreases in the availability of capital, volatile interest rates, portfolio concentrations in geographic markets and in commercial and residential real estate loans, and competition from new entrants in their fields of business. HIGH YIELD SECURITIES RISK. High yield securities, or “junk bonds,” are subject to greater market fluctuations and risk of loss than securities with higher investment ratings.
These securities are issued by companies that may have limited operating history, narrowly focused operations, and/or other impediments to the timely payment of periodic interest and principal at maturity. If the economy slows down or dips into recession, the issuers of high yield securities may not have sufficient resources to continue making timely payment of periodic interest and principal at maturity. The market for high yield securities is smaller and less liquid than that for investment grade securities. High yield securities are generally not listed on a national securities exchange but trade in the over-the-counter markets. Due to the smaller, less liquid market for high yield securities, the bid-offer spread on such securities is generally greater than it is for investment grade securities and the purchase or sale of such securities may take longer to complete. ILLIQUID SECURITIES RISK.
Some securities held by the Fund may be illiquid. Illiquid securities involve the risk that the First Trust Portfolios L.P. • 120 E.
Liberty Drive • Wheaton, IL 60187 • 800-621-1675 • www.ftportfolios.com • MEMBER: SIPC & FINRA securities will not be able to be sold at the time desired by the Fund or at prices approximately the value at which the Fund is carrying the securities on its books. INCOME RISK. Income from the Fund’s fixed income investments could decline during periods of falling interest rates. INTEREST RATE RISK. Interest rate risk is the risk that the value of the fixed income securities held by the Fund will decline because of rising market interest rates.
Interest rate risk is generally lower for shorter term investments and higher for longer term investments. MARKET RISK. Market risk is the risk that a particular security owned by the Fund or shares of the Fund in general may fall in value. Securities are subject to market fluctuations caused by such factors as economic, political, regulatory or market developments, changes in interest rates and perceived trends in securities prices. Shares of the Fund could decline in value or underperform other investments. NON-U.S.
SECURITIES RISK. Non-U.S. securities are subject to higher volatility than securities of domestic issuers due to possible adverse political, social or economic developments; restrictions on foreign investment or exchange of securities; lack of liquidity; currency exchange rates; excessive taxation; government seizure of assets; different legal or accounting standards; and less government supervision and regulation of exchanges in foreign countries. PREFERRED SECURITIES RISK.
Preferred securities combine some of the characteristics of both common stocks and bonds. Preferred securities are typically subordinated to bonds and other debt instruments in a company’s capital structure, in terms of priority to corporate income, and therefore will be subject to greater credit risk than those debt instruments. Preferred securities are also subject to credit risk, interest rate risk and income risk. REIT INVESTMENT RISK.
Because the Fund invests in REITs, the Fund is subject to the risks associated with investing in real estate, which may include, but are not limited to, fluctuations in the value of underlying properties; defaults by borrowers or tenants; market saturation; changes in general and local operating expenses; and other economic, political or regulatory occurrences affecting companies in the real estate industry. In addition to risks related to investments in real estate generally, investing in REITs involves certain other risks related to their structure and focus, which include, but are not limited to, dependency upon management skills, limited diversification, the risks of locating and managing financing for projects, heavy cash flow dependency, possible default by borrowers, the costs and potential losses of self-liquidation of one or more holdings, the risk of a possible lack of mortgage funds and associated interest rate risks, overbuilding, property vacancies, increases in property taxes and operating expenses, changes in zoning laws, losses due to environmental damages, changes in neighborhood values and appeal to purchasers, the possibility of failing to maintain exemptions from registration under the 1940 Act and, in many cases, relatively small market capitalization, which may result in less market liquidity and greater price volatility. REITs are also subject to the risk that the real estate market may experience an economic downturn generally, which may have a material effect on the real estate in which the REITs invest and their underlying portfolio securities. MUTUALPS0116 .