First Trust Consumer Staples AlphaDEX® Fund – as of December 31, 2015
First Trust Portfolios


Description
FXG
First Trust Consumer Staples AlphaDEX® Fund
As of 12/31/15
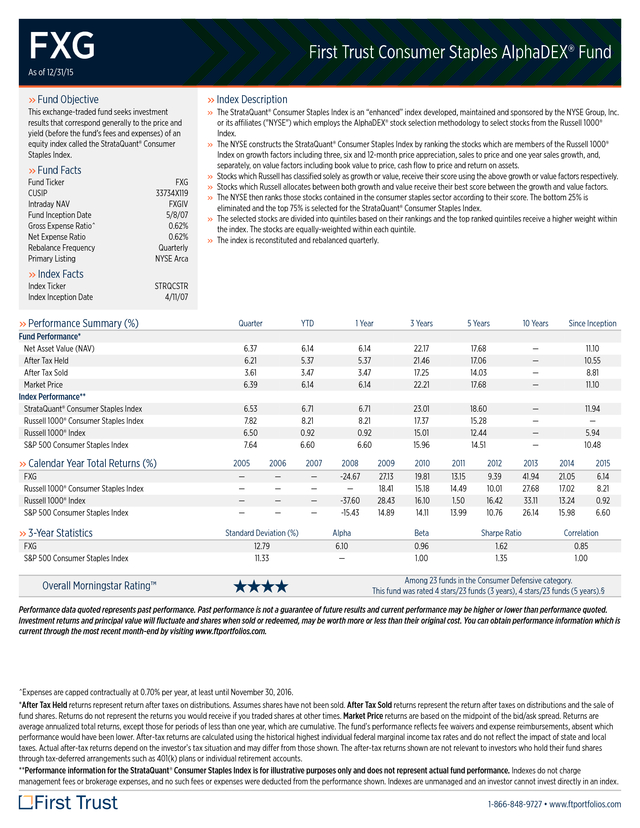
» Fund Objective
» Index Description
This exchange-traded fund seeks investment
results that correspond generally to the price and
yield (before the fund’s fees and expenses) of an
equity index called the StrataQuant® Consumer
Staples Index.
» The StrataQuant® Consumer Staples Index is an “enhanced” index developed, maintained and sponsored by the NYSE Group, Inc.
or its affiliates ("NYSE") which employs the AlphaDEX® stock selection methodology to select stocks from the Russell 1000®
Index.
» The NYSE constructs the StrataQuant® Consumer Staples Index by ranking the stocks which are members of the Russell 1000®
Index on growth factors including three, six and 12-month price appreciation, sales to price and one year sales growth, and,
separately, on value factors including book value to price, cash flow to price and return on assets.
» Stocks which Russell has classiï¬ed solely as growth or value, receive their score using the above growth or value factors respectively.
» Stocks which Russell allocates between both growth and value receive their best score between the growth and value factors.
» The NYSE then ranks those stocks contained in the consumer staples sector according to their score. The bottom 25% is
eliminated and the top 75% is selected for the StrataQuant® Consumer Staples Index.
» The selected stocks are divided into quintiles based on their rankings and the top ranked quintiles receive a higher weight within
the index. The stocks are equally-weighted within each quintile.
» The index is reconstituted and rebalanced quarterly.
» Fund Facts
Fund Ticker
CUSIP
Intraday NAV
Fund Inception Date
Gross Expense Ratio^
Net Expense Ratio
Rebalance Frequency
Primary Listing
FXG
33734X119
FXGIV
5/8/07
0.62%
0.62%
Quarterly
NYSE Arca
» Index Facts
Index Ticker
Index Inception Date
STRQCSTR
4/11/07
» Performance Summary (%)
Fund Performance*
Net Asset Value (NAV)
After Tax Held
After Tax Sold
Market Price
Index Performance**
StrataQuant® Consumer Staples Index
Russell 1000® Consumer Staples Index
Russell 1000® Index
S&P 500 Consumer Staples Index
» Calendar Year Total Returns (%)
FXG
Russell 1000® Consumer Staples Index
Russell 1000® Index
S&P 500 Consumer Staples Index
» 3-Year Statistics
FXG
S&P 500 Consumer Staples Index
Overall Morningstar Rating™
Quarter
YTD
1 Year
3 Years
5 Years
10 Years
Since Inception
6.37
6.21
3.61
6.39
6.14
5.37
3.47
6.14
6.14
5.37
3.47
6.14
22.17
21.46
17.25
22.21
17.68
17.06
14.03
17.68
—
—
—
—
11.10
10.55
8.81
11.10
6.53
7.82
6.50
7.64
6.71
8.21
0.92
6.60
6.71
8.21
0.92
6.60
23.01
17.37
15.01
15.96
18.60
15.28
12.44
14.51
—
—
—
—
11.94
—
5.94
10.48
2005
—
—
—
—
2006
—
—
—
—
Standard Deviation (%)
12.79
11.33
2007
—
—
—
—
2008
-24.67
—
-37.60
-15.43
Alpha
6.10
—
2009
27.13
18.41
28.43
14.89
2010
19.81
15.18
16.10
14.11
Beta
0.96
1.00
2011
13.15
14.49
1.50
13.99
2012
9.39
10.01
16.42
10.76
Sharpe Ratio
1.62
1.35
2013
41.94
27.68
33.11
26.14
2014
21.05
17.02
13.24
15.98
2015
6.14
8.21
0.92
6.60
Correlation
0.85
1.00
Among 23 funds in the Consumer Defensive category.
This fund was rated 4 stars/23 funds (3 years), 4 stars/23 funds (5 years).§
Performance data quoted represents past performance. Past performance is not a guarantee of future results and current performance may be higher or lower than performance quoted.
Investment returns and principal value will fluctuate and shares when sold or redeemed, may be worth more or less than their original cost.
You can obtain performance information which is current through the most recent month-end by visiting www.ftportfolios.com. ^Expenses are capped contractually at 0.70% per year, at least until November 30, 2016. *After Tax Held returns represent return after taxes on distributions. Assumes shares have not been sold. After Tax Sold returns represent the return after taxes on distributions and the sale of fund shares.
Returns do not represent the returns you would receive if you traded shares at other times. Market Price returns are based on the midpoint of the bid/ask spread. Returns are average annualized total returns, except those for periods of less than one year, which are cumulative.
The fund’s performance reflects fee waivers and expense reimbursements, absent which performance would have been lower. After-tax returns are calculated using the historical highest individual federal marginal income tax rates and do not reflect the impact of state and local taxes. Actual after-tax returns depend on the investor’s tax situation and may differ from those shown.
The after-tax returns shown are not relevant to investors who hold their fund shares through tax-deferred arrangements such as 401(k) plans or individual retirement accounts. **Performance information for the StrataQuant® Consumer Staples Index is for illustrative purposes only and does not represent actual fund performance. Indexes do not charge management fees or brokerage expenses, and no such fees or expenses were deducted from the performance shown. Indexes are unmanaged and an investor cannot invest directly in an index. 1-866-848-9727 • www.ftportfolios.com .
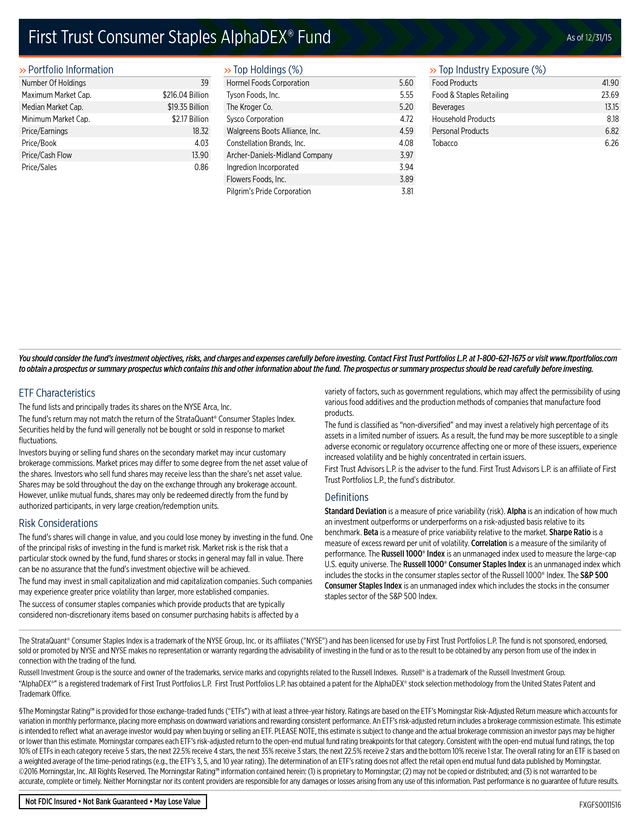
First Trust Consumer Staples AlphaDEX® Fund » Portfolio Information Number Of Holdings Maximum Market Cap. Median Market Cap. Minimum Market Cap. Price/Earnings Price/Book Price/Cash Flow Price/Sales As of 12/31/15 » Top Holdings (%) 39 $216.04 Billion $19.35 Billion $2.17 Billion 18.32 4.03 13.90 0.86 » Top Industry Exposure (%) Hormel Foods Corporation Tyson Foods, Inc. The Kroger Co. Sysco Corporation Walgreens Boots Alliance, Inc. Constellation Brands, Inc. Archer-Daniels-Midland Company Ingredion Incorporated Flowers Foods, Inc. Pilgrim’s Pride Corporation 5.60 5.55 5.20 4.72 4.59 4.08 3.97 3.94 3.89 3.81 Food Products Food & Staples Retailing Beverages Household Products Personal Products Tobacco 41.90 23.69 13.15 8.18 6.82 6.26 You should consider the fund’s investment objectives, risks, and charges and expenses carefully before investing. Contact First Trust Portfolios L.P. at 1-800-621-1675 or visit www.ftportfolios.com to obtain a prospectus or summary prospectus which contains this and other information about the fund. The prospectus or summary prospectus should be read carefully before investing. ETF Characteristics The fund lists and principally trades its shares on the NYSE Arca, Inc. The fund’s return may not match the return of the StrataQuant® Consumer Staples Index. Securities held by the fund will generally not be bought or sold in response to market fluctuations. Investors buying or selling fund shares on the secondary market may incur customary brokerage commissions.
Market prices may differ to some degree from the net asset value of the shares. Investors who sell fund shares may receive less than the share’s net asset value. Shares may be sold throughout the day on the exchange through any brokerage account. However, unlike mutual funds, shares may only be redeemed directly from the fund by authorized participants, in very large creation/redemption units. Risk Considerations The fund’s shares will change in value, and you could lose money by investing in the fund. One of the principal risks of investing in the fund is market risk.
Market risk is the risk that a particular stock owned by the fund, fund shares or stocks in general may fall in value. There can be no assurance that the fund’s investment objective will be achieved. The fund may invest in small capitalization and mid capitalization companies. Such companies may experience greater price volatility than larger, more established companies. The success of consumer staples companies which provide products that are typically considered non-discretionary items based on consumer purchasing habits is affected by a variety of factors, such as government regulations, which may affect the permissibility of using various food additives and the production methods of companies that manufacture food products. The fund is classiï¬ed as “non-diversiï¬ed” and may invest a relatively high percentage of its assets in a limited number of issuers.
As a result, the fund may be more susceptible to a single adverse economic or regulatory occurrence affecting one or more of these issuers, experience increased volatility and be highly concentrated in certain issuers. First Trust Advisors L.P. is the adviser to the fund. First Trust Advisors L.P.
is an affiliate of First Trust Portfolios L.P., the fund’s distributor. Deï¬nitions Standard Deviation is a measure of price variability (risk). Alpha is an indication of how much an investment outperforms or underperforms on a risk-adjusted basis relative to its benchmark. Beta is a measure of price variability relative to the market.
Sharpe Ratio is a measure of excess reward per unit of volatility. Correlation is a measure of the similarity of performance. The Russell 1000® Index is an unmanaged index used to measure the large-cap U.S.
equity universe. The Russell 1000® Consumer Staples Index is an unmanaged index which includes the stocks in the consumer staples sector of the Russell 1000® Index. The S&P 500 Consumer Staples Index is an unmanaged index which includes the stocks in the consumer staples sector of the S&P 500 Index. The StrataQuant® Consumer Staples Index is a trademark of the NYSE Group, Inc.
or its affiliates ("NYSE") and has been licensed for use by First Trust Portfolios L.P. The fund is not sponsored, endorsed, sold or promoted by NYSE and NYSE makes no representation or warranty regarding the advisability of investing in the fund or as to the result to be obtained by any person from use of the index in connection with the trading of the fund. Russell Investment Group is the source and owner of the trademarks, service marks and copyrights related to the Russell Indexes. Russell® is a trademark of the Russell Investment Group. “AlphaDEX®” is a registered trademark of First Trust Portfolios L.P.
First Trust Portfolios L.P. has obtained a patent for the AlphaDEX® stock selection methodology from the United States Patent and Trademark Office. §The Morningstar Rating™ is provided for those exchange-traded funds (“ETFs”) with at least a three-year history. Ratings are based on the ETF’s Morningstar Risk-Adjusted Return measure which accounts for variation in monthly performance, placing more emphasis on downward variations and rewarding consistent performance.
An ETF’s risk-adjusted return includes a brokerage commission estimate. This estimate is intended to reflect what an average investor would pay when buying or selling an ETF. PLEASE NOTE, this estimate is subject to change and the actual brokerage commission an investor pays may be higher or lower than this estimate.
Morningstar compares each ETF’s risk-adjusted return to the open-end mutual fund rating breakpoints for that category. Consistent with the open-end mutual fund ratings, the top 10% of ETFs in each category receive 5 stars, the next 22.5% receive 4 stars, the next 35% receive 3 stars, the next 22.5% receive 2 stars and the bottom 10% receive 1 star. The overall rating for an ETF is based on a weighted average of the time-period ratings (e.g., the ETF’s 3, 5, and 10 year rating).
The determination of an ETF’s rating does not affect the retail open end mutual fund data published by Morningstar. ©2016 Morningstar, Inc. All Rights Reserved. The Morningstar Rating™ information contained herein: (1) is proprietary to Morningstar; (2) may not be copied or distributed; and (3) is not warranted to be accurate, complete or timely.
Neither Morningstar nor its content providers are responsible for any damages or losses arising from any use of this information. Past performance is no guarantee of future results. Not FDIC Insured • Not Bank Guaranteed • May Lose Value FXGFS0011516 .
You can obtain performance information which is current through the most recent month-end by visiting www.ftportfolios.com. ^Expenses are capped contractually at 0.70% per year, at least until November 30, 2016. *After Tax Held returns represent return after taxes on distributions. Assumes shares have not been sold. After Tax Sold returns represent the return after taxes on distributions and the sale of fund shares.
Returns do not represent the returns you would receive if you traded shares at other times. Market Price returns are based on the midpoint of the bid/ask spread. Returns are average annualized total returns, except those for periods of less than one year, which are cumulative.
The fund’s performance reflects fee waivers and expense reimbursements, absent which performance would have been lower. After-tax returns are calculated using the historical highest individual federal marginal income tax rates and do not reflect the impact of state and local taxes. Actual after-tax returns depend on the investor’s tax situation and may differ from those shown.
The after-tax returns shown are not relevant to investors who hold their fund shares through tax-deferred arrangements such as 401(k) plans or individual retirement accounts. **Performance information for the StrataQuant® Consumer Staples Index is for illustrative purposes only and does not represent actual fund performance. Indexes do not charge management fees or brokerage expenses, and no such fees or expenses were deducted from the performance shown. Indexes are unmanaged and an investor cannot invest directly in an index. 1-866-848-9727 • www.ftportfolios.com .
First Trust Consumer Staples AlphaDEX® Fund » Portfolio Information Number Of Holdings Maximum Market Cap. Median Market Cap. Minimum Market Cap. Price/Earnings Price/Book Price/Cash Flow Price/Sales As of 12/31/15 » Top Holdings (%) 39 $216.04 Billion $19.35 Billion $2.17 Billion 18.32 4.03 13.90 0.86 » Top Industry Exposure (%) Hormel Foods Corporation Tyson Foods, Inc. The Kroger Co. Sysco Corporation Walgreens Boots Alliance, Inc. Constellation Brands, Inc. Archer-Daniels-Midland Company Ingredion Incorporated Flowers Foods, Inc. Pilgrim’s Pride Corporation 5.60 5.55 5.20 4.72 4.59 4.08 3.97 3.94 3.89 3.81 Food Products Food & Staples Retailing Beverages Household Products Personal Products Tobacco 41.90 23.69 13.15 8.18 6.82 6.26 You should consider the fund’s investment objectives, risks, and charges and expenses carefully before investing. Contact First Trust Portfolios L.P. at 1-800-621-1675 or visit www.ftportfolios.com to obtain a prospectus or summary prospectus which contains this and other information about the fund. The prospectus or summary prospectus should be read carefully before investing. ETF Characteristics The fund lists and principally trades its shares on the NYSE Arca, Inc. The fund’s return may not match the return of the StrataQuant® Consumer Staples Index. Securities held by the fund will generally not be bought or sold in response to market fluctuations. Investors buying or selling fund shares on the secondary market may incur customary brokerage commissions.
Market prices may differ to some degree from the net asset value of the shares. Investors who sell fund shares may receive less than the share’s net asset value. Shares may be sold throughout the day on the exchange through any brokerage account. However, unlike mutual funds, shares may only be redeemed directly from the fund by authorized participants, in very large creation/redemption units. Risk Considerations The fund’s shares will change in value, and you could lose money by investing in the fund. One of the principal risks of investing in the fund is market risk.
Market risk is the risk that a particular stock owned by the fund, fund shares or stocks in general may fall in value. There can be no assurance that the fund’s investment objective will be achieved. The fund may invest in small capitalization and mid capitalization companies. Such companies may experience greater price volatility than larger, more established companies. The success of consumer staples companies which provide products that are typically considered non-discretionary items based on consumer purchasing habits is affected by a variety of factors, such as government regulations, which may affect the permissibility of using various food additives and the production methods of companies that manufacture food products. The fund is classiï¬ed as “non-diversiï¬ed” and may invest a relatively high percentage of its assets in a limited number of issuers.
As a result, the fund may be more susceptible to a single adverse economic or regulatory occurrence affecting one or more of these issuers, experience increased volatility and be highly concentrated in certain issuers. First Trust Advisors L.P. is the adviser to the fund. First Trust Advisors L.P.
is an affiliate of First Trust Portfolios L.P., the fund’s distributor. Deï¬nitions Standard Deviation is a measure of price variability (risk). Alpha is an indication of how much an investment outperforms or underperforms on a risk-adjusted basis relative to its benchmark. Beta is a measure of price variability relative to the market.
Sharpe Ratio is a measure of excess reward per unit of volatility. Correlation is a measure of the similarity of performance. The Russell 1000® Index is an unmanaged index used to measure the large-cap U.S.
equity universe. The Russell 1000® Consumer Staples Index is an unmanaged index which includes the stocks in the consumer staples sector of the Russell 1000® Index. The S&P 500 Consumer Staples Index is an unmanaged index which includes the stocks in the consumer staples sector of the S&P 500 Index. The StrataQuant® Consumer Staples Index is a trademark of the NYSE Group, Inc.
or its affiliates ("NYSE") and has been licensed for use by First Trust Portfolios L.P. The fund is not sponsored, endorsed, sold or promoted by NYSE and NYSE makes no representation or warranty regarding the advisability of investing in the fund or as to the result to be obtained by any person from use of the index in connection with the trading of the fund. Russell Investment Group is the source and owner of the trademarks, service marks and copyrights related to the Russell Indexes. Russell® is a trademark of the Russell Investment Group. “AlphaDEX®” is a registered trademark of First Trust Portfolios L.P.
First Trust Portfolios L.P. has obtained a patent for the AlphaDEX® stock selection methodology from the United States Patent and Trademark Office. §The Morningstar Rating™ is provided for those exchange-traded funds (“ETFs”) with at least a three-year history. Ratings are based on the ETF’s Morningstar Risk-Adjusted Return measure which accounts for variation in monthly performance, placing more emphasis on downward variations and rewarding consistent performance.
An ETF’s risk-adjusted return includes a brokerage commission estimate. This estimate is intended to reflect what an average investor would pay when buying or selling an ETF. PLEASE NOTE, this estimate is subject to change and the actual brokerage commission an investor pays may be higher or lower than this estimate.
Morningstar compares each ETF’s risk-adjusted return to the open-end mutual fund rating breakpoints for that category. Consistent with the open-end mutual fund ratings, the top 10% of ETFs in each category receive 5 stars, the next 22.5% receive 4 stars, the next 35% receive 3 stars, the next 22.5% receive 2 stars and the bottom 10% receive 1 star. The overall rating for an ETF is based on a weighted average of the time-period ratings (e.g., the ETF’s 3, 5, and 10 year rating).
The determination of an ETF’s rating does not affect the retail open end mutual fund data published by Morningstar. ©2016 Morningstar, Inc. All Rights Reserved. The Morningstar Rating™ information contained herein: (1) is proprietary to Morningstar; (2) may not be copied or distributed; and (3) is not warranted to be accurate, complete or timely.
Neither Morningstar nor its content providers are responsible for any damages or losses arising from any use of this information. Past performance is no guarantee of future results. Not FDIC Insured • Not Bank Guaranteed • May Lose Value FXGFS0011516 .