


Description
First Trust Exchange-Traded Fund III
First Trust Long/Short Equity ETF (FTLS)
Annual Report
For the Year Ended
October 31, 2015
. Table of Contents
First Trust Long/Short Equity ETF (FTLS)
Annual Report
October 31, 2015
Shareholder Letter . . . .
. . .
. . .
. . .
. . .
. . .
. . .
. . .
. . .
. . .
. . .
. . .
. . .
. . .
. . .
. . .
. . .
. . .
. . .
. . .
. . .
. . .
. . .
. . .
. . .
. . .
. . .
. . .
. . .
. . . Fund Performance Overview .
. . .
. . .
. . .
. . .
. . .
. . .
. . .
. . .
. . .
. . .
. . .
. . .
. . .
. . .
. . .
. . .
. . .
. . .
. . .
. . .
. . .
. . .
. . .
. . .
. . .
. . .
. . . Portfolio Commentary .
. . .
. . .
. . .
. . .
. . .
. . .
. . .
. . .
. . .
. . .
. . .
. . .
. . .
. . .
. . .
. . .
. . .
. . .
. . .
. . .
. . .
. . .
. . .
. . .
. . .
. . .
. . .
. . .
. . . Understanding Your Fund Expenses .
. . .
. . .
. . .
. . .
. . .
. . .
. . .
. . .
. . .
. . .
. . .
. . .
. . .
. . .
. . .
. . .
. . .
. . .
. . .
. . .
. . .
. . .
. . .
. . .
. . .
. Portfolio of Investments . . .
. . .
. . .
. . .
. . .
. . .
. . .
. . .
. . .
. . .
. . .
. . .
. . .
. . .
. . .
. . .
. . .
. . .
. . .
. . .
. . .
. . .
. . .
. . .
. . .
. . .
. . .
. . .
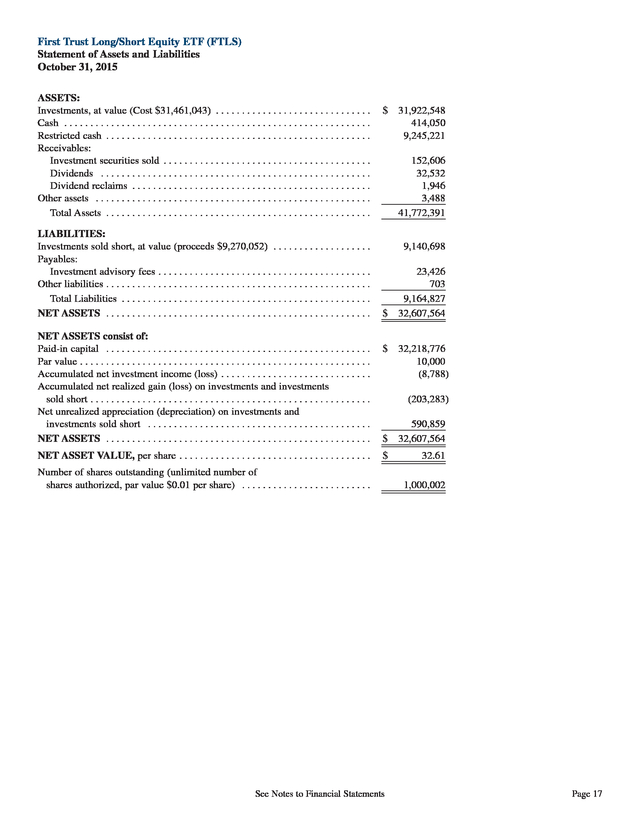
. . Statement of Assets and Liabilities . .
. . .
. . .
. . .
. . .
. . .
. . .
. . .
. . .
. . .
. . .
. . .
. . .
. . .
. . .
. . .
. . .
. . .
. . .
. . .
. . .
. . .
. . .
. . .
. . .
. . .
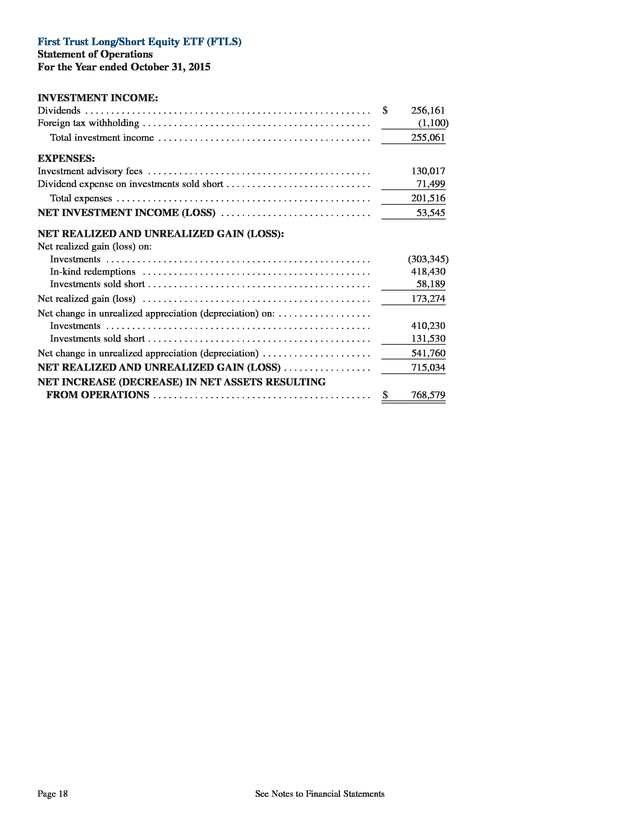
. Statement of Operations . . .
. . .
. . .
. . .
. . .
. . .
. . .
. . .
. . .
. . .
. . .
. . .
. . .
. . .
. . .
. . .
. . .
. . .
. . .
. . .
. . .
. . .
. . .
. . .
. . .
. . .
. . .
. . .
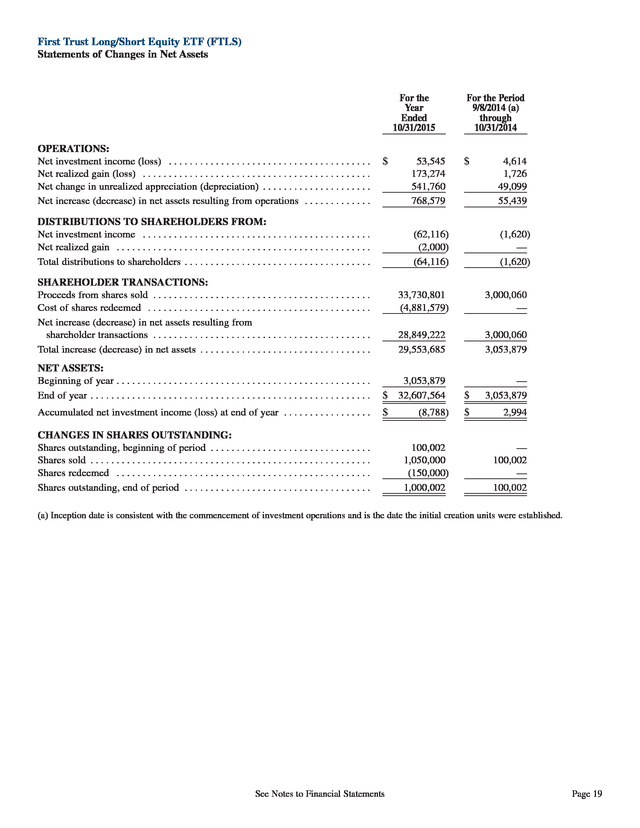
. . Statements of Changes in Net Assets . .
. . .
. . .
. . .
. . .
. . .
. . .
. . .
. . .
. . .
. . .
. . .
. . .
. . .
. . .
. . .
. . .
. . .
. . .
. . .
. . .
. . .
. . .
. . .
. . .
. . Financial Highlights . .
. . .
. . .
. . .
. . .
. . .
. . .
. . .
. . .
. . .
. . .
. . .
. . .
. . .
. . .
. . .
. . .
. . .
. . .
. . .
. . .
. . .
. . .
. . .
. . .
. . .
. . .
. . .
. . .
. . . Notes to Financial Statements .
. . .
. . .
. . .
. . .
. . .
. . .
. . .
. . .
. . .
. . .
. . .
. . .
. . .
. . .
. . .
. . .
. . .
. . .
. . .
. . .
. . .
. . .
. . .
. . .
. . .
. . .
. . . Report of Independent Registered Public Accounting Firm .
. . .
. . .
. . .
. . .
. . .
. . .
. . .
. . .
. . .
. . .
. . .
. . .
. . .
. . .
. . .
. . .
. . .
. . .
. . .
. Additional Information . . .
. . .
. . .
. . .
. . .
. . .
. . .
. . .
. . .
. . .
. . .
. . .
. . .
. . .
. . .
. . .
. . .
. . .
. . .
. . .
. . .
. . .
. . .
. . .
. . .
. . .
. . .
. . .
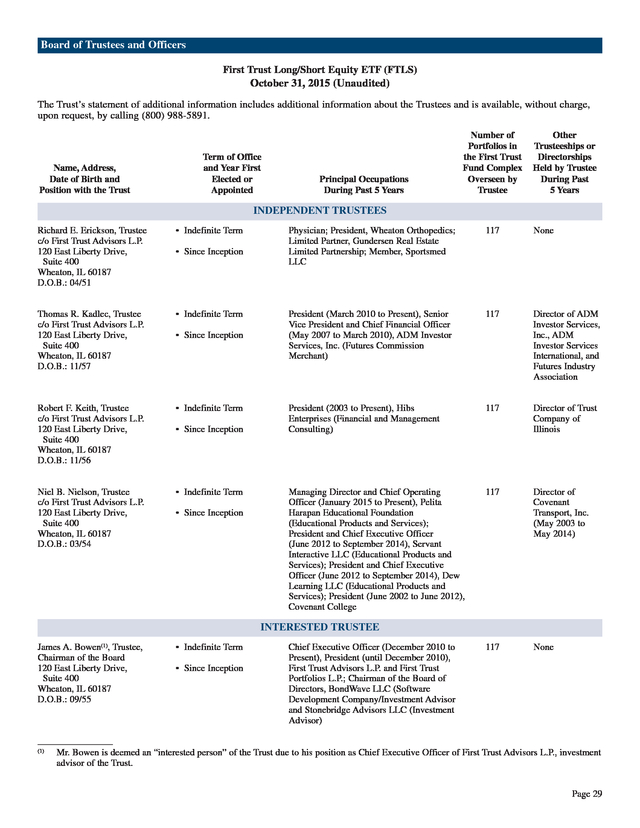
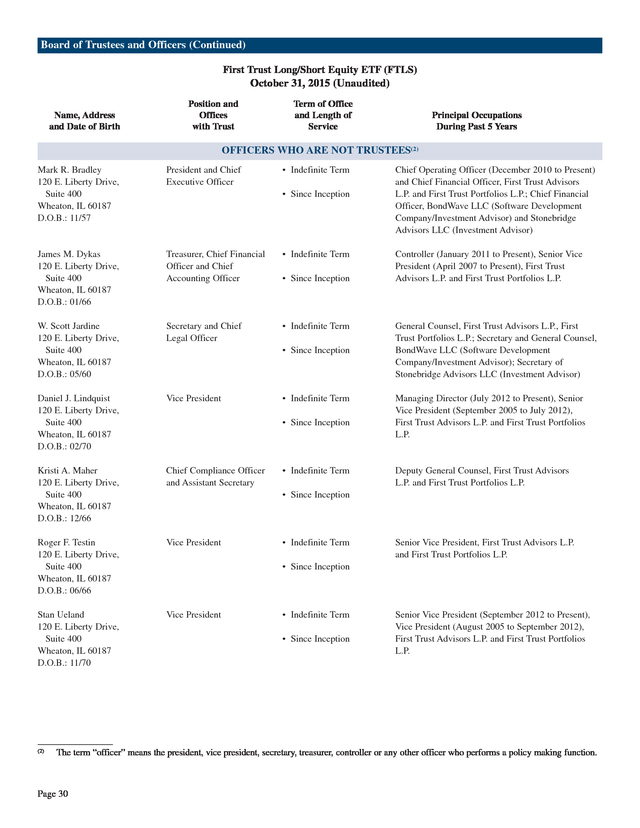
. . . Board of Trustees and Officers .
. . .
. . .
. . .
. . .
. . .
. . .
. . .
. . .
. . .
. . .
. . .
. . .
. . .
. . .
. . .
. . .
. . .
. . .
. . .
. . .
. . .
. . .
. . .
. . .
. . .
. . .
. . Privacy Policy . .
. . .
. . .
. . .
. . .
. . .
. . .
. . .
. . .
. . .
. . .
. . .
. . .
. . .
. . .
. . .
. . .
. . .
. . .
. . .
. . .
. . .
. . .
. . .
. . .
. . .
. . .
. . .
. . .
. . .
. . .
. . 1 2 5 7 8 17 18 19 20 21 26 27 29 31 Caution Regarding Forward-Looking Statements This report contains certain forward-looking statements within the meaning of the Securities Act of 1933, as amended, and the Securities Exchange Act of 1934, as amended. Forward-looking statements include statements regarding the goals, beliefs, plans or current expectations of First Trust Advisors L.P.
(“First Trust” or the “Advisor”) and its representatives, taking into account the information currently available to them. Forward-looking statements include all statements that do not relate solely to current or historical fact. For example, forward-looking statements include the use of words such as “anticipate,” “estimate,” “intend,” “expect,” “believe,” “plan,” “may,” “should,” “would” or other words that convey uncertainty of future events or outcomes. Forward-looking statements involve known and unknown risks, uncertainties and other factors that may cause the actual results, performance or achievements of the series of First Trust Exchange-Traded Fund III (the “Trust”) described in this report for the First Trust Long/Short Equity ETF (hereinafter referred to as the “Fund”) to be materially different from any future results, performance or achievements expressed or implied by the forward-looking statements.
When evaluating the information included in this report, you are cautioned not to place undue reliance on these forward-looking statements, which reflect the judgment of the Advisor and its representatives only as of the date hereof. We undertake no obligation to publicly revise or update these forward-looking statements to reflect events and circumstances that arise after the date hereof. Performance and Risk Disclosure There is no assurance that the Fund will achieve its investment objective. The Fund is subject to market risk, which is the possibility that the market values of securities owned by the Fund will decline and that the value of the Fund shares may therefore be less than what you paid for them.
Accordingly, you can lose money investing in the Fund. See “Risk Considerations” in the Additional Information section of this report for a discussion of certain other risks of investing in the Fund. Performance data quoted represents past performance, which is no guarantee of future results, and current performance may be lower or higher than the figures shown. For the most recent month-end performance figures, please visit http://www.ftportfolios.com or speak with your financial advisor.
Investment returns, net asset value and share price will fluctuate and Fund shares, when sold, may be worth more or less than their original cost. The Advisor may also periodically provide additional information on Fund performance on the Fund’s webpage at http://www.ftportfolios.com. How to Read This Report This report contains information that may help you evaluate your investment in the Fund. It includes details about the Fund’s portfolio and presents data and analysis that provide insight into the Fund’s performance and investment approach. By reading the portfolio commentary by the portfolio management team of the Fund, you may obtain an understanding of how the market environment affected the Fund’s performance. The statistical information that follows may help you understand the Fund’s performance compared to that of relevant market benchmarks. It is important to keep in mind that the opinions expressed by personnel of the Advisor are just that: informed opinions.
They should not be considered to be promises or advice. The opinions, like the statistics, cover the period through the date on the cover of this report. The material risks of investing in the Fund are spelled out in its prospectus, statement of additional information, this report and other Fund regulatory filings. .
Shareholder Letter First Trust Long/Short Equity ETF (FTLS) Annual Letter from the Chairman and CEO October 31, 2015 Dear Shareholders: Thank you for your investment in First Trust Long/Short Equity ETF (the “Fund”). First Trust Advisors L.P. (“First Trust”) is pleased to provide you with the annual report which contains detailed information about your investment for the 12 months ended October 31, 2015, including a market overview and a performance analysis for the period. We encourage you to read this report and discuss it with your financial advisor. U.S. markets, fueled by accelerating growth and an accommodating Federal Reserve, enjoyed a prosperous year in 2014. However, most of 2015 has been volatile.
Economic and global factors, such as the continued conflict in the Middle East, a sharp decline in oil prices and terrorism around the world, have impacted U.S. and global markets. Another factor that has weighed upon U.S.
markets for most of the year is the fact that many economists had predicted that the Federal Reserve would begin to raise interest rates in 2015, which has still not happened. As I have written previously, First Trust believes investors should maintain perspective about the markets and have realistic expectations about their investments. Markets will always go up and down, but we believe that having a long-term investment horizon and being invested in quality products can help you reach your goals. Thank you for giving First Trust the opportunity to be a part of your investment plan. We value the relationship and will continue to focus on our disciplined investment approach and long-term perspective to help investors reach their financial goals. Sincerely, James A.
Bowen Chairman of the Board of Trustees Chief Executive Officer of First Trust Advisors L.P. Page 1 . Fund Performance Overview (Unaudited) First Trust Long/Short Equity ETF (FTLS) The investment objective of First Trust Long/Short Equity ETF (the “Fund”) is to seek to provide investors with long-term total return. The Fund pursues its objective by establishing long and short positions in a portfolio of Equity Securities (as defined below). Under normal circumstances, at least 80% of the Fund’s net assets (plus the amount of any borrowing for investment purposes) will be exposed to U.S. exchange-listed equity securities of U.S. and foreign companies by investing in such securities directly and/or in U.S.
exchange-traded funds (“ETFs”) that provide exposure to such securities. The securities of the companies and ETFs in which the Fund will invest are referred to collectively as “Equity Securities.” The Equity Securities held by the Fund may include U.S. exchange-listed equity securities of foreign issuers, as well as investments in the equity securities of foreign issuers that are in the form of depositary receipts. The Fund takes long and short positions in Equity Securities. As opposed to taking long positions in which an investor seeks to profit from increases in the price of a security, short selling is a technique that will be used by the Fund to try and profit from the falling price of a security.
Short selling involves selling a security that has been borrowed from a third party with the intention of buying an identical security back at a later date to return to that third party. Having both long and short positions in an equity security portfolio is a common way to create returns that are independent of market moves. One advantage of a long and short portfolio is that the long and short positions may offset one another in a manner that results in a lower net exposure to the direction of the market. In addition, cash balances arising from the use of short selling typically will be held in money market instruments. Performance Average Annual Total Returns 1 Year Ended 10/31/15 Fund Performance NAV Market Price Index Performance S&P 500® Index Cumulative Total Returns Inception (9/8/14) to 10/31/15 Inception (9/8/14) to 10/31/15 7.60% 7.59% 8.33% 8.45% 9.60% 9.73% 5.20% 5.49% 6.31% Total returns for the period since inception are calculated from the inception date of the Fund.
“Average Annual Total Returns” represent the average annual change in value of an investment over the periods indicated. “Cumulative Total Returns” represent the total change in value of an investment over the period indicated. The Fund’s per share net asset value (“NAV”) is the value of one share of the Fund and is computed by dividing the value of all assets of the Fund (including accrued interest and dividends), less all liabilities (including accrued expenses and dividends declared but unpaid), by the total number of outstanding shares. The price used to calculate market return (“Market Price”) is determined by using the midpoint between the highest bid and the lowest offer on the stock exchange on which shares of the Fund are listed for trading as of the time that the Fund’s NAV is calculated.
Since shares of the Fund did not trade in the secondary market until after its inception, for the period from inception to the first day of secondary market trading in shares of the Fund, the NAV of the Fund is used as a proxy for the secondary market trading price to calculate market returns. NAV and market price returns assume that all distributions have been reinvested in the Fund at NAV and Market Price, respectively. An index is a statistical composite that tracks a specified financial market or sector. Unlike the Fund, the index does not actually hold a portfolio of securities and therefore does not incur the expenses incurred by the Fund.
These expenses negatively impact the performance of the Fund. Also, market returns do not include brokerage commissions that may be payable on secondary market transactions. If brokerage commissions were included, market returns would be lower.
The total returns presented reflect the reinvestment of dividends on securities in the index. The returns presented do not reflect the deduction of taxes that a shareholder would pay on Fund distributions or the redemption or sale of Fund shares. The investment return and principal value of shares of the Fund will vary with changes in market conditions.
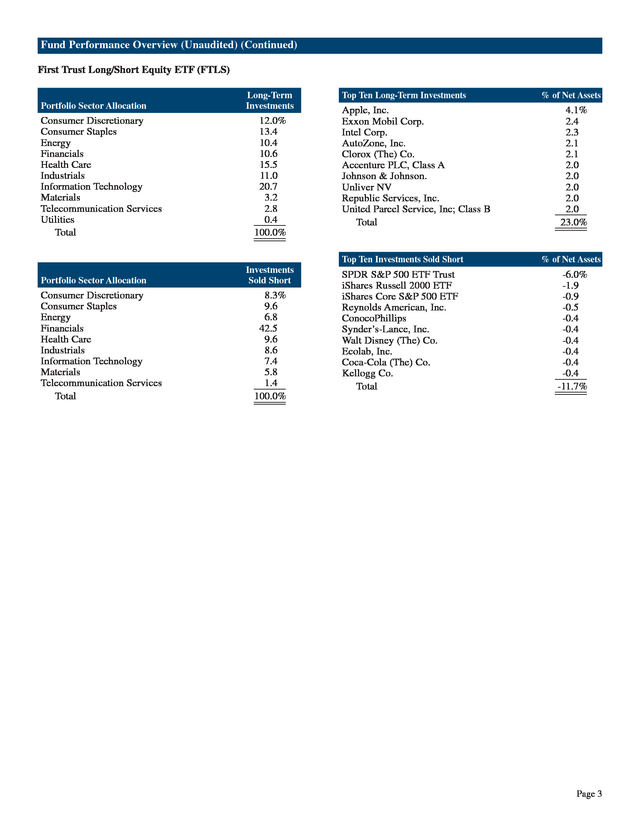
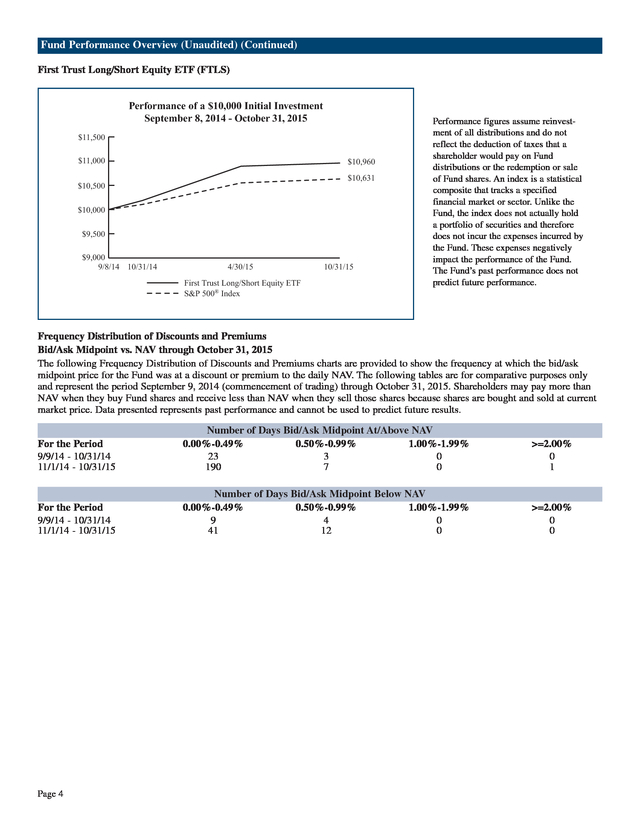
Shares of the Fund may be worth more or less than their original cost when they are redeemed or sold in the market. The Fund’s past performance is no guarantee of future performance. Page 2 . Fund Performance Overview (Unaudited) (Continued) First Trust Long/Short Equity ETF (FTLS) Portfolio Sector Allocation Consumer Discretionary Consumer Staples Energy Financials Health Care Industrials Information Technology Materials Telecommunication Services Utilities Total Long-Term Investments 12.0% 13.4 10.4 10.6 15.5 11.0 20.7 3.2 2.8 0.4 ________ 100.0% ________ ________ Top Ten Long-Term Investments Apple, Inc. Exxon Mobil Corp. Intel Corp. AutoZone, Inc. Clorox (The) Co. Accenture PLC, Class A Johnson & Johnson. Unliver NV Republic Services, Inc. United Parcel Service, Inc; Class B Total % of Net Assets 4.1% 2.4 2.3 2.1 2.1 2.0 2.0 2.0 2.0 2.0 ________ 23.0% ________ ________ Top Ten Investments Sold Short Portfolio Sector Allocation Consumer Discretionary Consumer Staples Energy Financials Health Care Industrials Information Technology Materials Telecommunication Services Total Investments Sold Short 8.3% 9.6 6.8 42.5 9.6 8.6 7.4 5.8 1.4 ________ 100.0% ________ ________ % of Net Assets SPDR S&P 500 ETF Trust iShares Russell 2000 ETF iShares Core S&P 500 ETF Reynolds American, Inc. ConocoPhillips Synder’s-Lance, Inc. Walt Disney (The) Co. Ecolab, Inc. Coca-Cola (The) Co. Kellogg Co. Total -6.0% -1.9 -0.9 -0.5 -0.4 -0.4 -0.4 -0.4 -0.4 -0.4 ________ -11.7% ________ ________ Page 3 . Fund Performance Overview (Unaudited) (Continued) First Trust Long/Short Equity ETF (FTLS) Performance of a $10,000 Initial Investment September 8, 2014 - October 31, 2015 $11,500 $11,000 $10,960 $10,631 $10,500 $10,000 $9,500 $9,000 9/8/14 10/31/14 4/30/15 First Trust Long/Short Equity ETF S&P 500® Index 10/31/15 Performance figures assume reinvestment of all distributions and do not reflect the deduction of taxes that a shareholder would pay on Fund distributions or the redemption or sale of Fund shares. An index is a statistical composite that tracks a specified financial market or sector. Unlike the Fund, the index does not actually hold a portfolio of securities and therefore does not incur the expenses incurred by the Fund. These expenses negatively impact the performance of the Fund. The Fund’s past performance does not predict future performance. Frequency Distribution of Discounts and Premiums Bid/Ask Midpoint vs.
NAV through October 31, 2015 The following Frequency Distribution of Discounts and Premiums charts are provided to show the frequency at which the bid/ask midpoint price for the Fund was at a discount or premium to the daily NAV. The following tables are for comparative purposes only and represent the period September 9, 2014 (commencement of trading) through October 31, 2015. Shareholders may pay more than NAV when they buy Fund shares and receive less than NAV when they sell those shares because shares are bought and sold at current market price.
Data presented represents past performance and cannot be used to predict future results. For the Period 9/9/14 - 10/31/14 11/1/14 - 10/31/15 Number of Days Bid/Ask Midpoint At/Above NAV 0.00%-0.49% 0.50%-0.99% 1.00%-1.99% 23 3 0 190 7 0 >=2.00% 0 1 For the Period 9/9/14 - 10/31/14 11/1/14 - 10/31/15 Number of Days Bid/Ask Midpoint Below NAV 0.00%-0.49% 0.50%-0.99% 1.00%-1.99% 9 4 0 41 12 0 >=2.00% 0 0 Page 4 . Portfolio Commentary First Trust Long/Short Equity ETF (FTLS) Annual Report October 31, 2015 Investment Manager The First Trust Advisors L.P. (“First Trust”) Alternatives Investment team was formed in July of 2011 and is headed by John Gambla, CFA, FRM, PRM and Rob Guttschow, CFA. Prior to joining First Trust, Messrs. Gambla and Guttschow were Co-Chief Investment Officers at Nuveen Hyde Park, a quantitative money manager.
The team focuses on systematic and disciplined strategies using a variety of statistical techniques along with a fundamental overlay based upon their combined 40+ years of investment experience. Currently the team manages/consults for a variety of portfolios structured as exchanged-traded funds and separately managed accounts in the United States, Canada, and Mexico. Portfolio Management Team John Gambla – CFA, FRM, PRM, Senior Portfolio Manager of First Trust, FTA-Alternatives & Active Management Team Rob Guttschow – CFA, Senior Portfolio Manager of First Trust, FTA-Alternatives & Active Management Team Commentary First Trust Long/Short Equity ETF The First Trust Long/Short Equity ETF (the “Fund” or “FTLS”) is an actively managed exchange-traded fund. The Fund’s investment objective is to seek to provide investors with long-term total return.
The Fund intends to pursue its investment objective by establishing long and short positions in a portfolio of Equity Securities. Under normal circumstances, at least 80% of the Fund’s net assets (plus the amount of any borrowing for investment purposes) will be exposed to U.S. exchange-listed equity securities of U.S.
and non-U.S. companies by investing in such securities directly and/or in U.S. exchange-traded funds (“ETFs”) that provide exposure to such securities. Overall Market Recap U.S. economic growth remained solid during the fiscal period from October 31, 2014 to October 31, 2015.
During the period, U.S. GDP as reported on September 30, 2015 grew by an estimated 2.0% with the headline U.S. unemployment rate falling in tandem, dropping from 5.7% in October of 2014 to 5.0% in October of 2015.
The total number of new non-farm payroll jobs created during the fiscal period was estimated at 2.8 million, or approximately 234,000 per month. The overall steady performance of the U.S. economy and the declining unemployment rate translated into modest gains for the S&P 500® Index, up 5.20% during the fiscal period. Interest rates, as measured by the U.S.
Government 10-Year Treasury, actually fell during the fiscal period with rates falling by 0.19%, ending the period at 2.14%. The Federal Open Market Committee (“FOMC”) left rates unchanged throughout the year, as global economic concerns weighed heavily on potential future U.S. growth.
In the early portion of the fiscal period, a collapse in the price of oil and a simultaneous rally in the U.S. dollar created deflationary pressures in the global economy and economic headwinds for U.S. exports.
Shortly thereafter the Greek debt restructuring process took several unexpected twists and turns, which created market uncertainty in Europe and further boosted the U.S. dollar rally. Finally, near the end of the fiscal period, China’s economy along with a variety of other emerging market economies appeared to be slowing quickly, resulting in more global growth uncertainty. Fund Performance – FTLS The Fund returned 7.59% on a market price basis and 7.60% on a net asset value (“NAV”) basis for the period from October 31, 2014 through October 31, 2015.
The Fund’s benchmark, the S&P 500® Index (“Benchmark”) returned 5.20% during the fiscal period. The fund’s investment process involves constructing both a long and short portfolio consisting of at least 80% in U.S. exchange-listed equity securities of U.S. and foreign companies such as common stocks and ETFs.
The portfolio management team follows a systematic portfolio construction process designed to balance the drivers of risk and return that exist between the long and short positions. The investment process uses Sabrient/Gradient’s EQR model ranking as an input to determine holdings, both long and short. Additional proprietary research is used to build the portfolio and to tactically manage both the overall percentage and composition of the long and short exposures in the portfolio. For the fiscal period, the Fund returned 7.60% on an NAV basis, outperforming its Benchmark by 2.40% net of all Fund fees.
The Fund’s net equity exposure varied between 70% and 80%, with the long positions being held at a fully invested position of approximately 100% and short positions varying between 20% and 30%. The Fund’s overall outperformance versus its Benchmark Page 5 . Portfolio Commentary (Continued) First Trust Long/Short Equity ETF (FTLS) Annual Report October 31, 2015 was the result of both the long and short positions adding value during the period. The long portfolio in aggregate substantially outperformed the Benchmark during the period and the shorts, in addition to reducing the overall market sensitivity of the portfolio and thereby reducing the overall volatility of the Fund, also added value by posting a negative total return during the performance period. The best performing relative sector exposures for the Fund for the fiscal period ended October 31, 2015 were the Energy and Industrials sector where the Fund was, on average, underweight the Benchmark during the year. The worst performing relative sector exposures for the Fund during the period were the Consumer Discretionary and Financials sectors, where the Fund was, on average, underweight the Benchmark. Market and Fund Outlook Today, we believe the Fund is well positioned to achieve its investment objective of seeking to provide investors with long-term total return.
The Fund is invested in a broad array of U.S. equity securities with a net market exposure of approximately 70% versus its unmanaged Benchmark’s exposure of 100%. We believe the Fund’s combination of a broadly diversified portfolio, which is long high quality stocks and short low quality stocks, as measured by an earnings quality model, positions the Fund well to continue to achieve its investment objective going forward. Page 6 .
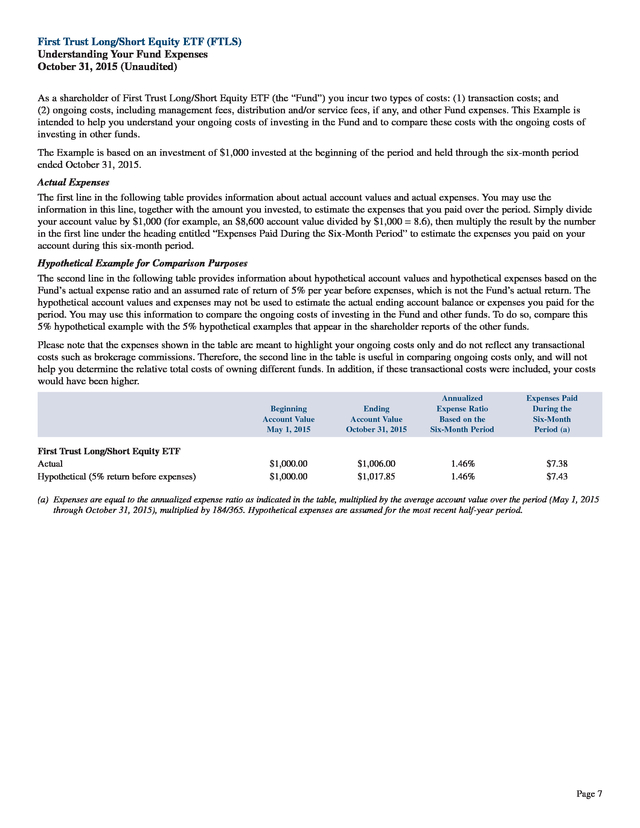
First Trust Long/Short Equity ETF (FTLS) Understanding Your Fund Expenses October 31, 2015 (Unaudited) As a shareholder of First Trust Long/Short Equity ETF (the “Fund”) you incur two types of costs: (1) transaction costs; and (2) ongoing costs, including management fees, distribution and/or service fees, if any, and other Fund expenses. This Example is intended to help you understand your ongoing costs of investing in the Fund and to compare these costs with the ongoing costs of investing in other funds. The Example is based on an investment of $1,000 invested at the beginning of the period and held through the six-month period ended October 31, 2015. Actual Expenses The first line in the following table provides information about actual account values and actual expenses. You may use the information in this line, together with the amount you invested, to estimate the expenses that you paid over the period. Simply divide your account value by $1,000 (for example, an $8,600 account value divided by $1,000 = 8.6), then multiply the result by the number in the first line under the heading entitled “Expenses Paid During the Six-Month Period” to estimate the expenses you paid on your account during this six-month period. Hypothetical Example for Comparison Purposes The second line in the following table provides information about hypothetical account values and hypothetical expenses based on the Fund’s actual expense ratio and an assumed rate of return of 5% per year before expenses, which is not the Fund’s actual return.
The hypothetical account values and expenses may not be used to estimate the actual ending account balance or expenses you paid for the period. You may use this information to compare the ongoing costs of investing in the Fund and other funds. To do so, compare this 5% hypothetical example with the 5% hypothetical examples that appear in the shareholder reports of the other funds. Please note that the expenses shown in the table are meant to highlight your ongoing costs only and do not reflect any transactional costs such as brokerage commissions.
Therefore, the second line in the table is useful in comparing ongoing costs only, and will not help you determine the relative total costs of owning different funds. In addition, if these transactional costs were included, your costs would have been higher. Beginning Account Value May 1, 2015 First Trust Long/Short Equity ETF Actual Hypothetical (5% return before expenses) Ending Account Value October 31, 2015 Annualized Expense Ratio Based on the Six-Month Period $1,000.00 $1,000.00 $1,006.00 $1,017.85 1.46% 1.46% Expenses Paid During the Six-Month Period (a) $7.38 $7.43 (a) Expenses are equal to the annualized expense ratio as indicated in the table, multiplied by the average account value over the period (May 1, 2015 through October 31, 2015), multiplied by 184/365. Hypothetical expenses are assumed for the most recent half-year period. Page 7 .
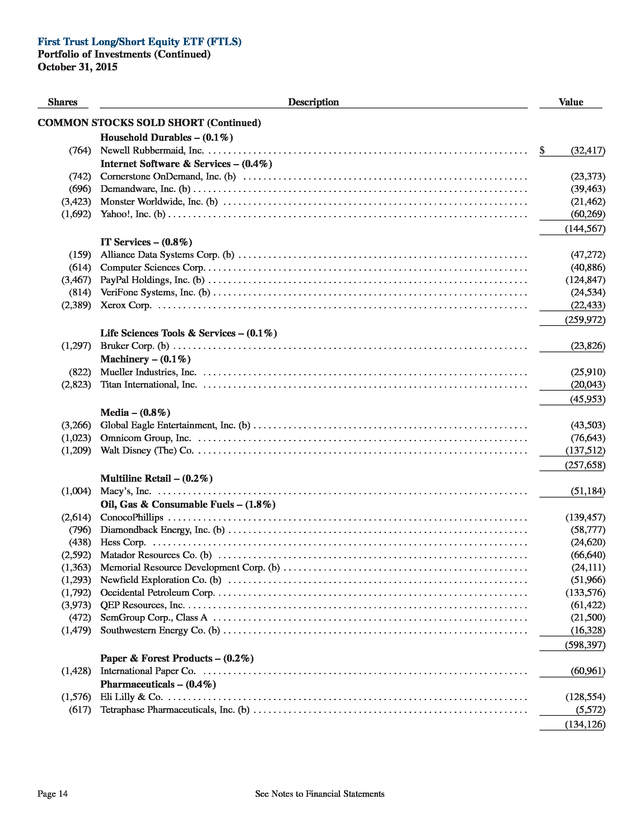
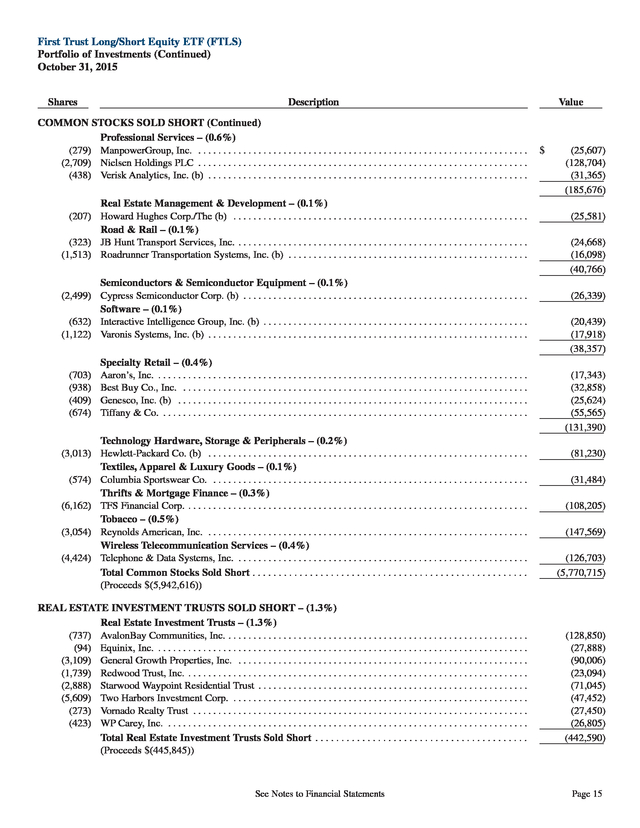
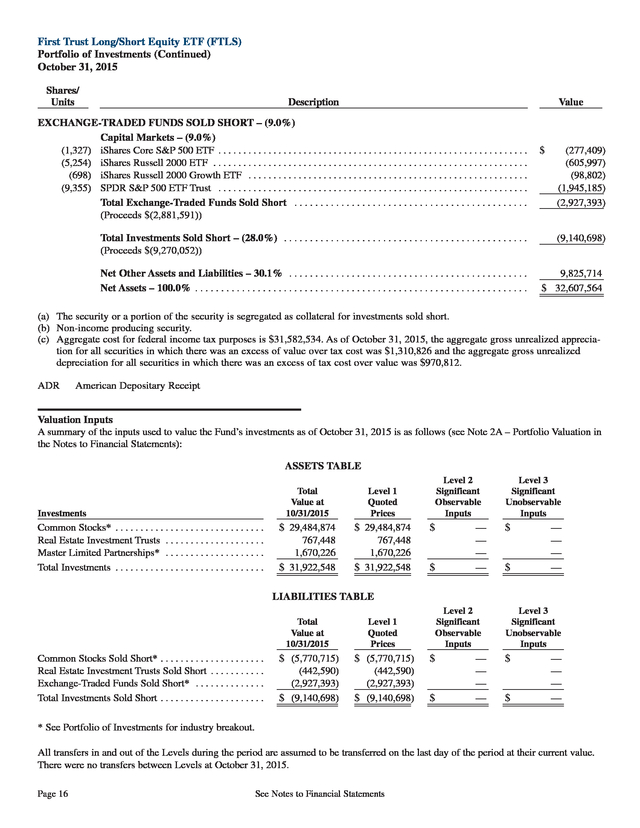
First Trust Long/Short Equity ETF (FTLS) Portfolio of Investments October 31, 2015 Shares _______________ Description ___________________________________________________________________________________________________________________________________ COMMON STOCKS – 90.4% Aerospace & Defense – 1.0% 2,242 Boeing (The) Co. (a) . . .
. . .
. . .
. . .
. . .
. . .
. . .
. . .
. . .
. . .
. . .
. . .
. . .
. . .
. . .
. . .
. . .
. . .
. . .
. . .
. . .
. . .
. Air Freight & Logistics – 2.0% 6,322 United Parcel Service, Inc., Class B (a) . . .
. . .
. . .
. . .
. . .
. . .
. . .
. . .
. . .
. . .
. . .
. . .
. . .
. . .
. . .
. . .
. . .
. Airlines – 3.3% 5,677 Alaska Air Group, Inc. (a) . .
. . .
. . .
. . .
. . .
. . .
. . .
. . .
. . .
. . .
. . .
. . .
. . .
. . .
. . .
. . .
. . .
. . .
. . .
. . .
. . .
. 5,495 JetBlue Airways Corp. (b) . .
. . .
. . .
. . .
. . .
. . .
. . .
. . .
. . .
. . .
. . .
. . .
. . .
. . .
. . .
. . .
. . .
. . .
. . .
. . .
. . .
. 2,121 Ryanair Holdings PLC . . .
. . .
. . .
. . .
. . .
. . .
. . .
. . .
. . .
. . .
. . .
. . .
. . .
. . .
. . .
. . .
. . .
. . .
. . .
. . .
. . .
. . . 9,261 Virgin America, Inc.
(b) . . .
. . .
. . .
. . .
. . .
. . .
. . .
. . .
. . .
. . .
. . .
. . .
. . .
. . .
. . .
. . .
. . .
. . .
. . .
. . .
. . .
. . 19,657 11,661 2,815 3,737 7,657 10,660 8,841 13,126 Auto Components – 0.4% Tower International, Inc. .
. . .
. . .
. . .
. . .
. . .
. . .
. . .
. . .
. . .
. . .
. . .
. . .
. . .
. . .
. . .
. . .
. . .
. . .
. . .
. . .
. . . Banks – 7.4% Banco Santander S.A., ADR .
. . .
. . .
. . .
. . .
. . .
. . .
. . .
. . .
. . .
. . .
. . .
. . .
. . .
. . .
. . .
. . .
. . .
. . .
. . .
. . . Barclays PLC, ADR .
. . .
. . .
. . .
. . .
. . .
. . .
. . .
. . .
. . .
. . .
. . .
. . .
. . .
. . .
. . .
. . .
. . .
. . .
. . .
. . .
. . .
. . .
. CIT Group, Inc. (a) . .
. . .
. . .
. . .
. . .
. . .
. . .
. . .
. . .
. . .
. . .
. . .
. . .
. . .
. . .
. . .
. . .
. . .
. . .
. . .
. . .
. . .
. . .
. Citigroup, Inc. (a) . .
. . .
. . .
. . .
. . .
. . .
. . .
. . .
. . .
. . .
. . .
. . .
. . .
. . .
. . .
. . .
. . .
. . .
. . .
. . .
. . .
. . .
. . .
. . FCB Financial Holdings, Inc. (b) .
. . .
. . .
. . .
. . .
. . .
. . .
. . .
. . .
. . .
. . .
. . .
. . .
. . .
. . .
. . .
. . .
. . .
. . .
. . HSBC Holdings PLC, ADR (a) . .
. . .
. . .
. . .
. . .
. . .
. . .
. . .
. . .
. . .
. . .
. . .
. . .
. . .
. . .
. . .
. . .
. . .
. . .
. . . JPMorgan Chase & Co.
(a) . . .
. . .
. . .
. . .
. . .
. . .
. . .
. . .
. . .
. . .
. . .
. . .
. . .
. . .
. . .
. . .
. . .
. . .
. . .
. . .
. . U.S. Bancorp (a) .
. . .
. . .
. . .
. . .
. . .
. . .
. . .
. . .
. . .
. . .
. . .
. . .
. . .
. . .
. . .
. . .
. . .
. . .
. . .
. . .
. . .
. . .
. . .
. 2,321 3,975 6,179 22,262 10,819 Biotechnology – 3.4% Amgen, Inc. (a) . .
. . .
. . .
. . .
. . .
. . .
. . .
. . .
. . .
. . .
. . .
. . .
. . .
. . .
. . .
. . .
. . .
. . .
. . .
. . .
. . .
. . .
. . .
. . .
. Gilead Sciences, Inc. (a) . .
. . .
. . .
. . .
. . .
. . .
. . .
. . .
. . .
. . .
. . .
. . .
. . .
. . .
. . .
. . .
. . .
. . .
. . .
. . .
. . .
. . Halozyme Therapeutics, Inc. (b) .
. . .
. . .
. . .
. . .
. . .
. . .
. . .
. . .
. . .
. . .
. . .
. . .
. . .
. . .
. . .
. . .
. . .
. . .
. . . PDL BioPharma, Inc.
. . .
. . .
. . .
. . .
. . .
. . .
. . .
. . .
. . .
. . .
. . .
. . .
. . .
. . .
. . .
. . .
. . .
. . .
. . .
. . .
. . .
. . .
. Vanda Pharmaceuticals, Inc. (b) . .
. . .
. . .
. . .
. . .
. . .
. . .
. . .
. . .
. . .
. . .
. . .
. . .
. . .
. . .
. . .
. . .
. . .
. . .
. . 5,741 2,062 Building Products – 1.0% Masco Corp. .
. . .
. . .
. . .
. . .
. . .
. . .
. . .
. . .
. . .
. . .
. . .
. . .
. . .
. . .
. . .
. . .
. . .
. . .
. . .
. . .
. . .
. . .
. . .
. . .
. Universal Forest Products, Inc. . .
. . .
. . .
. . .
. . .
. . .
. . .
. . .
. . .
. . .
. . .
. . .
. . .
. . .
. . .
. . .
. . .
. . .
. . .
. . . 2,904 1,464 Chemicals – 0.9% Dow Chemical (The) Co.
. . .
. . .
. . .
. . .
. . .
. . .
. . .
. . .
. . .
. . .
. . .
. . .
. . .
. . .
. . .
. . .
. . .
. . .
. . .
. . .
. . .
. LyondellBasell Industries NV (a) . . .
. . .
. . .
. . .
. . .
. . .
. . .
. . .
. . .
. . .
. . .
. . .
. . .
. . .
. . .
. . .
. . .
. . .
. . . 4,924 Value ___________________ $ 331,973 ___________________ 651,292 ___________________ 432,871 136,496 165,841 329,784 ___________________ 1,064,992 ___________________ 135,262 ___________________ 108,900 165,936 121,045 198,696 272,283 416,486 568,034 553,655 ___________________ 2,405,035 ___________________ 367,136 429,817 96,701 101,960 116,196 ___________________ 1,111,810 ___________________ 166,489 149,763 ___________________ 316,252 ___________________ 150,050 136,020 ___________________ 286,070 ___________________ 15,040 2,617 8,884 3,517 12,559 Page 8 Commercial Services & Supplies – 2.0% Republic Services, Inc.
(a) . . .
. . .
. . .
. . .
. . .
. . .
. . .
. . .
. . .
. . .
. . .
. . .
. . .
. . .
. . .
. . .
. . .
. . .
. . .
. . .
. . . Consumer Finance – 0.6% Capital One Financial Corp.
. . .
. . .
. . .
. . .
. . .
. . .
. . .
. . .
. . .
. . .
. . .
. . .
. . .
. . .
. . .
. . .
. . .
. . .
. . .
. . .
. Containers & Packaging – 0.4% Graphic Packaging Holding Co. (a) . .
. . .
. . .
. . .
. . .
. . .
. . .
. . .
. . .
. . .
. . .
. . .
. . .
. . .
. . .
. . .
. . .
. . .
. . Diversified Consumer Services – 1.7% 2U, Inc. (b) .
. . .
. . .
. . .
. . .
. . .
. . .
. . .
. . .
. . .
. . .
. . .
. . .
. . .
. . .
. . .
. . .
. . .
. . .
. . .
. . .
. . .
. . .
. . .
. . .
. . H&R Block, Inc. .
. . .
. . .
. . .
. . .
. . .
. . .
. . .
. . .
. . .
. . .
. . .
. . .
. . .
. . .
. . .
. . .
. . .
. . .
. . .
. . .
. . .
. . .
. . . See Notes to Financial Statements 657,850 ___________________ 206,481 ___________________ 125,797 ___________________ 73,787 467,948 ___________________ 541,735 ___________________ .
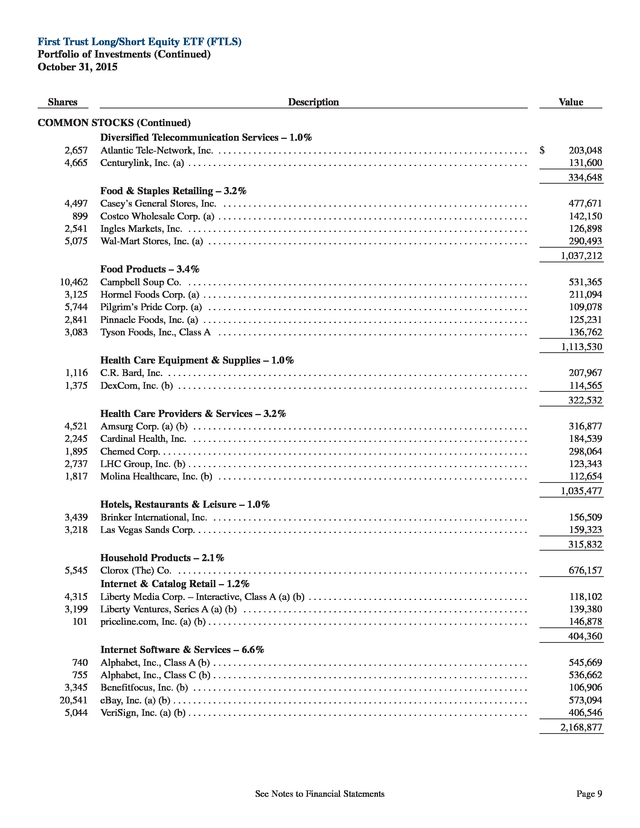
First Trust Long/Short Equity ETF (FTLS) Portfolio of Investments (Continued) October 31, 2015 Shares _______________ Description ___________________________________________________________________________________________________________________________________ COMMON STOCKS (Continued) Diversified Telecommunication Services – 1.0% 2,657 Atlantic Tele-Network, Inc. . . .
. . .
. . .
. . .
. . .
. . .
. . .
. . .
. . .
. . .
. . .
. . .
. . .
. . .
. . .
. . .
. . .
. . .
. . .
. . .
. . 4,665 Centurylink, Inc. (a) .
. . .
. . .
. . .
. . .
. . .
. . .
. . .
. . .
. . .
. . .
. . .
. . .
. . .
. . .
. . .
. . .
. . .
. . .
. . .
. . .
. . .
. . .
. 4,497 899 2,541 5,075 Food & Staples Retailing – 3.2% Casey’s General Stores, Inc. . .
. . .
. . .
. . .
. . .
. . .
. . .
. . .
. . .
. . .
. . .
. . .
. . .
. . .
. . .
. . .
. . .
. . .
. . .
. . .
. . Costco Wholesale Corp. (a) .
. . .
. . .
. . .
. . .
. . .
. . .
. . .
. . .
. . .
. . .
. . .
. . .
. . .
. . .
. . .
. . .
. . .
. . .
. . .
. . .
. Ingles Markets, Inc. . .
. . .
. . .
. . .
. . .
. . .
. . .
. . .
. . .
. . .
. . .
. . .
. . .
. . .
. . .
. . .
. . .
. . .
. . .
. . .
. . .
. . .
. . . Wal-Mart Stores, Inc.
(a) . . .
. . .
. . .
. . .
. . .
. . .
. . .
. . .
. . .
. . .
. . .
. . .
. . .
. . .
. . .
. . .
. . .
. . .
. . .
. . .
. . .
. 10,462 3,125 5,744 2,841 3,083 Food Products – 3.4% Campbell Soup Co. . .
. . .
. . .
. . .
. . .
. . .
. . .
. . .
. . .
. . .
. . .
. . .
. . .
. . .
. . .
. . .
. . .
. . .
. . .
. . .
. . .
. . .
. . . Hormel Foods Corp.
(a) . . .
. . .
. . .
. . .
. . .
. . .
. . .
. . .
. . .
. . .
. . .
. . .
. . .
. . .
. . .
. . .
. . .
. . .
. . .
. . .
. . .
. . Pilgrim’s Pride Corp. (a) .
. . .
. . .
. . .
. . .
. . .
. . .
. . .
. . .
. . .
. . .
. . .
. . .
. . .
. . .
. . .
. . .
. . .
. . .
. . .
. . .
. . . Pinnacle Foods, Inc.
(a) . . .
. . .
. . .
. . .
. . .
. . .
. . .
. . .
. . .
. . .
. . .
. . .
. . .
. . .
. . .
. . .
. . .
. . .
. . .
. . .
. . .
. . Tyson Foods, Inc., Class A . .
. . .
. . .
. . .
. . .
. . .
. . .
. . .
. . .
. . .
. . .
. . .
. . .
. . .
. . .
. . .
. . .
. . .
. . .
. . .
. . . 1,116 1,375 Health Care Equipment & Supplies – 1.0% C.R.
Bard, Inc. . .
. . .
. . .
. . .
. . .
. . .
. . .
. . .
. . .
. . .
. . .
. . .
. . .
. . .
. . .
. . .
. . .
. . .
. . .
. . .
. . .
. . .
. . .
. . .
. DexCom, Inc. (b) . .
. . .
. . .
. . .
. . .
. . .
. . .
. . .
. . .
. . .
. . .
. . .
. . .
. . .
. . .
. . .
. . .
. . .
. . .
. . .
. . .
. . .
. . .
. . 4,521 2,245 1,895 2,737 1,817 Health Care Providers & Services – 3.2% Amsurg Corp. (a) (b) .
. . .
. . .
. . .
. . .
. . .
. . .
. . .
. . .
. . .
. . .
. . .
. . .
. . .
. . .
. . .
. . .
. . .
. . .
. . .
. . .
. . .
. . . Cardinal Health, Inc.
. . .
. . .
. . .
. . .
. . .
. . .
. . .
. . .
. . .
. . .
. . .
. . .
. . .
. . .
. . .
. . .
. . .
. . .
. . .
. . .
. . .
. . .
. Chemed Corp. . .
. . .
. . .
. . .
. . .
. . .
. . .
. . .
. . .
. . .
. . .
. . .
. . .
. . .
. . .
. . .
. . .
. . .
. . .
. . .
. . .
. . .
. . .
. . .
. . LHC Group, Inc. (b) .
. . .
. . .
. . .
. . .
. . .
. . .
. . .
. . .
. . .
. . .
. . .
. . .
. . .
. . .
. . .
. . .
. . .
. . .
. . .
. . .
. . .
. . .
. Molina Healthcare, Inc. (b) . .
. . .
. . .
. . .
. . .
. . .
. . .
. . .
. . .
. . .
. . .
. . .
. . .
. . .
. . .
. . .
. . .
. . .
. . .
. . .
. . . 3,439 3,218 Hotels, Restaurants & Leisure – 1.0% Brinker International, Inc.
. . .
. . .
. . .
. . .
. . .
. . .
. . .
. . .
. . .
. . .
. . .
. . .
. . .
. . .
. . .
. . .
. . .
. . .
. . .
. . .
. . . Las Vegas Sands Corp.
. . .
. . .
. . .
. . .
. . .
. . .
. . .
. . .
. . .
. . .
. . .
. . .
. . .
. . .
. . .
. . .
. . .
. . .
. . .
. . .
. . .
. . . Value ___________________ $ 203,048 131,600 ___________________ 334,648 ___________________ 477,671 142,150 126,898 290,493 ___________________ 1,037,212 ___________________ 531,365 211,094 109,078 125,231 136,762 ___________________ 1,113,530 ___________________ 207,967 114,565 ___________________ 322,532 ___________________ 316,877 184,539 298,064 123,343 112,654 ___________________ 1,035,477 ___________________ 156,509 159,323 ___________________ 315,832 ___________________ 4,315 3,199 101 Household Products – 2.1% Clorox (The) Co.
. . .
. . .
. . .
. . .
. . .
. . .
. . .
. . .
. . .
. . .
. . .
. . .
. . .
. . .
. . .
. . .
. . .
. . .
. . .
. . .
. . .
. . .
. . .
. Internet & Catalog Retail – 1.2% Liberty Media Corp. – Interactive, Class A (a) (b) . .
. . .
. . .
. . .
. . .
. . .
. . .
. . .
. . .
. . .
. . .
. . .
. . .
. . .
. . . Liberty Ventures, Series A (a) (b) .
. . .
. . .
. . .
. . .
. . .
. . .
. . .
. . .
. . .
. . .
. . .
. . .
. . .
. . .
. . .
. . .
. . .
. . .
. . priceline.com, Inc. (a) (b) .
. . .
. . .
. . .
. . .
. . .
. . .
. . .
. . .
. . .
. . .
. . .
. . .
. . .
. . .
. . .
. . .
. . .
. . .
. . .
. . .
. . . 740 755 3,345 20,541 5,044 Internet Software & Services – 6.6% Alphabet, Inc., Class A (b) .
. . .
. . .
. . .
. . .
. . .
. . .
. . .
. . .
. . .
. . .
. . .
. . .
. . .
. . .
. . .
. . .
. . .
. . .
. . .
. . .
. . Alphabet, Inc., Class C (b) . .
. . .
. . .
. . .
. . .
. . .
. . .
. . .
. . .
. . .
. . .
. . .
. . .
. . .
. . .
. . .
. . .
. . .
. . .
. . .
. . .
. Benefitfocus, Inc. (b) . .
. . .
. . .
. . .
. . .
. . .
. . .
. . .
. . .
. . .
. . .
. . .
. . .
. . .
. . .
. . .
. . .
. . .
. . .
. . .
. . .
. . .
. . eBay, Inc. (a) (b) .
. . .
. . .
. . .
. . .
. . .
. . .
. . .
. . .
. . .
. . .
. . .
. . .
. . .
. . .
. . .
. . .
. . .
. . .
. . .
. . .
. . .
. . .
. . .
. VeriSign, Inc. (a) (b) . .
. . .
. . .
. . .
. . .
. . .
. . .
. . .
. . .
. . .
. . .
. . .
. . .
. . .
. . .
. . .
. . .
. . .
. . .
. . .
. . .
. . .
. . . 5,545 See Notes to Financial Statements 676,157 ___________________ 118,102 139,380 146,878 ___________________ 404,360 ___________________ 545,669 536,662 106,906 573,094 406,546 ___________________ 2,168,877 ___________________ Page 9 .
First Trust Long/Short Equity ETF (FTLS) Portfolio of Investments (Continued) October 31, 2015 Shares _______________ Description ___________________________________________________________________________________________________________________________________ COMMON STOCKS (Continued) IT Services – 2.9% 6,224 Accenture PLC, Class A (a) . . . .
. . .
. . .
. . .
. . .
. . .
. . .
. . .
. . .
. . .
. . .
. . .
. . .
. . .
. . .
. . .
. . .
. . .
. . .
. . .
. 1,135 Global Payments, Inc. (a) . .
. . .
. . .
. . .
. . .
. . .
. . .
. . .
. . .
. . .
. . .
. . .
. . .
. . .
. . .
. . .
. . .
. . .
. . .
. . .
. . .
. . 1,762 Visa, Inc., Class A (a) . .
. . .
. . .
. . .
. . .
. . .
. . .
. . .
. . .
. . .
. . .
. . .
. . .
. . .
. . .
. . .
. . .
. . .
. . .
. . .
. . .
. . .
. . 2,940 2,400 1,546 8,465 2,915 9,323 6,966 3,819 1,378 1,824 8,364 14,663 6,544 2,404 6,315 11,416 2,720 Life Sciences Tools & Services – 0.4% INC Research Holdings, Inc. (b) .
. . .
. . .
. . .
. . .
. . .
. . .
. . .
. . .
. . .
. . .
. . .
. . .
. . .
. . .
. . .
. . .
. . .
. . .
. . . Machinery – 0.4% AGCO Corp.
. . .
. . .
. . .
. . .
. . .
. . .
. . .
. . .
. . .
. . .
. . .
. . .
. . .
. . .
. . .
. . .
. . .
. . .
. . .
. . .
. . .
. . .
. . .
. . .
. . Metals & Mining – 0.8% Kaiser Aluminum Corp. .
. . .
. . .
. . .
. . .
. . .
. . .
. . .
. . .
. . .
. . .
. . .
. . .
. . .
. . .
. . .
. . .
. . .
. . .
. . .
. . .
. . .
. Ternium S.A., ADR (a) . . .
. . .
. . .
. . .
. . .
. . .
. . .
. . .
. . .
. . .
. . .
. . .
. . .
. . .
. . .
. . .
. . .
. . .
. . .
. . .
. . .
. . Multiline Retail – 0.7% Target Corp. .
. . .
. . .
. . .
. . .
. . .
. . .
. . .
. . .
. . .
. . .
. . .
. . .
. . .
. . .
. . .
. . .
. . .
. . .
. . .
. . .
. . .
. . .
. . .
. . .
. Oil, Gas & Consumable Fuels – 6.5% Exxon Mobil Corp. (a) . .
. . .
. . .
. . .
. . .
. . .
. . .
. . .
. . .
. . .
. . .
. . .
. . .
. . .
. . .
. . .
. . .
. . .
. . .
. . .
. . .
. . .
. Marathon Petroleum Corp. . .
. . .
. . .
. . .
. . .
. . .
. . .
. . .
. . .
. . .
. . .
. . .
. . .
. . .
. . .
. . .
. . .
. . .
. . .
. . .
. . .
. PBF Energy, Inc. (a) . .
. . .
. . .
. . .
. . .
. . .
. . .
. . .
. . .
. . .
. . .
. . .
. . .
. . .
. . .
. . .
. . .
. . .
. . .
. . .
. . .
. . .
. . . PetroChina Co., Ltd., ADR (a) .
. . .
. . .
. . .
. . .
. . .
. . .
. . .
. . .
. . .
. . .
. . .
. . .
. . .
. . .
. . .
. . .
. . .
. . .
. . .
. Tesoro Corp. . .
. . .
. . .
. . .
. . .
. . .
. . .
. . .
. . .
. . .
. . .
. . .
. . .
. . .
. . .
. . .
. . .
. . .
. . .
. . .
. . .
. . .
. . .
. . .
. . . Valero Energy Corp.
(a) . . .
. . .
. . .
. . .
. . .
. . .
. . .
. . .
. . .
. . .
. . .
. . .
. . .
. . .
. . .
. . .
. . .
. . .
. . .
. . .
. . .
. . Personal Products – 2.0% Unilever NV . .
. . .
. . .
. . .
. . .
. . .
. . .
. . .
. . .
. . .
. . .
. . .
. . .
. . .
. . .
. . .
. . .
. . .
. . .
. . .
. . .
. . .
. . .
. . .
. . . Pharmaceuticals – 7.3% Johnson & Johnson (a) .
. . .
. . .
. . .
. . .
. . .
. . .
. . .
. . .
. . .
. . .
. . .
. . .
. . .
. . .
. . .
. . .
. . .
. . .
. . .
. . .
. . .
. . Merck & Co., Inc. .
. . .
. . .
. . .
. . .
. . .
. . .
. . .
. . .
. . .
. . .
. . .
. . .
. . .
. . .
. . .
. . .
. . .
. . .
. . .
. . .
. . .
. . .
. . Novartis AG, ADR (a) . .
. . .
. . .
. . .
. . .
. . .
. . .
. . .
. . .
. . .
. . .
. . .
. . .
. . .
. . .
. . .
. . .
. . .
. . .
. . .
. . .
. . .
. Novo Nordisk A/S, ADR (a) . . .
. . .
. . .
. . .
. . .
. . .
. . .
. . .
. . .
. . .
. . .
. . .
. . .
. . .
. . .
. . .
. . .
. . .
. . .
. . .
. Taro Pharmaceutical Industries Ltd. (b) . .
. . .
. . .
. . .
. . .
. . .
. . .
. . .
. . .
. . .
. . .
. . .
. . .
. . .
. . .
. . .
. . .
. . 4,876 22,222 8,296 Professional Services – 0.4% Insperity, Inc. (a) .
. . .
. . .
. . .
. . .
. . .
. . .
. . .
. . .
. . .
. . .
. . .
. . .
. . .
. . .
. . .
. . .
. . .
. . .
. . .
. . .
. . .
. . .
. . . Semiconductors & Semiconductor Equipment – 3.4% Advanced Energy Industries, Inc.
(b) . . .
. . .
. . .
. . .
. . .
. . .
. . .
. . .
. . .
. . .
. . .
. . .
. . .
. . .
. . .
. . .
. . .
. . . Intel Corp.
(a) . . .
. . .
. . .
. . .
. . .
. . .
. . .
. . .
. . .
. . .
. . .
. . .
. . .
. . .
. . .
. . .
. . .
. . .
. . .
. . .
. . .
. . .
. . .
. . .
. NVIDIA Corp. (a) . .
. . .
. . .
. . .
. . .
. . .
. . .
. . .
. . .
. . .
. . .
. . .
. . .
. . .
. . .
. . .
. . .
. . .
. . .
. . .
. . .
. . .
. . .
. 18,235 7,624 1,383 1,780 8,476 1,902 Software – 2.8% A10 Networks, Inc. (b) . .
. . .
. . .
. . .
. . .
. . .
. . .
. . .
. . .
. . .
. . .
. . .
. . .
. . .
. . .
. . .
. . .
. . .
. . .
. . .
. . .
. . . Activision Blizzard, Inc.
(a) . . .
. . .
. . .
. . .
. . .
. . .
. . .
. . .
. . .
. . .
. . .
. . .
. . .
. . .
. . .
. . .
. . .
. . .
. . .
. . .
. . ANSYS, Inc. (a) (b) .
. . .
. . .
. . .
. . .
. . .
. . .
. . .
. . .
. . .
. . .
. . .
. . .
. . .
. . .
. . .
. . .
. . .
. . .
. . .
. . .
. . .
. . .
. Electronic Arts, Inc. (a) (b) . .
. . .
. . .
. . .
. . .
. . .
. . .
. . .
. . .
. . .
. . .
. . .
. . .
. . .
. . .
. . .
. . .
. . .
. . .
. . .
. . . King Digital Entertainment PLC .
. . .
. . .
. . .
. . .
. . .
. . .
. . .
. . .
. . .
. . .
. . .
. . .
. . .
. . .
. . .
. . .
. . .
. . .
. . . SS&C Technologies Holdings, Inc.
(a) . . .
. . .
. . .
. . .
. . .
. . .
. . .
. . .
. . .
. . .
. . .
. . .
. . .
. . .
. . .
. . .
. . .
. . 2,675 Page 10 See Notes to Financial Statements Value ___________________ 667,213 154,825 136,696 ___________________ 958,734 ___________________ 122,627 ___________________ 116,136 ___________________ 125,674 121,642 ___________________ 247,316 ___________________ 224,980 ___________________ 771,385 360,839 129,846 108,352 195,040 551,355 ___________________ 2,116,817 ___________________ 659,542 ___________________ 661,140 131,403 571,066 607,103 394,998 ___________________ 2,365,710 ___________________ 124,281 ___________________ 137,893 752,437 235,358 ___________________ 1,125,688 ___________________ 130,927 265,010 131,814 128,285 126,801 141,033 ___________________ 923,870 ___________________ . First Trust Long/Short Equity ETF (FTLS) Portfolio of Investments (Continued) October 31, 2015 Shares/ Units _______________ Description ___________________________________________________________________________________________________________________________________ COMMON STOCKS (Continued) Specialty Retail – 6.7% 865 AutoZone, Inc. (a) (b) . . .
. . .
. . .
. . .
. . .
. . .
. . .
. . .
. . .
. . .
. . .
. . .
. . .
. . .
. . .
. . .
. . .
. . .
. . .
. . .
. . .
. . . 7,483 Barnes & Noble, Inc.
(a) . . .
. . .
. . .
. . .
. . .
. . .
. . .
. . .
. . .
. . .
. . .
. . .
. . .
. . .
. . .
. . .
. . .
. . .
. . .
. . .
. . .
. 4,157 GameStop Corp., Class A (a) . . .
. . .
. . .
. . .
. . .
. . .
. . .
. . .
. . .
. . .
. . .
. . .
. . .
. . .
. . .
. . .
. . .
. . .
. . .
. . .
. 3,602 Home Depot (The), Inc. (a) . .
. . .
. . .
. . .
. . .
. . .
. . .
. . .
. . .
. . .
. . .
. . .
. . .
. . .
. . .
. . .
. . .
. . .
. . .
. . .
. . . 2,036 Outerwall, Inc.
(a) . . .
. . .
. . .
. . .
. . .
. . .
. . .
. . .
. . .
. . .
. . .
. . .
. . .
. . .
. . .
. . .
. . .
. . .
. . .
. . .
. . .
. . .
. . . 11,135 Pep Boys-Manny Moe & Jack/The (b) .
. . .
. . .
. . .
. . .
. . .
. . .
. . .
. . .
. . .
. . .
. . .
. . .
. . .
. . .
. . .
. . .
. . .
. 4,845 Rent-A-Center, Inc. . .
. . .
. . .
. . .
. . .
. . .
. . .
. . .
. . .
. . .
. . .
. . .
. . .
. . .
. . .
. . .
. . .
. . .
. . .
. . .
. . .
. . .
. . . 7,997 Ross Stores, Inc.
. . .
. . .
. . .
. . .
. . .
. . .
. . .
. . .
. . .
. . .
. . .
. . .
. . .
. . .
. . .
. . .
. . .
. . .
. . .
. . .
. . .
. . .
. . .
. . 11,195 1,599 Technology Hardware, Storage & Peripherals – 4.4% Apple, Inc. (a) .
. . .
. . .
. . .
. . .
. . .
. . .
. . .
. . .
. . .
. . .
. . .
. . .
. . .
. . .
. . .
. . .
. . .
. . .
. . .
. . .
. . .
. . .
. . .
. . . Western Digital Corp.
. . .
. . .
. . .
. . .
. . .
. . .
. . .
. . .
. . .
. . .
. . .
. . .
. . .
. . .
. . .
. . .
. . .
. . .
. . .
. . .
. . .
. . .
. Value ___________________ $ 678,515 97,204 191,513 445,351 122,160 167,470 89,100 404,488 ___________________ 2,195,801 ___________________ 1,337,803 106,845 ___________________ 1,444,648 ___________________ 6,501 4,676 Tobacco – 2.5% Altria Group, Inc. (a) . .
. . .
. . .
. . .
. . .
. . .
. . .
. . .
. . .
. . .
. . .
. . .
. . .
. . .
. . .
. . .
. . .
. . .
. . .
. . .
. . .
. . .
. . Philip Morris International, Inc. .
. . .
. . .
. . .
. . .
. . .
. . .
. . .
. . .
. . .
. . .
. . .
. . .
. . .
. . .
. . .
. . .
. . .
. . .
. . . 393,116 413,358 ___________________ 806,474 ___________________ 2,642 17,242 Transportation Infrastructure – 0.7% Grupo Aeroportuario del Pacifico SAB de CV, ADR .
. . .
. . .
. . .
. . .
. . .
. . .
. . .
. . .
. . .
. . .
. . .
. . .
. . .
. . Wireless Telecommunication Services – 1.7% Vodafone Group PLC, ADR (a) . .
. . .
. . .
. . .
. . .
. . .
. . .
. . .
. . .
. . .
. . .
. . .
. . .
. . .
. . .
. . .
. . .
. . .
. . .
. . . Total Common Stocks .
. . .
. . .
. . .
. . .
. . .
. . .
. . .
. . .
. . .
. . .
. . .
. . .
. . .
. . .
. . .
. . .
. . .
. . .
. . .
. . .
. (Cost $28,979,453) REAL ESTATE INVESTMENT TRUSTS – 2.4% Real Estate Investment Trusts – 2.4% 6,619 American Capital Agency Corp. . .
. . .
. . .
. . .
. . .
. . .
. . .
. . .
. . .
. . .
. . .
. . .
. . .
. . .
. . .
. . .
. . .
. . .
. . .
. . 6,781 Host Hotels & Resorts, Inc. (a) .
. . .
. . .
. . .
. . .
. . .
. . .
. . .
. . .
. . .
. . .
. . .
. . .
. . .
. . .
. . .
. . .
. . .
. . .
. . .
. 7,203 Paramount Group, Inc. (a) . .
. . .
. . .
. . .
. . .
. . .
. . .
. . .
. . .
. . .
. . .
. . .
. . .
. . .
. . .
. . .
. . .
. . .
. . .
. . .
. . .
. 617 Public Storage (a) . . .
. . .
. . .
. . .
. . .
. . .
. . .
. . .
. . .
. . .
. . .
. . .
. . .
. . .
. . .
. . .
. . .
. . .
. . .
. . .
. . .
. . .
. . .
. 683 Simon Property Group, Inc. (a) . .
. . .
. . .
. . .
. . .
. . .
. . .
. . .
. . .
. . .
. . .
. . .
. . .
. . .
. . .
. . .
. . .
. . .
. . .
. . . 1,923 Welltower, Inc.
(a) . . .
. . .
. . .
. . .
. . .
. . .
. . .
. . .
. . .
. . .
. . .
. . .
. . .
. . .
. . .
. . .
. . .
. . .
. . .
. . .
. . .
. . .
. . . Total Real Estate Investment Trusts .
. . .
. . .
. . .
. . .
. . .
. . .
. . .
. . .
. . .
. . .
. . .
. . .
. . .
. . .
. . .
. . .
. (Cost $769,015) MASTER LIMITED PARTNERSHIPS – 5.1% Chemicals – 1.1% 3,325 Terra Nitrogen Co, L.P. (a) . .
. . .
. . .
. . .
. . .
. . .
. . .
. . .
. . .
. . .
. . .
. . .
. . .
. . .
. . .
. . .
. . .
. . .
. . .
. . .
. . . Gas Utilities – 0.4% 2,862 AmeriGas Partners, L.P.
. . .
. . .
. . .
. . .
. . .
. . .
. . .
. . .
. . .
. . .
. . .
. . .
. . .
. . .
. . .
. . .
. . .
. . .
. . .
. . .
. . .
. . Oil, Gas & Consumable Fuels – 3.6% 3,665 Alliance Holdings GP, L.P. (a) .
. . .
. . .
. . .
. . .
. . .
. . .
. . .
. . .
. . .
. . .
. . .
. . .
. . .
. . .
. . .
. . .
. . .
. . .
. . .
. . 13,578 Alon USA Partners L.P. (a) .
. . .
. . .
. . .
. . .
. . .
. . .
. . .
. . .
. . .
. . .
. . .
. . .
. . .
. . .
. . .
. . .
. . .
. . .
. . .
. . .
. 1,880 Buckeye Partners, L.P. (a) . .
. . .
. . .
. . .
. . .
. . .
. . .
. . .
. . .
. . .
. . .
. . .
. . .
. . .
. . .
. . .
. . .
. . .
. . .
. . .
. . .
. 1,886 Magellan Midstream Partners, L.P. (a) . .
. . .
. . .
. . .
. . .
. . .
. . .
. . .
. . .
. . .
. . .
. . .
. . .
. . .
. . .
. . .
. . .
. . . 14,465 Northern Tier Energy L.P.
(a) . . .
. . .
. . .
. . .
. . .
. . .
. . .
. . .
. . .
. . .
. . .
. . .
. . .
. . .
. . .
. . .
. . .
. . .
. . .
. . . See Notes to Financial Statements 240,607 ___________________ 568,469 ___________________ 29,484,874 ___________________ 118,017 117,515 127,997 141,577 137,597 124,745 ___________________ 767,448 ___________________ 351,718 ___________________ 122,036 ___________________ 107,238 334,154 127,520 120,346 388,241 Page 11 .
First Trust Long/Short Equity ETF (FTLS) Portfolio of Investments (Continued) October 31, 2015 Shares _______________ Description ___________________________________________________________________________________________________________________________________ MASTER LIMITED PARTNERSHIPS (Continued) Oil, Gas & Consumable Fuels (Continued) 2,303 TC Pipelines, L.P. (a) . . .
. . .
. . .
. . .
. . .
. . .
. . .
. . .
. . .
. . .
. . .
. . .
. . .
. . .
. . .
. . .
. . .
. . .
. . .
. . .
. . .
. . .
. Total Master Limited Partnerships . . .
. . .
. . .
. . .
. . .
. . .
. . .
. . .
. . .
. . .
. . .
. . .
. . .
. . .
. . .
. . .
. . . (Cost $1,712,575) Total Long-Term Investments – 97.9% .
. . .
. . .
. . .
. . .
. . .
. . .
. . .
. . .
. . .
. . .
. . .
. . .
. . .
. . .
. . .
. . (Cost $31,461,043) (c) COMMON STOCKS SOLD SHORT – (17.7%) Aerospace & Defense – (0.2%) (988) AAR Corp. .
. . .
. . .
. . .
. . .
. . .
. . .
. . .
. . .
. . .
. . .
. . .
. . .
. . .
. . .
. . .
. . .
. . .
. . .
. . .
. . .
. . .
. . .
. . .
. . .
. . (1,289) Textron, Inc. .
. . .
. . .
. . .
. . .
. . .
. . .
. . .
. . .
. . .
. . .
. . .
. . .
. . .
. . .
. . .
. . .
. . .
. . .
. . .
. . .
. . .
. . .
. . .
. . .
. Value ___________________ $ 118,973 ___________________ 1,196,472 ___________________ 1,670,226 ___________________ 31,922,548 ___________________ (22,418) (54,357) ___________________ (76,775) ___________________ (15,804) (1,262) (2,804) (2,318) (1,507) (4,902) (9,864) Air Freight & Logistics – (0.3%) UTi Worldwide, Inc. (b) . .
. . .
. . .
. . .
. . .
. . .
. . .
. . .
. . .
. . .
. . .
. . .
. . .
. . .
. . .
. . .
. . .
. . .
. . .
. . .
. . .
. . . Auto Components – (0.2%) Johnson Controls, Inc.
. . .
. . .
. . .
. . .
. . .
. . .
. . .
. . .
. . .
. . .
. . .
. . .
. . .
. . .
. . .
. . .
. . .
. . .
. . .
. . .
. . .
. . . Automobiles – (0.3%) General Motors Co.
. . .
. . .
. . .
. . .
. . .
. . .
. . .
. . .
. . .
. . .
. . .
. . .
. . .
. . .
. . .
. . .
. . .
. . .
. . .
. . .
. . .
. . .
. . Banks – (1.0%) Community Bank System, Inc. .
. . .
. . .
. . .
. . .
. . .
. . .
. . .
. . .
. . .
. . .
. . .
. . .
. . .
. . .
. . .
. . .
. . .
. . .
. . .
. CVB Financial Corp. . .
. . .
. . .
. . .
. . .
. . .
. . .
. . .
. . .
. . .
. . .
. . .
. . .
. . .
. . .
. . .
. . .
. . .
. . .
. . .
. . .
. . .
. . Fifth Third Bancorp . .
. . .
. . .
. . .
. . .
. . .
. . .
. . .
. . .
. . .
. . .
. . .
. . .
. . .
. . .
. . .
. . .
. . .
. . .
. . .
. . .
. . .
. . . Valley National Bancorp .
. . .
. . .
. . .
. . .
. . .
. . .
. . .
. . .
. . .
. . .
. . .
. . .
. . .
. . .
. . .
. . .
. . .
. . .
. . .
. . .
. . . Beverages – (0.9%) (3,188) Coca-Cola (The) Co.
. . .
. . .
. . .
. . .
. . .
. . .
. . .
. . .
. . .
. . .
. . .
. . .
. . .
. . .
. . .
. . .
. . .
. . .
. . .
. . .
. . .
. . .
. (2,478) Coca-Cola Enterprises, Inc. . .
. . .
. . .
. . .
. . .
. . .
. . .
. . .
. . .
. . .
. . .
. . .
. . .
. . .
. . .
. . .
. . .
. . .
. . .
. . .
. . . (274) Constellation Brands, Inc.
. . .
. . .
. . .
. . .
. . .
. . .
. . .
. . .
. . .
. . .
. . .
. . .
. . .
. . .
. . .
. . .
. . .
. . .
. . .
. . .
. . . (792) (684) (7,499) (383) (239) (1,577) (506) (5,027) (826) (838) (892) (3,174) Biotechnology – (1.1%) AbbVie, Inc.
. . .
. . .
. . .
. . .
. . .
. . .
. . .
. . .
. . .
. . .
. . .
. . .
. . .
. . .
. . .
. . .
. . .
. . .
. . .
. . .
. . .
. . .
. . .
. . .
. . ACADIA Pharmaceuticals, Inc. (b) .
. . .
. . .
. . .
. . .
. . .
. . .
. . .
. . .
. . .
. . .
. . .
. . .
. . .
. . .
. . .
. . .
. . .
. . .
. Agenus, Inc. (b) . .
. . .
. . .
. . .
. . .
. . .
. . .
. . .
. . .
. . .
. . .
. . .
. . .
. . .
. . .
. . .
. . .
. . .
. . .
. . .
. . .
. . .
. . .
. . . Alkermes PLC (b) .
. . .
. . .
. . .
. . .
. . .
. . .
. . .
. . .
. . .
. . .
. . .
. . .
. . .
. . .
. . .
. . .
. . .
. . .
. . .
. . .
. . .
. . .
. . Alnylam Pharmaceuticals, Inc. (b) .
. . .
. . .
. . .
. . .
. . .
. . .
. . .
. . .
. . .
. . .
. . .
. . .
. . .
. . .
. . .
. . .
. . .
. . .
. Celldex Therapeutics, Inc. (b) . .
. . .
. . .
. . .
. . .
. . .
. . .
. . .
. . .
. . .
. . .
. . .
. . .
. . .
. . .
. . .
. . .
. . .
. . .
. . .
. Chimerix, Inc. (b) . .
. . .
. . .
. . .
. . .
. . .
. . .
. . .
. . .
. . .
. . .
. . .
. . .
. . .
. . .
. . .
. . .
. . .
. . .
. . .
. . .
. . .
. . .
. . Ironwood Pharmaceuticals, Inc. (b) .
. . .
. . .
. . .
. . .
. . .
. . .
. . .
. . .
. . .
. . .
. . .
. . .
. . .
. . .
. . .
. . .
. . .
. . .
. Ophthotech Corp. (b) . .
. . .
. . .
. . .
. . .
. . .
. . .
. . .
. . .
. . .
. . .
. . .
. . .
. . .
. . .
. . .
. . .
. . .
. . .
. . .
. . .
. . .
. . Portola Pharmaceuticals, Inc. (b) .
. . .
. . .
. . .
. . .
. . .
. . .
. . .
. . .
. . .
. . .
. . .
. . .
. . .
. . .
. . .
. . .
. . .
. . .
. . . PTC Therapeutics, Inc.
(b) . . .
. . .
. . .
. . .
. . .
. . .
. . .
. . .
. . .
. . .
. . .
. . .
. . .
. . .
. . .
. . .
. . .
. . .
. . .
. . .
. . . Sangamo BioSciences, Inc.
(b) . . .
. . .
. . .
. . .
. . .
. . .
. . .
. . .
. . .
. . .
. . .
. . .
. . .
. . .
. . .
. . .
. . .
. . .
. . .
. . (897) (1,128) (1,157) (323) Chemicals – (1.3%) Air Products & Chemicals, Inc. .
. . .
. . .
. . .
. . .
. . .
. . .
. . .
. . .
. . .
. . .
. . .
. . .
. . .
. . .
. . .
. . .
. . .
. . .
. . .
. Ecolab, Inc. . .
. . .
. . .
. . .
. . .
. . .
. . .
. . .
. . .
. . .
. . .
. . .
. . .
. . .
. . .
. . .
. . .
. . .
. . .
. . .
. . .
. . .
. . .
. . .
. . .
. Praxair, Inc. . .
. . .
. . .
. . .
. . .
. . .
. . .
. . .
. . .
. . .
. . .
. . .
. . .
. . .
. . .
. . .
. . .
. . .
. . .
. . .
. . .
. . .
. . .
. . .
. . .
. Valspar Corp./The . . .
. . .
. . .
. . .
. . .
. . .
. . .
. . .
. . .
. . .
. . .
. . .
. . .
. . .
. . .
. . .
. . .
. . .
. . .
. . .
. . .
. . .
. . .
. Page 12 See Notes to Financial Statements (112,683) ___________________ (57,017) ___________________ (97,888) ___________________ (94,482) (26,297) (93,383) (103,572) ___________________ (317,734) ___________________ (135,012) (127,221) (36,935) ___________________ (299,168) ___________________ (47,164) (23,817) (34,195) (27,545) (20,542) (19,019) (19,825) (57,107) (41,242) (39,897) (22,184) (22,377) ___________________ (374,914) ___________________ (124,665) (135,755) (128,531) (26,147) ___________________ (415,098) ___________________ . First Trust Long/Short Equity ETF (FTLS) Portfolio of Investments (Continued) October 31, 2015 Shares _______________ Description ___________________________________________________________________________________________________________________________________ COMMON STOCKS SOLD SHORT (Continued) Commercial Services & Supplies – (0.5%) (1,028) Matthews International Corp. . . .
. . .
. . .
. . .
. . .
. . .
. . .
. . .
. . .
. . .
. . .
. . .
. . .
. . .
. . .
. . .
. . .
. . .
. . .
. . . (899) Stericycle, Inc.
(b) . . .
. . .
. . .
. . .
. . .
. . .
. . .
. . .
. . .
. . .
. . .
. . .
. . .
. . .
. . .
. . .
. . .
. . .
. . .
. . .
. . .
. . .
. . . Construction & Engineering – (0.5%) (784) Granite Construction, Inc.
. . .
. . .
. . .
. . .
. . .
. . .
. . .
. . .
. . .
. . .
. . .
. . .
. . .
. . .
. . .
. . .
. . .
. . .
. . .
. . .
. . . (7,063) KBR, Inc.
. . .
. . .
. . .
. . .
. . .
. . .
. . .
. . .
. . .
. . .
. . .
. . .
. . .
. . .
. . .
. . .
. . .
. . .
. . .
. . .
. . .
. . .
. . .
. . .
. . .
. Value ___________________ $ (59,346) (109,112) ___________________ (168,458) ___________________ (25,746) (130,242) ___________________ (155,988) ___________________ Consumer Finance – (0.2%) (2,988) Ally Financial, Inc. (b) . .
. . .
. . .
. . .
. . .
. . .
. . .
. . .
. . .
. . .
. . .
. . .
. . .
. . .
. . .
. . .
. . .
. . .
. . .
. . .
. . .
. . .
. Containers & Packaging – (0.2%) (772) AptarGroup, Inc. . .
. . .
. . .
. . .
. . .
. . .
. . .
. . .
. . .
. . .
. . .
. . .
. . .
. . .
. . .
. . .
. . .
. . .
. . .
. . .
. . .
. . .
. . .
. . Diversified Consumer Services – (0.2%) (1,097) Houghton Mifflin Harcourt Co. (b) .
. . .
. . .
. . .
. . .
. . .
. . .
. . .
. . .
. . .
. . .
. . .
. . .
. . .
. . .
. . .
. . .
. . .
. . .
. (458) Steiner Leisure Ltd. (b) . .
. . .
. . .
. . .
. . .
. . .
. . .
. . .
. . .
. . .
. . .
. . .
. . .
. . .
. . .
. . .
. . .
. . .
. . .
. . .
. . .
. . . Electronic Equipment, Instruments & Components – (0.4%) (1,978) AVX Corp.
. . .
. . .
. . .
. . .
. . .
. . .
. . .
. . .
. . .
. . .
. . .
. . .
. . .
. . .
. . .
. . .
. . .
. . .
. . .
. . .
. . .
. . .
. . .
. . .
. . . (3,733) Corning, Inc.
. . .
. . .
. . .
. . .
. . .
. . .
. . .
. . .
. . .
. . .
. . .
. . .
. . .
. . .
. . .
. . .
. . .
. . .
. . .
. . .
. . .
. . .
. . .
. . .
. . (786) Itron, Inc. (b) .
. . .
. . .
. . .
. . .
. . .
. . .
. . .
. . .
. . .
. . .
. . .
. . .
. . .
. . .
. . .
. . .
. . .
. . .
. . .
. . .
. . .
. . .
. . .
. . . Energy Equipment & Services – (0.1%) (412) SEACOR Holdings, Inc.
(b) . . .
. . .
. . .
. . .
. . .
. . .
. . .
. . .
. . .
. . .
. . .
. . .
. . .
. . .
. . .
. . .
. . .
. . .
. . .
. . .
. Food Products – (1.3%) (3,222) Darling Ingredients, Inc. (b) . .
. . .
. . .
. . .
. . .
. . .
. . .
. . .
. . .
. . .
. . .
. . .
. . .
. . .
. . .
. . .
. . .
. . .
. . .
. . .
. . . (1,898) Kellogg Co.
. . .
. . .
. . .
. . .
. . .
. . .
. . .
. . .
. . .
. . .
. . .
. . .
. . .
. . .
. . .
. . .
. . .
. . .
. . .
. . .
. . .
. . .
. . .
. . .
. . (2,826) Mondelez International, Inc., Class A . .
. . .
. . .
. . .
. . .
. . .
. . .
. . .
. . .
. . .
. . .
. . .
. . .
. . .
. . .
. . .
. . .
. . .
. (3,877) Snyder’s-Lance, Inc. . .
. . .
. . .
. . .
. . .
. . .
. . .
. . .
. . .
. . .
. . .
. . .
. . .
. . .
. . .
. . .
. . .
. . .
. . .
. . .
. . .
. . .
. . (1,038) (1,274) (1,169) (1,267) (1,622) (372) (3,083) Health Care Equipment & Supplies – (0.7%) Alere, Inc. (b) .
. . .
. . .
. . .
. . .
. . .
. . .
. . .
. . .
. . .
. . .
. . .
. . .
. . .
. . .
. . .
. . .
. . .
. . .
. . .
. . .
. . .
. . .
. . .
. . . Cardiovascular Systems, Inc.
(b) . . .
. . .
. . .
. . .
. . .
. . .
. . .
. . .
. . .
. . .
. . .
. . .
. . .
. . .
. . .
. . .
. . .
. . .
. . .
. CONMED Corp. . .
. . .
. . .
. . .
. . .
. . .
. . .
. . .
. . .
. . .
. . .
. . .
. . .
. . .
. . .
. . .
. . .
. . .
. . .
. . .
. . .
. . .
. . .
. . K2M Group Holdings, Inc. (b) .
. . .
. . .
. . .
. . .
. . .
. . .
. . .
. . .
. . .
. . .
. . .
. . .
. . .
. . .
. . .
. . .
. . .
. . .
. . .
. Spectranetics Corp./The (b) . . .
. . .
. . .
. . .
. . .
. . .
. . .
. . .
. . .
. . .
. . .
. . .
. . .
. . .
. . .
. . .
. . .
. . .
. . .
. . .
. . St. Jude Medical, Inc.
. . .
. . .
. . .
. . .
. . .
. . .
. . .
. . .
. . .
. . .
. . .
. . .
. . .
. . .
. . .
. . .
. . .
. . .
. . .
. . .
. . .
. . .
. Wright Medical Group NV (b) . . .
. . .
. . .
. . .
. . .
. . .
. . .
. . .
. . .
. . .
. . .
. . .
. . .
. . .
. . .
. . .
. . .
. . .
. . .
. . (642) (663) (489) (1,913) Health Care Providers & Services – (0.3%) Acadia Healthcare Co., Inc. (b) .
. . .
. . .
. . .
. . .
. . .
. . .
. . .
. . .
. . .
. . .
. . .
. . .
. . .
. . .
. . .
. . .
. . .
. . .
. . .
. Air Methods Corp. (b) . .
. . .
. . .
. . .
. . .
. . .
. . .
. . .
. . .
. . .
. . .
. . .
. . .
. . .
. . .
. . .
. . .
. . .
. . .
. . .
. . .
. . .
. Community Health Systems, Inc. (b) . .
. . .
. . .
. . .
. . .
. . .
. . .
. . .
. . .
. . .
. . .
. . .
. . .
. . .
. . .
. . .
. . .
. . .
. Select Medical Holdings Corp. . .
. . .
. . .
. . .
. . .
. . .
. . .
. . .
. . .
. . .
. . .
. . .
. . .
. . .
. . .
. . .
. . .
. . .
. . .
. . . Hotels, Restaurants & Leisure – (0.2%) (327) DineEquity, Inc.
. . .
. . .
. . .
. . .
. . .
. . .
. . .
. . .
. . .
. . .
. . .
. . .
. . .
. . .
. . .
. . .
. . .
. . .
. . .
. . .
. . .
. . .
. . .
. . (2,604) Wendy’s Co./The . .
. . .
. . .
. . .
. . .
. . .
. . .
. . .
. . .
. . .
. . .
. . .
. . .
. . .
. . .
. . .
. . .
. . .
. . .
. . .
. . .
. . .
. . .
. . See Notes to Financial Statements (59,521) ___________________ (56,788) ___________________ (21,490) (29,019) ___________________ (50,509) ___________________ (26,703) (69,434) (28,870) ___________________ (125,007) ___________________ (24,069) ___________________ (32,607) (133,847) (130,448) (137,788) ___________________ (434,690) ___________________ (47,872) (17,454) (47,415) (23,123) (19,821) (23,737) (59,594) ___________________ (239,016) ___________________ (39,425) (27,137) (13,711) (21,617) ___________________ (101,890) ___________________ (27,288) (23,853) ___________________ (51,141) ___________________ Page 13 . First Trust Long/Short Equity ETF (FTLS) Portfolio of Investments (Continued) October 31, 2015 Shares _______________ Description ___________________________________________________________________________________________________________________________________ COMMON STOCKS SOLD SHORT (Continued) Household Durables – (0.1%) (764) Newell Rubbermaid, Inc. . . .
. . .
. . .
. . .
. . .
. . .
. . .
. . .
. . .
. . .
. . .
. . .
. . .
. . .
. . .
. . .
. . .
. . .
. . .
. . .
. . .
. Internet Software & Services – (0.4%) (742) Cornerstone OnDemand, Inc. (b) . .
. . .
. . .
. . .
. . .
. . .
. . .
. . .
. . .
. . .
. . .
. . .
. . .
. . .
. . .
. . .
. . .
. . .
. . .
. (696) Demandware, Inc. (b) . .
. . .
. . .
. . .
. . .
. . .
. . .
. . .
. . .
. . .
. . .
. . .
. . .
. . .
. . .
. . .
. . .
. . .
. . .
. . .
. . .
. . .
. . (3,423) Monster Worldwide, Inc. (b) .
. . .
. . .
. . .
. . .
. . .
. . .
. . .
. . .
. . .
. . .
. . .
. . .
. . .
. . .
. . .
. . .
. . .
. . .
. . .
. . . (1,692) Yahoo!, Inc.
(b) . . .
. . .
. . .
. . .
. . .
. . .
. . .
. . .
. . .
. . .
. . .
. . .
. . .
. . .
. . .
. . .
. . .
. . .
. . .
. . .
. . .
. . .
. . .
. . . (159) (614) (3,467) (814) (2,389) IT Services – (0.8%) Alliance Data Systems Corp.
(b) . . .
. . .
. . .
. . .
. . .
. . .
. . .
. . .
. . .
. . .
. . .
. . .
. . .
. . .
. . .
. . .
. . .
. . .
. . .
. Computer Sciences Corp. . .
. . .
. . .
. . .
. . .
. . .
. . .
. . .
. . .
. . .
. . .
. . .
. . .
. . .
. . .
. . .
. . .
. . .
. . .
. . .
. . .
. . PayPal Holdings, Inc. (b) .
. . .
. . .
. . .
. . .
. . .
. . .
. . .
. . .
. . .
. . .
. . .
. . .
. . .
. . .
. . .
. . .
. . .
. . .
. . .
. . .
. . . VeriFone Systems, Inc.
(b) . . .
. . .
. . .
. . .
. . .
. . .
. . .
. . .
. . .
. . .
. . .
. . .
. . .
. . .
. . .
. . .
. . .
. . .
. . .
. . .
. . . Xerox Corp.
. . .
. . .
. . .
. . .
. . .
. . .
. . .
. . .
. . .
. . .
. . .
. . .
. . .
. . .
. . .
. . .
. . .
. . .
. . .
. . .
. . .
. . .
. . .
. . .
. . Life Sciences Tools & Services – (0.1%) (1,297) Bruker Corp. (b) .
. . .
. . .
. . .
. . .
. . .
. . .
. . .
. . .
. . .
. . .
. . .
. . .
. . .
. . .
. . .
. . .
. . .
. . .
. . .
. . .
. . .
. . .
. . .
. Machinery – (0.1%) (822) Mueller Industries, Inc. . .
. . .
. . .
. . .
. . .
. . .
. . .
. . .
. . .
. . .
. . .
. . .
. . .
. . .
. . .
. . .
. . .
. . .
. . .
. . .
. . .
. . . (2,823) Titan International, Inc.
. . .
. . .
. . .
. . .
. . .
. . .
. . .
. . .
. . .
. . .
. . .
. . .
. . .
. . .
. . .
. . .
. . .
. . .
. . .
. . .
. . .
. . Media – (0.8%) (3,266) Global Eagle Entertainment, Inc. (b) .
. . .
. . .
. . .
. . .
. . .
. . .
. . .
. . .
. . .
. . .
. . .
. . .
. . .
. . .
. . .
. . .
. . .
. . . (1,023) Omnicom Group, Inc.
. . .
. . .
. . .
. . .
. . .
. . .
. . .
. . .
. . .
. . .
. . .
. . .
. . .
. . .
. . .
. . .
. . .
. . .
. . .
. . .
. . .
. . . (1,209) Walt Disney (The) Co.
. . .
. . .
. . .
. . .
. . .
. . .
. . .
. . .
. . .
. . .
. . .
. . .
. . .
. . .
. . .
. . .
. . .
. . .
. . .
. . .
. . .
. . . Multiline Retail – (0.2%) (1,004) Macy’s, Inc.
. . .
. . .
. . .
. . .
. . .
. . .
. . .
. . .
. . .
. . .
. . .
. . .
. . .
. . .
. . .
. . .
. . .
. . .
. . .
. . .
. . .
. . .
. . .
. . .
. . Oil, Gas & Consumable Fuels – (1.8%) (2,614) ConocoPhillips . .
. . .
. . .
. . .
. . .
. . .
. . .
. . .
. . .
. . .
. . .
. . .
. . .
. . .
. . .
. . .
. . .
. . .
. . .
. . .
. . .
. . .
. . .
. . .
. (796) Diamondback Energy, Inc. (b) . .
. . .
. . .
. . .
. . .
. . .
. . .
. . .
. . .
. . .
. . .
. . .
. . .
. . .
. . .
. . .
. . .
. . .
. . .
. . .
. (438) Hess Corp. . .
. . .
. . .
. . .
. . .
. . .
. . .
. . .
. . .
. . .
. . .
. . .
. . .
. . .
. . .
. . .
. . .
. . .
. . .
. . .
. . .
. . .
. . .
. . .
. . .
. (2,592) Matador Resources Co. (b) . .
. . .
. . .
. . .
. . .
. . .
. . .
. . .
. . .
. . .
. . .
. . .
. . .
. . .
. . .
. . .
. . .
. . .
. . .
. . .
. . . (1,363) Memorial Resource Development Corp.
(b) . . .
. . .
. . .
. . .
. . .
. . .
. . .
. . .
. . .
. . .
. . .
. . .
. . .
. . .
. . .
. . .
. (1,293) Newfield Exploration Co. (b) . .
. . .
. . .
. . .
. . .
. . .
. . .
. . .
. . .
. . .
. . .
. . .
. . .
. . .
. . .
. . .
. . .
. . .
. . .
. . .
. (1,792) Occidental Petroleum Corp. . .
. . .
. . .
. . .
. . .
. . .
. . .
. . .
. . .
. . .
. . .
. . .
. . .
. . .
. . .
. . .
. . .
. . .
. . .
. . .
. . . (3,973) QEP Resources, Inc.
. . .
. . .
. . .
. . .
. . .
. . .
. . .
. . .
. . .
. . .
. . .
. . .
. . .
. . .
. . .
. . .
. . .
. . .
. . .
. . .
. . .
. . .
. . (472) SemGroup Corp., Class A . .
. . .
. . .
. . .
. . .
. . .
. . .
. . .
. . .
. . .
. . .
. . .
. . .
. . .
. . .
. . .
. . .
. . .
. . .
. . .
. . .
. (1,479) Southwestern Energy Co. (b) . .
. . .
. . .
. . .
. . .
. . .
. . .
. . .
. . .
. . .
. . .
. . .
. . .
. . .
. . .
. . .
. . .
. . .
. . .
. . .
. . Paper & Forest Products – (0.2%) (1,428) International Paper Co. .
. . .
. . .
. . .
. . .
. . .
. . .
. . .
. . .
. . .
. . .
. . .
. . .
. . .
. . .
. . .
. . .
. . .
. . .
. . .
. . .
. . .
. Pharmaceuticals – (0.4%) (1,576) Eli Lilly & Co. . .
. . .
. . .
. . .
. . .
. . .
. . .
. . .
. . .
. . .
. . .
. . .
. . .
. . .
. . .
. . .
. . .
. . .
. . .
. . .
. . .
. . .
. . .
. . .
. (617) Tetraphase Pharmaceuticals, Inc. (b) . .
. . .
. . .
. . .
. . .
. . .
. . .
. . .
. . .
. . .
. . .
. . .
. . .
. . .
. . .
. . .
. . .
. . .
. . Value ___________________ $ (32,417) ___________________ (23,373) (39,463) (21,462) (60,269) ___________________ (144,567) ___________________ (47,272) (40,886) (124,847) (24,534) (22,433) ___________________ (259,972) ___________________ (23,826) ___________________ (25,910) (20,043) ___________________ (45,953) ___________________ (43,503) (76,643) (137,512) ___________________ (257,658) ___________________ (51,184) ___________________ (139,457) (58,777) (24,620) (66,640) (24,111) (51,966) (133,576) (61,422) (21,500) (16,328) ___________________ (598,397) ___________________ (60,961) ___________________ (128,554) (5,572) ___________________ (134,126) ___________________ Page 14 See Notes to Financial Statements . First Trust Long/Short Equity ETF (FTLS) Portfolio of Investments (Continued) October 31, 2015 Shares _______________ Description ___________________________________________________________________________________________________________________________________ COMMON STOCKS SOLD SHORT (Continued) Professional Services – (0.6%) (279) ManpowerGroup, Inc. . . .
. . .
. . .
. . .
. . .
. . .
. . .
. . .
. . .
. . .
. . .
. . .
. . .
. . .
. . .
. . .
. . .
. . .
. . .
. . .
. . .
. . . (2,709) Nielsen Holdings PLC .
. . .
. . .
. . .
. . .
. . .
. . .
. . .
. . .
. . .
. . .
. . .
. . .
. . .
. . .
. . .
. . .
. . .
. . .
. . .
. . .
. . .
. . (438) Verisk Analytics, Inc. (b) .
. . .
. . .
. . .
. . .
. . .
. . .
. . .
. . .
. . .
. . .
. . .
. . .
. . .
. . .
. . .
. . .
. . .
. . .
. . .
. . .
. . . Real Estate Management & Development – (0.1%) (207) Howard Hughes Corp./The (b) .
. . .
. . .
. . .
. . .
. . .
. . .
. . .
. . .
. . .
. . .
. . .
. . .
. . .
. . .
. . .
. . .
. . .
. . .
. . .
. Road & Rail – (0.1%) (323) JB Hunt Transport Services, Inc. . .
. . .
. . .
. . .
. . .
. . .
. . .
. . .
. . .
. . .
. . .
. . .
. . .
. . .
. . .
. . .
. . .
. . .
. . .
. . (1,513) Roadrunner Transportation Systems, Inc. (b) .
. . .
. . .
. . .
. . .
. . .
. . .
. . .
. . .
. . .
. . .
. . .
. . .
. . .
. . .
. . .
. . Semiconductors & Semiconductor Equipment – (0.1%) (2,499) Cypress Semiconductor Corp. (b) .
. . .
. . .
. . .
. . .
. . .
. . .
. . .
. . .
. . .
. . .
. . .
. . .
. . .
. . .
. . .
. . .
. . .
. . .
. . Software – (0.1%) (632) Interactive Intelligence Group, Inc. (b) .
. . .
. . .
. . .
. . .
. . .
. . .
. . .
. . .
. . .
. . .
. . .
. . .
. . .
. . .
. . .
. . .
. . .
. (1,122) Varonis Systems, Inc. (b) . .
. . .
. . .
. . .
. . .
. . .
. . .
. . .
. . .
. . .
. . .
. . .
. . .
. . .
. . .
. . .
. . .
. . .
. . .
. . .
. . .
. . (703) (938) (409) (674) Specialty Retail – (0.4%) Aaron’s, Inc. .
. . .
. . .
. . .
. . .
. . .
. . .
. . .
. . .
. . .
. . .
. . .
. . .
. . .
. . .
. . .
. . .
. . .
. . .
. . .
. . .
. . .
. . .
. . .
. . .
. Best Buy Co., Inc. . .
. . .
. . .
. . .
. . .
. . .
. . .
. . .
. . .
. . .
. . .
. . .
. . .
. . .
. . .
. . .
. . .
. . .
. . .
. . .
. . .
. . .
. . .
. Genesco, Inc. (b) . .
. . .
. . .
. . .
. . .
. . .
. . .
. . .
. . .
. . .
. . .
. . .
. . .
. . .
. . .
. . .
. . .
. . .
. . .
. . .
. . .
. . .
. . .
. . Tiffany & Co. .
. . .
. . .
. . .
. . .
. . .
. . .
. . .
. . .
. . .
. . .
. . .
. . .
. . .
. . .
. . .
. . .
. . .
. . .
. . .
. . .
. . .
. . .
. . .
. . . Technology Hardware, Storage & Peripherals – (0.2%) (3,013) Hewlett-Packard Co.
(b) . . .
. . .
. . .
. . .
. . .
. . .
. . .
. . .
. . .
. . .
. . .
. . .
. . .
. . .
. . .
. . .
. . .
. . .
. . .
. . .
. . .
. Textiles, Apparel & Luxury Goods – (0.1%) (574) Columbia Sportswear Co. . .
. . .
. . .
. . .
. . .
. . .
. . .
. . .
. . .
. . .
. . .
. . .
. . .
. . .
. . .
. . .
. . .
. . .
. . .
. . .
. . .
. Thrifts & Mortgage Finance – (0.3%) (6,162) TFS Financial Corp. . .
. . .
. . .
. . .
. . .
. . .
. . .
. . .
. . .
. . .
. . .
. . .
. . .
. . .
. . .
. . .
. . .
. . .
. . .
. . .
. . .
. . .
. . . Tobacco – (0.5%) (3,054) Reynolds American, Inc.
. . .
. . .
. . .
. . .
. . .
. . .
. . .
. . .
. . .
. . .
. . .
. . .
. . .
. . .
. . .
. . .
. . .
. . .
. . .
. . .
. . .
. Wireless Telecommunication Services – (0.4%) (4,424) Telephone & Data Systems, Inc. . .
. . .
. . .
. . .
. . .
. . .
. . .
. . .
. . .
. . .
. . .
. . .
. . .
. . .
. . .
. . .
. . .
. . .
. . .
. . Total Common Stocks Sold Short . .
. . .
. . .
. . .
. . .
. . .
. . .
. . .
. . .
. . .
. . .
. . .
. . .
. . .
. . .
. . .
. . .
. . . (Proceeds $(5,942,616)) REAL ESTATE INVESTMENT TRUSTS SOLD SHORT – (1.3%) Real Estate Investment Trusts – (1.3%) (737) AvalonBay Communities, Inc.
. . .
. . .
. . .
. . .
. . .
. . .
. . .
. . .
. . .
. . .
. . .
. . .
. . .
. . .
. . .
. . .
. . .
. . .
. . .
. . . (94) Equinix, Inc.
. . .
. . .
. . .
. . .
. . .
. . .
. . .
. . .
. . .
. . .
. . .
. . .
. . .
. . .
. . .
. . .
. . .
. . .
. . .
. . .
. . .
. . .
. . .
. . .
. . (3,109) General Growth Properties, Inc. .
. . .
. . .
. . .
. . .
. . .
. . .
. . .
. . .
. . .
. . .
. . .
. . .
. . .
. . .
. . .
. . .
. . .
. . .
. . . (1,739) Redwood Trust, Inc.
. . .
. . .
. . .
. . .
. . .
. . .
. . .
. . .
. . .
. . .
. . .
. . .
. . .
. . .
. . .
. . .
. . .
. . .
. . .
. . .
. . .
. . .
. . (2,888) Starwood Waypoint Residential Trust . .
. . .
. . .
. . .
. . .
. . .
. . .
. . .
. . .
. . .
. . .
. . .
. . .
. . .
. . .
. . .
. . .
. . .
. (5,609) Two Harbors Investment Corp. . .
. . .
. . .
. . .
. . .
. . .
. . .
. . .
. . .
. . .
. . .
. . .
. . .
. . .
. . .
. . .
. . .
. . .
. . .
. . . (273) Vornado Realty Trust .
. . .
. . .
. . .
. . .
. . .
. . .
. . .
. . .
. . .
. . .
. . .
. . .
. . .
. . .
. . .
. . .
. . .
. . .
. . .
. . .
. . .
. . . (423) WP Carey, Inc.
. . .
. . .
. . .
. . .
. . .
. . .
. . .
. . .
. . .
. . .
. . .
. . .
. . .
. . .
. . .
. . .
. . .
. . .
. . .
. . .
. . .
. . .
. . .
. . . Total Real Estate Investment Trusts Sold Short .
. . .
. . .
. . .
. . .
. . .
. . .
. . .
. . .
. . .
. . .
. . .
. . .
. . .
. (Proceeds $(445,845)) See Notes to Financial Statements Value ___________________ $ (25,607) (128,704) (31,365) ___________________ (185,676) ___________________ (25,581) ___________________ (24,668) (16,098) ___________________ (40,766) ___________________ (26,339) ___________________ (20,439) (17,918) ___________________ (38,357) ___________________ (17,343) (32,858) (25,624) (55,565) ___________________ (131,390) ___________________ (81,230) ___________________ (31,484) ___________________ (108,205) ___________________ (147,569) ___________________ (126,703) ___________________ (5,770,715) ___________________ (128,850) (27,888) (90,006) (23,094) (71,045) (47,452) (27,450) (26,805) ___________________ (442,590) ___________________ Page 15 . First Trust Long/Short Equity ETF (FTLS) Portfolio of Investments (Continued) October 31, 2015 Shares/ Units _______________ Description ___________________________________________________________________________________________________________________________________ EXCHANGE-TRADED FUNDS SOLD SHORT – (9.0%) Capital Markets – (9.0%) (1,327) iShares Core S&P 500 ETF . . . .
. . .
. . .
. . .
. . .
. . .
. . .
. . .
. . .
. . .
. . .
. . .
. . .
. . .
. . .
. . .
. . .
. . .
. . .
. . .
. (5,254) iShares Russell 2000 ETF . . .
. . .
. . .
. . .
. . .
. . .
. . .
. . .
. . .
. . .
. . .
. . .
. . .
. . .
. . .
. . .
. . .
. . .
. . .
. . .
. . . (698) iShares Russell 2000 Growth ETF .
. . .
. . .
. . .
. . .
. . .
. . .
. . .
. . .
. . .
. . .
. . .
. . .
. . .
. . .
. . .
. . .
. . .
. . .
. (9,355) SPDR S&P 500 ETF Trust . . .
. . .
. . .
. . .
. . .
. . .
. . .
. . .
. . .
. . .
. . .
. . .
. . .
. . .
. . .
. . .
. . .
. . .
. . .
. . .
. . Total Exchange-Traded Funds Sold Short . .
. . .
. . .
. . .
. . .
. . .
. . .
. . .
. . .
. . .
. . .
. . .
. . .
. . .
. . .
. (Proceeds $(2,881,591)) Value ___________________ $ (277,409) (605,997) (98,802) (1,945,185) ___________________ (2,927,393) ___________________ Total Investments Sold Short – (28.0%) . . .
. . .
. . .
. . .
. . .
. . .
. . .
. . .
. . .
. . .
. . .
. . .
. . .
. . .
. . .
. . (Proceeds $(9,270,052)) (9,140,698) ___________________ Net Other Assets and Liabilities – 30.1% . .
. . .
. . .
. . .
. . .
. . .
. . .
. . .
. . .
. . .
. . .
. . .
. . .
. . .
. . .
. . Net Assets – 100.0% . .
. . .
. . .
. . .
. . .
. . .
. . .
. . .
. . .
. . .
. . .
. . .
. . .
. . .
. . .
. . .
. . .
. . .
. . .
. . .
. . .
. . 9,825,714 ___________________ $ 32,607,564 ___________________ ___________________ (a) The security or a portion of the security is segregated as collateral for investments sold short. (b) Non-income producing security. (c) Aggregate cost for federal income tax purposes is $31,582,534. As of October 31, 2015, the aggregate gross unrealized appreciation for all securities in which there was an excess of value over tax cost was $1,310,826 and the aggregate gross unrealized depreciation for all securities in which there was an excess of tax cost over value was $970,812. ADR American Depositary Receipt Valuation Inputs A summary of the inputs used to value the Fund’s investments as of October 31, 2015 is as follows (see Note 2A – Portfolio Valuation in the Notes to Financial Statements): ASSETS TABLE Investments ________________________________________________ Total Value at 10/31/2015 _____________ Level 1 Quoted Prices ____________ Common Stocks* .
. . .
. . .
. . .
. . .
. . .
. . .
. . .
. . .
. . .
. . Real Estate Investment Trusts . .
. . .
. . .
. . .
. . .
. . .
. . . Master Limited Partnerships* .
. . .
. . .
. . .
. . .
. . .
. . .
. Total Investments . . .
. . .
. . .
. . .
. . .
. . .
. . .
. . .
. . .
. . . $ 29,484,874 767,448 1,670,226 _____________ $ 31,922,548 _____________ _____________ $ 29,484,874 767,448 1,670,226 ____________ $ 31,922,548 ____________ ____________ Level 2 Significant Observable Inputs _____________ Level 3 Significant Unobservable Inputs _____________ $ — — — _____________ $ — _____________ _____________ $ — — — _____________ $ — _____________ _____________ Level 2 Significant Observable Inputs _____________ Level 3 Significant Unobservable Inputs _____________ $ $ LIABILITIES TABLE Total Value at 10/31/2015 _____________ Common Stocks Sold Short* .
. . .
. . .
. . .
. . .
. . .
. . .
. . Real Estate Investment Trusts Sold Short . .
. . .
. . .
. . . Exchange-Traded Funds Sold Short* .
. . .
. . .
. . .
. . .
. Total Investments Sold Short . . .
. . .
. . .
. . .
. . .
. . .
. . . Level 1 Quoted Prices ____________ $ (5,770,715) (442,590) (2,927,393) _____________ $ (9,140,698) _____________ _____________ $ (5,770,715) (442,590) (2,927,393) ____________ $ (9,140,698) ____________ ____________ — — — _____________ $ — _____________ _____________ — — — _____________ $ — _____________ _____________ * See Portfolio of Investments for industry breakout. All transfers in and out of the Levels during the period are assumed to be transferred on the last day of the period at their current value. There were no transfers between Levels at October 31, 2015. Page 16 See Notes to Financial Statements .
First Trust Long/Short Equity ETF (FTLS) Statement of Assets and Liabilities October 31, 2015 ASSETS: Investments, at value (Cost $31,461,043) . . . .
. . .
. . .
. . .
. . .
. . .
. . .
. . .
. . .
. . Cash . .
. . .
. . .
. . .
. . .
. . .
. . .
. . .
. . .
. . .
. . .
. . .
. . .
. . .
. . .
. . .
. . .
. . .
. . .
. . . Restricted cash .
. . .
. . .
. . .
. . .
. . .
. . .
. . .
. . .
. . .
. . .
. . .
. . .
. . .
. . .
. . .
. . .
. . Receivables: Investment securities sold . .
. . .
. . .
. . .
. . .
. . .
. . .
. . .
. . .
. . .
. . .
. . .
. . .
. . Dividends . .
. . .
. . .
. . .
. . .
. . .
. . .
. . .
. . .
. . .
. . .
. . .
. . .
. . .
. . .
. . .
. . .
. . Dividend reclaims . .
. . .
. . .
. . .
. . .
. . .
. . .
. . .
. . .
. . .
. . .
. . .
. . .
. . .
. . .
. . Other assets . .
. . .
. . .
. . .
. . .
. . .
. . .
. . .
. . .
. . .
. . .
. . .
. . .
. . .
. . .
. . .
. . .
. . . Total Assets .
. . .
. . .
. . .
. . .
. . .
. . .
. . .
. . .
. . .
. . .
. . .
. . .
. . .
. . .
. . .
. . .
. . LIABILITIES: Investments sold short, at value (proceeds $9,270,052) . .
. . .
. . .
. . .
. . .
. . .
. . Payables: Investment advisory fees . .
. . .
. . .
. . .
. . .
. . .
. . .
. . .
. . .
. . .
. . .
. . .
. . .
. . . Other liabilities .
. . .
. . .
. . .
. . .
. . .
. . .
. . .
. . .
. . .
. . .
. . .
. . .
. . .
. . .
. . .
. . .
. . Total Liabilities . .
. . .
. . .
. . .
. . .
. . .
. . .
. . .
. . .
. . .
. . .
. . .
. . .
. . .
. . .
. . .
. NET ASSETS . . .
. . .
. . .
. . .
. . .
. . .
. . .
. . .
. . .
. . .
. . .
. . .
. . .
. . .
. . .
. . .
. . . NET ASSETS consist of: Paid-in capital .
. . .
. . .
. . .
. . .
. . .
. . .
. . .
. . .
. . .
. . .
. . .
. . .
. . .
. . .
. . .
. . .
. . Par value . .
. . .
. . .
. . .
. . .
. . .
. . .
. . .
. . .
. . .
. . .
. . .
. . .
. . .
. . .
. . .
. . .
. . .
. . . Accumulated net investment income (loss) .
. . .
. . .
. . .
. . .
. . .
. . .
. . .
. . .
. . .
. Accumulated net realized gain (loss) on investments and investments sold short . . .
. . .
. . .
. . .
. . .
. . .
. . .
. . .
. . .
. . .
. . .
. . .
. . .
. . .
. . .
. . .
. . .
. . . Net unrealized appreciation (depreciation) on investments and investments sold short .
. . .
. . .
. . .
. . .
. . .
. . .
. . .
. . .
. . .
. . .
. . .
. . .
. . .
. . . NET ASSETS .
. . .
. . .
. . .
. . .
. . .
. . .
. . .
. . .
. . .
. . .
. . .
. . .
. . .
. . .
. . .
. . .
. . $ 31,922,548 414,050 9,245,221 152,606 32,532 1,946 3,488 ___________________ 41,772,391 ___________________ 9,140,698 23,426 703 ___________________ 9,164,827 ___________________ $ 32,607,564 ___________________ ___________________ $ 32,218,776 10,000 (8,788) (203,283) 590,859 ___________________ $ 32,607,564 ___________________ ___________________ NET ASSET VALUE, per share . .
. . .
. . .
. . .
. . .
. . .
. . .
. . .
. . .
. . .
. . .
. . .
. . $ 32.61 ___________________ ___________________ Number of shares outstanding (unlimited number of shares authorized, par value $0.01 per share) . .
. . .
. . .
. . .
. . .
. . .
. . .
. . .
. . 1,000,002 ___________________ ___________________ See Notes to Financial Statements Page 17 . First Trust Long/Short Equity ETF (FTLS) Statement of Operations For the Year ended October 31, 2015 INVESTMENT INCOME: Dividends . . . .
. . .
. . .
. . .
. . .
. . .
. . .
. . .
. . .
. . .
. . .
. . .
. . .
. . .
. . .
. . .
. . .
. . . Foreign tax withholding .
. . .
. . .
. . .
. . .
. . .
. . .
. . .
. . .
. . .
. . .
. . .
. . .
. . .
. . .
. Total investment income . . .
. . .
. . .
. . .
. . .
. . .
. . .
. . .
. . .
. . .
. . .
. . .
. . .
. . EXPENSES: Investment advisory fees . .
. . .
. . .
. . .
. . .
. . .
. . .
. . .
. . .
. . .
. . .
. . .
. . .
. . .
. . Dividend expense on investments sold short . .
. . .
. . .
. . .
. . .
. . .
. . .
. . .
. . .
. . Total expenses . .
. . .
. . .
. . .
. . .
. . .
. . .
. . .
. . .
. . .
. . .
. . .
. . .
. . .
. . .
. . .
. . NET INVESTMENT INCOME (LOSS) . .
. . .
. . .
. . .
. . .
. . .
. . .
. . .
. . .
. . . NET REALIZED AND UNREALIZED GAIN (LOSS): Net realized gain (loss) on: Investments .
. . .
. . .
. . .
. . .
. . .
. . .
. . .
. . .
. . .
. . .
. . .
. . .
. . .
. . .
. . .
. . .
. . In-kind redemptions . .
. . .
. . .
. . .
. . .
. . .
. . .
. . .
. . .
. . .
. . .
. . .
. . .
. . .
. . . Investments sold short .
. . .
. . .
. . .
. . .
. . .
. . .
. . .
. . .
. . .
. . .
. . .
. . .
. . .
. . . Net realized gain (loss) .
. . .
. . .
. . .
. . .
. . .
. . .
. . .
. . .
. . .
. . .
. . .
. . .
. . .
. . .
. Net change in unrealized appreciation (depreciation) on: . . .
. . .
. . .
. . .
. . .
. . . Investments .
. . .
. . .
. . .
. . .
. . .
. . .
. . .
. . .
. . .
. . .
. . .
. . .
. . .
. . .
. . .
. . .
. . Investments sold short . .
. . .
. . .
. . .
. . .
. . .
. . .
. . .
. . .
. . .
. . .
. . .
. . .
. . .
. . Net change in unrealized appreciation (depreciation) . .
. . .
. . .
. . .
. . .
. . .
. . .
. NET REALIZED AND UNREALIZED GAIN (LOSS) . . .
. . .
. . .
. . .
. . .
. . NET INCREASE (DECREASE) IN NET ASSETS RESULTING FROM OPERATIONS . .
. . .
. . .
. . .
. . .
. . .
. . .
. . .
. . .
. . .
. . .
. . .
. . .
. . .
. Page 18 $ 256,161 (1,100) ___________________ 255,061 ___________________ 130,017 71,499 ___________________ 201,516 ___________________ 53,545 ___________________ (303,345) 418,430 58,189 ___________________ 173,274 ___________________ 410,230 131,530 ___________________ 541,760 ___________________ 715,034 ___________________ $ 768,579 ___________________ ___________________ See Notes to Financial Statements . First Trust Long/Short Equity ETF (FTLS) Statements of Changes in Net Assets For the Year Ended 10/31/2015 _______________ For the Period 9/8/2014 (a) through 10/31/2014 _______________ $ OPERATIONS: Net investment income (loss) . . . .
. . .
. . .
. . .
. . .
. . .
. . .
. . .
. . .
. . .
. . .
. . .
. . Net realized gain (loss) . .
. . .
. . .
. . .
. . .
. . .
. . .
. . .
. . .
. . .
. . .
. . .
. . .
. . .
. . . Net change in unrealized appreciation (depreciation) .
. . .
. . .
. . .
. . .
. . .
. . .
. . Net increase (decrease) in net assets resulting from operations . .
. . .
. . .
. . .
. . $ 53,545 173,274 541,760 _______________ 768,579 _______________ 4,614 1,726 49,099 _______________ 55,439 _______________ DISTRIBUTIONS TO SHAREHOLDERS FROM: Net investment income . .
. . .
. . .
. . .
. . .
. . .
. . .
. . .
. . .
. . .
. . .
. . .
. . .
. . .
. . . Net realized gain .
. . .
. . .
. . .
. . .
. . .
. . .
. . .
. . .
. . .
. . .
. . .
. . .
. . .
. . .
. . .
. . . Total distributions to shareholders .
. . .
. . .
. . .
. . .
. . .
. . .
. . .
. . .
. . .
. . .
. . .
. . (62,116) (2,000) _______________ (64,116) _______________ (1,620) — _______________ (1,620) _______________ SHAREHOLDER TRANSACTIONS: Proceeds from shares sold . .
. . .
. . .
. . .
. . .
. . .
. . .
. . .
. . .
. . .
. . .
. . .
. . .
. . .
. Cost of shares redeemed . . .
. . .
. . .
. . .
. . .
. . .
. . .
. . .
. . .
. . .
. . .
. . .
. . .
. . .
. Net increase (decrease) in net assets resulting from shareholder transactions . . .
. . .
. . .
. . .
. . .
. . .
. . .
. . .
. . .
. . .
. . .
. . .
. . .
. . . Total increase (decrease) in net assets .
. . .
. . .
. . .
. . .
. . .
. . .
. . .
. . .
. . .
. . .
. . 33,730,801 3,000,060 (4,881,579) _______________ — _______________ 28,849,222 _______________ 3,000,060 _______________ 29,553,685 3,053,879 NET ASSETS: Beginning of year . .
. . .
. . .
. . .
. . .
. . .
. . .
. . .
. . .
. . .
. . .
. . .
. . .
. . .
. . .
. . .
. . End of year . .
. . .
. . .
. . .
. . .
. . .
. . .
. . .
. . .
. . .
. . .
. . .
. . .
. . .
. . .
. . .
. . .
. . .
. 3,053,879 _______________ — _______________ $ 32,607,564 _______________ _______________ $ 3,053,879 _______________ _______________ Accumulated net investment income (loss) at end of year . . .
. . .
. . .
. . .
. . .
. . $ (8,788) _______________ _______________ $ 2,994 _______________ _______________ CHANGES IN SHARES OUTSTANDING: Shares outstanding, beginning of period . .
. . .
. . .
. . .
. . .
. . .
. . .
. . .
. . .
. . .
. . Shares sold . .
. . .
. . .
. . .
. . .
. . .
. . .
. . .
. . .
. . .
. . .
. . .
. . .
. . .
. . .
. . .
. . .
. . .
. Shares redeemed . . .
. . .
. . .
. . .
. . .
. . .
. . .
. . .
. . .
. . .
. . .
. . .
. . .
. . .
. . .
. . .
. Shares outstanding, end of period . . .
. . .
. . .
. . .
. . .
. . .
. . .
. . .
. . .
. . .
. . .
. . . 100,002 1,050,000 (150,000) _______________ 1,000,002 _______________ _______________ — 100,002 — _______________ 100,002 _______________ _______________ (a) Inception date is consistent with the commencement of investment operations and is the date the initial creation units were established. See Notes to Financial Statements Page 19 .
First Trust Long/Short Equity ETF (FTLS) Financial Highlights For a share outstanding throughout each period Year Ended October 31, 2015 _________________ Net asset value, beginning of period . . . .
. . .
. . .
. . . Income from investment operations: Net investment income (loss) .
. . .
. . .
. . .
. . .
. . .
. . . Net realized and unrealized gain (loss) .
. . .
. . .
. . .
. Total from investment operations . . .
. . .
. . .
. . .
. . . Distributions paid to shareholders from: Net investment income .
. . .
. . .
. . .
. . .
. . .
. . .
. . .
. . Net realized gain . .
. . .
. . .
. . .
. . .
. . .
. . .
. . .
. . .
. . Total distributions . .
. . .
. . .
. . .
. . .
. . .
. . .
. . .
. . .
. . Net asset value, end of period . .
. . .
. . .
. . .
. . .
. . .
. TOTAL RETURN (b) . . .
. . .
. . .
. . .
. . .
. . .
. . .
. . . RATIOS/SUPPLEMENTAL DATA: Net assets, end of period (in 000’s) .
. . .
. . .
. . .
. . .
. Ratios to average net assets: Ratio of total expenses to average net assets . . .
. . .
. Ratio of total expenses to average net assets excluding dividend expense . . .
. . .
. . .
. . .
. . .
. . . Ratio of net investment income (loss) to average net assets .
. . .
. . .
. . .
. . .
. . .
. . .
. . .
. . .
. . .
. . .
. . Portfolio turnover rate (d) . .
. . .
. . .
. . .
. . .
. . .
. . .
. For the Period 9/8/2014 (a) through 10/31/2014 _________________ $ 30.54 __________ $ 30.00 __________ 0.19 2.12 __________ 2.31 __________ 0.05 0.51 __________ 0.56 __________ (0.22) (0.02) __________ (0.24) __________ $ 32.61 __________ __________ 7.60% (0.02) — __________ (0.02) __________ $ 30.54 __________ __________ 1.86% $ 32,608 $ 3,054 1.47% 1.17% (c) 0.95% 0.95% (c) 0.39% 267% 1.08% (c) 1% (a) Inception date is consistent with the commencement of investment operations and is the date the initial creation units were established. (b) Total return is calculated assuming an initial investment made at the net asset value at the beginning of the period, reinvestment of all distributions at net asset value during the period, and redemption at net asset value on the last day of the period. The returns presented do not reflect the deduction of taxes that a shareholder would pay on Fund distributions or the redemption or sale of Fund shares. Total return is calculated for the time period presented and is not annualized for periods of less than a year. (c) Annualized. (d) Portfolio turnover is calculated for the time period presented and is not annualized for periods of less than a year and does not include securities received or delivered from processing creations or redemptions and in-kind transactions. Page 20 See Notes to Financial Statements .
Notes to Financial Statements First Trust Long/Short Equity ETF (FTLS) October 31, 2015 1. Organization First Trust Exchange-Traded Fund III (the “Trust”) is a non-diversified open-end management investment company organized as a Massachusetts business trust on January 9, 2008, and is registered with the Securities and Exchange Commission under the Investment Company Act of 1940, as amended (the “1940 Act”). The Trust currently consists of four funds that are offering shares. This report covers the First Trust Long/Short Equity ETF (the “Fund”), which trades under the ticker “FTLS” on the NYSE Arca, Inc. Unlike conventional mutual funds, the Fund issues and redeems shares on a continuous basis, at net asset value (“NAV”), only in large specified blocks consisting of 50,000 shares called a “Creation Unit.” Creation Units are issued and redeemed for securities in which the Fund invests or for cash or, in certain circumstances, a combination of both.
Except when aggregated in Creation Units, the shares are not redeemable securities of the Fund. The investment objective of the Fund is to seek to provide investors with long-term total return. The Fund pursues its investment objective by establishing long and short positions in a portfolio of equity securities. Under normal circumstances, at least 80% of the Fund’s net assets (plus the amount of any borrowing for investment purposes) will be exposed to U.S.
exchange-listed equity securities of U.S. and foreign companies by investing in such securities directly and/or in U.S. exchange-traded funds (“ETFs”) that provide exposure to such securities.
The equity securities held by the Fund may include U.S. exchange-listed equity securities of foreign issuers, as well as investments in the equity securities of foreign issuers that are in the form of depositary receipts. There can be no assurance that the Fund will achieve its investment objective.
The Fund may not be appropriate for all investors. 2. Significant Accounting Policies The Fund, which is an investment company within the scope of Financial Accounting Standards Board (“FASB”) Accounting Standards Update 2013-08, follows accounting and reporting guidance under FASB Accounting Standards Codification Topic 946, “Financial Services-Investment Companies.” The following is a summary of significant accounting policies consistently followed by the Fund in the preparation of the financial statements. The preparation of the financial statements in accordance with accounting principles generally accepted in the United States of America (“U.S.
GAAP”) requires management to make estimates and assumptions that affect the reported amounts and disclosures in the financial statements. Actual results could differ from those estimates. A. Portfolio Valuation The Fund’s NAV is determined daily as of the close of regular trading on the New York Stock Exchange (“NYSE”), normally 4:00 p.m. Eastern time, on each day the NYSE is open for trading.
If the NYSE closes early on a valuation day, the NAV is determined as of that time. Domestic debt securities and foreign securities are priced using data reflecting the earlier closing of the principal markets for those securities. The Fund’s NAV is calculated by dividing the value of all assets of the Fund (including accrued interest and dividends), less all liabilities (including accrued expenses and dividends declared but unpaid), by the total number of shares outstanding. The Fund’s investments are valued daily at market value or, in the absence of market value with respect to any portfolio securities, at fair value.
Market value prices represent last sale or official closing prices from a national or foreign exchange (i.e., a regulated market) and are primarily obtained from third-party pricing services. Fair value prices represent any prices not considered market value prices and are either obtained from a third-party pricing service or are determined by the Pricing Committee of the Fund’s investment advisor, First Trust Advisors L.P. (“First Trust” or the “Advisor”), in accordance with valuation procedures adopted by the Trust’s Board of Trustees, and in accordance with provisions of the 1940 Act.
Investments valued by the Advisor’s Pricing Committee, if any, are footnoted as such in the footnotes to the Portfolio of Investments. The Fund’s investments are valued as follows: Common stocks and other equity securities listed on any national or foreign exchange (excluding The NASDAQ® Stock Market LLC (“NASDAQ”) and the London Stock Exchange Alternative Investment Market (“AIM”)) are valued at the last sale price on the exchange on which they are principally traded or, for NASDAQ and AIM securities, the official closing price. Securities traded on one or more than one securities exchange are valued at the last sale price or official closing price, as applicable, at the close of the securities exchange representing the principal market for such securities. Securities traded in an over-the-counter market are fair valued at the mean of their most recent bid and asked price, if available, and otherwise at their closing bid price. Certain securities may not be able to be priced by pre-established pricing methods. Such securities may be valued by the Trust’s Board of Trustees or its delegate, the Advisor’s Pricing Committee, at fair value.
These securities generally include, but are not limited to, restricted securities (securities which may not be publicly sold without registration under the Securities Act of 1933, as amended, for which a pricing service is unable to provide a market price; securities whose trading has been formally suspended; a Page 21 . Notes to Financial Statements (Continued) First Trust Long/Short Equity ETF (FTLS) October 31, 2015 security whose market or fair value price is not available from a pre-established pricing source; a security with respect to which an event has occurred that is likely to materially affect the value of the security after the market has closed but before the calculation of the Fund’s NAV or make it difficult or impossible to obtain a reliable market quotation; and a security whose price, as provided by the pricing service, does not reflect the security’s fair value. As a general principle, the current fair value of a security would appear to be the amount which the owner might reasonably expect to receive for the security upon its current sale. When fair value prices are used, generally they will differ from market quotations or official closing prices on the applicable exchanges. A variety of factors may be considered in determining the fair value of such securities, including, but not limited to, the following: 1) the type of security; 2) the size of the holding; 3) the initial cost of the security; 4) transactions in comparable securities; 5) price quotes from dealers and/or pricing services; 6) relationships among various securities; 7) information obtained by contacting the issuer, analysts, or the appropriate stock exchange; 8) an analysis of the issuer’s financial statements; and 9) the existence of merger proposals or tender offers that might affect the value of the security. The Fund is subject to fair value accounting standards that define fair value, establish the framework for measuring fair value and provide a three-level hierarchy for fair valuation based upon the inputs to the valuation as of the measurement date.
The three levels of the fair value hierarchy are as follows: • Level 1 – Level 1 inputs are quoted prices in active markets for identical investments. An active market is a market in which transactions for the investment occur with sufficient frequency and volume to provide pricing information on an ongoing basis. • Level 2 – Level 2 inputs are observable inputs, either directly or indirectly, and include the following: o Quoted prices for similar investments in active markets. o Quoted prices for identical or similar investments in markets that are non-active. A non-active market is a market where there are few transactions for the investment, the prices are not current, or price quotations vary substantially either over time or among market makers, or in which little information is released publicly. o Inputs other than quoted prices that are observable for the investment (for example, interest rates and yield curves observable at commonly quoted intervals, volatilities, prepayment speeds, loss severities, credit risks, and default rates). o Inputs that are derived principally from or corroborated by observable market data by correlation or other means. • Level 3 – Level 3 inputs are unobservable inputs.
Unobservable inputs may reflect the reporting entity’s own assumptions about the assumptions that market participants would use in pricing the investment. The inputs or methodologies used for valuing investments are not necessarily an indication of the risk associated with investing in those investments. A summary of the inputs used to value the Fund’s investments as of October 31, 2015, is included with the Fund’s Portfolio of Investments. B. Securities Transactions and Investment Income Securities transactions are recorded as of the trade date.
Realized gains and losses from securities transactions are recorded on the identified cost basis. Dividend income is recorded on the ex-dividend date. Distributions received from the Fund’s investments in real estate investment trusts (“REITs”) may be comprised of return of capital, capital gains and income. The actual character of the amounts received during the year are not known until after the REIT’s fiscal year end.
The Fund records the character of distributions received from the REITs during the year based on estimates available. The characterization of distributions received by the Fund may be subsequently revised based on information received from the REITs after their tax reporting periods conclude. C. Short Sales Short sales are utilized for investment and risk management purposes and are transactions in which securities or other instruments (such as options forwards, futures or other derivative contracts) are sold that are not currently owned in the Fund’s portfolio.
When the Fund engages in a short sale, the Fund must borrow the security sold short and deliver the security to the counterparty. Short selling allows the Fund to profit from a decline in a market price to the extent such decline exceeds the transaction costs and the costs of borrowing the securities. The Fund will pay a fee or premium to borrow the securities and is obligated to repay the lenders of the securities.
Any dividends or interest that accrues on the securities during the period of the loan are due to the lenders. A gain, limited to the price at which the security was sold short, or a loss, unlimited in size, will be recognized upon the termination of the Page 22 . Notes to Financial Statements (Continued) First Trust Long/Short Equity ETF (FTLS) October 31, 2015 short sale; which is effected by the Fund purchasing the security sold short in the market and delivering the security to the lender. Any such gain or loss may be offset, completely or in part, by the change in the value of the long portion of the Fund’s portfolio. The Fund is subject to the risk that it may be unable to reacquire a security to terminate a short position except at a price substantially in excess of the last quoted price. Also, there is the risk that the counterparty to a short sale may fail to honor its contractual terms, causing a loss to the Fund. The Fund has established an account with Pershing, LLC for the purpose of purchasing securities on margin.
The Fund pays interest on any margin balance, which is calculated as the daily margin account balance times the broker’s margin interest rate. Restricted cash in the amount of $9,245,221, as shown on the Statement of Assets and Liabilities, is associated with collateral at the broker as of October 31, 2015. D. Dividends and Distributions to Shareholders Dividends from net investment income, if any, are declared and paid quarterly, or as the Board of Trustees may determine from time to time.
Distributions of net realized capital gains earned by the Fund, if any, will be distributed at least annually. Distributions from income and capital gains are determined in accordance with income tax regulations, which may differ from U.S. GAAP. Certain capital accounts in the financial statements are periodically adjusted for permanent differences in order to reflect their tax character. These permanent differences are primarily due to the varying treatment of income and gain/loss on portfolio securities held by the Fund and have no impact on net assets or net asset value per share.
Temporary differences, which arise from recognizing certain items of income, expense and gain/loss in different periods for financial statement and tax purposes, will reverse at some time in the future. Permanent differences incurred during the year ended October 31, 2015, resulting in book and tax accounting differences, have been reclassified at year end to reflect a decrease in accumulated net investment income (loss) by $3,211, a decrease in accumulated net realized gain (loss) on investments by $376,283 and an increase in paid-in-capital by $379,494. Net assets were not affected by this reclassification. The tax character of distributions paid during the fiscal year ended October 31, 2015 and fiscal period ended October 31, 2014 was as follows: Distributions paid from: Ordinary income .
. . .
. . .
. . .
. . .
. . .
. . .
. . .
. . .
. . .
. $ 2015 64,116 $ 2014 1,620 As of October 31, 2015, the components of distributable earnings on a tax basis to the Fund were as follows: Undistributed ordinary income . . .
. . .
. . .
. . .
. . .
. . . Accumulated capital and other losses .
. . .
. . .
. . .
. . . Net unrealized appreciation (depreciation) .
. . .
. . .
. . $ — (90,580) 469,368 E. Income Taxes The Fund intends to continue to qualify as a regulated investment company by complying with the requirements under Subchapter M of the Internal Revenue Code of 1986, as amended, which includes distributing substantially all of its net investment income and net realized gains to shareholders.
Accordingly, no provision has been made for federal or state income taxes. However, due to the timing and amount of distributions, the Fund may be subject to an excise tax of 4% of the amount by which approximately 98% of the Fund’s taxable income exceeds the distributions from such taxable income for the calendar year. The Fund is subject to accounting standards that establish a minimum threshold for recognizing, and a system for measuring, the benefits of a tax position taken or expected to be taken in a tax return. The taxable years ended 2014 and 2015 remain open to federal and state audit.
As of October 31, 2015, management has evaluated the application of these standards to the Fund, and has determined that no provision for income tax is required in the Fund’s financial statements for uncertain tax positions. The Fund intends to utilize provisions of the federal income tax laws, which allow it to carry a realized capital loss forward indefinitely following the year of the loss and offset such loss against any future realized capital gains. The Fund is subject to certain limitations under U.S. tax rules on the use of capital loss carryforwards and net unrealized built-in-losses.
These limitations apply when there has been a 50% change in ownership. At October 31, 2015, the Fund had non-expiring capital loss carryforwards for federal income tax purposes of $90,580. Certain losses realized during the current fiscal year may be deferred and treated as occurring on the first day of the following fiscal year for federal income tax purposes. For the fiscal year ended October 31, 2015, the Fund had no net ordinary losses. Page 23 .
Notes to Financial Statements (Continued) First Trust Long/Short Equity ETF (FTLS) October 31, 2015 In order to present paid-in capital, accumulated net investment income (loss) and accumulated net realized gain (loss) on investments on the Statement of Assets and Liabilities that more closely represent their tax character, certain adjustments have been made to paidin capital, accumulated net investment income (loss) and accumulated net realized gain (loss) on investments. These adjustments are primarily due to the difference between book and tax treatments of income and gains on various investment securities held by the Fund and in-kind transactions. The results of operations and net assets were not affected by these adjustments. F. Expenses Expenses, other than the investment advisory fee, dividend expenses on investments sold short and other excluded expenses, are paid by the Advisor (See Note 3). 3.
Investment Advisory Fee, Affiliated Transactions and Other Fee Arrangements First Trust, the investment advisor to the Fund, is a limited partnership with one limited partner, Grace Partners of DuPage L.P., and one general partner, The Charger Corporation. The Charger Corporation is an Illinois corporation controlled by James A. Bowen, Chief Executive Officer of First Trust.
First Trust is responsible for the selection and ongoing monitoring of the securities in the Fund’s portfolio, managing the Fund’s business affairs and providing certain administrative services necessary for the management of the Fund. Pursuant to the Investment Management Agreement, First Trust manages the investment of the Fund’s assets and is responsible for the Fund’s expenses, including the cost of transfer agency, custody, fund administration, legal, audit and other services, but excluding fee payments under the Investment Management Agreement, interest, taxes, brokerage commissions and other expenses connected with the execution of portfolio transactions, distribution and service fees pursuant to a 12b-1 plan, if any, acquired fund fees and expenses, dividend expenses on investments sold short and extraordinary expenses. The Fund has agreed to pay First Trust an annual unitary management fee equal to 0.95% of its average daily net assets. First Trust also provides fund reporting services to the Fund for a flat annual fee in the amount of $9,250, which is covered under the annual unitary management fee. The Fund has multiple service agreements with Brown Brothers Harriman & Co.
(“BBH”). Under the service agreements, BBH performs custodial, fund accounting, certain administrative services, and transfer agency services for the Fund. As custodian, BBH is responsible for custody of the Fund’s assets.
As fund accountant and administrator, BBH is responsible for maintaining the books and records of the Fund’s securities and cash. As transfer agent, BBH is responsible for maintaining shareholder records for the Fund. Each Trustee who is not an officer or employee of First Trust, any sub-advisor or any of their affiliates (“Independent Trustees”) is paid a fixed annual retainer that is allocated pro rata among each fund in the First Trust Fund Complex based on net assets. Each Independent Trustee is also paid an annual per fund fee that varies based on whether the fund is a closed-end or other actively managed fund, or is an index fund. Additionally, the Lead Independent Trustee and the Chairmen of the Audit Committee, Nominating and Governance Committee and Valuation Committee are paid annual fees to serve in such capacities, with such compensation allocated pro rata among each fund in the First Trust Fund Complex based on net assets.
Trustees are reimbursed for travel and out-of-pocket expenses in connection with all meetings. The Lead Independent Trustee and Committee Chairmen rotate every three years. The officers and “Interested” Trustee receive no compensation from the Trust for acting in such capacities. 4.
Purchases and Sales of Securities For the year ended October 31, 2015, the cost of purchases and proceeds from sales of investments, excluding short-term investments and in-kind transactions, for the Fund were $36,304,786 and $45,096,160, respectively. The cost of purchases to cover short sales and the proceeds of short sales were $7,836,819 and $16,556,153, respectively. For the year ended October 31, 2015, the cost of in-kind purchases and proceeds from in-kind sales for the Fund was $33,332,729 and $4,859,907, respectively. 5. Creations, Redemptions and Transaction Fees Shares are created and redeemed by the Fund only in Creation Unit size aggregations of 50,000 shares in transactions with brokerdealers or large institutional investors that have entered into a participation agreement (an “Authorized Participant”).
In order to purchase Creation Units of the Fund, an Authorized Participant must deposit (i) a designated portfolio of securities determined by First Trust (the “Deposit Securities”) and generally make or receive a cash payment referred to as the “Cash Component,” which is an amount equal to Page 24 . Notes to Financial Statements (Continued) First Trust Long/Short Equity ETF (FTLS) October 31, 2015 the difference between the NAV of the Fund shares (per Creation Unit aggregations) and the market value of the Deposit Securities, and/or (ii) cash in lieu of all or a portion of the Deposit Securities. If the Cash Component is a positive number (i.e., the NAV per Creation Unit Aggregation exceeds the Deposit Amount), the Authorized Participant will deliver the Cash Component. If the Cash Component is a negative number (i.e., the NAV per Creation Unit Aggregation is less than the Deposit Amount), the Authorized Participant will receive the Cash Component. Purchasers of Creation Units must pay to BBH, as transfer agent, a creation fee (the “Creation Transaction Fee”) regardless of the number of Creation Units purchased in the transaction.
The Creation Transaction Fee may vary and is based on the composition of the securities included in the Fund’s portfolio and the countries in which the transactions are settled. The Creation Transaction Fee may increase or decrease as the Fund’s portfolio is adjusted to conform to changes in the composition of the securities included in the Fund’s portfolio and the countries in which the transaction settled. The Creation Transaction fee is currently $550.
The price for each Creation Unit will equal the daily NAV per share times the number of shares in a Creation Unit plus the fees described above and, if applicable, any operational processing and brokerage costs, transfer fees or stamp taxes. When the Fund permits an Authorized Participant to substitute cash or a different security in lieu of depositing one or more of the requisite Deposit Securities, the Authorized Participant may also be assessed an amount to cover the cost of purchasing the Deposit Securities and/or disposing of the substituted securities, including operational processing and brokerage costs, transfer fees, stamp taxes, and part or all of the spread between the expected bid and offer side of the market related to such Deposit Securities and/or substitute securities. Authorized Participants redeeming Creation Units must pay to BBH, as transfer agent, a redemption transaction fee (the “Redemption Transaction Fee”), regardless of the number of Creation Units redeemed in the transaction. The Redemption Transaction Fee may vary and is based on the composition of the securities included in the Fund’s portfolio and the countries in which the transactions are settled.
The Redemption Transaction Fee is currently $550. The Fund reserves the right to effect redemptions in cash. An Authorized Participant may request cash redemption in lieu of securities; however, the Fund may, in its discretion, reject any such request. 6.
Distribution Plan The Board of Trustees adopted a Distribution and Service Plan pursuant to Rule 12b-1 under the 1940 Act. In accordance with the Rule 12b-1 plan, the Fund is authorized to pay an amount up to 0.25% of its average daily net assets each year to reimburse FTP, the distributor of the Fund, for amounts expended to finance activities primarily intended to result in the sale of Creation Units or the provision of investor services. FTP may also use this amount to compensate securities dealers or other persons that are Authorized Participants for providing distribution assistance, including broker-dealer and shareholder support and educational and promotional services. No 12b-1 fees are currently paid by the Fund, and pursuant to a contractual arrangement, no 12b-1 fees will be paid any time before August 26, 2016. 7.
Indemnification The Trust, on behalf of the Fund, has a variety of indemnification obligations under contracts with its service providers. The Trust’s maximum exposure under these arrangements is unknown. However, the Trust has not had prior claims or losses pursuant to these contracts and expects the risk of loss to be remote. 8.
Adoption of Non-fundamental Investment Policy On March 27, 2015, the Board of Trustees of the Trust approved the adoption of a non-fundamental investment policy regarding the Fund’s ability to invest in other investment companies (the “Policy”). Pursuant to the Policy, beginning on June 7, 2015, the Fund no longer relies on Section 12(2)(1)(F) or Section 12(d)(1)(G) of the 1940 Act to invest in other investment companies. 9. Subsequent Events Management has evaluated the impact of all subsequent events to the Fund through the date the financial statements were issued, and has determined there was the following subsequent event: At a meeting on December 7, 2015, the Board accepted Mr.
Bradley’s resignation from his position as the President and Chief Executive Officer of the Trust, effective December 31, 2015. At the same meeting, the Board elected Mr. Dykas to serve as the President and Chief Executive Officer and Mr.
Donald Swade, formerly an Assistant Treasurer of the Trust, to serve as the Treasurer, Chief Financial Officer and Chief Accounting Officer of the Trust. Page 25 . Report of Independent Registered Public Accounting Firm To the Board of Trustees and Shareholders of First Trust Long/Short Equity ETF: We have audited the accompanying statement of assets and liabilities of First Trust Long/Short Equity ETF (the “Fund”), a series of the First Trust Exchange-Traded Fund III, including the portfolio of investments, as of October 31, 2015, and the related statement of operations for the year then ended, and the statements of changes in net assets and the financial highlights for each of the periods presented. These financial statements and financial highlights are the responsibility of the Fund’s management. Our responsibility is to express an opinion on these financial statements and financial highlights based on our audits. We conducted our audits in accordance with the standards of the Public Company Accounting Oversight Board (United States). Those standards require that we plan and perform the audit to obtain reasonable assurance about whether the financial statements and financial highlights are free of material misstatement. The Fund is not required to have, nor were we engaged to perform, an audit of its internal control over financial reporting.
Our audits included consideration of internal control over financial reporting as a basis for designing audit procedures that are appropriate in the circumstances, but not for the purpose of expressing an opinion on the effectiveness of the Fund’s internal control over financial reporting. Accordingly, we express no such opinion. An audit also includes examining, on a test basis, evidence supporting the amounts and disclosures in the financial statements, assessing the accounting principles used and significant estimates made by management, as well as evaluating the overall financial statement presentation.
Our procedures included confirmation of securities owned as of October 31, 2015 by correspondence with the Fund’s custodian and brokers; when replies were not received from brokers, we performed other auditing procedures. We believe that our audits provide a reasonable basis for our opinion. In our opinion, the financial statements and financial highlights referred to above present fairly, in all material respects, the financial position of First Trust Long/Short Equity ETF as of October 31, 2015, the results of its operations for the year then ended, and the changes in its net assets and the financial highlights for each of the periods presented, in conformity with accounting principles generally accepted in the United States of America. Chicago, Illinois December 23, 2015 Page 26 . Additional Information First Trust Long/Short Equity ETF (FTLS) October 31, 2015 (Unaudited) Proxy Voting Policies and Procedures A description of the policies and procedures that the Trust uses to determine how to vote proxies and information on how the Fund voted proxies relating to portfolio investments during the most recent 12-month period ended June 30 is available (1) without charge, upon request, by calling (800) 988-5891; (2) on the Fund’s website located at http://www.ftportfolios.com; and (3) on the Securities and Exchange Commission’s (“SEC”) website located at http://www.sec.gov. Portfolio Holdings The Trust files its complete schedule of portfolio holdings with the SEC for the first and third quarters of each fiscal year on Form NQ. The Trust’s Forms N-Q are available (1) by calling (800) 988-5891; (2) on the Fund’s website located at http://www.ftportfolios.com; (3) on the SEC’s website at http://www.sec.gov; and (4) for review and copying at the SEC’s Public Reference Room (“PRR”) in Washington, DC. Information regarding the operation of the PRR may be obtained by calling (800) SEC-0330. Federal Tax Information For the taxable year ended October 31, 2015, the following percentages of income dividend paid by the Fund qualify for the dividends received deduction available to corporations and is hereby designated as qualified dividend income: Dividends Received Deduction _________________________________ Qualified Dividend Income _________________________________ 100% 100% Risk Considerations You could lose money by investing in the Fund. An investment in the Fund is not a deposit of a bank and is not insured or guaranteed by the Federal Deposit Insurance Corporation or any other governmental agency.
There can be no assurance that the Fund’s investment objective will be achieved. CASH TRANSACTIONS RISK. The Fund may, under certain circumstances, effect a portion of creations and redemptions for cash, rather than in-kind securities, particularly for the puts and call options in which the Fund invests. As a result, an investment in the Fund may be less tax-efficient than an investment in an ETF that effects its creations and redemption for in-kind securities. Because the Fund may effect a portion of redemptions for cash, it may be required to sell portfolio securities in order to obtain the cash needed to distribute redemption proceeds.
A sale of shares may result in capital gains or losses, and may also result in higher brokerage costs. DEPOSITARY RECEIPTS RISK. Depositary receipts may be less liquid than the underlying shares in their primary trading market. Any distributions paid to the holders of depositary receipts are usually subject to a fee charged by the depositary.
Holders of depositary receipts may have limited voting rights, and investment restrictions in certain countries may adversely impact the value of depositary receipts because such restrictions may limit the ability to convert the equity shares into depositary receipts and vice versa. Such restrictions may cause the equity shares of the underlying issuer to trade at a discount or premium to the market price of the depositary receipts. DERIVATIVES RISK. The use of futures and other derivatives can lead to losses because of adverse movements in the price or value of the underlying asset, index or rate, which may be magnified by certain features of the derivatives. These risks are heightened when the Fund’s portfolio managers use derivatives to enhance the Fund’s return or as a substitute for a position or security, rather than solely to hedge (or offset) the risk of a position or security held by the Fund. EQUITY SECURITIES RISK.
The Fund invests in Equity Securities. The value of the shares will fluctuate with changes in the value of these Equity Securities. Equity Securities prices fluctuate for several reasons, including changes in investors’ perceptions of the financial condition of an issuer or the general condition of the relevant stock market, such as the current market volatility, or when political or economic events affecting the issuers occur.
In addition, common stock prices may be particularly sensitive to rising interest rates, as the cost of the capital rises and borrowing costs increase. ETF RISK. The Fund may invest in the shares of other ETFs, and therefore, the Fund’s investment performance and risks may be related to the investment performance and risks of the underlying ETFs. In general, as a shareholder in other ETFs, the Fund bears its ratable share of the underlying ETF’s expenses, and would be subject to duplicative expenses to the extent the Fund invests in other ETFs. Page 27 .
Additional Information (Continued) First Trust Long/Short Equity ETF (FTLS) October 31, 2015 (Unaudited) MANAGEMENT RISK. The Fund is subject to management risk because it is an actively managed portfolio. In managing the Fund’s investment portfolio, the Fund’s investment advisor will apply investment techniques and risk analyses that may not have the desired result. There can be no guarantee that the Fund will meet its investment objective. MARKET RISK.
Market risk is the risk that a particular security owned by the Fund or shares of the Fund in general may fall in value. Securities are subject to market fluctuations caused by such factors as economic, political, regulatory or market developments, changes in interest rates and perceived trends in securities prices. Overall securities values could decline generally or could underperform other investments. NEW FUND RISK.
The Fund currently has fewer assets than larger funds, and like other relatively new funds, large inflows and outflows may impact the Fund’s market exposure for limited periods of time. This impact may be positive or negative, depending on the direction of market movement during the period affected. Also, during the initial invest-up period, the Fund may depart from its principal investment strategies and invest a larger amount or all of its assets in cash equivalents or it may hold cash. NON-DIVERSIFICATION RISK.
The Fund is classified as “non-diversified” under the Investment Company Act of 1940, as amended (the “1940 Act”). As a result, the Fund is only limited as to the percentage of its assets that may be invested in the securities of any one issuer by the diversification requirements imposed by the Internal Revenue Code of 1986, as amended (the “Code”). The Fund may invest a relatively high percentage of its assets in a limited number of issuers.
As a result, the Fund may be more susceptible to a single adverse economic or regulatory occurrence affecting one or more of these issuers, experience increased volatility and be highly invested in certain issuers. NON-U.S. SECURITIES RISK. The Fund holds non-U.S.
securities that are either directly listed on a U.S. securities exchange or in the form of depositary receipts. Non-U.S.
securities are subject to higher volatility than securities of domestic issuers due to possible adverse political, social or economic developments; restrictions on foreign investment or exchange of securities; lack of liquidity; currency exchange rates; excessive taxation; government seizure of assets; different legal or accounting standards; and less government supervision and regulation of exchanges in foreign countries. SHORT SALES RISK. The Fund will incur a loss as a result of a short sale if the price of the security sold short increases in value between the date of the short sale and the date on which the Fund purchases the security to replace the borrowed security. In addition, a lender of a security may request, or market conditions may dictate, that securities sold short be returned to the lender on short notice, which may result in the Fund having to buy the securities sold short at an unfavorable price.
If this occurs, any anticipated gain to the Fund may be reduced or eliminated or the short sale may result in a loss. In a rising stock market, the Fund’s short positions may significantly impact the Fund’s overall performance and cause the Fund to underperform traditional long-only equity funds or to sustain losses, particularly in a sharply rising market. The use of short sales may also cause the Fund to have higher expenses than other funds. Page 28 .
Board of Trustees and Officers First Trust Long/Short Equity ETF (FTLS) October 31, 2015 (Unaudited) The Trust’s statement of additional information includes additional information about the Trustees and is available, without charge, upon request, by calling (800) 988-5891. Name, Address, Date of Birth and Position with the Trust Term of Office and Year First Elected or Appointed Principal Occupations During Past 5 Years Number of Portfolios in the First Trust Fund Complex Overseen by Trustee Other Trusteeships or Directorships Held by Trustee During Past 5 Years INDEPENDENT TRUSTEES Richard E. Erickson, Trustee c/o First Trust Advisors L.P. 120 East Liberty Drive, Suite 400 Wheaton, IL 60187 D.O.B.: 04/51 Thomas R. Kadlec, Trustee c/o First Trust Advisors L.P. 120 East Liberty Drive, Suite 400 Wheaton, IL 60187 D.O.B.: 11/57 • Indefinite Term • Since Inception • Indefinite Term • Since Inception Robert F. Keith, Trustee c/o First Trust Advisors L.P. 120 East Liberty Drive, Suite 400 Wheaton, IL 60187 D.O.B.: 11/56 • Indefinite Term Niel B.
Nielson, Trustee c/o First Trust Advisors L.P. 120 East Liberty Drive, Suite 400 Wheaton, IL 60187 D.O.B.: 03/54 • Indefinite Term • Since Inception • Since Inception Physician; President, Wheaton Orthopedics; Limited Partner, Gundersen Real Estate Limited Partnership; Member, Sportsmed LLC 117 None President (March 2010 to Present), Senior Vice President and Chief Financial Officer (May 2007 to March 2010), ADM Investor Services, Inc. (Futures Commission Merchant) 117 Director of ADM Investor Services, Inc., ADM Investor Services International, and Futures Industry Association President (2003 to Present), Hibs Enterprises (Financial and Management Consulting) 117 Director of Trust Company of Illinois Managing Director and Chief Operating Officer (January 2015 to Present), Pelita Harapan Educational Foundation (Educational Products and Services); President and Chief Executive Officer (June 2012 to September 2014), Servant Interactive LLC (Educational Products and Services); President and Chief Executive Officer (June 2012 to September 2014), Dew Learning LLC (Educational Products and Services); President (June 2002 to June 2012), Covenant College 117 Director of Covenant Transport, Inc. (May 2003 to May 2014) 117 None INTERESTED TRUSTEE James A. Bowen(1), Trustee, Chairman of the Board 120 East Liberty Drive, Suite 400 Wheaton, IL 60187 D.O.B.: 09/55 (1) • Indefinite Term • Since Inception Chief Executive Officer (December 2010 to Present), President (until December 2010), First Trust Advisors L.P.
and First Trust Portfolios L.P.; Chairman of the Board of Directors, BondWave LLC (Software Development Company/Investment Advisor and Stonebridge Advisors LLC (Investment Advisor) Mr. Bowen is deemed an “interested person” of the Trust due to his position as Chief Executive Officer of First Trust Advisors L.P., investment advisor of the Trust. Page 29 . Board of Trustees and Officers (Continued) First Trust Long/Short Equity ETF (FTLS) October 31, 2015 (Unaudited) Name, Address and Date of Birth Position and Offices with Trust Term of Office and Length of Service Principal Occupations During Past 5 Years OFFICERS WHO ARE NOT TRUSTEES(2) Mark R. Bradley 120 E. Liberty Drive, Suite 400 Wheaton, IL 60187 D.O.B.: 11/57 President and Chief Executive Officer James M. Dykas 120 E.
Liberty Drive, Suite 400 Wheaton, IL 60187 D.O.B.: 01/66 Treasurer, Chief Financial Officer and Chief Accounting Officer W. Scott Jardine 120 E. Liberty Drive, Suite 400 Wheaton, IL 60187 D.O.B.: 05/60 Secretary and Chief Legal Officer Daniel J.
Lindquist 120 E. Liberty Drive, Suite 400 Wheaton, IL 60187 D.O.B.: 02/70 Vice President Kristi A. Maher 120 E.
Liberty Drive, Suite 400 Wheaton, IL 60187 D.O.B.: 12/66 Chief Compliance Officer and Assistant Secretary Roger F. Testin 120 E. Liberty Drive, Suite 400 Wheaton, IL 60187 D.O.B.: 06/66 Vice President Stan Ueland 120 E.
Liberty Drive, Suite 400 Wheaton, IL 60187 D.O.B.: 11/70 Vice President (2) • Indefinite Term • Since Inception • Indefinite Term • Since Inception • Indefinite Term • Since Inception • Indefinite Term • Since Inception • Indefinite Term Chief Operating Officer (December 2010 to Present) and Chief Financial Officer, First Trust Advisors L.P. and First Trust Portfolios L.P.; Chief Financial Officer, BondWave LLC (Software Development Company/Investment Advisor) and Stonebridge Advisors LLC (Investment Advisor) Controller (January 2011 to Present), Senior Vice President (April 2007 to Present), First Trust Advisors L.P. and First Trust Portfolios L.P. General Counsel, First Trust Advisors L.P., First Trust Portfolios L.P.; Secretary and General Counsel, BondWave LLC (Software Development Company/Investment Advisor); Secretary of Stonebridge Advisors LLC (Investment Advisor) Managing Director (July 2012 to Present), Senior Vice President (September 2005 to July 2012), First Trust Advisors L.P.
and First Trust Portfolios L.P. Deputy General Counsel, First Trust Advisors L.P. and First Trust Portfolios L.P. • Since Inception • Indefinite Term Senior Vice President, First Trust Advisors L.P. and First Trust Portfolios L.P. • Since Inception • Indefinite Term • Since Inception Senior Vice President (September 2012 to Present), Vice President (August 2005 to September 2012), First Trust Advisors L.P. and First Trust Portfolios L.P. The term “officer” means the president, vice president, secretary, treasurer, controller or any other officer who performs a policy making function. Page 30 .
Privacy Policy First Trust Long/Short Equity ETF (FTLS) October 31, 2015 (Unaudited) Privacy Policy First Trust values our relationship with you and considers your privacy an important priority in maintaining that relationship. We are committed to protecting the security and confidentiality of your personal information. Sources of Information We collect nonpublic personal information about you from the following sources: • Information we receive from you and your broker-dealer, investment advisor or financial representative through interviews, applications, agreements or other forms; • Information about your transactions with us, our affiliates or others; • Information we receive from your inquiries by mail, e-mail or telephone; and • Information we collect on our website through the use of “cookies”. For example, we may identify the pages on our website that your browser requests or visits. Information Collected The type of data we collect may include your name, address, social security number, age, financial status, assets, income, tax information, retirement and estate plan information, transaction history, account balance, payment history, investment objectives, marital status, family relationships and other personal information. Disclosure of Information We do not disclose any nonpublic personal information about our customers or former customers to anyone, except as permitted by law. In addition to using this information to verify your identity (as required under law), the permitted uses may also include the disclosure of such information to unaffiliated companies for the following reasons: • In order to provide you with products and services and to effect transactions that you request or authorize, we may disclose your personal information as described above to unaffiliated financial service providers and other companies that perform administrative or other services on our behalf, such as transfer agents, custodians and trustees, or that assist us in the distribution of investor materials such as trustees, banks, financial representatives, proxy services, solicitors and printers. • We may release information we have about you if you direct us to do so, if we are compelled by law to do so, or in other legally limited circumstances (for example to protect your account from fraud). In addition, in order to alert you to our other financial products and services, we may share your personal information with affiliates of the Fund. Privacy Online We allow third-party companies, including AddThis (a social media sharing service), to collect certain anonymous information when you visit our website.
These companies may use non-personally identifiable information during your visits to this and other websites in order to provide advertisements about goods and services likely to be of greater interest to you. These companies typically use a cookie, third party web beacon or pixel tags, to collect this information. To learn more about this behavioral advertising practice, you can visit www.networkadvertising.org. Confidentiality and Security With regard to our internal security procedures, we restrict access to your nonpublic personal information to those individuals who need to know that information to provide products or services to you.
We maintain physical, electronic and procedural safeguards to protect your nonpublic personal information. Policy Updates and Inquiries As required by federal law, we will notify you of our privacy policy annually. We reserve the right to modify this policy at any time, however, if we do change it, we will tell you promptly. For questions about our policy, or for additional copies of this notice, please go to www.ftportfolios.com, or contact us at 1-800-621-1675 (First Trust Portfolios) or 1-800-222-6822 (First Trust Advisors). Page 31 .
This page intentionally left blank. . First Trust Exchange-Traded Fund III INVESTMENT ADVISOR First Trust Advisors L.P. 120 East Liberty Drive, Suite 400 Wheaton, IL 60187 ADMINISTRATOR, CUSTODIAN, FUND ACCOUNTANT & TRANSFER AGENT Brown Brothers Harriman & Co. 50 Post Office Square Boston, MA 02110 INDEPENDENT REGISTERED PUBLIC ACCOUNTING FIRM Deloitte & Touche LLP 111 S. Wacker Drive Chicago, IL 60606 LEGAL COUNSEL Chapman and Cutler LLP 111 W. Monroe Street Chicago, IL 60603 . .
. . .
. . .
. . .
. . .
. . .
. . .
. . .
. . .
. . .
. . .
. . .
. . .
. . .
. . .
. . .
. . .
. . .
. . .
. . .
. . .
. . .
. . .
. . .
. . .
. . .
. . .
. . .
. . .
. . . Fund Performance Overview .
. . .
. . .
. . .
. . .
. . .
. . .
. . .
. . .
. . .
. . .
. . .
. . .
. . .
. . .
. . .
. . .
. . .
. . .
. . .
. . .
. . .
. . .
. . .
. . .
. . .
. . .
. . . Portfolio Commentary .
. . .
. . .
. . .
. . .
. . .
. . .
. . .
. . .
. . .
. . .
. . .
. . .
. . .
. . .
. . .
. . .
. . .
. . .
. . .
. . .
. . .
. . .
. . .
. . .
. . .
. . .
. . .
. . .
. . . Understanding Your Fund Expenses .
. . .
. . .
. . .
. . .
. . .
. . .
. . .
. . .
. . .
. . .
. . .
. . .
. . .
. . .
. . .
. . .
. . .
. . .
. . .
. . .
. . .
. . .
. . .
. . .
. . .
. Portfolio of Investments . . .
. . .
. . .
. . .
. . .
. . .
. . .
. . .
. . .
. . .
. . .
. . .
. . .
. . .
. . .
. . .
. . .
. . .
. . .
. . .
. . .
. . .
. . .
. . .
. . .
. . .
. . .
. . .
. . Statement of Assets and Liabilities . .
. . .
. . .
. . .
. . .
. . .
. . .
. . .
. . .
. . .
. . .
. . .
. . .
. . .
. . .
. . .
. . .
. . .
. . .
. . .
. . .
. . .
. . .
. . .
. . .
. . .
. Statement of Operations . . .
. . .
. . .
. . .
. . .
. . .
. . .
. . .
. . .
. . .
. . .
. . .
. . .
. . .
. . .
. . .
. . .
. . .
. . .
. . .
. . .
. . .
. . .
. . .
. . .
. . .
. . .
. . .
. . Statements of Changes in Net Assets . .
. . .
. . .
. . .
. . .
. . .
. . .
. . .
. . .
. . .
. . .
. . .
. . .
. . .
. . .
. . .
. . .
. . .
. . .
. . .
. . .
. . .
. . .
. . .
. . .
. . Financial Highlights . .
. . .
. . .
. . .
. . .
. . .
. . .
. . .
. . .
. . .
. . .
. . .
. . .
. . .
. . .
. . .
. . .
. . .
. . .
. . .
. . .
. . .
. . .
. . .
. . .
. . .
. . .
. . .
. . .
. . . Notes to Financial Statements .
. . .
. . .
. . .
. . .
. . .
. . .
. . .
. . .
. . .
. . .
. . .
. . .
. . .
. . .
. . .
. . .
. . .
. . .
. . .
. . .
. . .
. . .
. . .
. . .
. . .
. . .
. . . Report of Independent Registered Public Accounting Firm .
. . .
. . .
. . .
. . .
. . .
. . .
. . .
. . .
. . .
. . .
. . .
. . .
. . .
. . .
. . .
. . .
. . .
. . .
. . .
. Additional Information . . .
. . .
. . .
. . .
. . .
. . .
. . .
. . .
. . .
. . .
. . .
. . .
. . .
. . .
. . .
. . .
. . .
. . .
. . .
. . .
. . .
. . .
. . .
. . .
. . .
. . .
. . .
. . .
. . . Board of Trustees and Officers .
. . .
. . .
. . .
. . .
. . .
. . .
. . .
. . .
. . .
. . .
. . .
. . .
. . .
. . .
. . .
. . .
. . .
. . .
. . .
. . .
. . .
. . .
. . .
. . .
. . .
. . .
. . Privacy Policy . .
. . .
. . .
. . .
. . .
. . .
. . .
. . .
. . .
. . .
. . .
. . .
. . .
. . .
. . .
. . .
. . .
. . .
. . .
. . .
. . .
. . .
. . .
. . .
. . .
. . .
. . .
. . .
. . .
. . .
. . .
. . 1 2 5 7 8 17 18 19 20 21 26 27 29 31 Caution Regarding Forward-Looking Statements This report contains certain forward-looking statements within the meaning of the Securities Act of 1933, as amended, and the Securities Exchange Act of 1934, as amended. Forward-looking statements include statements regarding the goals, beliefs, plans or current expectations of First Trust Advisors L.P.
(“First Trust” or the “Advisor”) and its representatives, taking into account the information currently available to them. Forward-looking statements include all statements that do not relate solely to current or historical fact. For example, forward-looking statements include the use of words such as “anticipate,” “estimate,” “intend,” “expect,” “believe,” “plan,” “may,” “should,” “would” or other words that convey uncertainty of future events or outcomes. Forward-looking statements involve known and unknown risks, uncertainties and other factors that may cause the actual results, performance or achievements of the series of First Trust Exchange-Traded Fund III (the “Trust”) described in this report for the First Trust Long/Short Equity ETF (hereinafter referred to as the “Fund”) to be materially different from any future results, performance or achievements expressed or implied by the forward-looking statements.
When evaluating the information included in this report, you are cautioned not to place undue reliance on these forward-looking statements, which reflect the judgment of the Advisor and its representatives only as of the date hereof. We undertake no obligation to publicly revise or update these forward-looking statements to reflect events and circumstances that arise after the date hereof. Performance and Risk Disclosure There is no assurance that the Fund will achieve its investment objective. The Fund is subject to market risk, which is the possibility that the market values of securities owned by the Fund will decline and that the value of the Fund shares may therefore be less than what you paid for them.
Accordingly, you can lose money investing in the Fund. See “Risk Considerations” in the Additional Information section of this report for a discussion of certain other risks of investing in the Fund. Performance data quoted represents past performance, which is no guarantee of future results, and current performance may be lower or higher than the figures shown. For the most recent month-end performance figures, please visit http://www.ftportfolios.com or speak with your financial advisor.
Investment returns, net asset value and share price will fluctuate and Fund shares, when sold, may be worth more or less than their original cost. The Advisor may also periodically provide additional information on Fund performance on the Fund’s webpage at http://www.ftportfolios.com. How to Read This Report This report contains information that may help you evaluate your investment in the Fund. It includes details about the Fund’s portfolio and presents data and analysis that provide insight into the Fund’s performance and investment approach. By reading the portfolio commentary by the portfolio management team of the Fund, you may obtain an understanding of how the market environment affected the Fund’s performance. The statistical information that follows may help you understand the Fund’s performance compared to that of relevant market benchmarks. It is important to keep in mind that the opinions expressed by personnel of the Advisor are just that: informed opinions.
They should not be considered to be promises or advice. The opinions, like the statistics, cover the period through the date on the cover of this report. The material risks of investing in the Fund are spelled out in its prospectus, statement of additional information, this report and other Fund regulatory filings. .
Shareholder Letter First Trust Long/Short Equity ETF (FTLS) Annual Letter from the Chairman and CEO October 31, 2015 Dear Shareholders: Thank you for your investment in First Trust Long/Short Equity ETF (the “Fund”). First Trust Advisors L.P. (“First Trust”) is pleased to provide you with the annual report which contains detailed information about your investment for the 12 months ended October 31, 2015, including a market overview and a performance analysis for the period. We encourage you to read this report and discuss it with your financial advisor. U.S. markets, fueled by accelerating growth and an accommodating Federal Reserve, enjoyed a prosperous year in 2014. However, most of 2015 has been volatile.
Economic and global factors, such as the continued conflict in the Middle East, a sharp decline in oil prices and terrorism around the world, have impacted U.S. and global markets. Another factor that has weighed upon U.S.
markets for most of the year is the fact that many economists had predicted that the Federal Reserve would begin to raise interest rates in 2015, which has still not happened. As I have written previously, First Trust believes investors should maintain perspective about the markets and have realistic expectations about their investments. Markets will always go up and down, but we believe that having a long-term investment horizon and being invested in quality products can help you reach your goals. Thank you for giving First Trust the opportunity to be a part of your investment plan. We value the relationship and will continue to focus on our disciplined investment approach and long-term perspective to help investors reach their financial goals. Sincerely, James A.
Bowen Chairman of the Board of Trustees Chief Executive Officer of First Trust Advisors L.P. Page 1 . Fund Performance Overview (Unaudited) First Trust Long/Short Equity ETF (FTLS) The investment objective of First Trust Long/Short Equity ETF (the “Fund”) is to seek to provide investors with long-term total return. The Fund pursues its objective by establishing long and short positions in a portfolio of Equity Securities (as defined below). Under normal circumstances, at least 80% of the Fund’s net assets (plus the amount of any borrowing for investment purposes) will be exposed to U.S. exchange-listed equity securities of U.S. and foreign companies by investing in such securities directly and/or in U.S.
exchange-traded funds (“ETFs”) that provide exposure to such securities. The securities of the companies and ETFs in which the Fund will invest are referred to collectively as “Equity Securities.” The Equity Securities held by the Fund may include U.S. exchange-listed equity securities of foreign issuers, as well as investments in the equity securities of foreign issuers that are in the form of depositary receipts. The Fund takes long and short positions in Equity Securities. As opposed to taking long positions in which an investor seeks to profit from increases in the price of a security, short selling is a technique that will be used by the Fund to try and profit from the falling price of a security.
Short selling involves selling a security that has been borrowed from a third party with the intention of buying an identical security back at a later date to return to that third party. Having both long and short positions in an equity security portfolio is a common way to create returns that are independent of market moves. One advantage of a long and short portfolio is that the long and short positions may offset one another in a manner that results in a lower net exposure to the direction of the market. In addition, cash balances arising from the use of short selling typically will be held in money market instruments. Performance Average Annual Total Returns 1 Year Ended 10/31/15 Fund Performance NAV Market Price Index Performance S&P 500® Index Cumulative Total Returns Inception (9/8/14) to 10/31/15 Inception (9/8/14) to 10/31/15 7.60% 7.59% 8.33% 8.45% 9.60% 9.73% 5.20% 5.49% 6.31% Total returns for the period since inception are calculated from the inception date of the Fund.
“Average Annual Total Returns” represent the average annual change in value of an investment over the periods indicated. “Cumulative Total Returns” represent the total change in value of an investment over the period indicated. The Fund’s per share net asset value (“NAV”) is the value of one share of the Fund and is computed by dividing the value of all assets of the Fund (including accrued interest and dividends), less all liabilities (including accrued expenses and dividends declared but unpaid), by the total number of outstanding shares. The price used to calculate market return (“Market Price”) is determined by using the midpoint between the highest bid and the lowest offer on the stock exchange on which shares of the Fund are listed for trading as of the time that the Fund’s NAV is calculated.
Since shares of the Fund did not trade in the secondary market until after its inception, for the period from inception to the first day of secondary market trading in shares of the Fund, the NAV of the Fund is used as a proxy for the secondary market trading price to calculate market returns. NAV and market price returns assume that all distributions have been reinvested in the Fund at NAV and Market Price, respectively. An index is a statistical composite that tracks a specified financial market or sector. Unlike the Fund, the index does not actually hold a portfolio of securities and therefore does not incur the expenses incurred by the Fund.
These expenses negatively impact the performance of the Fund. Also, market returns do not include brokerage commissions that may be payable on secondary market transactions. If brokerage commissions were included, market returns would be lower.
The total returns presented reflect the reinvestment of dividends on securities in the index. The returns presented do not reflect the deduction of taxes that a shareholder would pay on Fund distributions or the redemption or sale of Fund shares. The investment return and principal value of shares of the Fund will vary with changes in market conditions.
Shares of the Fund may be worth more or less than their original cost when they are redeemed or sold in the market. The Fund’s past performance is no guarantee of future performance. Page 2 . Fund Performance Overview (Unaudited) (Continued) First Trust Long/Short Equity ETF (FTLS) Portfolio Sector Allocation Consumer Discretionary Consumer Staples Energy Financials Health Care Industrials Information Technology Materials Telecommunication Services Utilities Total Long-Term Investments 12.0% 13.4 10.4 10.6 15.5 11.0 20.7 3.2 2.8 0.4 ________ 100.0% ________ ________ Top Ten Long-Term Investments Apple, Inc. Exxon Mobil Corp. Intel Corp. AutoZone, Inc. Clorox (The) Co. Accenture PLC, Class A Johnson & Johnson. Unliver NV Republic Services, Inc. United Parcel Service, Inc; Class B Total % of Net Assets 4.1% 2.4 2.3 2.1 2.1 2.0 2.0 2.0 2.0 2.0 ________ 23.0% ________ ________ Top Ten Investments Sold Short Portfolio Sector Allocation Consumer Discretionary Consumer Staples Energy Financials Health Care Industrials Information Technology Materials Telecommunication Services Total Investments Sold Short 8.3% 9.6 6.8 42.5 9.6 8.6 7.4 5.8 1.4 ________ 100.0% ________ ________ % of Net Assets SPDR S&P 500 ETF Trust iShares Russell 2000 ETF iShares Core S&P 500 ETF Reynolds American, Inc. ConocoPhillips Synder’s-Lance, Inc. Walt Disney (The) Co. Ecolab, Inc. Coca-Cola (The) Co. Kellogg Co. Total -6.0% -1.9 -0.9 -0.5 -0.4 -0.4 -0.4 -0.4 -0.4 -0.4 ________ -11.7% ________ ________ Page 3 . Fund Performance Overview (Unaudited) (Continued) First Trust Long/Short Equity ETF (FTLS) Performance of a $10,000 Initial Investment September 8, 2014 - October 31, 2015 $11,500 $11,000 $10,960 $10,631 $10,500 $10,000 $9,500 $9,000 9/8/14 10/31/14 4/30/15 First Trust Long/Short Equity ETF S&P 500® Index 10/31/15 Performance figures assume reinvestment of all distributions and do not reflect the deduction of taxes that a shareholder would pay on Fund distributions or the redemption or sale of Fund shares. An index is a statistical composite that tracks a specified financial market or sector. Unlike the Fund, the index does not actually hold a portfolio of securities and therefore does not incur the expenses incurred by the Fund. These expenses negatively impact the performance of the Fund. The Fund’s past performance does not predict future performance. Frequency Distribution of Discounts and Premiums Bid/Ask Midpoint vs.
NAV through October 31, 2015 The following Frequency Distribution of Discounts and Premiums charts are provided to show the frequency at which the bid/ask midpoint price for the Fund was at a discount or premium to the daily NAV. The following tables are for comparative purposes only and represent the period September 9, 2014 (commencement of trading) through October 31, 2015. Shareholders may pay more than NAV when they buy Fund shares and receive less than NAV when they sell those shares because shares are bought and sold at current market price.
Data presented represents past performance and cannot be used to predict future results. For the Period 9/9/14 - 10/31/14 11/1/14 - 10/31/15 Number of Days Bid/Ask Midpoint At/Above NAV 0.00%-0.49% 0.50%-0.99% 1.00%-1.99% 23 3 0 190 7 0 >=2.00% 0 1 For the Period 9/9/14 - 10/31/14 11/1/14 - 10/31/15 Number of Days Bid/Ask Midpoint Below NAV 0.00%-0.49% 0.50%-0.99% 1.00%-1.99% 9 4 0 41 12 0 >=2.00% 0 0 Page 4 . Portfolio Commentary First Trust Long/Short Equity ETF (FTLS) Annual Report October 31, 2015 Investment Manager The First Trust Advisors L.P. (“First Trust”) Alternatives Investment team was formed in July of 2011 and is headed by John Gambla, CFA, FRM, PRM and Rob Guttschow, CFA. Prior to joining First Trust, Messrs. Gambla and Guttschow were Co-Chief Investment Officers at Nuveen Hyde Park, a quantitative money manager.
The team focuses on systematic and disciplined strategies using a variety of statistical techniques along with a fundamental overlay based upon their combined 40+ years of investment experience. Currently the team manages/consults for a variety of portfolios structured as exchanged-traded funds and separately managed accounts in the United States, Canada, and Mexico. Portfolio Management Team John Gambla – CFA, FRM, PRM, Senior Portfolio Manager of First Trust, FTA-Alternatives & Active Management Team Rob Guttschow – CFA, Senior Portfolio Manager of First Trust, FTA-Alternatives & Active Management Team Commentary First Trust Long/Short Equity ETF The First Trust Long/Short Equity ETF (the “Fund” or “FTLS”) is an actively managed exchange-traded fund. The Fund’s investment objective is to seek to provide investors with long-term total return.
The Fund intends to pursue its investment objective by establishing long and short positions in a portfolio of Equity Securities. Under normal circumstances, at least 80% of the Fund’s net assets (plus the amount of any borrowing for investment purposes) will be exposed to U.S. exchange-listed equity securities of U.S.
and non-U.S. companies by investing in such securities directly and/or in U.S. exchange-traded funds (“ETFs”) that provide exposure to such securities. Overall Market Recap U.S. economic growth remained solid during the fiscal period from October 31, 2014 to October 31, 2015.
During the period, U.S. GDP as reported on September 30, 2015 grew by an estimated 2.0% with the headline U.S. unemployment rate falling in tandem, dropping from 5.7% in October of 2014 to 5.0% in October of 2015.
The total number of new non-farm payroll jobs created during the fiscal period was estimated at 2.8 million, or approximately 234,000 per month. The overall steady performance of the U.S. economy and the declining unemployment rate translated into modest gains for the S&P 500® Index, up 5.20% during the fiscal period. Interest rates, as measured by the U.S.
Government 10-Year Treasury, actually fell during the fiscal period with rates falling by 0.19%, ending the period at 2.14%. The Federal Open Market Committee (“FOMC”) left rates unchanged throughout the year, as global economic concerns weighed heavily on potential future U.S. growth.
In the early portion of the fiscal period, a collapse in the price of oil and a simultaneous rally in the U.S. dollar created deflationary pressures in the global economy and economic headwinds for U.S. exports.
Shortly thereafter the Greek debt restructuring process took several unexpected twists and turns, which created market uncertainty in Europe and further boosted the U.S. dollar rally. Finally, near the end of the fiscal period, China’s economy along with a variety of other emerging market economies appeared to be slowing quickly, resulting in more global growth uncertainty. Fund Performance – FTLS The Fund returned 7.59% on a market price basis and 7.60% on a net asset value (“NAV”) basis for the period from October 31, 2014 through October 31, 2015.
The Fund’s benchmark, the S&P 500® Index (“Benchmark”) returned 5.20% during the fiscal period. The fund’s investment process involves constructing both a long and short portfolio consisting of at least 80% in U.S. exchange-listed equity securities of U.S. and foreign companies such as common stocks and ETFs.
The portfolio management team follows a systematic portfolio construction process designed to balance the drivers of risk and return that exist between the long and short positions. The investment process uses Sabrient/Gradient’s EQR model ranking as an input to determine holdings, both long and short. Additional proprietary research is used to build the portfolio and to tactically manage both the overall percentage and composition of the long and short exposures in the portfolio. For the fiscal period, the Fund returned 7.60% on an NAV basis, outperforming its Benchmark by 2.40% net of all Fund fees.
The Fund’s net equity exposure varied between 70% and 80%, with the long positions being held at a fully invested position of approximately 100% and short positions varying between 20% and 30%. The Fund’s overall outperformance versus its Benchmark Page 5 . Portfolio Commentary (Continued) First Trust Long/Short Equity ETF (FTLS) Annual Report October 31, 2015 was the result of both the long and short positions adding value during the period. The long portfolio in aggregate substantially outperformed the Benchmark during the period and the shorts, in addition to reducing the overall market sensitivity of the portfolio and thereby reducing the overall volatility of the Fund, also added value by posting a negative total return during the performance period. The best performing relative sector exposures for the Fund for the fiscal period ended October 31, 2015 were the Energy and Industrials sector where the Fund was, on average, underweight the Benchmark during the year. The worst performing relative sector exposures for the Fund during the period were the Consumer Discretionary and Financials sectors, where the Fund was, on average, underweight the Benchmark. Market and Fund Outlook Today, we believe the Fund is well positioned to achieve its investment objective of seeking to provide investors with long-term total return.
The Fund is invested in a broad array of U.S. equity securities with a net market exposure of approximately 70% versus its unmanaged Benchmark’s exposure of 100%. We believe the Fund’s combination of a broadly diversified portfolio, which is long high quality stocks and short low quality stocks, as measured by an earnings quality model, positions the Fund well to continue to achieve its investment objective going forward. Page 6 .
First Trust Long/Short Equity ETF (FTLS) Understanding Your Fund Expenses October 31, 2015 (Unaudited) As a shareholder of First Trust Long/Short Equity ETF (the “Fund”) you incur two types of costs: (1) transaction costs; and (2) ongoing costs, including management fees, distribution and/or service fees, if any, and other Fund expenses. This Example is intended to help you understand your ongoing costs of investing in the Fund and to compare these costs with the ongoing costs of investing in other funds. The Example is based on an investment of $1,000 invested at the beginning of the period and held through the six-month period ended October 31, 2015. Actual Expenses The first line in the following table provides information about actual account values and actual expenses. You may use the information in this line, together with the amount you invested, to estimate the expenses that you paid over the period. Simply divide your account value by $1,000 (for example, an $8,600 account value divided by $1,000 = 8.6), then multiply the result by the number in the first line under the heading entitled “Expenses Paid During the Six-Month Period” to estimate the expenses you paid on your account during this six-month period. Hypothetical Example for Comparison Purposes The second line in the following table provides information about hypothetical account values and hypothetical expenses based on the Fund’s actual expense ratio and an assumed rate of return of 5% per year before expenses, which is not the Fund’s actual return.
The hypothetical account values and expenses may not be used to estimate the actual ending account balance or expenses you paid for the period. You may use this information to compare the ongoing costs of investing in the Fund and other funds. To do so, compare this 5% hypothetical example with the 5% hypothetical examples that appear in the shareholder reports of the other funds. Please note that the expenses shown in the table are meant to highlight your ongoing costs only and do not reflect any transactional costs such as brokerage commissions.
Therefore, the second line in the table is useful in comparing ongoing costs only, and will not help you determine the relative total costs of owning different funds. In addition, if these transactional costs were included, your costs would have been higher. Beginning Account Value May 1, 2015 First Trust Long/Short Equity ETF Actual Hypothetical (5% return before expenses) Ending Account Value October 31, 2015 Annualized Expense Ratio Based on the Six-Month Period $1,000.00 $1,000.00 $1,006.00 $1,017.85 1.46% 1.46% Expenses Paid During the Six-Month Period (a) $7.38 $7.43 (a) Expenses are equal to the annualized expense ratio as indicated in the table, multiplied by the average account value over the period (May 1, 2015 through October 31, 2015), multiplied by 184/365. Hypothetical expenses are assumed for the most recent half-year period. Page 7 .
First Trust Long/Short Equity ETF (FTLS) Portfolio of Investments October 31, 2015 Shares _______________ Description ___________________________________________________________________________________________________________________________________ COMMON STOCKS – 90.4% Aerospace & Defense – 1.0% 2,242 Boeing (The) Co. (a) . . .
. . .
. . .
. . .
. . .
. . .
. . .
. . .
. . .
. . .
. . .
. . .
. . .
. . .
. . .
. . .
. . .
. . .
. . .
. . .
. . .
. . .
. Air Freight & Logistics – 2.0% 6,322 United Parcel Service, Inc., Class B (a) . . .
. . .
. . .
. . .
. . .
. . .
. . .
. . .
. . .
. . .
. . .
. . .
. . .
. . .
. . .
. . .
. . .
. Airlines – 3.3% 5,677 Alaska Air Group, Inc. (a) . .
. . .
. . .
. . .
. . .
. . .
. . .
. . .
. . .
. . .
. . .
. . .
. . .
. . .
. . .
. . .
. . .
. . .
. . .
. . .
. . .
. 5,495 JetBlue Airways Corp. (b) . .
. . .
. . .
. . .
. . .
. . .
. . .
. . .
. . .
. . .
. . .
. . .
. . .
. . .
. . .
. . .
. . .
. . .
. . .
. . .
. . .
. 2,121 Ryanair Holdings PLC . . .
. . .
. . .
. . .
. . .
. . .
. . .
. . .
. . .
. . .
. . .
. . .
. . .
. . .
. . .
. . .
. . .
. . .
. . .
. . .
. . .
. . . 9,261 Virgin America, Inc.
(b) . . .
. . .
. . .
. . .
. . .
. . .
. . .
. . .
. . .
. . .
. . .
. . .
. . .
. . .
. . .
. . .
. . .
. . .
. . .
. . .
. . .
. . 19,657 11,661 2,815 3,737 7,657 10,660 8,841 13,126 Auto Components – 0.4% Tower International, Inc. .
. . .
. . .
. . .
. . .
. . .
. . .
. . .
. . .
. . .
. . .
. . .
. . .
. . .
. . .
. . .
. . .
. . .
. . .
. . .
. . .
. . . Banks – 7.4% Banco Santander S.A., ADR .
. . .
. . .
. . .
. . .
. . .
. . .
. . .
. . .
. . .
. . .
. . .
. . .
. . .
. . .
. . .
. . .
. . .
. . .
. . .
. . . Barclays PLC, ADR .
. . .
. . .
. . .
. . .
. . .
. . .
. . .
. . .
. . .
. . .
. . .
. . .
. . .
. . .
. . .
. . .
. . .
. . .
. . .
. . .
. . .
. . .
. CIT Group, Inc. (a) . .
. . .
. . .
. . .
. . .
. . .
. . .
. . .
. . .
. . .
. . .
. . .
. . .
. . .
. . .
. . .
. . .
. . .
. . .
. . .
. . .
. . .
. . .
. Citigroup, Inc. (a) . .
. . .
. . .
. . .
. . .
. . .
. . .
. . .
. . .
. . .
. . .
. . .
. . .
. . .
. . .
. . .
. . .
. . .
. . .
. . .
. . .
. . .
. . .
. . FCB Financial Holdings, Inc. (b) .
. . .
. . .
. . .
. . .
. . .
. . .
. . .
. . .
. . .
. . .
. . .
. . .
. . .
. . .
. . .
. . .
. . .
. . .
. . HSBC Holdings PLC, ADR (a) . .
. . .
. . .
. . .
. . .
. . .
. . .
. . .
. . .
. . .
. . .
. . .
. . .
. . .
. . .
. . .
. . .
. . .
. . .
. . . JPMorgan Chase & Co.
(a) . . .
. . .
. . .
. . .
. . .
. . .
. . .
. . .
. . .
. . .
. . .
. . .
. . .
. . .
. . .
. . .
. . .
. . .
. . .
. . .
. . U.S. Bancorp (a) .
. . .
. . .
. . .
. . .
. . .
. . .
. . .
. . .
. . .
. . .
. . .
. . .
. . .
. . .
. . .
. . .
. . .
. . .
. . .
. . .
. . .
. . .
. . .
. 2,321 3,975 6,179 22,262 10,819 Biotechnology – 3.4% Amgen, Inc. (a) . .
. . .
. . .
. . .
. . .
. . .
. . .
. . .
. . .
. . .
. . .
. . .
. . .
. . .
. . .
. . .
. . .
. . .
. . .
. . .
. . .
. . .
. . .
. . .
. Gilead Sciences, Inc. (a) . .
. . .
. . .
. . .
. . .
. . .
. . .
. . .
. . .
. . .
. . .
. . .
. . .
. . .
. . .
. . .
. . .
. . .
. . .
. . .
. . .
. . Halozyme Therapeutics, Inc. (b) .
. . .
. . .
. . .
. . .
. . .
. . .
. . .
. . .
. . .
. . .
. . .
. . .
. . .
. . .
. . .
. . .
. . .
. . .
. . . PDL BioPharma, Inc.
. . .
. . .
. . .
. . .
. . .
. . .
. . .
. . .
. . .
. . .
. . .
. . .
. . .
. . .
. . .
. . .
. . .
. . .
. . .
. . .
. . .
. . .
. Vanda Pharmaceuticals, Inc. (b) . .
. . .
. . .
. . .
. . .
. . .
. . .
. . .
. . .
. . .
. . .
. . .
. . .
. . .
. . .
. . .
. . .
. . .
. . .
. . 5,741 2,062 Building Products – 1.0% Masco Corp. .
. . .
. . .
. . .
. . .
. . .
. . .
. . .
. . .
. . .
. . .
. . .
. . .
. . .
. . .
. . .
. . .
. . .
. . .
. . .
. . .
. . .
. . .
. . .
. . .
. Universal Forest Products, Inc. . .
. . .
. . .
. . .
. . .
. . .
. . .
. . .
. . .
. . .
. . .
. . .
. . .
. . .
. . .
. . .
. . .
. . .
. . .
. . . 2,904 1,464 Chemicals – 0.9% Dow Chemical (The) Co.
. . .
. . .
. . .
. . .
. . .
. . .
. . .
. . .
. . .
. . .
. . .
. . .
. . .
. . .
. . .
. . .
. . .
. . .
. . .
. . .
. . .
. LyondellBasell Industries NV (a) . . .
. . .
. . .
. . .
. . .
. . .
. . .
. . .
. . .
. . .
. . .
. . .
. . .
. . .
. . .
. . .
. . .
. . .
. . . 4,924 Value ___________________ $ 331,973 ___________________ 651,292 ___________________ 432,871 136,496 165,841 329,784 ___________________ 1,064,992 ___________________ 135,262 ___________________ 108,900 165,936 121,045 198,696 272,283 416,486 568,034 553,655 ___________________ 2,405,035 ___________________ 367,136 429,817 96,701 101,960 116,196 ___________________ 1,111,810 ___________________ 166,489 149,763 ___________________ 316,252 ___________________ 150,050 136,020 ___________________ 286,070 ___________________ 15,040 2,617 8,884 3,517 12,559 Page 8 Commercial Services & Supplies – 2.0% Republic Services, Inc.
(a) . . .
. . .
. . .
. . .
. . .
. . .
. . .
. . .
. . .
. . .
. . .
. . .
. . .
. . .
. . .
. . .
. . .
. . .
. . .
. . .
. . . Consumer Finance – 0.6% Capital One Financial Corp.
. . .
. . .
. . .
. . .
. . .
. . .
. . .
. . .
. . .
. . .
. . .
. . .
. . .
. . .
. . .
. . .
. . .
. . .
. . .
. . .
. Containers & Packaging – 0.4% Graphic Packaging Holding Co. (a) . .
. . .
. . .
. . .
. . .
. . .
. . .
. . .
. . .
. . .
. . .
. . .
. . .
. . .
. . .
. . .
. . .
. . .
. . Diversified Consumer Services – 1.7% 2U, Inc. (b) .
. . .
. . .
. . .
. . .
. . .
. . .
. . .
. . .
. . .
. . .
. . .
. . .
. . .
. . .
. . .
. . .
. . .
. . .
. . .
. . .
. . .
. . .
. . .
. . .
. . H&R Block, Inc. .
. . .
. . .
. . .
. . .
. . .
. . .
. . .
. . .
. . .
. . .
. . .
. . .
. . .
. . .
. . .
. . .
. . .
. . .
. . .
. . .
. . .
. . .
. . . See Notes to Financial Statements 657,850 ___________________ 206,481 ___________________ 125,797 ___________________ 73,787 467,948 ___________________ 541,735 ___________________ .
First Trust Long/Short Equity ETF (FTLS) Portfolio of Investments (Continued) October 31, 2015 Shares _______________ Description ___________________________________________________________________________________________________________________________________ COMMON STOCKS (Continued) Diversified Telecommunication Services – 1.0% 2,657 Atlantic Tele-Network, Inc. . . .
. . .
. . .
. . .
. . .
. . .
. . .
. . .
. . .
. . .
. . .
. . .
. . .
. . .
. . .
. . .
. . .
. . .
. . .
. . .
. . 4,665 Centurylink, Inc. (a) .
. . .
. . .
. . .
. . .
. . .
. . .
. . .
. . .
. . .
. . .
. . .
. . .
. . .
. . .
. . .
. . .
. . .
. . .
. . .
. . .
. . .
. . .
. 4,497 899 2,541 5,075 Food & Staples Retailing – 3.2% Casey’s General Stores, Inc. . .
. . .
. . .
. . .
. . .
. . .
. . .
. . .
. . .
. . .
. . .
. . .
. . .
. . .
. . .
. . .
. . .
. . .
. . .
. . .
. . Costco Wholesale Corp. (a) .
. . .
. . .
. . .
. . .
. . .
. . .
. . .
. . .
. . .
. . .
. . .
. . .
. . .
. . .
. . .
. . .
. . .
. . .
. . .
. . .
. Ingles Markets, Inc. . .
. . .
. . .
. . .
. . .
. . .
. . .
. . .
. . .
. . .
. . .
. . .
. . .
. . .
. . .
. . .
. . .
. . .
. . .
. . .
. . .
. . .
. . . Wal-Mart Stores, Inc.
(a) . . .
. . .
. . .
. . .
. . .
. . .
. . .
. . .
. . .
. . .
. . .
. . .
. . .
. . .
. . .
. . .
. . .
. . .
. . .
. . .
. . .
. 10,462 3,125 5,744 2,841 3,083 Food Products – 3.4% Campbell Soup Co. . .
. . .
. . .
. . .
. . .
. . .
. . .
. . .
. . .
. . .
. . .
. . .
. . .
. . .
. . .
. . .
. . .
. . .
. . .
. . .
. . .
. . .
. . . Hormel Foods Corp.
(a) . . .
. . .
. . .
. . .
. . .
. . .
. . .
. . .
. . .
. . .
. . .
. . .
. . .
. . .
. . .
. . .
. . .
. . .
. . .
. . .
. . .
. . Pilgrim’s Pride Corp. (a) .
. . .
. . .
. . .
. . .
. . .
. . .
. . .
. . .
. . .
. . .
. . .
. . .
. . .
. . .
. . .
. . .
. . .
. . .
. . .
. . .
. . . Pinnacle Foods, Inc.
(a) . . .
. . .
. . .
. . .
. . .
. . .
. . .
. . .
. . .
. . .
. . .
. . .
. . .
. . .
. . .
. . .
. . .
. . .
. . .
. . .
. . .
. . Tyson Foods, Inc., Class A . .
. . .
. . .
. . .
. . .
. . .
. . .
. . .
. . .
. . .
. . .
. . .
. . .
. . .
. . .
. . .
. . .
. . .
. . .
. . .
. . . 1,116 1,375 Health Care Equipment & Supplies – 1.0% C.R.
Bard, Inc. . .
. . .
. . .
. . .
. . .
. . .
. . .
. . .
. . .
. . .
. . .
. . .
. . .
. . .
. . .
. . .
. . .
. . .
. . .
. . .
. . .
. . .
. . .
. . .
. DexCom, Inc. (b) . .
. . .
. . .
. . .
. . .
. . .
. . .
. . .
. . .
. . .
. . .
. . .
. . .
. . .
. . .
. . .
. . .
. . .
. . .
. . .
. . .
. . .
. . .
. . 4,521 2,245 1,895 2,737 1,817 Health Care Providers & Services – 3.2% Amsurg Corp. (a) (b) .
. . .
. . .
. . .
. . .
. . .
. . .
. . .
. . .
. . .
. . .
. . .
. . .
. . .
. . .
. . .
. . .
. . .
. . .
. . .
. . .
. . .
. . . Cardinal Health, Inc.
. . .
. . .
. . .
. . .
. . .
. . .
. . .
. . .
. . .
. . .
. . .
. . .
. . .
. . .
. . .
. . .
. . .
. . .
. . .
. . .
. . .
. . .
. Chemed Corp. . .
. . .
. . .
. . .
. . .
. . .
. . .
. . .
. . .
. . .
. . .
. . .
. . .
. . .
. . .
. . .
. . .
. . .
. . .
. . .
. . .
. . .
. . .
. . .
. . LHC Group, Inc. (b) .
. . .
. . .
. . .
. . .
. . .
. . .
. . .
. . .
. . .
. . .
. . .
. . .
. . .
. . .
. . .
. . .
. . .
. . .
. . .
. . .
. . .
. . .
. Molina Healthcare, Inc. (b) . .
. . .
. . .
. . .
. . .
. . .
. . .
. . .
. . .
. . .
. . .
. . .
. . .
. . .
. . .
. . .
. . .
. . .
. . .
. . .
. . . 3,439 3,218 Hotels, Restaurants & Leisure – 1.0% Brinker International, Inc.
. . .
. . .
. . .
. . .
. . .
. . .
. . .
. . .
. . .
. . .
. . .
. . .
. . .
. . .
. . .
. . .
. . .
. . .
. . .
. . .
. . . Las Vegas Sands Corp.
. . .
. . .
. . .
. . .
. . .
. . .
. . .
. . .
. . .
. . .
. . .
. . .
. . .
. . .
. . .
. . .
. . .
. . .
. . .
. . .
. . .
. . . Value ___________________ $ 203,048 131,600 ___________________ 334,648 ___________________ 477,671 142,150 126,898 290,493 ___________________ 1,037,212 ___________________ 531,365 211,094 109,078 125,231 136,762 ___________________ 1,113,530 ___________________ 207,967 114,565 ___________________ 322,532 ___________________ 316,877 184,539 298,064 123,343 112,654 ___________________ 1,035,477 ___________________ 156,509 159,323 ___________________ 315,832 ___________________ 4,315 3,199 101 Household Products – 2.1% Clorox (The) Co.
. . .
. . .
. . .
. . .
. . .
. . .
. . .
. . .
. . .
. . .
. . .
. . .
. . .
. . .
. . .
. . .
. . .
. . .
. . .
. . .
. . .
. . .
. . .
. Internet & Catalog Retail – 1.2% Liberty Media Corp. – Interactive, Class A (a) (b) . .
. . .
. . .
. . .
. . .
. . .
. . .
. . .
. . .
. . .
. . .
. . .
. . .
. . .
. . . Liberty Ventures, Series A (a) (b) .
. . .
. . .
. . .
. . .
. . .
. . .
. . .
. . .
. . .
. . .
. . .
. . .
. . .
. . .
. . .
. . .
. . .
. . .
. . priceline.com, Inc. (a) (b) .
. . .
. . .
. . .
. . .
. . .
. . .
. . .
. . .
. . .
. . .
. . .
. . .
. . .
. . .
. . .
. . .
. . .
. . .
. . .
. . .
. . . 740 755 3,345 20,541 5,044 Internet Software & Services – 6.6% Alphabet, Inc., Class A (b) .
. . .
. . .
. . .
. . .
. . .
. . .
. . .
. . .
. . .
. . .
. . .
. . .
. . .
. . .
. . .
. . .
. . .
. . .
. . .
. . .
. . Alphabet, Inc., Class C (b) . .
. . .
. . .
. . .
. . .
. . .
. . .
. . .
. . .
. . .
. . .
. . .
. . .
. . .
. . .
. . .
. . .
. . .
. . .
. . .
. . .
. Benefitfocus, Inc. (b) . .
. . .
. . .
. . .
. . .
. . .
. . .
. . .
. . .
. . .
. . .
. . .
. . .
. . .
. . .
. . .
. . .
. . .
. . .
. . .
. . .
. . .
. . eBay, Inc. (a) (b) .
. . .
. . .
. . .
. . .
. . .
. . .
. . .
. . .
. . .
. . .
. . .
. . .
. . .
. . .
. . .
. . .
. . .
. . .
. . .
. . .
. . .
. . .
. . .
. VeriSign, Inc. (a) (b) . .
. . .
. . .
. . .
. . .
. . .
. . .
. . .
. . .
. . .
. . .
. . .
. . .
. . .
. . .
. . .
. . .
. . .
. . .
. . .
. . .
. . .
. . . 5,545 See Notes to Financial Statements 676,157 ___________________ 118,102 139,380 146,878 ___________________ 404,360 ___________________ 545,669 536,662 106,906 573,094 406,546 ___________________ 2,168,877 ___________________ Page 9 .
First Trust Long/Short Equity ETF (FTLS) Portfolio of Investments (Continued) October 31, 2015 Shares _______________ Description ___________________________________________________________________________________________________________________________________ COMMON STOCKS (Continued) IT Services – 2.9% 6,224 Accenture PLC, Class A (a) . . . .
. . .
. . .
. . .
. . .
. . .
. . .
. . .
. . .
. . .
. . .
. . .
. . .
. . .
. . .
. . .
. . .
. . .
. . .
. . .
. 1,135 Global Payments, Inc. (a) . .
. . .
. . .
. . .
. . .
. . .
. . .
. . .
. . .
. . .
. . .
. . .
. . .
. . .
. . .
. . .
. . .
. . .
. . .
. . .
. . .
. . 1,762 Visa, Inc., Class A (a) . .
. . .
. . .
. . .
. . .
. . .
. . .
. . .
. . .
. . .
. . .
. . .
. . .
. . .
. . .
. . .
. . .
. . .
. . .
. . .
. . .
. . .
. . 2,940 2,400 1,546 8,465 2,915 9,323 6,966 3,819 1,378 1,824 8,364 14,663 6,544 2,404 6,315 11,416 2,720 Life Sciences Tools & Services – 0.4% INC Research Holdings, Inc. (b) .
. . .
. . .
. . .
. . .
. . .
. . .
. . .
. . .
. . .
. . .
. . .
. . .
. . .
. . .
. . .
. . .
. . .
. . .
. . . Machinery – 0.4% AGCO Corp.
. . .
. . .
. . .
. . .
. . .
. . .
. . .
. . .
. . .
. . .
. . .
. . .
. . .
. . .
. . .
. . .
. . .
. . .
. . .
. . .
. . .
. . .
. . .
. . .
. . Metals & Mining – 0.8% Kaiser Aluminum Corp. .
. . .
. . .
. . .
. . .
. . .
. . .
. . .
. . .
. . .
. . .
. . .
. . .
. . .
. . .
. . .
. . .
. . .
. . .
. . .
. . .
. . .
. Ternium S.A., ADR (a) . . .
. . .
. . .
. . .
. . .
. . .
. . .
. . .
. . .
. . .
. . .
. . .
. . .
. . .
. . .
. . .
. . .
. . .
. . .
. . .
. . .
. . Multiline Retail – 0.7% Target Corp. .
. . .
. . .
. . .
. . .
. . .
. . .
. . .
. . .
. . .
. . .
. . .
. . .
. . .
. . .
. . .
. . .
. . .
. . .
. . .
. . .
. . .
. . .
. . .
. . .
. Oil, Gas & Consumable Fuels – 6.5% Exxon Mobil Corp. (a) . .
. . .
. . .
. . .
. . .
. . .
. . .
. . .
. . .
. . .
. . .
. . .
. . .
. . .
. . .
. . .
. . .
. . .
. . .
. . .
. . .
. . .
. Marathon Petroleum Corp. . .
. . .
. . .
. . .
. . .
. . .
. . .
. . .
. . .
. . .
. . .
. . .
. . .
. . .
. . .
. . .
. . .
. . .
. . .
. . .
. . .
. PBF Energy, Inc. (a) . .
. . .
. . .
. . .
. . .
. . .
. . .
. . .
. . .
. . .
. . .
. . .
. . .
. . .
. . .
. . .
. . .
. . .
. . .
. . .
. . .
. . .
. . . PetroChina Co., Ltd., ADR (a) .
. . .
. . .
. . .
. . .
. . .
. . .
. . .
. . .
. . .
. . .
. . .
. . .
. . .
. . .
. . .
. . .
. . .
. . .
. . .
. Tesoro Corp. . .
. . .
. . .
. . .
. . .
. . .
. . .
. . .
. . .
. . .
. . .
. . .
. . .
. . .
. . .
. . .
. . .
. . .
. . .
. . .
. . .
. . .
. . .
. . .
. . . Valero Energy Corp.
(a) . . .
. . .
. . .
. . .
. . .
. . .
. . .
. . .
. . .
. . .
. . .
. . .
. . .
. . .
. . .
. . .
. . .
. . .
. . .
. . .
. . .
. . Personal Products – 2.0% Unilever NV . .
. . .
. . .
. . .
. . .
. . .
. . .
. . .
. . .
. . .
. . .
. . .
. . .
. . .
. . .
. . .
. . .
. . .
. . .
. . .
. . .
. . .
. . .
. . .
. . . Pharmaceuticals – 7.3% Johnson & Johnson (a) .
. . .
. . .
. . .
. . .
. . .
. . .
. . .
. . .
. . .
. . .
. . .
. . .
. . .
. . .
. . .
. . .
. . .
. . .
. . .
. . .
. . .
. . Merck & Co., Inc. .
. . .
. . .
. . .
. . .
. . .
. . .
. . .
. . .
. . .
. . .
. . .
. . .
. . .
. . .
. . .
. . .
. . .
. . .
. . .
. . .
. . .
. . .
. . Novartis AG, ADR (a) . .
. . .
. . .
. . .
. . .
. . .
. . .
. . .
. . .
. . .
. . .
. . .
. . .
. . .
. . .
. . .
. . .
. . .
. . .
. . .
. . .
. . .
. Novo Nordisk A/S, ADR (a) . . .
. . .
. . .
. . .
. . .
. . .
. . .
. . .
. . .
. . .
. . .
. . .
. . .
. . .
. . .
. . .
. . .
. . .
. . .
. . .
. Taro Pharmaceutical Industries Ltd. (b) . .
. . .
. . .
. . .
. . .
. . .
. . .
. . .
. . .
. . .
. . .
. . .
. . .
. . .
. . .
. . .
. . .
. . 4,876 22,222 8,296 Professional Services – 0.4% Insperity, Inc. (a) .
. . .
. . .
. . .
. . .
. . .
. . .
. . .
. . .
. . .
. . .
. . .
. . .
. . .
. . .
. . .
. . .
. . .
. . .
. . .
. . .
. . .
. . .
. . . Semiconductors & Semiconductor Equipment – 3.4% Advanced Energy Industries, Inc.
(b) . . .
. . .
. . .
. . .
. . .
. . .
. . .
. . .
. . .
. . .
. . .
. . .
. . .
. . .
. . .
. . .
. . .
. . . Intel Corp.
(a) . . .
. . .
. . .
. . .
. . .
. . .
. . .
. . .
. . .
. . .
. . .
. . .
. . .
. . .
. . .
. . .
. . .
. . .
. . .
. . .
. . .
. . .
. . .
. . .
. NVIDIA Corp. (a) . .
. . .
. . .
. . .
. . .
. . .
. . .
. . .
. . .
. . .
. . .
. . .
. . .
. . .
. . .
. . .
. . .
. . .
. . .
. . .
. . .
. . .
. . .
. 18,235 7,624 1,383 1,780 8,476 1,902 Software – 2.8% A10 Networks, Inc. (b) . .
. . .
. . .
. . .
. . .
. . .
. . .
. . .
. . .
. . .
. . .
. . .
. . .
. . .
. . .
. . .
. . .
. . .
. . .
. . .
. . .
. . . Activision Blizzard, Inc.
(a) . . .
. . .
. . .
. . .
. . .
. . .
. . .
. . .
. . .
. . .
. . .
. . .
. . .
. . .
. . .
. . .
. . .
. . .
. . .
. . .
. . ANSYS, Inc. (a) (b) .
. . .
. . .
. . .
. . .
. . .
. . .
. . .
. . .
. . .
. . .
. . .
. . .
. . .
. . .
. . .
. . .
. . .
. . .
. . .
. . .
. . .
. . .
. Electronic Arts, Inc. (a) (b) . .
. . .
. . .
. . .
. . .
. . .
. . .
. . .
. . .
. . .
. . .
. . .
. . .
. . .
. . .
. . .
. . .
. . .
. . .
. . .
. . . King Digital Entertainment PLC .
. . .
. . .
. . .
. . .
. . .
. . .
. . .
. . .
. . .
. . .
. . .
. . .
. . .
. . .
. . .
. . .
. . .
. . .
. . . SS&C Technologies Holdings, Inc.
(a) . . .
. . .
. . .
. . .
. . .
. . .
. . .
. . .
. . .
. . .
. . .
. . .
. . .
. . .
. . .
. . .
. . .
. . 2,675 Page 10 See Notes to Financial Statements Value ___________________ 667,213 154,825 136,696 ___________________ 958,734 ___________________ 122,627 ___________________ 116,136 ___________________ 125,674 121,642 ___________________ 247,316 ___________________ 224,980 ___________________ 771,385 360,839 129,846 108,352 195,040 551,355 ___________________ 2,116,817 ___________________ 659,542 ___________________ 661,140 131,403 571,066 607,103 394,998 ___________________ 2,365,710 ___________________ 124,281 ___________________ 137,893 752,437 235,358 ___________________ 1,125,688 ___________________ 130,927 265,010 131,814 128,285 126,801 141,033 ___________________ 923,870 ___________________ . First Trust Long/Short Equity ETF (FTLS) Portfolio of Investments (Continued) October 31, 2015 Shares/ Units _______________ Description ___________________________________________________________________________________________________________________________________ COMMON STOCKS (Continued) Specialty Retail – 6.7% 865 AutoZone, Inc. (a) (b) . . .
. . .
. . .
. . .
. . .
. . .
. . .
. . .
. . .
. . .
. . .
. . .
. . .
. . .
. . .
. . .
. . .
. . .
. . .
. . .
. . .
. . . 7,483 Barnes & Noble, Inc.
(a) . . .
. . .
. . .
. . .
. . .
. . .
. . .
. . .
. . .
. . .
. . .
. . .
. . .
. . .
. . .
. . .
. . .
. . .
. . .
. . .
. . .
. 4,157 GameStop Corp., Class A (a) . . .
. . .
. . .
. . .
. . .
. . .
. . .
. . .
. . .
. . .
. . .
. . .
. . .
. . .
. . .
. . .
. . .
. . .
. . .
. . .
. 3,602 Home Depot (The), Inc. (a) . .
. . .
. . .
. . .
. . .
. . .
. . .
. . .
. . .
. . .
. . .
. . .
. . .
. . .
. . .
. . .
. . .
. . .
. . .
. . .
. . . 2,036 Outerwall, Inc.
(a) . . .
. . .
. . .
. . .
. . .
. . .
. . .
. . .
. . .
. . .
. . .
. . .
. . .
. . .
. . .
. . .
. . .
. . .
. . .
. . .
. . .
. . .
. . . 11,135 Pep Boys-Manny Moe & Jack/The (b) .
. . .
. . .
. . .
. . .
. . .
. . .
. . .
. . .
. . .
. . .
. . .
. . .
. . .
. . .
. . .
. . .
. . .
. 4,845 Rent-A-Center, Inc. . .
. . .
. . .
. . .
. . .
. . .
. . .
. . .
. . .
. . .
. . .
. . .
. . .
. . .
. . .
. . .
. . .
. . .
. . .
. . .
. . .
. . .
. . . 7,997 Ross Stores, Inc.
. . .
. . .
. . .
. . .
. . .
. . .
. . .
. . .
. . .
. . .
. . .
. . .
. . .
. . .
. . .
. . .
. . .
. . .
. . .
. . .
. . .
. . .
. . .
. . 11,195 1,599 Technology Hardware, Storage & Peripherals – 4.4% Apple, Inc. (a) .
. . .
. . .
. . .
. . .
. . .
. . .
. . .
. . .
. . .
. . .
. . .
. . .
. . .
. . .
. . .
. . .
. . .
. . .
. . .
. . .
. . .
. . .
. . .
. . . Western Digital Corp.
. . .
. . .
. . .
. . .
. . .
. . .
. . .
. . .
. . .
. . .
. . .
. . .
. . .
. . .
. . .
. . .
. . .
. . .
. . .
. . .
. . .
. . .
. Value ___________________ $ 678,515 97,204 191,513 445,351 122,160 167,470 89,100 404,488 ___________________ 2,195,801 ___________________ 1,337,803 106,845 ___________________ 1,444,648 ___________________ 6,501 4,676 Tobacco – 2.5% Altria Group, Inc. (a) . .
. . .
. . .
. . .
. . .
. . .
. . .
. . .
. . .
. . .
. . .
. . .
. . .
. . .
. . .
. . .
. . .
. . .
. . .
. . .
. . .
. . .
. . Philip Morris International, Inc. .
. . .
. . .
. . .
. . .
. . .
. . .
. . .
. . .
. . .
. . .
. . .
. . .
. . .
. . .
. . .
. . .
. . .
. . .
. . . 393,116 413,358 ___________________ 806,474 ___________________ 2,642 17,242 Transportation Infrastructure – 0.7% Grupo Aeroportuario del Pacifico SAB de CV, ADR .
. . .
. . .
. . .
. . .
. . .
. . .
. . .
. . .
. . .
. . .
. . .
. . .
. . .
. . Wireless Telecommunication Services – 1.7% Vodafone Group PLC, ADR (a) . .
. . .
. . .
. . .
. . .
. . .
. . .
. . .
. . .
. . .
. . .
. . .
. . .
. . .
. . .
. . .
. . .
. . .
. . .
. . . Total Common Stocks .
. . .
. . .
. . .
. . .
. . .
. . .
. . .
. . .
. . .
. . .
. . .
. . .
. . .
. . .
. . .
. . .
. . .
. . .
. . .
. . .
. (Cost $28,979,453) REAL ESTATE INVESTMENT TRUSTS – 2.4% Real Estate Investment Trusts – 2.4% 6,619 American Capital Agency Corp. . .
. . .
. . .
. . .
. . .
. . .
. . .
. . .
. . .
. . .
. . .
. . .
. . .
. . .
. . .
. . .
. . .
. . .
. . .
. . 6,781 Host Hotels & Resorts, Inc. (a) .
. . .
. . .
. . .
. . .
. . .
. . .
. . .
. . .
. . .
. . .
. . .
. . .
. . .
. . .
. . .
. . .
. . .
. . .
. . .
. 7,203 Paramount Group, Inc. (a) . .
. . .
. . .
. . .
. . .
. . .
. . .
. . .
. . .
. . .
. . .
. . .
. . .
. . .
. . .
. . .
. . .
. . .
. . .
. . .
. . .
. 617 Public Storage (a) . . .
. . .
. . .
. . .
. . .
. . .
. . .
. . .
. . .
. . .
. . .
. . .
. . .
. . .
. . .
. . .
. . .
. . .
. . .
. . .
. . .
. . .
. . .
. 683 Simon Property Group, Inc. (a) . .
. . .
. . .
. . .
. . .
. . .
. . .
. . .
. . .
. . .
. . .
. . .
. . .
. . .
. . .
. . .
. . .
. . .
. . .
. . . 1,923 Welltower, Inc.
(a) . . .
. . .
. . .
. . .
. . .
. . .
. . .
. . .
. . .
. . .
. . .
. . .
. . .
. . .
. . .
. . .
. . .
. . .
. . .
. . .
. . .
. . .
. . . Total Real Estate Investment Trusts .
. . .
. . .
. . .
. . .
. . .
. . .
. . .
. . .
. . .
. . .
. . .
. . .
. . .
. . .
. . .
. . .
. (Cost $769,015) MASTER LIMITED PARTNERSHIPS – 5.1% Chemicals – 1.1% 3,325 Terra Nitrogen Co, L.P. (a) . .
. . .
. . .
. . .
. . .
. . .
. . .
. . .
. . .
. . .
. . .
. . .
. . .
. . .
. . .
. . .
. . .
. . .
. . .
. . .
. . . Gas Utilities – 0.4% 2,862 AmeriGas Partners, L.P.
. . .
. . .
. . .
. . .
. . .
. . .
. . .
. . .
. . .
. . .
. . .
. . .
. . .
. . .
. . .
. . .
. . .
. . .
. . .
. . .
. . .
. . Oil, Gas & Consumable Fuels – 3.6% 3,665 Alliance Holdings GP, L.P. (a) .
. . .
. . .
. . .
. . .
. . .
. . .
. . .
. . .
. . .
. . .
. . .
. . .
. . .
. . .
. . .
. . .
. . .
. . .
. . .
. . 13,578 Alon USA Partners L.P. (a) .
. . .
. . .
. . .
. . .
. . .
. . .
. . .
. . .
. . .
. . .
. . .
. . .
. . .
. . .
. . .
. . .
. . .
. . .
. . .
. . .
. 1,880 Buckeye Partners, L.P. (a) . .
. . .
. . .
. . .
. . .
. . .
. . .
. . .
. . .
. . .
. . .
. . .
. . .
. . .
. . .
. . .
. . .
. . .
. . .
. . .
. . .
. 1,886 Magellan Midstream Partners, L.P. (a) . .
. . .
. . .
. . .
. . .
. . .
. . .
. . .
. . .
. . .
. . .
. . .
. . .
. . .
. . .
. . .
. . .
. . . 14,465 Northern Tier Energy L.P.
(a) . . .
. . .
. . .
. . .
. . .
. . .
. . .
. . .
. . .
. . .
. . .
. . .
. . .
. . .
. . .
. . .
. . .
. . .
. . .
. . . See Notes to Financial Statements 240,607 ___________________ 568,469 ___________________ 29,484,874 ___________________ 118,017 117,515 127,997 141,577 137,597 124,745 ___________________ 767,448 ___________________ 351,718 ___________________ 122,036 ___________________ 107,238 334,154 127,520 120,346 388,241 Page 11 .
First Trust Long/Short Equity ETF (FTLS) Portfolio of Investments (Continued) October 31, 2015 Shares _______________ Description ___________________________________________________________________________________________________________________________________ MASTER LIMITED PARTNERSHIPS (Continued) Oil, Gas & Consumable Fuels (Continued) 2,303 TC Pipelines, L.P. (a) . . .
. . .
. . .
. . .
. . .
. . .
. . .
. . .
. . .
. . .
. . .
. . .
. . .
. . .
. . .
. . .
. . .
. . .
. . .
. . .
. . .
. . .
. Total Master Limited Partnerships . . .
. . .
. . .
. . .
. . .
. . .
. . .
. . .
. . .
. . .
. . .
. . .
. . .
. . .
. . .
. . .
. . . (Cost $1,712,575) Total Long-Term Investments – 97.9% .
. . .
. . .
. . .
. . .
. . .
. . .
. . .
. . .
. . .
. . .
. . .
. . .
. . .
. . .
. . .
. . (Cost $31,461,043) (c) COMMON STOCKS SOLD SHORT – (17.7%) Aerospace & Defense – (0.2%) (988) AAR Corp. .
. . .
. . .
. . .
. . .
. . .
. . .
. . .
. . .
. . .
. . .
. . .
. . .
. . .
. . .
. . .
. . .
. . .
. . .
. . .
. . .
. . .
. . .
. . .
. . .
. . (1,289) Textron, Inc. .
. . .
. . .
. . .
. . .
. . .
. . .
. . .
. . .
. . .
. . .
. . .
. . .
. . .
. . .
. . .
. . .
. . .
. . .
. . .
. . .
. . .
. . .
. . .
. . .
. Value ___________________ $ 118,973 ___________________ 1,196,472 ___________________ 1,670,226 ___________________ 31,922,548 ___________________ (22,418) (54,357) ___________________ (76,775) ___________________ (15,804) (1,262) (2,804) (2,318) (1,507) (4,902) (9,864) Air Freight & Logistics – (0.3%) UTi Worldwide, Inc. (b) . .
. . .
. . .
. . .
. . .
. . .
. . .
. . .
. . .
. . .
. . .
. . .
. . .
. . .
. . .
. . .
. . .
. . .
. . .
. . .
. . .
. . . Auto Components – (0.2%) Johnson Controls, Inc.
. . .
. . .
. . .
. . .
. . .
. . .
. . .
. . .
. . .
. . .
. . .
. . .
. . .
. . .
. . .
. . .
. . .
. . .
. . .
. . .
. . .
. . . Automobiles – (0.3%) General Motors Co.
. . .
. . .
. . .
. . .
. . .
. . .
. . .
. . .
. . .
. . .
. . .
. . .
. . .
. . .
. . .
. . .
. . .
. . .
. . .
. . .
. . .
. . .
. . Banks – (1.0%) Community Bank System, Inc. .
. . .
. . .
. . .
. . .
. . .
. . .
. . .
. . .
. . .
. . .
. . .
. . .
. . .
. . .
. . .
. . .
. . .
. . .
. . .
. CVB Financial Corp. . .
. . .
. . .
. . .
. . .
. . .
. . .
. . .
. . .
. . .
. . .
. . .
. . .
. . .
. . .
. . .
. . .
. . .
. . .
. . .
. . .
. . .
. . Fifth Third Bancorp . .
. . .
. . .
. . .
. . .
. . .
. . .
. . .
. . .
. . .
. . .
. . .
. . .
. . .
. . .
. . .
. . .
. . .
. . .
. . .
. . .
. . .
. . . Valley National Bancorp .
. . .
. . .
. . .
. . .
. . .
. . .
. . .
. . .
. . .
. . .
. . .
. . .
. . .
. . .
. . .
. . .
. . .
. . .
. . .
. . .
. . . Beverages – (0.9%) (3,188) Coca-Cola (The) Co.
. . .
. . .
. . .
. . .
. . .
. . .
. . .
. . .
. . .
. . .
. . .
. . .
. . .
. . .
. . .
. . .
. . .
. . .
. . .
. . .
. . .
. . .
. (2,478) Coca-Cola Enterprises, Inc. . .
. . .
. . .
. . .
. . .
. . .
. . .
. . .
. . .
. . .
. . .
. . .
. . .
. . .
. . .
. . .
. . .
. . .
. . .
. . .
. . . (274) Constellation Brands, Inc.
. . .
. . .
. . .
. . .
. . .
. . .
. . .
. . .
. . .
. . .
. . .
. . .
. . .
. . .
. . .
. . .
. . .
. . .
. . .
. . .
. . . (792) (684) (7,499) (383) (239) (1,577) (506) (5,027) (826) (838) (892) (3,174) Biotechnology – (1.1%) AbbVie, Inc.
. . .
. . .
. . .
. . .
. . .
. . .
. . .
. . .
. . .
. . .
. . .
. . .
. . .
. . .
. . .
. . .
. . .
. . .
. . .
. . .
. . .
. . .
. . .
. . .
. . ACADIA Pharmaceuticals, Inc. (b) .
. . .
. . .
. . .
. . .
. . .
. . .
. . .
. . .
. . .
. . .
. . .
. . .
. . .
. . .
. . .
. . .
. . .
. . .
. Agenus, Inc. (b) . .
. . .
. . .
. . .
. . .
. . .
. . .
. . .
. . .
. . .
. . .
. . .
. . .
. . .
. . .
. . .
. . .
. . .
. . .
. . .
. . .
. . .
. . .
. . . Alkermes PLC (b) .
. . .
. . .
. . .
. . .
. . .
. . .
. . .
. . .
. . .
. . .
. . .
. . .
. . .
. . .
. . .
. . .
. . .
. . .
. . .
. . .
. . .
. . .
. . Alnylam Pharmaceuticals, Inc. (b) .
. . .
. . .
. . .
. . .
. . .
. . .
. . .
. . .
. . .
. . .
. . .
. . .
. . .
. . .
. . .
. . .
. . .
. . .
. Celldex Therapeutics, Inc. (b) . .
. . .
. . .
. . .
. . .
. . .
. . .
. . .
. . .
. . .
. . .
. . .
. . .
. . .
. . .
. . .
. . .
. . .
. . .
. . .
. Chimerix, Inc. (b) . .
. . .
. . .
. . .
. . .
. . .
. . .
. . .
. . .
. . .
. . .
. . .
. . .
. . .
. . .
. . .
. . .
. . .
. . .
. . .
. . .
. . .
. . .
. . Ironwood Pharmaceuticals, Inc. (b) .
. . .
. . .
. . .
. . .
. . .
. . .
. . .
. . .
. . .
. . .
. . .
. . .
. . .
. . .
. . .
. . .
. . .
. . .
. Ophthotech Corp. (b) . .
. . .
. . .
. . .
. . .
. . .
. . .
. . .
. . .
. . .
. . .
. . .
. . .
. . .
. . .
. . .
. . .
. . .
. . .
. . .
. . .
. . .
. . Portola Pharmaceuticals, Inc. (b) .
. . .
. . .
. . .
. . .
. . .
. . .
. . .
. . .
. . .
. . .
. . .
. . .
. . .
. . .
. . .
. . .
. . .
. . .
. . . PTC Therapeutics, Inc.
(b) . . .
. . .
. . .
. . .
. . .
. . .
. . .
. . .
. . .
. . .
. . .
. . .
. . .
. . .
. . .
. . .
. . .
. . .
. . .
. . .
. . . Sangamo BioSciences, Inc.
(b) . . .
. . .
. . .
. . .
. . .
. . .
. . .
. . .
. . .
. . .
. . .
. . .
. . .
. . .
. . .
. . .
. . .
. . .
. . .
. . (897) (1,128) (1,157) (323) Chemicals – (1.3%) Air Products & Chemicals, Inc. .
. . .
. . .
. . .
. . .
. . .
. . .
. . .
. . .
. . .
. . .
. . .
. . .
. . .
. . .
. . .
. . .
. . .
. . .
. . .
. Ecolab, Inc. . .
. . .
. . .
. . .
. . .
. . .
. . .
. . .
. . .
. . .
. . .
. . .
. . .
. . .
. . .
. . .
. . .
. . .
. . .
. . .
. . .
. . .
. . .
. . .
. . .
. Praxair, Inc. . .
. . .
. . .
. . .
. . .
. . .
. . .
. . .
. . .
. . .
. . .
. . .
. . .
. . .
. . .
. . .
. . .
. . .
. . .
. . .
. . .
. . .
. . .
. . .
. . .
. Valspar Corp./The . . .
. . .
. . .
. . .
. . .
. . .
. . .
. . .
. . .
. . .
. . .
. . .
. . .
. . .
. . .
. . .
. . .
. . .
. . .
. . .
. . .
. . .
. . .
. Page 12 See Notes to Financial Statements (112,683) ___________________ (57,017) ___________________ (97,888) ___________________ (94,482) (26,297) (93,383) (103,572) ___________________ (317,734) ___________________ (135,012) (127,221) (36,935) ___________________ (299,168) ___________________ (47,164) (23,817) (34,195) (27,545) (20,542) (19,019) (19,825) (57,107) (41,242) (39,897) (22,184) (22,377) ___________________ (374,914) ___________________ (124,665) (135,755) (128,531) (26,147) ___________________ (415,098) ___________________ . First Trust Long/Short Equity ETF (FTLS) Portfolio of Investments (Continued) October 31, 2015 Shares _______________ Description ___________________________________________________________________________________________________________________________________ COMMON STOCKS SOLD SHORT (Continued) Commercial Services & Supplies – (0.5%) (1,028) Matthews International Corp. . . .
. . .
. . .
. . .
. . .
. . .
. . .
. . .
. . .
. . .
. . .
. . .
. . .
. . .
. . .
. . .
. . .
. . .
. . .
. . . (899) Stericycle, Inc.
(b) . . .
. . .
. . .
. . .
. . .
. . .
. . .
. . .
. . .
. . .
. . .
. . .
. . .
. . .
. . .
. . .
. . .
. . .
. . .
. . .
. . .
. . .
. . . Construction & Engineering – (0.5%) (784) Granite Construction, Inc.
. . .
. . .
. . .
. . .
. . .
. . .
. . .
. . .
. . .
. . .
. . .
. . .
. . .
. . .
. . .
. . .
. . .
. . .
. . .
. . .
. . . (7,063) KBR, Inc.
. . .
. . .
. . .
. . .
. . .
. . .
. . .
. . .
. . .
. . .
. . .
. . .
. . .
. . .
. . .
. . .
. . .
. . .
. . .
. . .
. . .
. . .
. . .
. . .
. . .
. Value ___________________ $ (59,346) (109,112) ___________________ (168,458) ___________________ (25,746) (130,242) ___________________ (155,988) ___________________ Consumer Finance – (0.2%) (2,988) Ally Financial, Inc. (b) . .
. . .
. . .
. . .
. . .
. . .
. . .
. . .
. . .
. . .
. . .
. . .
. . .
. . .
. . .
. . .
. . .
. . .
. . .
. . .
. . .
. . .
. Containers & Packaging – (0.2%) (772) AptarGroup, Inc. . .
. . .
. . .
. . .
. . .
. . .
. . .
. . .
. . .
. . .
. . .
. . .
. . .
. . .
. . .
. . .
. . .
. . .
. . .
. . .
. . .
. . .
. . .
. . Diversified Consumer Services – (0.2%) (1,097) Houghton Mifflin Harcourt Co. (b) .
. . .
. . .
. . .
. . .
. . .
. . .
. . .
. . .
. . .
. . .
. . .
. . .
. . .
. . .
. . .
. . .
. . .
. . .
. (458) Steiner Leisure Ltd. (b) . .
. . .
. . .
. . .
. . .
. . .
. . .
. . .
. . .
. . .
. . .
. . .
. . .
. . .
. . .
. . .
. . .
. . .
. . .
. . .
. . .
. . . Electronic Equipment, Instruments & Components – (0.4%) (1,978) AVX Corp.
. . .
. . .
. . .
. . .
. . .
. . .
. . .
. . .
. . .
. . .
. . .
. . .
. . .
. . .
. . .
. . .
. . .
. . .
. . .
. . .
. . .
. . .
. . .
. . .
. . . (3,733) Corning, Inc.
. . .
. . .
. . .
. . .
. . .
. . .
. . .
. . .
. . .
. . .
. . .
. . .
. . .
. . .
. . .
. . .
. . .
. . .
. . .
. . .
. . .
. . .
. . .
. . .
. . (786) Itron, Inc. (b) .
. . .
. . .
. . .
. . .
. . .
. . .
. . .
. . .
. . .
. . .
. . .
. . .
. . .
. . .
. . .
. . .
. . .
. . .
. . .
. . .
. . .
. . .
. . .
. . . Energy Equipment & Services – (0.1%) (412) SEACOR Holdings, Inc.
(b) . . .
. . .
. . .
. . .
. . .
. . .
. . .
. . .
. . .
. . .
. . .
. . .
. . .
. . .
. . .
. . .
. . .
. . .
. . .
. . .
. Food Products – (1.3%) (3,222) Darling Ingredients, Inc. (b) . .
. . .
. . .
. . .
. . .
. . .
. . .
. . .
. . .
. . .
. . .
. . .
. . .
. . .
. . .
. . .
. . .
. . .
. . .
. . .
. . . (1,898) Kellogg Co.
. . .
. . .
. . .
. . .
. . .
. . .
. . .
. . .
. . .
. . .
. . .
. . .
. . .
. . .
. . .
. . .
. . .
. . .
. . .
. . .
. . .
. . .
. . .
. . .
. . (2,826) Mondelez International, Inc., Class A . .
. . .
. . .
. . .
. . .
. . .
. . .
. . .
. . .
. . .
. . .
. . .
. . .
. . .
. . .
. . .
. . .
. . .
. (3,877) Snyder’s-Lance, Inc. . .
. . .
. . .
. . .
. . .
. . .
. . .
. . .
. . .
. . .
. . .
. . .
. . .
. . .
. . .
. . .
. . .
. . .
. . .
. . .
. . .
. . .
. . (1,038) (1,274) (1,169) (1,267) (1,622) (372) (3,083) Health Care Equipment & Supplies – (0.7%) Alere, Inc. (b) .
. . .
. . .
. . .
. . .
. . .
. . .
. . .
. . .
. . .
. . .
. . .
. . .
. . .
. . .
. . .
. . .
. . .
. . .
. . .
. . .
. . .
. . .
. . .
. . . Cardiovascular Systems, Inc.
(b) . . .
. . .
. . .
. . .
. . .
. . .
. . .
. . .
. . .
. . .
. . .
. . .
. . .
. . .
. . .
. . .
. . .
. . .
. . .
. CONMED Corp. . .
. . .
. . .
. . .
. . .
. . .
. . .
. . .
. . .
. . .
. . .
. . .
. . .
. . .
. . .
. . .
. . .
. . .
. . .
. . .
. . .
. . .
. . .
. . K2M Group Holdings, Inc. (b) .
. . .
. . .
. . .
. . .
. . .
. . .
. . .
. . .
. . .
. . .
. . .
. . .
. . .
. . .
. . .
. . .
. . .
. . .
. . .
. Spectranetics Corp./The (b) . . .
. . .
. . .
. . .
. . .
. . .
. . .
. . .
. . .
. . .
. . .
. . .
. . .
. . .
. . .
. . .
. . .
. . .
. . .
. . .
. . St. Jude Medical, Inc.
. . .
. . .
. . .
. . .
. . .
. . .
. . .
. . .
. . .
. . .
. . .
. . .
. . .
. . .
. . .
. . .
. . .
. . .
. . .
. . .
. . .
. . .
. Wright Medical Group NV (b) . . .
. . .
. . .
. . .
. . .
. . .
. . .
. . .
. . .
. . .
. . .
. . .
. . .
. . .
. . .
. . .
. . .
. . .
. . .
. . (642) (663) (489) (1,913) Health Care Providers & Services – (0.3%) Acadia Healthcare Co., Inc. (b) .
. . .
. . .
. . .
. . .
. . .
. . .
. . .
. . .
. . .
. . .
. . .
. . .
. . .
. . .
. . .
. . .
. . .
. . .
. . .
. Air Methods Corp. (b) . .
. . .
. . .
. . .
. . .
. . .
. . .
. . .
. . .
. . .
. . .
. . .
. . .
. . .
. . .
. . .
. . .
. . .
. . .
. . .
. . .
. . .
. Community Health Systems, Inc. (b) . .
. . .
. . .
. . .
. . .
. . .
. . .
. . .
. . .
. . .
. . .
. . .
. . .
. . .
. . .
. . .
. . .
. . .
. Select Medical Holdings Corp. . .
. . .
. . .
. . .
. . .
. . .
. . .
. . .
. . .
. . .
. . .
. . .
. . .
. . .
. . .
. . .
. . .
. . .
. . .
. . . Hotels, Restaurants & Leisure – (0.2%) (327) DineEquity, Inc.
. . .
. . .
. . .
. . .
. . .
. . .
. . .
. . .
. . .
. . .
. . .
. . .
. . .
. . .
. . .
. . .
. . .
. . .
. . .
. . .
. . .
. . .
. . .
. . (2,604) Wendy’s Co./The . .
. . .
. . .
. . .
. . .
. . .
. . .
. . .
. . .
. . .
. . .
. . .
. . .
. . .
. . .
. . .
. . .
. . .
. . .
. . .
. . .
. . .
. . .
. . See Notes to Financial Statements (59,521) ___________________ (56,788) ___________________ (21,490) (29,019) ___________________ (50,509) ___________________ (26,703) (69,434) (28,870) ___________________ (125,007) ___________________ (24,069) ___________________ (32,607) (133,847) (130,448) (137,788) ___________________ (434,690) ___________________ (47,872) (17,454) (47,415) (23,123) (19,821) (23,737) (59,594) ___________________ (239,016) ___________________ (39,425) (27,137) (13,711) (21,617) ___________________ (101,890) ___________________ (27,288) (23,853) ___________________ (51,141) ___________________ Page 13 . First Trust Long/Short Equity ETF (FTLS) Portfolio of Investments (Continued) October 31, 2015 Shares _______________ Description ___________________________________________________________________________________________________________________________________ COMMON STOCKS SOLD SHORT (Continued) Household Durables – (0.1%) (764) Newell Rubbermaid, Inc. . . .
. . .
. . .
. . .
. . .
. . .
. . .
. . .
. . .
. . .
. . .
. . .
. . .
. . .
. . .
. . .
. . .
. . .
. . .
. . .
. . .
. Internet Software & Services – (0.4%) (742) Cornerstone OnDemand, Inc. (b) . .
. . .
. . .
. . .
. . .
. . .
. . .
. . .
. . .
. . .
. . .
. . .
. . .
. . .
. . .
. . .
. . .
. . .
. . .
. (696) Demandware, Inc. (b) . .
. . .
. . .
. . .
. . .
. . .
. . .
. . .
. . .
. . .
. . .
. . .
. . .
. . .
. . .
. . .
. . .
. . .
. . .
. . .
. . .
. . .
. . (3,423) Monster Worldwide, Inc. (b) .
. . .
. . .
. . .
. . .
. . .
. . .
. . .
. . .
. . .
. . .
. . .
. . .
. . .
. . .
. . .
. . .
. . .
. . .
. . .
. . . (1,692) Yahoo!, Inc.
(b) . . .
. . .
. . .
. . .
. . .
. . .
. . .
. . .
. . .
. . .
. . .
. . .
. . .
. . .
. . .
. . .
. . .
. . .
. . .
. . .
. . .
. . .
. . .
. . . (159) (614) (3,467) (814) (2,389) IT Services – (0.8%) Alliance Data Systems Corp.
(b) . . .
. . .
. . .
. . .
. . .
. . .
. . .
. . .
. . .
. . .
. . .
. . .
. . .
. . .
. . .
. . .
. . .
. . .
. . .
. Computer Sciences Corp. . .
. . .
. . .
. . .
. . .
. . .
. . .
. . .
. . .
. . .
. . .
. . .
. . .
. . .
. . .
. . .
. . .
. . .
. . .
. . .
. . .
. . PayPal Holdings, Inc. (b) .
. . .
. . .
. . .
. . .
. . .
. . .
. . .
. . .
. . .
. . .
. . .
. . .
. . .
. . .
. . .
. . .
. . .
. . .
. . .
. . .
. . . VeriFone Systems, Inc.
(b) . . .
. . .
. . .
. . .
. . .
. . .
. . .
. . .
. . .
. . .
. . .
. . .
. . .
. . .
. . .
. . .
. . .
. . .
. . .
. . .
. . . Xerox Corp.
. . .
. . .
. . .
. . .
. . .
. . .
. . .
. . .
. . .
. . .
. . .
. . .
. . .
. . .
. . .
. . .
. . .
. . .
. . .
. . .
. . .
. . .
. . .
. . .
. . Life Sciences Tools & Services – (0.1%) (1,297) Bruker Corp. (b) .
. . .
. . .
. . .
. . .
. . .
. . .
. . .
. . .
. . .
. . .
. . .
. . .
. . .
. . .
. . .
. . .
. . .
. . .
. . .
. . .
. . .
. . .
. . .
. Machinery – (0.1%) (822) Mueller Industries, Inc. . .
. . .
. . .
. . .
. . .
. . .
. . .
. . .
. . .
. . .
. . .
. . .
. . .
. . .
. . .
. . .
. . .
. . .
. . .
. . .
. . .
. . . (2,823) Titan International, Inc.
. . .
. . .
. . .
. . .
. . .
. . .
. . .
. . .
. . .
. . .
. . .
. . .
. . .
. . .
. . .
. . .
. . .
. . .
. . .
. . .
. . .
. . Media – (0.8%) (3,266) Global Eagle Entertainment, Inc. (b) .
. . .
. . .
. . .
. . .
. . .
. . .
. . .
. . .
. . .
. . .
. . .
. . .
. . .
. . .
. . .
. . .
. . .
. . . (1,023) Omnicom Group, Inc.
. . .
. . .
. . .
. . .
. . .
. . .
. . .
. . .
. . .
. . .
. . .
. . .
. . .
. . .
. . .
. . .
. . .
. . .
. . .
. . .
. . .
. . . (1,209) Walt Disney (The) Co.
. . .
. . .
. . .
. . .
. . .
. . .
. . .
. . .
. . .
. . .
. . .
. . .
. . .
. . .
. . .
. . .
. . .
. . .
. . .
. . .
. . .
. . . Multiline Retail – (0.2%) (1,004) Macy’s, Inc.
. . .
. . .
. . .
. . .
. . .
. . .
. . .
. . .
. . .
. . .
. . .
. . .
. . .
. . .
. . .
. . .
. . .
. . .
. . .
. . .
. . .
. . .
. . .
. . .
. . Oil, Gas & Consumable Fuels – (1.8%) (2,614) ConocoPhillips . .
. . .
. . .
. . .
. . .
. . .
. . .
. . .
. . .
. . .
. . .
. . .
. . .
. . .
. . .
. . .
. . .
. . .
. . .
. . .
. . .
. . .
. . .
. . .
. (796) Diamondback Energy, Inc. (b) . .
. . .
. . .
. . .
. . .
. . .
. . .
. . .
. . .
. . .
. . .
. . .
. . .
. . .
. . .
. . .
. . .
. . .
. . .
. . .
. (438) Hess Corp. . .
. . .
. . .
. . .
. . .
. . .
. . .
. . .
. . .
. . .
. . .
. . .
. . .
. . .
. . .
. . .
. . .
. . .
. . .
. . .
. . .
. . .
. . .
. . .
. . .
. (2,592) Matador Resources Co. (b) . .
. . .
. . .
. . .
. . .
. . .
. . .
. . .
. . .
. . .
. . .
. . .
. . .
. . .
. . .
. . .
. . .
. . .
. . .
. . .
. . . (1,363) Memorial Resource Development Corp.
(b) . . .
. . .
. . .
. . .
. . .
. . .
. . .
. . .
. . .
. . .
. . .
. . .
. . .
. . .
. . .
. . .
. (1,293) Newfield Exploration Co. (b) . .
. . .
. . .
. . .
. . .
. . .
. . .
. . .
. . .
. . .
. . .
. . .
. . .
. . .
. . .
. . .
. . .
. . .
. . .
. . .
. (1,792) Occidental Petroleum Corp. . .
. . .
. . .
. . .
. . .
. . .
. . .
. . .
. . .
. . .
. . .
. . .
. . .
. . .
. . .
. . .
. . .
. . .
. . .
. . .
. . . (3,973) QEP Resources, Inc.
. . .
. . .
. . .
. . .
. . .
. . .
. . .
. . .
. . .
. . .
. . .
. . .
. . .
. . .
. . .
. . .
. . .
. . .
. . .
. . .
. . .
. . .
. . (472) SemGroup Corp., Class A . .
. . .
. . .
. . .
. . .
. . .
. . .
. . .
. . .
. . .
. . .
. . .
. . .
. . .
. . .
. . .
. . .
. . .
. . .
. . .
. . .
. (1,479) Southwestern Energy Co. (b) . .
. . .
. . .
. . .
. . .
. . .
. . .
. . .
. . .
. . .
. . .
. . .
. . .
. . .
. . .
. . .
. . .
. . .
. . .
. . .
. . Paper & Forest Products – (0.2%) (1,428) International Paper Co. .
. . .
. . .
. . .
. . .
. . .
. . .
. . .
. . .
. . .
. . .
. . .
. . .
. . .
. . .
. . .
. . .
. . .
. . .
. . .
. . .
. . .
. Pharmaceuticals – (0.4%) (1,576) Eli Lilly & Co. . .
. . .
. . .
. . .
. . .
. . .
. . .
. . .
. . .
. . .
. . .
. . .
. . .
. . .
. . .
. . .
. . .
. . .
. . .
. . .
. . .
. . .
. . .
. . .
. (617) Tetraphase Pharmaceuticals, Inc. (b) . .
. . .
. . .
. . .
. . .
. . .
. . .
. . .
. . .
. . .
. . .
. . .
. . .
. . .
. . .
. . .
. . .
. . .
. . Value ___________________ $ (32,417) ___________________ (23,373) (39,463) (21,462) (60,269) ___________________ (144,567) ___________________ (47,272) (40,886) (124,847) (24,534) (22,433) ___________________ (259,972) ___________________ (23,826) ___________________ (25,910) (20,043) ___________________ (45,953) ___________________ (43,503) (76,643) (137,512) ___________________ (257,658) ___________________ (51,184) ___________________ (139,457) (58,777) (24,620) (66,640) (24,111) (51,966) (133,576) (61,422) (21,500) (16,328) ___________________ (598,397) ___________________ (60,961) ___________________ (128,554) (5,572) ___________________ (134,126) ___________________ Page 14 See Notes to Financial Statements . First Trust Long/Short Equity ETF (FTLS) Portfolio of Investments (Continued) October 31, 2015 Shares _______________ Description ___________________________________________________________________________________________________________________________________ COMMON STOCKS SOLD SHORT (Continued) Professional Services – (0.6%) (279) ManpowerGroup, Inc. . . .
. . .
. . .
. . .
. . .
. . .
. . .
. . .
. . .
. . .
. . .
. . .
. . .
. . .
. . .
. . .
. . .
. . .
. . .
. . .
. . .
. . . (2,709) Nielsen Holdings PLC .
. . .
. . .
. . .
. . .
. . .
. . .
. . .
. . .
. . .
. . .
. . .
. . .
. . .
. . .
. . .
. . .
. . .
. . .
. . .
. . .
. . .
. . (438) Verisk Analytics, Inc. (b) .
. . .
. . .
. . .
. . .
. . .
. . .
. . .
. . .
. . .
. . .
. . .
. . .
. . .
. . .
. . .
. . .
. . .
. . .
. . .
. . .
. . . Real Estate Management & Development – (0.1%) (207) Howard Hughes Corp./The (b) .
. . .
. . .
. . .
. . .
. . .
. . .
. . .
. . .
. . .
. . .
. . .
. . .
. . .
. . .
. . .
. . .
. . .
. . .
. . .
. Road & Rail – (0.1%) (323) JB Hunt Transport Services, Inc. . .
. . .
. . .
. . .
. . .
. . .
. . .
. . .
. . .
. . .
. . .
. . .
. . .
. . .
. . .
. . .
. . .
. . .
. . .
. . (1,513) Roadrunner Transportation Systems, Inc. (b) .
. . .
. . .
. . .
. . .
. . .
. . .
. . .
. . .
. . .
. . .
. . .
. . .
. . .
. . .
. . .
. . Semiconductors & Semiconductor Equipment – (0.1%) (2,499) Cypress Semiconductor Corp. (b) .
. . .
. . .
. . .
. . .
. . .
. . .
. . .
. . .
. . .
. . .
. . .
. . .
. . .
. . .
. . .
. . .
. . .
. . .
. . Software – (0.1%) (632) Interactive Intelligence Group, Inc. (b) .
. . .
. . .
. . .
. . .
. . .
. . .
. . .
. . .
. . .
. . .
. . .
. . .
. . .
. . .
. . .
. . .
. . .
. (1,122) Varonis Systems, Inc. (b) . .
. . .
. . .
. . .
. . .
. . .
. . .
. . .
. . .
. . .
. . .
. . .
. . .
. . .
. . .
. . .
. . .
. . .
. . .
. . .
. . .
. . (703) (938) (409) (674) Specialty Retail – (0.4%) Aaron’s, Inc. .
. . .
. . .
. . .
. . .
. . .
. . .
. . .
. . .
. . .
. . .
. . .
. . .
. . .
. . .
. . .
. . .
. . .
. . .
. . .
. . .
. . .
. . .
. . .
. . .
. Best Buy Co., Inc. . .
. . .
. . .
. . .
. . .
. . .
. . .
. . .
. . .
. . .
. . .
. . .
. . .
. . .
. . .
. . .
. . .
. . .
. . .
. . .
. . .
. . .
. . .
. Genesco, Inc. (b) . .
. . .
. . .
. . .
. . .
. . .
. . .
. . .
. . .
. . .
. . .
. . .
. . .
. . .
. . .
. . .
. . .
. . .
. . .
. . .
. . .
. . .
. . .
. . Tiffany & Co. .
. . .
. . .
. . .
. . .
. . .
. . .
. . .
. . .
. . .
. . .
. . .
. . .
. . .
. . .
. . .
. . .
. . .
. . .
. . .
. . .
. . .
. . .
. . .
. . . Technology Hardware, Storage & Peripherals – (0.2%) (3,013) Hewlett-Packard Co.
(b) . . .
. . .
. . .
. . .
. . .
. . .
. . .
. . .
. . .
. . .
. . .
. . .
. . .
. . .
. . .
. . .
. . .
. . .
. . .
. . .
. . .
. Textiles, Apparel & Luxury Goods – (0.1%) (574) Columbia Sportswear Co. . .
. . .
. . .
. . .
. . .
. . .
. . .
. . .
. . .
. . .
. . .
. . .
. . .
. . .
. . .
. . .
. . .
. . .
. . .
. . .
. . .
. Thrifts & Mortgage Finance – (0.3%) (6,162) TFS Financial Corp. . .
. . .
. . .
. . .
. . .
. . .
. . .
. . .
. . .
. . .
. . .
. . .
. . .
. . .
. . .
. . .
. . .
. . .
. . .
. . .
. . .
. . .
. . . Tobacco – (0.5%) (3,054) Reynolds American, Inc.
. . .
. . .
. . .
. . .
. . .
. . .
. . .
. . .
. . .
. . .
. . .
. . .
. . .
. . .
. . .
. . .
. . .
. . .
. . .
. . .
. . .
. Wireless Telecommunication Services – (0.4%) (4,424) Telephone & Data Systems, Inc. . .
. . .
. . .
. . .
. . .
. . .
. . .
. . .
. . .
. . .
. . .
. . .
. . .
. . .
. . .
. . .
. . .
. . .
. . .
. . Total Common Stocks Sold Short . .
. . .
. . .
. . .
. . .
. . .
. . .
. . .
. . .
. . .
. . .
. . .
. . .
. . .
. . .
. . .
. . .
. . . (Proceeds $(5,942,616)) REAL ESTATE INVESTMENT TRUSTS SOLD SHORT – (1.3%) Real Estate Investment Trusts – (1.3%) (737) AvalonBay Communities, Inc.
. . .
. . .
. . .
. . .
. . .
. . .
. . .
. . .
. . .
. . .
. . .
. . .
. . .
. . .
. . .
. . .
. . .
. . .
. . .
. . . (94) Equinix, Inc.
. . .
. . .
. . .
. . .
. . .
. . .
. . .
. . .
. . .
. . .
. . .
. . .
. . .
. . .
. . .
. . .
. . .
. . .
. . .
. . .
. . .
. . .
. . .
. . .
. . (3,109) General Growth Properties, Inc. .
. . .
. . .
. . .
. . .
. . .
. . .
. . .
. . .
. . .
. . .
. . .
. . .
. . .
. . .
. . .
. . .
. . .
. . .
. . . (1,739) Redwood Trust, Inc.
. . .
. . .
. . .
. . .
. . .
. . .
. . .
. . .
. . .
. . .
. . .
. . .
. . .
. . .
. . .
. . .
. . .
. . .
. . .
. . .
. . .
. . .
. . (2,888) Starwood Waypoint Residential Trust . .
. . .
. . .
. . .
. . .
. . .
. . .
. . .
. . .
. . .
. . .
. . .
. . .
. . .
. . .
. . .
. . .
. . .
. (5,609) Two Harbors Investment Corp. . .
. . .
. . .
. . .
. . .
. . .
. . .
. . .
. . .
. . .
. . .
. . .
. . .
. . .
. . .
. . .
. . .
. . .
. . .
. . . (273) Vornado Realty Trust .
. . .
. . .
. . .
. . .
. . .
. . .
. . .
. . .
. . .
. . .
. . .
. . .
. . .
. . .
. . .
. . .
. . .
. . .
. . .
. . .
. . .
. . . (423) WP Carey, Inc.
. . .
. . .
. . .
. . .
. . .
. . .
. . .
. . .
. . .
. . .
. . .
. . .
. . .
. . .
. . .
. . .
. . .
. . .
. . .
. . .
. . .
. . .
. . .
. . . Total Real Estate Investment Trusts Sold Short .
. . .
. . .
. . .
. . .
. . .
. . .
. . .
. . .
. . .
. . .
. . .
. . .
. . .
. (Proceeds $(445,845)) See Notes to Financial Statements Value ___________________ $ (25,607) (128,704) (31,365) ___________________ (185,676) ___________________ (25,581) ___________________ (24,668) (16,098) ___________________ (40,766) ___________________ (26,339) ___________________ (20,439) (17,918) ___________________ (38,357) ___________________ (17,343) (32,858) (25,624) (55,565) ___________________ (131,390) ___________________ (81,230) ___________________ (31,484) ___________________ (108,205) ___________________ (147,569) ___________________ (126,703) ___________________ (5,770,715) ___________________ (128,850) (27,888) (90,006) (23,094) (71,045) (47,452) (27,450) (26,805) ___________________ (442,590) ___________________ Page 15 . First Trust Long/Short Equity ETF (FTLS) Portfolio of Investments (Continued) October 31, 2015 Shares/ Units _______________ Description ___________________________________________________________________________________________________________________________________ EXCHANGE-TRADED FUNDS SOLD SHORT – (9.0%) Capital Markets – (9.0%) (1,327) iShares Core S&P 500 ETF . . . .
. . .
. . .
. . .
. . .
. . .
. . .
. . .
. . .
. . .
. . .
. . .
. . .
. . .
. . .
. . .
. . .
. . .
. . .
. . .
. (5,254) iShares Russell 2000 ETF . . .
. . .
. . .
. . .
. . .
. . .
. . .
. . .
. . .
. . .
. . .
. . .
. . .
. . .
. . .
. . .
. . .
. . .
. . .
. . .
. . . (698) iShares Russell 2000 Growth ETF .
. . .
. . .
. . .
. . .
. . .
. . .
. . .
. . .
. . .
. . .
. . .
. . .
. . .
. . .
. . .
. . .
. . .
. . .
. (9,355) SPDR S&P 500 ETF Trust . . .
. . .
. . .
. . .
. . .
. . .
. . .
. . .
. . .
. . .
. . .
. . .
. . .
. . .
. . .
. . .
. . .
. . .
. . .
. . .
. . Total Exchange-Traded Funds Sold Short . .
. . .
. . .
. . .
. . .
. . .
. . .
. . .
. . .
. . .
. . .
. . .
. . .
. . .
. . .
. (Proceeds $(2,881,591)) Value ___________________ $ (277,409) (605,997) (98,802) (1,945,185) ___________________ (2,927,393) ___________________ Total Investments Sold Short – (28.0%) . . .
. . .
. . .
. . .
. . .
. . .
. . .
. . .
. . .
. . .
. . .
. . .
. . .
. . .
. . .
. . (Proceeds $(9,270,052)) (9,140,698) ___________________ Net Other Assets and Liabilities – 30.1% . .
. . .
. . .
. . .
. . .
. . .
. . .
. . .
. . .
. . .
. . .
. . .
. . .
. . .
. . .
. . Net Assets – 100.0% . .
. . .
. . .
. . .
. . .
. . .
. . .
. . .
. . .
. . .
. . .
. . .
. . .
. . .
. . .
. . .
. . .
. . .
. . .
. . .
. . .
. . 9,825,714 ___________________ $ 32,607,564 ___________________ ___________________ (a) The security or a portion of the security is segregated as collateral for investments sold short. (b) Non-income producing security. (c) Aggregate cost for federal income tax purposes is $31,582,534. As of October 31, 2015, the aggregate gross unrealized appreciation for all securities in which there was an excess of value over tax cost was $1,310,826 and the aggregate gross unrealized depreciation for all securities in which there was an excess of tax cost over value was $970,812. ADR American Depositary Receipt Valuation Inputs A summary of the inputs used to value the Fund’s investments as of October 31, 2015 is as follows (see Note 2A – Portfolio Valuation in the Notes to Financial Statements): ASSETS TABLE Investments ________________________________________________ Total Value at 10/31/2015 _____________ Level 1 Quoted Prices ____________ Common Stocks* .
. . .
. . .
. . .
. . .
. . .
. . .
. . .
. . .
. . .
. . Real Estate Investment Trusts . .
. . .
. . .
. . .
. . .
. . .
. . . Master Limited Partnerships* .
. . .
. . .
. . .
. . .
. . .
. . .
. Total Investments . . .
. . .
. . .
. . .
. . .
. . .
. . .
. . .
. . .
. . . $ 29,484,874 767,448 1,670,226 _____________ $ 31,922,548 _____________ _____________ $ 29,484,874 767,448 1,670,226 ____________ $ 31,922,548 ____________ ____________ Level 2 Significant Observable Inputs _____________ Level 3 Significant Unobservable Inputs _____________ $ — — — _____________ $ — _____________ _____________ $ — — — _____________ $ — _____________ _____________ Level 2 Significant Observable Inputs _____________ Level 3 Significant Unobservable Inputs _____________ $ $ LIABILITIES TABLE Total Value at 10/31/2015 _____________ Common Stocks Sold Short* .
. . .
. . .
. . .
. . .
. . .
. . .
. . Real Estate Investment Trusts Sold Short . .
. . .
. . .
. . . Exchange-Traded Funds Sold Short* .
. . .
. . .
. . .
. . .
. Total Investments Sold Short . . .
. . .
. . .
. . .
. . .
. . .
. . . Level 1 Quoted Prices ____________ $ (5,770,715) (442,590) (2,927,393) _____________ $ (9,140,698) _____________ _____________ $ (5,770,715) (442,590) (2,927,393) ____________ $ (9,140,698) ____________ ____________ — — — _____________ $ — _____________ _____________ — — — _____________ $ — _____________ _____________ * See Portfolio of Investments for industry breakout. All transfers in and out of the Levels during the period are assumed to be transferred on the last day of the period at their current value. There were no transfers between Levels at October 31, 2015. Page 16 See Notes to Financial Statements .
First Trust Long/Short Equity ETF (FTLS) Statement of Assets and Liabilities October 31, 2015 ASSETS: Investments, at value (Cost $31,461,043) . . . .
. . .
. . .
. . .
. . .
. . .
. . .
. . .
. . .
. . Cash . .
. . .
. . .
. . .
. . .
. . .
. . .
. . .
. . .
. . .
. . .
. . .
. . .
. . .
. . .
. . .
. . .
. . .
. . .
. . . Restricted cash .
. . .
. . .
. . .
. . .
. . .
. . .
. . .
. . .
. . .
. . .
. . .
. . .
. . .
. . .
. . .
. . .
. . Receivables: Investment securities sold . .
. . .
. . .
. . .
. . .
. . .
. . .
. . .
. . .
. . .
. . .
. . .
. . .
. . Dividends . .
. . .
. . .
. . .
. . .
. . .
. . .
. . .
. . .
. . .
. . .
. . .
. . .
. . .
. . .
. . .
. . .
. . Dividend reclaims . .
. . .
. . .
. . .
. . .
. . .
. . .
. . .
. . .
. . .
. . .
. . .
. . .
. . .
. . .
. . Other assets . .
. . .
. . .
. . .
. . .
. . .
. . .
. . .
. . .
. . .
. . .
. . .
. . .
. . .
. . .
. . .
. . .
. . . Total Assets .
. . .
. . .
. . .
. . .
. . .
. . .
. . .
. . .
. . .
. . .
. . .
. . .
. . .
. . .
. . .
. . .
. . LIABILITIES: Investments sold short, at value (proceeds $9,270,052) . .
. . .
. . .
. . .
. . .
. . .
. . Payables: Investment advisory fees . .
. . .
. . .
. . .
. . .
. . .
. . .
. . .
. . .
. . .
. . .
. . .
. . .
. . . Other liabilities .
. . .
. . .
. . .
. . .
. . .
. . .
. . .
. . .
. . .
. . .
. . .
. . .
. . .
. . .
. . .
. . .
. . Total Liabilities . .
. . .
. . .
. . .
. . .
. . .
. . .
. . .
. . .
. . .
. . .
. . .
. . .
. . .
. . .
. . .
. NET ASSETS . . .
. . .
. . .
. . .
. . .
. . .
. . .
. . .
. . .
. . .
. . .
. . .
. . .
. . .
. . .
. . .
. . . NET ASSETS consist of: Paid-in capital .
. . .
. . .
. . .
. . .
. . .
. . .
. . .
. . .
. . .
. . .
. . .
. . .
. . .
. . .
. . .
. . .
. . Par value . .
. . .
. . .
. . .
. . .
. . .
. . .
. . .
. . .
. . .
. . .
. . .
. . .
. . .
. . .
. . .
. . .
. . .
. . . Accumulated net investment income (loss) .
. . .
. . .
. . .
. . .
. . .
. . .
. . .
. . .
. . .
. Accumulated net realized gain (loss) on investments and investments sold short . . .
. . .
. . .
. . .
. . .
. . .
. . .
. . .
. . .
. . .
. . .
. . .
. . .
. . .
. . .
. . .
. . .
. . . Net unrealized appreciation (depreciation) on investments and investments sold short .
. . .
. . .
. . .
. . .
. . .
. . .
. . .
. . .
. . .
. . .
. . .
. . .
. . .
. . . NET ASSETS .
. . .
. . .
. . .
. . .
. . .
. . .
. . .
. . .
. . .
. . .
. . .
. . .
. . .
. . .
. . .
. . .
. . $ 31,922,548 414,050 9,245,221 152,606 32,532 1,946 3,488 ___________________ 41,772,391 ___________________ 9,140,698 23,426 703 ___________________ 9,164,827 ___________________ $ 32,607,564 ___________________ ___________________ $ 32,218,776 10,000 (8,788) (203,283) 590,859 ___________________ $ 32,607,564 ___________________ ___________________ NET ASSET VALUE, per share . .
. . .
. . .
. . .
. . .
. . .
. . .
. . .
. . .
. . .
. . .
. . .
. . $ 32.61 ___________________ ___________________ Number of shares outstanding (unlimited number of shares authorized, par value $0.01 per share) . .
. . .
. . .
. . .
. . .
. . .
. . .
. . .
. . 1,000,002 ___________________ ___________________ See Notes to Financial Statements Page 17 . First Trust Long/Short Equity ETF (FTLS) Statement of Operations For the Year ended October 31, 2015 INVESTMENT INCOME: Dividends . . . .
. . .
. . .
. . .
. . .
. . .
. . .
. . .
. . .
. . .
. . .
. . .
. . .
. . .
. . .
. . .
. . .
. . . Foreign tax withholding .
. . .
. . .
. . .
. . .
. . .
. . .
. . .
. . .
. . .
. . .
. . .
. . .
. . .
. . .
. Total investment income . . .
. . .
. . .
. . .
. . .
. . .
. . .
. . .
. . .
. . .
. . .
. . .
. . .
. . EXPENSES: Investment advisory fees . .
. . .
. . .
. . .
. . .
. . .
. . .
. . .
. . .
. . .
. . .
. . .
. . .
. . .
. . Dividend expense on investments sold short . .
. . .
. . .
. . .
. . .
. . .
. . .
. . .
. . .
. . Total expenses . .
. . .
. . .
. . .
. . .
. . .
. . .
. . .
. . .
. . .
. . .
. . .
. . .
. . .
. . .
. . .
. . NET INVESTMENT INCOME (LOSS) . .
. . .
. . .
. . .
. . .
. . .
. . .
. . .
. . .
. . . NET REALIZED AND UNREALIZED GAIN (LOSS): Net realized gain (loss) on: Investments .
. . .
. . .
. . .
. . .
. . .
. . .
. . .
. . .
. . .
. . .
. . .
. . .
. . .
. . .
. . .
. . .
. . In-kind redemptions . .
. . .
. . .
. . .
. . .
. . .
. . .
. . .
. . .
. . .
. . .
. . .
. . .
. . .
. . . Investments sold short .
. . .
. . .
. . .
. . .
. . .
. . .
. . .
. . .
. . .
. . .
. . .
. . .
. . .
. . . Net realized gain (loss) .
. . .
. . .
. . .
. . .
. . .
. . .
. . .
. . .
. . .
. . .
. . .
. . .
. . .
. . .
. Net change in unrealized appreciation (depreciation) on: . . .
. . .
. . .
. . .
. . .
. . . Investments .
. . .
. . .
. . .
. . .
. . .
. . .
. . .
. . .
. . .
. . .
. . .
. . .
. . .
. . .
. . .
. . .
. . Investments sold short . .
. . .
. . .
. . .
. . .
. . .
. . .
. . .
. . .
. . .
. . .
. . .
. . .
. . .
. . Net change in unrealized appreciation (depreciation) . .
. . .
. . .
. . .
. . .
. . .
. . .
. NET REALIZED AND UNREALIZED GAIN (LOSS) . . .
. . .
. . .
. . .
. . .
. . NET INCREASE (DECREASE) IN NET ASSETS RESULTING FROM OPERATIONS . .
. . .
. . .
. . .
. . .
. . .
. . .
. . .
. . .
. . .
. . .
. . .
. . .
. . .
. Page 18 $ 256,161 (1,100) ___________________ 255,061 ___________________ 130,017 71,499 ___________________ 201,516 ___________________ 53,545 ___________________ (303,345) 418,430 58,189 ___________________ 173,274 ___________________ 410,230 131,530 ___________________ 541,760 ___________________ 715,034 ___________________ $ 768,579 ___________________ ___________________ See Notes to Financial Statements . First Trust Long/Short Equity ETF (FTLS) Statements of Changes in Net Assets For the Year Ended 10/31/2015 _______________ For the Period 9/8/2014 (a) through 10/31/2014 _______________ $ OPERATIONS: Net investment income (loss) . . . .
. . .
. . .
. . .
. . .
. . .
. . .
. . .
. . .
. . .
. . .
. . .
. . Net realized gain (loss) . .
. . .
. . .
. . .
. . .
. . .
. . .
. . .
. . .
. . .
. . .
. . .
. . .
. . .
. . . Net change in unrealized appreciation (depreciation) .
. . .
. . .
. . .
. . .
. . .
. . .
. . Net increase (decrease) in net assets resulting from operations . .
. . .
. . .
. . .
. . $ 53,545 173,274 541,760 _______________ 768,579 _______________ 4,614 1,726 49,099 _______________ 55,439 _______________ DISTRIBUTIONS TO SHAREHOLDERS FROM: Net investment income . .
. . .
. . .
. . .
. . .
. . .
. . .
. . .
. . .
. . .
. . .
. . .
. . .
. . .
. . . Net realized gain .
. . .
. . .
. . .
. . .
. . .
. . .
. . .
. . .
. . .
. . .
. . .
. . .
. . .
. . .
. . .
. . . Total distributions to shareholders .
. . .
. . .
. . .
. . .
. . .
. . .
. . .
. . .
. . .
. . .
. . .
. . (62,116) (2,000) _______________ (64,116) _______________ (1,620) — _______________ (1,620) _______________ SHAREHOLDER TRANSACTIONS: Proceeds from shares sold . .
. . .
. . .
. . .
. . .
. . .
. . .
. . .
. . .
. . .
. . .
. . .
. . .
. . .
. Cost of shares redeemed . . .
. . .
. . .
. . .
. . .
. . .
. . .
. . .
. . .
. . .
. . .
. . .
. . .
. . .
. Net increase (decrease) in net assets resulting from shareholder transactions . . .
. . .
. . .
. . .
. . .
. . .
. . .
. . .
. . .
. . .
. . .
. . .
. . .
. . . Total increase (decrease) in net assets .
. . .
. . .
. . .
. . .
. . .
. . .
. . .
. . .
. . .
. . .
. . 33,730,801 3,000,060 (4,881,579) _______________ — _______________ 28,849,222 _______________ 3,000,060 _______________ 29,553,685 3,053,879 NET ASSETS: Beginning of year . .
. . .
. . .
. . .
. . .
. . .
. . .
. . .
. . .
. . .
. . .
. . .
. . .
. . .
. . .
. . .
. . End of year . .
. . .
. . .
. . .
. . .
. . .
. . .
. . .
. . .
. . .
. . .
. . .
. . .
. . .
. . .
. . .
. . .
. . .
. 3,053,879 _______________ — _______________ $ 32,607,564 _______________ _______________ $ 3,053,879 _______________ _______________ Accumulated net investment income (loss) at end of year . . .
. . .
. . .
. . .
. . .
. . $ (8,788) _______________ _______________ $ 2,994 _______________ _______________ CHANGES IN SHARES OUTSTANDING: Shares outstanding, beginning of period . .
. . .
. . .
. . .
. . .
. . .
. . .
. . .
. . .
. . .
. . Shares sold . .
. . .
. . .
. . .
. . .
. . .
. . .
. . .
. . .
. . .
. . .
. . .
. . .
. . .
. . .
. . .
. . .
. . .
. Shares redeemed . . .
. . .
. . .
. . .
. . .
. . .
. . .
. . .
. . .
. . .
. . .
. . .
. . .
. . .
. . .
. . .
. Shares outstanding, end of period . . .
. . .
. . .
. . .
. . .
. . .
. . .
. . .
. . .
. . .
. . .
. . . 100,002 1,050,000 (150,000) _______________ 1,000,002 _______________ _______________ — 100,002 — _______________ 100,002 _______________ _______________ (a) Inception date is consistent with the commencement of investment operations and is the date the initial creation units were established. See Notes to Financial Statements Page 19 .
First Trust Long/Short Equity ETF (FTLS) Financial Highlights For a share outstanding throughout each period Year Ended October 31, 2015 _________________ Net asset value, beginning of period . . . .
. . .
. . .
. . . Income from investment operations: Net investment income (loss) .
. . .
. . .
. . .
. . .
. . .
. . . Net realized and unrealized gain (loss) .
. . .
. . .
. . .
. Total from investment operations . . .
. . .
. . .
. . .
. . . Distributions paid to shareholders from: Net investment income .
. . .
. . .
. . .
. . .
. . .
. . .
. . .
. . Net realized gain . .
. . .
. . .
. . .
. . .
. . .
. . .
. . .
. . .
. . Total distributions . .
. . .
. . .
. . .
. . .
. . .
. . .
. . .
. . .
. . Net asset value, end of period . .
. . .
. . .
. . .
. . .
. . .
. TOTAL RETURN (b) . . .
. . .
. . .
. . .
. . .
. . .
. . .
. . . RATIOS/SUPPLEMENTAL DATA: Net assets, end of period (in 000’s) .
. . .
. . .
. . .
. . .
. Ratios to average net assets: Ratio of total expenses to average net assets . . .
. . .
. Ratio of total expenses to average net assets excluding dividend expense . . .
. . .
. . .
. . .
. . .
. . . Ratio of net investment income (loss) to average net assets .
. . .
. . .
. . .
. . .
. . .
. . .
. . .
. . .
. . .
. . .
. . Portfolio turnover rate (d) . .
. . .
. . .
. . .
. . .
. . .
. . .
. For the Period 9/8/2014 (a) through 10/31/2014 _________________ $ 30.54 __________ $ 30.00 __________ 0.19 2.12 __________ 2.31 __________ 0.05 0.51 __________ 0.56 __________ (0.22) (0.02) __________ (0.24) __________ $ 32.61 __________ __________ 7.60% (0.02) — __________ (0.02) __________ $ 30.54 __________ __________ 1.86% $ 32,608 $ 3,054 1.47% 1.17% (c) 0.95% 0.95% (c) 0.39% 267% 1.08% (c) 1% (a) Inception date is consistent with the commencement of investment operations and is the date the initial creation units were established. (b) Total return is calculated assuming an initial investment made at the net asset value at the beginning of the period, reinvestment of all distributions at net asset value during the period, and redemption at net asset value on the last day of the period. The returns presented do not reflect the deduction of taxes that a shareholder would pay on Fund distributions or the redemption or sale of Fund shares. Total return is calculated for the time period presented and is not annualized for periods of less than a year. (c) Annualized. (d) Portfolio turnover is calculated for the time period presented and is not annualized for periods of less than a year and does not include securities received or delivered from processing creations or redemptions and in-kind transactions. Page 20 See Notes to Financial Statements .
Notes to Financial Statements First Trust Long/Short Equity ETF (FTLS) October 31, 2015 1. Organization First Trust Exchange-Traded Fund III (the “Trust”) is a non-diversified open-end management investment company organized as a Massachusetts business trust on January 9, 2008, and is registered with the Securities and Exchange Commission under the Investment Company Act of 1940, as amended (the “1940 Act”). The Trust currently consists of four funds that are offering shares. This report covers the First Trust Long/Short Equity ETF (the “Fund”), which trades under the ticker “FTLS” on the NYSE Arca, Inc. Unlike conventional mutual funds, the Fund issues and redeems shares on a continuous basis, at net asset value (“NAV”), only in large specified blocks consisting of 50,000 shares called a “Creation Unit.” Creation Units are issued and redeemed for securities in which the Fund invests or for cash or, in certain circumstances, a combination of both.
Except when aggregated in Creation Units, the shares are not redeemable securities of the Fund. The investment objective of the Fund is to seek to provide investors with long-term total return. The Fund pursues its investment objective by establishing long and short positions in a portfolio of equity securities. Under normal circumstances, at least 80% of the Fund’s net assets (plus the amount of any borrowing for investment purposes) will be exposed to U.S.
exchange-listed equity securities of U.S. and foreign companies by investing in such securities directly and/or in U.S. exchange-traded funds (“ETFs”) that provide exposure to such securities.
The equity securities held by the Fund may include U.S. exchange-listed equity securities of foreign issuers, as well as investments in the equity securities of foreign issuers that are in the form of depositary receipts. There can be no assurance that the Fund will achieve its investment objective.
The Fund may not be appropriate for all investors. 2. Significant Accounting Policies The Fund, which is an investment company within the scope of Financial Accounting Standards Board (“FASB”) Accounting Standards Update 2013-08, follows accounting and reporting guidance under FASB Accounting Standards Codification Topic 946, “Financial Services-Investment Companies.” The following is a summary of significant accounting policies consistently followed by the Fund in the preparation of the financial statements. The preparation of the financial statements in accordance with accounting principles generally accepted in the United States of America (“U.S.
GAAP”) requires management to make estimates and assumptions that affect the reported amounts and disclosures in the financial statements. Actual results could differ from those estimates. A. Portfolio Valuation The Fund’s NAV is determined daily as of the close of regular trading on the New York Stock Exchange (“NYSE”), normally 4:00 p.m. Eastern time, on each day the NYSE is open for trading.
If the NYSE closes early on a valuation day, the NAV is determined as of that time. Domestic debt securities and foreign securities are priced using data reflecting the earlier closing of the principal markets for those securities. The Fund’s NAV is calculated by dividing the value of all assets of the Fund (including accrued interest and dividends), less all liabilities (including accrued expenses and dividends declared but unpaid), by the total number of shares outstanding. The Fund’s investments are valued daily at market value or, in the absence of market value with respect to any portfolio securities, at fair value.
Market value prices represent last sale or official closing prices from a national or foreign exchange (i.e., a regulated market) and are primarily obtained from third-party pricing services. Fair value prices represent any prices not considered market value prices and are either obtained from a third-party pricing service or are determined by the Pricing Committee of the Fund’s investment advisor, First Trust Advisors L.P. (“First Trust” or the “Advisor”), in accordance with valuation procedures adopted by the Trust’s Board of Trustees, and in accordance with provisions of the 1940 Act.
Investments valued by the Advisor’s Pricing Committee, if any, are footnoted as such in the footnotes to the Portfolio of Investments. The Fund’s investments are valued as follows: Common stocks and other equity securities listed on any national or foreign exchange (excluding The NASDAQ® Stock Market LLC (“NASDAQ”) and the London Stock Exchange Alternative Investment Market (“AIM”)) are valued at the last sale price on the exchange on which they are principally traded or, for NASDAQ and AIM securities, the official closing price. Securities traded on one or more than one securities exchange are valued at the last sale price or official closing price, as applicable, at the close of the securities exchange representing the principal market for such securities. Securities traded in an over-the-counter market are fair valued at the mean of their most recent bid and asked price, if available, and otherwise at their closing bid price. Certain securities may not be able to be priced by pre-established pricing methods. Such securities may be valued by the Trust’s Board of Trustees or its delegate, the Advisor’s Pricing Committee, at fair value.
These securities generally include, but are not limited to, restricted securities (securities which may not be publicly sold without registration under the Securities Act of 1933, as amended, for which a pricing service is unable to provide a market price; securities whose trading has been formally suspended; a Page 21 . Notes to Financial Statements (Continued) First Trust Long/Short Equity ETF (FTLS) October 31, 2015 security whose market or fair value price is not available from a pre-established pricing source; a security with respect to which an event has occurred that is likely to materially affect the value of the security after the market has closed but before the calculation of the Fund’s NAV or make it difficult or impossible to obtain a reliable market quotation; and a security whose price, as provided by the pricing service, does not reflect the security’s fair value. As a general principle, the current fair value of a security would appear to be the amount which the owner might reasonably expect to receive for the security upon its current sale. When fair value prices are used, generally they will differ from market quotations or official closing prices on the applicable exchanges. A variety of factors may be considered in determining the fair value of such securities, including, but not limited to, the following: 1) the type of security; 2) the size of the holding; 3) the initial cost of the security; 4) transactions in comparable securities; 5) price quotes from dealers and/or pricing services; 6) relationships among various securities; 7) information obtained by contacting the issuer, analysts, or the appropriate stock exchange; 8) an analysis of the issuer’s financial statements; and 9) the existence of merger proposals or tender offers that might affect the value of the security. The Fund is subject to fair value accounting standards that define fair value, establish the framework for measuring fair value and provide a three-level hierarchy for fair valuation based upon the inputs to the valuation as of the measurement date.
The three levels of the fair value hierarchy are as follows: • Level 1 – Level 1 inputs are quoted prices in active markets for identical investments. An active market is a market in which transactions for the investment occur with sufficient frequency and volume to provide pricing information on an ongoing basis. • Level 2 – Level 2 inputs are observable inputs, either directly or indirectly, and include the following: o Quoted prices for similar investments in active markets. o Quoted prices for identical or similar investments in markets that are non-active. A non-active market is a market where there are few transactions for the investment, the prices are not current, or price quotations vary substantially either over time or among market makers, or in which little information is released publicly. o Inputs other than quoted prices that are observable for the investment (for example, interest rates and yield curves observable at commonly quoted intervals, volatilities, prepayment speeds, loss severities, credit risks, and default rates). o Inputs that are derived principally from or corroborated by observable market data by correlation or other means. • Level 3 – Level 3 inputs are unobservable inputs.
Unobservable inputs may reflect the reporting entity’s own assumptions about the assumptions that market participants would use in pricing the investment. The inputs or methodologies used for valuing investments are not necessarily an indication of the risk associated with investing in those investments. A summary of the inputs used to value the Fund’s investments as of October 31, 2015, is included with the Fund’s Portfolio of Investments. B. Securities Transactions and Investment Income Securities transactions are recorded as of the trade date.
Realized gains and losses from securities transactions are recorded on the identified cost basis. Dividend income is recorded on the ex-dividend date. Distributions received from the Fund’s investments in real estate investment trusts (“REITs”) may be comprised of return of capital, capital gains and income. The actual character of the amounts received during the year are not known until after the REIT’s fiscal year end.
The Fund records the character of distributions received from the REITs during the year based on estimates available. The characterization of distributions received by the Fund may be subsequently revised based on information received from the REITs after their tax reporting periods conclude. C. Short Sales Short sales are utilized for investment and risk management purposes and are transactions in which securities or other instruments (such as options forwards, futures or other derivative contracts) are sold that are not currently owned in the Fund’s portfolio.
When the Fund engages in a short sale, the Fund must borrow the security sold short and deliver the security to the counterparty. Short selling allows the Fund to profit from a decline in a market price to the extent such decline exceeds the transaction costs and the costs of borrowing the securities. The Fund will pay a fee or premium to borrow the securities and is obligated to repay the lenders of the securities.
Any dividends or interest that accrues on the securities during the period of the loan are due to the lenders. A gain, limited to the price at which the security was sold short, or a loss, unlimited in size, will be recognized upon the termination of the Page 22 . Notes to Financial Statements (Continued) First Trust Long/Short Equity ETF (FTLS) October 31, 2015 short sale; which is effected by the Fund purchasing the security sold short in the market and delivering the security to the lender. Any such gain or loss may be offset, completely or in part, by the change in the value of the long portion of the Fund’s portfolio. The Fund is subject to the risk that it may be unable to reacquire a security to terminate a short position except at a price substantially in excess of the last quoted price. Also, there is the risk that the counterparty to a short sale may fail to honor its contractual terms, causing a loss to the Fund. The Fund has established an account with Pershing, LLC for the purpose of purchasing securities on margin.
The Fund pays interest on any margin balance, which is calculated as the daily margin account balance times the broker’s margin interest rate. Restricted cash in the amount of $9,245,221, as shown on the Statement of Assets and Liabilities, is associated with collateral at the broker as of October 31, 2015. D. Dividends and Distributions to Shareholders Dividends from net investment income, if any, are declared and paid quarterly, or as the Board of Trustees may determine from time to time.
Distributions of net realized capital gains earned by the Fund, if any, will be distributed at least annually. Distributions from income and capital gains are determined in accordance with income tax regulations, which may differ from U.S. GAAP. Certain capital accounts in the financial statements are periodically adjusted for permanent differences in order to reflect their tax character. These permanent differences are primarily due to the varying treatment of income and gain/loss on portfolio securities held by the Fund and have no impact on net assets or net asset value per share.
Temporary differences, which arise from recognizing certain items of income, expense and gain/loss in different periods for financial statement and tax purposes, will reverse at some time in the future. Permanent differences incurred during the year ended October 31, 2015, resulting in book and tax accounting differences, have been reclassified at year end to reflect a decrease in accumulated net investment income (loss) by $3,211, a decrease in accumulated net realized gain (loss) on investments by $376,283 and an increase in paid-in-capital by $379,494. Net assets were not affected by this reclassification. The tax character of distributions paid during the fiscal year ended October 31, 2015 and fiscal period ended October 31, 2014 was as follows: Distributions paid from: Ordinary income .
. . .
. . .
. . .
. . .
. . .
. . .
. . .
. . .
. . .
. $ 2015 64,116 $ 2014 1,620 As of October 31, 2015, the components of distributable earnings on a tax basis to the Fund were as follows: Undistributed ordinary income . . .
. . .
. . .
. . .
. . .
. . . Accumulated capital and other losses .
. . .
. . .
. . .
. . . Net unrealized appreciation (depreciation) .
. . .
. . .
. . $ — (90,580) 469,368 E. Income Taxes The Fund intends to continue to qualify as a regulated investment company by complying with the requirements under Subchapter M of the Internal Revenue Code of 1986, as amended, which includes distributing substantially all of its net investment income and net realized gains to shareholders.
Accordingly, no provision has been made for federal or state income taxes. However, due to the timing and amount of distributions, the Fund may be subject to an excise tax of 4% of the amount by which approximately 98% of the Fund’s taxable income exceeds the distributions from such taxable income for the calendar year. The Fund is subject to accounting standards that establish a minimum threshold for recognizing, and a system for measuring, the benefits of a tax position taken or expected to be taken in a tax return. The taxable years ended 2014 and 2015 remain open to federal and state audit.
As of October 31, 2015, management has evaluated the application of these standards to the Fund, and has determined that no provision for income tax is required in the Fund’s financial statements for uncertain tax positions. The Fund intends to utilize provisions of the federal income tax laws, which allow it to carry a realized capital loss forward indefinitely following the year of the loss and offset such loss against any future realized capital gains. The Fund is subject to certain limitations under U.S. tax rules on the use of capital loss carryforwards and net unrealized built-in-losses.
These limitations apply when there has been a 50% change in ownership. At October 31, 2015, the Fund had non-expiring capital loss carryforwards for federal income tax purposes of $90,580. Certain losses realized during the current fiscal year may be deferred and treated as occurring on the first day of the following fiscal year for federal income tax purposes. For the fiscal year ended October 31, 2015, the Fund had no net ordinary losses. Page 23 .
Notes to Financial Statements (Continued) First Trust Long/Short Equity ETF (FTLS) October 31, 2015 In order to present paid-in capital, accumulated net investment income (loss) and accumulated net realized gain (loss) on investments on the Statement of Assets and Liabilities that more closely represent their tax character, certain adjustments have been made to paidin capital, accumulated net investment income (loss) and accumulated net realized gain (loss) on investments. These adjustments are primarily due to the difference between book and tax treatments of income and gains on various investment securities held by the Fund and in-kind transactions. The results of operations and net assets were not affected by these adjustments. F. Expenses Expenses, other than the investment advisory fee, dividend expenses on investments sold short and other excluded expenses, are paid by the Advisor (See Note 3). 3.
Investment Advisory Fee, Affiliated Transactions and Other Fee Arrangements First Trust, the investment advisor to the Fund, is a limited partnership with one limited partner, Grace Partners of DuPage L.P., and one general partner, The Charger Corporation. The Charger Corporation is an Illinois corporation controlled by James A. Bowen, Chief Executive Officer of First Trust.
First Trust is responsible for the selection and ongoing monitoring of the securities in the Fund’s portfolio, managing the Fund’s business affairs and providing certain administrative services necessary for the management of the Fund. Pursuant to the Investment Management Agreement, First Trust manages the investment of the Fund’s assets and is responsible for the Fund’s expenses, including the cost of transfer agency, custody, fund administration, legal, audit and other services, but excluding fee payments under the Investment Management Agreement, interest, taxes, brokerage commissions and other expenses connected with the execution of portfolio transactions, distribution and service fees pursuant to a 12b-1 plan, if any, acquired fund fees and expenses, dividend expenses on investments sold short and extraordinary expenses. The Fund has agreed to pay First Trust an annual unitary management fee equal to 0.95% of its average daily net assets. First Trust also provides fund reporting services to the Fund for a flat annual fee in the amount of $9,250, which is covered under the annual unitary management fee. The Fund has multiple service agreements with Brown Brothers Harriman & Co.
(“BBH”). Under the service agreements, BBH performs custodial, fund accounting, certain administrative services, and transfer agency services for the Fund. As custodian, BBH is responsible for custody of the Fund’s assets.
As fund accountant and administrator, BBH is responsible for maintaining the books and records of the Fund’s securities and cash. As transfer agent, BBH is responsible for maintaining shareholder records for the Fund. Each Trustee who is not an officer or employee of First Trust, any sub-advisor or any of their affiliates (“Independent Trustees”) is paid a fixed annual retainer that is allocated pro rata among each fund in the First Trust Fund Complex based on net assets. Each Independent Trustee is also paid an annual per fund fee that varies based on whether the fund is a closed-end or other actively managed fund, or is an index fund. Additionally, the Lead Independent Trustee and the Chairmen of the Audit Committee, Nominating and Governance Committee and Valuation Committee are paid annual fees to serve in such capacities, with such compensation allocated pro rata among each fund in the First Trust Fund Complex based on net assets.
Trustees are reimbursed for travel and out-of-pocket expenses in connection with all meetings. The Lead Independent Trustee and Committee Chairmen rotate every three years. The officers and “Interested” Trustee receive no compensation from the Trust for acting in such capacities. 4.
Purchases and Sales of Securities For the year ended October 31, 2015, the cost of purchases and proceeds from sales of investments, excluding short-term investments and in-kind transactions, for the Fund were $36,304,786 and $45,096,160, respectively. The cost of purchases to cover short sales and the proceeds of short sales were $7,836,819 and $16,556,153, respectively. For the year ended October 31, 2015, the cost of in-kind purchases and proceeds from in-kind sales for the Fund was $33,332,729 and $4,859,907, respectively. 5. Creations, Redemptions and Transaction Fees Shares are created and redeemed by the Fund only in Creation Unit size aggregations of 50,000 shares in transactions with brokerdealers or large institutional investors that have entered into a participation agreement (an “Authorized Participant”).
In order to purchase Creation Units of the Fund, an Authorized Participant must deposit (i) a designated portfolio of securities determined by First Trust (the “Deposit Securities”) and generally make or receive a cash payment referred to as the “Cash Component,” which is an amount equal to Page 24 . Notes to Financial Statements (Continued) First Trust Long/Short Equity ETF (FTLS) October 31, 2015 the difference between the NAV of the Fund shares (per Creation Unit aggregations) and the market value of the Deposit Securities, and/or (ii) cash in lieu of all or a portion of the Deposit Securities. If the Cash Component is a positive number (i.e., the NAV per Creation Unit Aggregation exceeds the Deposit Amount), the Authorized Participant will deliver the Cash Component. If the Cash Component is a negative number (i.e., the NAV per Creation Unit Aggregation is less than the Deposit Amount), the Authorized Participant will receive the Cash Component. Purchasers of Creation Units must pay to BBH, as transfer agent, a creation fee (the “Creation Transaction Fee”) regardless of the number of Creation Units purchased in the transaction.
The Creation Transaction Fee may vary and is based on the composition of the securities included in the Fund’s portfolio and the countries in which the transactions are settled. The Creation Transaction Fee may increase or decrease as the Fund’s portfolio is adjusted to conform to changes in the composition of the securities included in the Fund’s portfolio and the countries in which the transaction settled. The Creation Transaction fee is currently $550.
The price for each Creation Unit will equal the daily NAV per share times the number of shares in a Creation Unit plus the fees described above and, if applicable, any operational processing and brokerage costs, transfer fees or stamp taxes. When the Fund permits an Authorized Participant to substitute cash or a different security in lieu of depositing one or more of the requisite Deposit Securities, the Authorized Participant may also be assessed an amount to cover the cost of purchasing the Deposit Securities and/or disposing of the substituted securities, including operational processing and brokerage costs, transfer fees, stamp taxes, and part or all of the spread between the expected bid and offer side of the market related to such Deposit Securities and/or substitute securities. Authorized Participants redeeming Creation Units must pay to BBH, as transfer agent, a redemption transaction fee (the “Redemption Transaction Fee”), regardless of the number of Creation Units redeemed in the transaction. The Redemption Transaction Fee may vary and is based on the composition of the securities included in the Fund’s portfolio and the countries in which the transactions are settled.
The Redemption Transaction Fee is currently $550. The Fund reserves the right to effect redemptions in cash. An Authorized Participant may request cash redemption in lieu of securities; however, the Fund may, in its discretion, reject any such request. 6.
Distribution Plan The Board of Trustees adopted a Distribution and Service Plan pursuant to Rule 12b-1 under the 1940 Act. In accordance with the Rule 12b-1 plan, the Fund is authorized to pay an amount up to 0.25% of its average daily net assets each year to reimburse FTP, the distributor of the Fund, for amounts expended to finance activities primarily intended to result in the sale of Creation Units or the provision of investor services. FTP may also use this amount to compensate securities dealers or other persons that are Authorized Participants for providing distribution assistance, including broker-dealer and shareholder support and educational and promotional services. No 12b-1 fees are currently paid by the Fund, and pursuant to a contractual arrangement, no 12b-1 fees will be paid any time before August 26, 2016. 7.
Indemnification The Trust, on behalf of the Fund, has a variety of indemnification obligations under contracts with its service providers. The Trust’s maximum exposure under these arrangements is unknown. However, the Trust has not had prior claims or losses pursuant to these contracts and expects the risk of loss to be remote. 8.
Adoption of Non-fundamental Investment Policy On March 27, 2015, the Board of Trustees of the Trust approved the adoption of a non-fundamental investment policy regarding the Fund’s ability to invest in other investment companies (the “Policy”). Pursuant to the Policy, beginning on June 7, 2015, the Fund no longer relies on Section 12(2)(1)(F) or Section 12(d)(1)(G) of the 1940 Act to invest in other investment companies. 9. Subsequent Events Management has evaluated the impact of all subsequent events to the Fund through the date the financial statements were issued, and has determined there was the following subsequent event: At a meeting on December 7, 2015, the Board accepted Mr.
Bradley’s resignation from his position as the President and Chief Executive Officer of the Trust, effective December 31, 2015. At the same meeting, the Board elected Mr. Dykas to serve as the President and Chief Executive Officer and Mr.
Donald Swade, formerly an Assistant Treasurer of the Trust, to serve as the Treasurer, Chief Financial Officer and Chief Accounting Officer of the Trust. Page 25 . Report of Independent Registered Public Accounting Firm To the Board of Trustees and Shareholders of First Trust Long/Short Equity ETF: We have audited the accompanying statement of assets and liabilities of First Trust Long/Short Equity ETF (the “Fund”), a series of the First Trust Exchange-Traded Fund III, including the portfolio of investments, as of October 31, 2015, and the related statement of operations for the year then ended, and the statements of changes in net assets and the financial highlights for each of the periods presented. These financial statements and financial highlights are the responsibility of the Fund’s management. Our responsibility is to express an opinion on these financial statements and financial highlights based on our audits. We conducted our audits in accordance with the standards of the Public Company Accounting Oversight Board (United States). Those standards require that we plan and perform the audit to obtain reasonable assurance about whether the financial statements and financial highlights are free of material misstatement. The Fund is not required to have, nor were we engaged to perform, an audit of its internal control over financial reporting.
Our audits included consideration of internal control over financial reporting as a basis for designing audit procedures that are appropriate in the circumstances, but not for the purpose of expressing an opinion on the effectiveness of the Fund’s internal control over financial reporting. Accordingly, we express no such opinion. An audit also includes examining, on a test basis, evidence supporting the amounts and disclosures in the financial statements, assessing the accounting principles used and significant estimates made by management, as well as evaluating the overall financial statement presentation.
Our procedures included confirmation of securities owned as of October 31, 2015 by correspondence with the Fund’s custodian and brokers; when replies were not received from brokers, we performed other auditing procedures. We believe that our audits provide a reasonable basis for our opinion. In our opinion, the financial statements and financial highlights referred to above present fairly, in all material respects, the financial position of First Trust Long/Short Equity ETF as of October 31, 2015, the results of its operations for the year then ended, and the changes in its net assets and the financial highlights for each of the periods presented, in conformity with accounting principles generally accepted in the United States of America. Chicago, Illinois December 23, 2015 Page 26 . Additional Information First Trust Long/Short Equity ETF (FTLS) October 31, 2015 (Unaudited) Proxy Voting Policies and Procedures A description of the policies and procedures that the Trust uses to determine how to vote proxies and information on how the Fund voted proxies relating to portfolio investments during the most recent 12-month period ended June 30 is available (1) without charge, upon request, by calling (800) 988-5891; (2) on the Fund’s website located at http://www.ftportfolios.com; and (3) on the Securities and Exchange Commission’s (“SEC”) website located at http://www.sec.gov. Portfolio Holdings The Trust files its complete schedule of portfolio holdings with the SEC for the first and third quarters of each fiscal year on Form NQ. The Trust’s Forms N-Q are available (1) by calling (800) 988-5891; (2) on the Fund’s website located at http://www.ftportfolios.com; (3) on the SEC’s website at http://www.sec.gov; and (4) for review and copying at the SEC’s Public Reference Room (“PRR”) in Washington, DC. Information regarding the operation of the PRR may be obtained by calling (800) SEC-0330. Federal Tax Information For the taxable year ended October 31, 2015, the following percentages of income dividend paid by the Fund qualify for the dividends received deduction available to corporations and is hereby designated as qualified dividend income: Dividends Received Deduction _________________________________ Qualified Dividend Income _________________________________ 100% 100% Risk Considerations You could lose money by investing in the Fund. An investment in the Fund is not a deposit of a bank and is not insured or guaranteed by the Federal Deposit Insurance Corporation or any other governmental agency.
There can be no assurance that the Fund’s investment objective will be achieved. CASH TRANSACTIONS RISK. The Fund may, under certain circumstances, effect a portion of creations and redemptions for cash, rather than in-kind securities, particularly for the puts and call options in which the Fund invests. As a result, an investment in the Fund may be less tax-efficient than an investment in an ETF that effects its creations and redemption for in-kind securities. Because the Fund may effect a portion of redemptions for cash, it may be required to sell portfolio securities in order to obtain the cash needed to distribute redemption proceeds.
A sale of shares may result in capital gains or losses, and may also result in higher brokerage costs. DEPOSITARY RECEIPTS RISK. Depositary receipts may be less liquid than the underlying shares in their primary trading market. Any distributions paid to the holders of depositary receipts are usually subject to a fee charged by the depositary.
Holders of depositary receipts may have limited voting rights, and investment restrictions in certain countries may adversely impact the value of depositary receipts because such restrictions may limit the ability to convert the equity shares into depositary receipts and vice versa. Such restrictions may cause the equity shares of the underlying issuer to trade at a discount or premium to the market price of the depositary receipts. DERIVATIVES RISK. The use of futures and other derivatives can lead to losses because of adverse movements in the price or value of the underlying asset, index or rate, which may be magnified by certain features of the derivatives. These risks are heightened when the Fund’s portfolio managers use derivatives to enhance the Fund’s return or as a substitute for a position or security, rather than solely to hedge (or offset) the risk of a position or security held by the Fund. EQUITY SECURITIES RISK.
The Fund invests in Equity Securities. The value of the shares will fluctuate with changes in the value of these Equity Securities. Equity Securities prices fluctuate for several reasons, including changes in investors’ perceptions of the financial condition of an issuer or the general condition of the relevant stock market, such as the current market volatility, or when political or economic events affecting the issuers occur.
In addition, common stock prices may be particularly sensitive to rising interest rates, as the cost of the capital rises and borrowing costs increase. ETF RISK. The Fund may invest in the shares of other ETFs, and therefore, the Fund’s investment performance and risks may be related to the investment performance and risks of the underlying ETFs. In general, as a shareholder in other ETFs, the Fund bears its ratable share of the underlying ETF’s expenses, and would be subject to duplicative expenses to the extent the Fund invests in other ETFs. Page 27 .
Additional Information (Continued) First Trust Long/Short Equity ETF (FTLS) October 31, 2015 (Unaudited) MANAGEMENT RISK. The Fund is subject to management risk because it is an actively managed portfolio. In managing the Fund’s investment portfolio, the Fund’s investment advisor will apply investment techniques and risk analyses that may not have the desired result. There can be no guarantee that the Fund will meet its investment objective. MARKET RISK.
Market risk is the risk that a particular security owned by the Fund or shares of the Fund in general may fall in value. Securities are subject to market fluctuations caused by such factors as economic, political, regulatory or market developments, changes in interest rates and perceived trends in securities prices. Overall securities values could decline generally or could underperform other investments. NEW FUND RISK.
The Fund currently has fewer assets than larger funds, and like other relatively new funds, large inflows and outflows may impact the Fund’s market exposure for limited periods of time. This impact may be positive or negative, depending on the direction of market movement during the period affected. Also, during the initial invest-up period, the Fund may depart from its principal investment strategies and invest a larger amount or all of its assets in cash equivalents or it may hold cash. NON-DIVERSIFICATION RISK.
The Fund is classified as “non-diversified” under the Investment Company Act of 1940, as amended (the “1940 Act”). As a result, the Fund is only limited as to the percentage of its assets that may be invested in the securities of any one issuer by the diversification requirements imposed by the Internal Revenue Code of 1986, as amended (the “Code”). The Fund may invest a relatively high percentage of its assets in a limited number of issuers.
As a result, the Fund may be more susceptible to a single adverse economic or regulatory occurrence affecting one or more of these issuers, experience increased volatility and be highly invested in certain issuers. NON-U.S. SECURITIES RISK. The Fund holds non-U.S.
securities that are either directly listed on a U.S. securities exchange or in the form of depositary receipts. Non-U.S.
securities are subject to higher volatility than securities of domestic issuers due to possible adverse political, social or economic developments; restrictions on foreign investment or exchange of securities; lack of liquidity; currency exchange rates; excessive taxation; government seizure of assets; different legal or accounting standards; and less government supervision and regulation of exchanges in foreign countries. SHORT SALES RISK. The Fund will incur a loss as a result of a short sale if the price of the security sold short increases in value between the date of the short sale and the date on which the Fund purchases the security to replace the borrowed security. In addition, a lender of a security may request, or market conditions may dictate, that securities sold short be returned to the lender on short notice, which may result in the Fund having to buy the securities sold short at an unfavorable price.
If this occurs, any anticipated gain to the Fund may be reduced or eliminated or the short sale may result in a loss. In a rising stock market, the Fund’s short positions may significantly impact the Fund’s overall performance and cause the Fund to underperform traditional long-only equity funds or to sustain losses, particularly in a sharply rising market. The use of short sales may also cause the Fund to have higher expenses than other funds. Page 28 .
Board of Trustees and Officers First Trust Long/Short Equity ETF (FTLS) October 31, 2015 (Unaudited) The Trust’s statement of additional information includes additional information about the Trustees and is available, without charge, upon request, by calling (800) 988-5891. Name, Address, Date of Birth and Position with the Trust Term of Office and Year First Elected or Appointed Principal Occupations During Past 5 Years Number of Portfolios in the First Trust Fund Complex Overseen by Trustee Other Trusteeships or Directorships Held by Trustee During Past 5 Years INDEPENDENT TRUSTEES Richard E. Erickson, Trustee c/o First Trust Advisors L.P. 120 East Liberty Drive, Suite 400 Wheaton, IL 60187 D.O.B.: 04/51 Thomas R. Kadlec, Trustee c/o First Trust Advisors L.P. 120 East Liberty Drive, Suite 400 Wheaton, IL 60187 D.O.B.: 11/57 • Indefinite Term • Since Inception • Indefinite Term • Since Inception Robert F. Keith, Trustee c/o First Trust Advisors L.P. 120 East Liberty Drive, Suite 400 Wheaton, IL 60187 D.O.B.: 11/56 • Indefinite Term Niel B.
Nielson, Trustee c/o First Trust Advisors L.P. 120 East Liberty Drive, Suite 400 Wheaton, IL 60187 D.O.B.: 03/54 • Indefinite Term • Since Inception • Since Inception Physician; President, Wheaton Orthopedics; Limited Partner, Gundersen Real Estate Limited Partnership; Member, Sportsmed LLC 117 None President (March 2010 to Present), Senior Vice President and Chief Financial Officer (May 2007 to March 2010), ADM Investor Services, Inc. (Futures Commission Merchant) 117 Director of ADM Investor Services, Inc., ADM Investor Services International, and Futures Industry Association President (2003 to Present), Hibs Enterprises (Financial and Management Consulting) 117 Director of Trust Company of Illinois Managing Director and Chief Operating Officer (January 2015 to Present), Pelita Harapan Educational Foundation (Educational Products and Services); President and Chief Executive Officer (June 2012 to September 2014), Servant Interactive LLC (Educational Products and Services); President and Chief Executive Officer (June 2012 to September 2014), Dew Learning LLC (Educational Products and Services); President (June 2002 to June 2012), Covenant College 117 Director of Covenant Transport, Inc. (May 2003 to May 2014) 117 None INTERESTED TRUSTEE James A. Bowen(1), Trustee, Chairman of the Board 120 East Liberty Drive, Suite 400 Wheaton, IL 60187 D.O.B.: 09/55 (1) • Indefinite Term • Since Inception Chief Executive Officer (December 2010 to Present), President (until December 2010), First Trust Advisors L.P.
and First Trust Portfolios L.P.; Chairman of the Board of Directors, BondWave LLC (Software Development Company/Investment Advisor and Stonebridge Advisors LLC (Investment Advisor) Mr. Bowen is deemed an “interested person” of the Trust due to his position as Chief Executive Officer of First Trust Advisors L.P., investment advisor of the Trust. Page 29 . Board of Trustees and Officers (Continued) First Trust Long/Short Equity ETF (FTLS) October 31, 2015 (Unaudited) Name, Address and Date of Birth Position and Offices with Trust Term of Office and Length of Service Principal Occupations During Past 5 Years OFFICERS WHO ARE NOT TRUSTEES(2) Mark R. Bradley 120 E. Liberty Drive, Suite 400 Wheaton, IL 60187 D.O.B.: 11/57 President and Chief Executive Officer James M. Dykas 120 E.
Liberty Drive, Suite 400 Wheaton, IL 60187 D.O.B.: 01/66 Treasurer, Chief Financial Officer and Chief Accounting Officer W. Scott Jardine 120 E. Liberty Drive, Suite 400 Wheaton, IL 60187 D.O.B.: 05/60 Secretary and Chief Legal Officer Daniel J.
Lindquist 120 E. Liberty Drive, Suite 400 Wheaton, IL 60187 D.O.B.: 02/70 Vice President Kristi A. Maher 120 E.
Liberty Drive, Suite 400 Wheaton, IL 60187 D.O.B.: 12/66 Chief Compliance Officer and Assistant Secretary Roger F. Testin 120 E. Liberty Drive, Suite 400 Wheaton, IL 60187 D.O.B.: 06/66 Vice President Stan Ueland 120 E.
Liberty Drive, Suite 400 Wheaton, IL 60187 D.O.B.: 11/70 Vice President (2) • Indefinite Term • Since Inception • Indefinite Term • Since Inception • Indefinite Term • Since Inception • Indefinite Term • Since Inception • Indefinite Term Chief Operating Officer (December 2010 to Present) and Chief Financial Officer, First Trust Advisors L.P. and First Trust Portfolios L.P.; Chief Financial Officer, BondWave LLC (Software Development Company/Investment Advisor) and Stonebridge Advisors LLC (Investment Advisor) Controller (January 2011 to Present), Senior Vice President (April 2007 to Present), First Trust Advisors L.P. and First Trust Portfolios L.P. General Counsel, First Trust Advisors L.P., First Trust Portfolios L.P.; Secretary and General Counsel, BondWave LLC (Software Development Company/Investment Advisor); Secretary of Stonebridge Advisors LLC (Investment Advisor) Managing Director (July 2012 to Present), Senior Vice President (September 2005 to July 2012), First Trust Advisors L.P.
and First Trust Portfolios L.P. Deputy General Counsel, First Trust Advisors L.P. and First Trust Portfolios L.P. • Since Inception • Indefinite Term Senior Vice President, First Trust Advisors L.P. and First Trust Portfolios L.P. • Since Inception • Indefinite Term • Since Inception Senior Vice President (September 2012 to Present), Vice President (August 2005 to September 2012), First Trust Advisors L.P. and First Trust Portfolios L.P. The term “officer” means the president, vice president, secretary, treasurer, controller or any other officer who performs a policy making function. Page 30 .
Privacy Policy First Trust Long/Short Equity ETF (FTLS) October 31, 2015 (Unaudited) Privacy Policy First Trust values our relationship with you and considers your privacy an important priority in maintaining that relationship. We are committed to protecting the security and confidentiality of your personal information. Sources of Information We collect nonpublic personal information about you from the following sources: • Information we receive from you and your broker-dealer, investment advisor or financial representative through interviews, applications, agreements or other forms; • Information about your transactions with us, our affiliates or others; • Information we receive from your inquiries by mail, e-mail or telephone; and • Information we collect on our website through the use of “cookies”. For example, we may identify the pages on our website that your browser requests or visits. Information Collected The type of data we collect may include your name, address, social security number, age, financial status, assets, income, tax information, retirement and estate plan information, transaction history, account balance, payment history, investment objectives, marital status, family relationships and other personal information. Disclosure of Information We do not disclose any nonpublic personal information about our customers or former customers to anyone, except as permitted by law. In addition to using this information to verify your identity (as required under law), the permitted uses may also include the disclosure of such information to unaffiliated companies for the following reasons: • In order to provide you with products and services and to effect transactions that you request or authorize, we may disclose your personal information as described above to unaffiliated financial service providers and other companies that perform administrative or other services on our behalf, such as transfer agents, custodians and trustees, or that assist us in the distribution of investor materials such as trustees, banks, financial representatives, proxy services, solicitors and printers. • We may release information we have about you if you direct us to do so, if we are compelled by law to do so, or in other legally limited circumstances (for example to protect your account from fraud). In addition, in order to alert you to our other financial products and services, we may share your personal information with affiliates of the Fund. Privacy Online We allow third-party companies, including AddThis (a social media sharing service), to collect certain anonymous information when you visit our website.
These companies may use non-personally identifiable information during your visits to this and other websites in order to provide advertisements about goods and services likely to be of greater interest to you. These companies typically use a cookie, third party web beacon or pixel tags, to collect this information. To learn more about this behavioral advertising practice, you can visit www.networkadvertising.org. Confidentiality and Security With regard to our internal security procedures, we restrict access to your nonpublic personal information to those individuals who need to know that information to provide products or services to you.
We maintain physical, electronic and procedural safeguards to protect your nonpublic personal information. Policy Updates and Inquiries As required by federal law, we will notify you of our privacy policy annually. We reserve the right to modify this policy at any time, however, if we do change it, we will tell you promptly. For questions about our policy, or for additional copies of this notice, please go to www.ftportfolios.com, or contact us at 1-800-621-1675 (First Trust Portfolios) or 1-800-222-6822 (First Trust Advisors). Page 31 .
This page intentionally left blank. . First Trust Exchange-Traded Fund III INVESTMENT ADVISOR First Trust Advisors L.P. 120 East Liberty Drive, Suite 400 Wheaton, IL 60187 ADMINISTRATOR, CUSTODIAN, FUND ACCOUNTANT & TRANSFER AGENT Brown Brothers Harriman & Co. 50 Post Office Square Boston, MA 02110 INDEPENDENT REGISTERED PUBLIC ACCOUNTING FIRM Deloitte & Touche LLP 111 S. Wacker Drive Chicago, IL 60606 LEGAL COUNSEL Chapman and Cutler LLP 111 W. Monroe Street Chicago, IL 60603 . .