


Description
First Trust Exchange-Traded Fund III
First Trust Long/Short Equity ETF (FTLS)
Annual Report
For the Period
September 8, 2014
(Commencement of Operations)
through October 31, 2014
. Table of Contents
First Trust Long/Short Equity ETF (FTLS)
Annual Report
October 31, 2014
Shareholder Letter . . . .
. . .
. . .
. . .
. . .
. . .
. . .
. . .
. . .
. . .
. . .
. . .
. . .
. . .
. . .
. . .
. . .
. . .
. . .
. . .
. . .
. . .
. . .
. . .
. . .
. . .
. . .
. . .
. . .
. . . Fund Performance Overview .
. . .
. . .
. . .
. . .
. . .
. . .
. . .
. . .
. . .
. . .
. . .
. . .
. . .
. . .
. . .
. . .
. . .
. . .
. . .
. . .
. . .
. . .
. . .
. . .
. . .
. . .
. . . Portfolio Commentary .
. . .
. . .
. . .
. . .
. . .
. . .
. . .
. . .
. . .
. . .
. . .
. . .
. . .
. . .
. . .
. . .
. . .
. . .
. . .
. . .
. . .
. . .
. . .
. . .
. . .
. . .
. . .
. . .
. . . Understanding Your Fund Expenses .
. . .
. . .
. . .
. . .
. . .
. . .
. . .
. . .
. . .
. . .
. . .
. . .
. . .
. . .
. . .
. . .
. . .
. . .
. . .
. . .
. . .
. . .
. . .
. . .
. . .
. Portfolio of Investments . . .
. . .
. . .
. . .
. . .
. . .
. . .
. . .
. . .
. . .
. . .
. . .
. . .
. . .
. . .
. . .
. . .
. . .
. . .
. . .
. . .
. . .
. . .
. . .
. . .
. . .
. . .
. . .
. . Statement of Assets and Liabilities . .
. . .
. . .
. . .
. . .
. . .
. . .
. . .
. . .
. . .
. . .
. . .
. . .
. . .
. . .
. . .
. . .
. . .
. . .
. . .
. . .
. . .
. . .
. . .
. . .
. . .
. Statement of Operations . . .
. . .
. . .
. . .
. . .
. . .
. . .
. . .
. . .
. . .
. . .
. . .
. . .
. . .
. . .
. . .
. . .
. . .
. . .
. . .
. . .
. . .
. . .
. . .
. . .
. . .
. . .
. . .
. . Statement of Changes in Net Assets . .
. . .
. . .
. . .
. . .
. . .
. . .
. . .
. . .
. . .
. . .
. . .
. . .
. . .
. . .
. . .
. . .
. . .
. . .
. . .
. . .
. . .
. . .
. . .
. . .
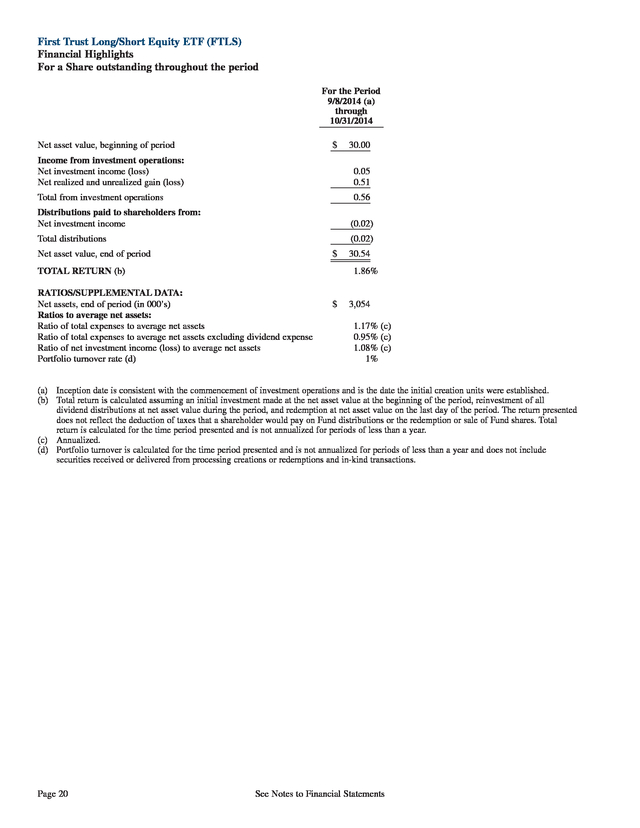
. . . Financial Highlights .
. . .
. . .
. . .
. . .
. . .
. . .
. . .
. . .
. . .
. . .
. . .
. . .
. . .
. . .
. . .
. . .
. . .
. . .
. . .
. . .
. . .
. . .
. . .
. . .
. . .
. . .
. . .
. . .
. . .
. Notes to Financial Statements . . .
. . .
. . .
. . .
. . .
. . .
. . .
. . .
. . .
. . .
. . .
. . .
. . .
. . .
. . .
. . .
. . .
. . .
. . .
. . .
. . .
. . .
. . .
. . .
. . .
. . .
. . .
. Report of Independent Registered Public Accounting Firm . . .
. . .
. . .
. . .
. . .
. . .
. . .
. . .
. . .
. . .
. . .
. . .
. . .
. . .
. . .
. . .
. . .
. . .
. . .
. . Additional Information . .
. . .
. . .
. . .
. . .
. . .
. . .
. . .
. . .
. . .
. . .
. . .
. . .
. . .
. . .
. . .
. . .
. . .
. . .
. . .
. . .
. . .
. . .
. . .
. . .
. . .
. . .
. . .
. . .
. Board of Trustees and Officers . . .
. . .
. . .
. . .
. . .
. . .
. . .
. . .
. . .
. . .
. . .
. . .
. . .
. . .
. . .
. . .
. . .
. . .
. . .
. . .
. . .
. . .
. . .
. . .
. . .
. . .
. . . Privacy Policy .
. . .
. . .
. . .
. . .
. . .
. . .
. . .
. . .
. . .
. . .
. . .
. . .
. . .
. . .
. . .
. . .
. . .
. . .
. . .
. . .
. . .
. . .
. . .
. . .
. . .
. . .
. . .
. . .
. . .
. . .
. . . 1 2 5 7 8 17 18 19 20 21 26 27 30 32 Caution Regarding Forward-Looking Statements This report contains certain forward-looking statements within the meaning of the Securities Act of 1933, as amended, and the Securities Exchange Act of 1934, as amended.
Forward-looking statements include statements regarding the goals, beliefs, plans or current expectations of First Trust Advisors L.P. (“First Trust” or the “Advisor”) and its representatives, taking into account the information currently available to them. Forward-looking statements include all statements that do not relate solely to current or historical fact.
For example, forward-looking statements include the use of words such as “anticipate,” “estimate,” “intend,” “expect,” “believe,” “plan,” “may,” “should,” “would” or other words that convey uncertainty of future events or outcomes. Forward-looking statements involve known and unknown risks, uncertainties and other factors that may cause the actual results, performance or achievements of the series of First Trust Exchange-Traded Fund III (the “Trust”) described in this report for the First Trust Long/Short Equity ETF (hereinafter referred to as the “Fund”) to be materially different from any future results, performance or achievements expressed or implied by the forward-looking statements. When evaluating the information included in this report, you are cautioned not to place undue reliance on these forward-looking statements, which reflect the judgment of the Advisor and its representatives only as of the date hereof. We undertake no obligation to publicly revise or update these forward-looking statements to reflect events and circumstances that arise after the date hereof. Performance and Risk Disclosure There is no assurance that the Fund will achieve its investment objective.
The Fund is subject to market risk, which is the possibility that the market values of securities owned by the Fund will decline and that the value of the Fund shares may therefore be less than what you paid for them. Accordingly, you can lose money investing in the Fund. See “Risk Considerations” in the Additional Information section of this report for a discussion of certain other risks of investing in the Fund. Performance data quoted represents past performance, which is no guarantee of future results, and current performance may be lower or higher than the figures shown.
For the most recent month-end performance figures, please visit http://www.ftportfolios.com or speak with your financial advisor. Investment returns, net asset value and share price will fluctuate and Fund shares, when sold, may be worth more or less than their original cost. How to Read This Report This report contains information that may help you evaluate your investment. It includes details about the Fund’s portfolio and presents data and analysis that provide insight into the Fund’s performance and investment approach. The statistical information that follows may help you understand the Fund’s performance compared to that of relevant market benchmarks. It is important to keep in mind that the opinions expressed by personnel of the Advisor are just that: informed opinions.
They should not be considered to be promises or advice. The opinions, like the statistics, cover the period through the date on the cover of this report. The risks of investing in the Fund are spelled out in its prospectus, statement of additional information, this report and other Fund regulatory filings. .
Shareholder Letter First Trust Long/Short Equity ETF (FTLS) Annual Letter from the Chairman and CEO October 31, 2014 Dear Shareholders: I am pleased to present you with the annual report for your investment in First Trust Long/Short Equity ETF (the “Fund”). This report provides detailed information about the Fund, including a performance review and the financial statements since the Fund’s inception. I encourage you to read this document and discuss it with your financial advisor. Although markets have seemed choppy over the past 12 months, the U.S. has shown sustained growth over the period.
In fact, the S&P 500® Index, as measured on a total return basis, rose 17.27% during the period. First Trust Advisors L.P. (“First Trust”) believes that staying invested in quality products through different types of markets can benefit investors over the long term. First Trust offers a variety of products that we believe could fit the financial plans for many investors seeking long-term investment success.
We invite you to look at our investment products with your financial advisor to determine if any of them might fit your financial goals. We believe that regularly discussing your financial objectives and investment options with your financial advisor can help keep you on track. First Trust will continue to make available up-to-date information about your investments so you and your financial advisor are current on any First Trust investments you own. We value our relationship with you, and thank you for the opportunity to assist you in achieving your financial goals. Sincerely, James A.
Bowen Chairman of the Board of Trustees Chief Executive Officer of First Trust Advisors L.P. Page 1 . Fund Performance Overview (Unaudited) First Trust Long/Short Equity ETF (FTLS) First Trust Long/Short Equity ETF’s (the “Fund”) investment objective is to seek to provide investors with long-term total return. The Fund pursued its objective by establishing long and short positions in a portfolio of Equity Securities (as defined below). Under normal circumstances, at least 80% of the Fund’s net assets (plus the amount of any borrowing for investment purposes) will be exposed to U.S. exchange-listed equity securities of U.S. and foreign companies by investing in such securities directly and/or in U.S.
exchange-traded funds (“ETFs”) that provide exposure to such securities. The securities of the companies and ETFs in which the Fund will invest are referred to collectively as “Equity Securities.” The Equity Securities held by the Fund may include U.S. exchange-listed equity securities of foreign issuers, as well as investments in the equity securities of foreign issuers that are in the form of depositary receipts. The Fund takes long and short positions in Equity Securities. As opposed to taking long positions in which an investor seeks to profit from increases in the price of a security, short selling is a technique that will be used by the Fund to try and profit from the falling price of a security.
Short selling involves selling a security that has been borrowed from a third party with the intention of buying an identical security back at a later date to return to that third party. Having both long and short positions in an equity security portfolio is a common way to create returns that are independent of market moves. One advantage of a long and short portfolio is that the long and short positions may offset one another in a manner that results in a lower net exposure to the direction of the market. In addition, cash balances arising from the use of short selling typically will be held in money market instruments. Performance Cumulative Total Returns Inception (9/8/14) to 10/31/14 Fund Performance NAV Market Price Index Performance S&P 500® Index 1.86% 1.99% 1.05% Total returns for the period since inception are calculated from the inception date of the Fund. The Fund’s per share net asset value (“NAV”) is the value of one share of the Fund and is computed by dividing the value of all assets of the Fund (including accrued interest and dividends), less all liabilities (including accrued expenses and dividends declared but unpaid), by the total number of outstanding shares.
The price used to calculate market return (“Market Price”) is determined by using the midpoint between the highest bid and the lowest offer on the stock exchange on which shares of the Fund are listed for trading as of the time that the Fund’s NAV is calculated. Since shares of the Fund did not trade in the secondary market until after its inception, for the period from inception to the first day of secondary market trading in shares of the Fund, the NAV of the Fund is used as a proxy for the secondary market trading price to calculate market returns. NAV and market returns assume that all dividend distributions have been reinvested in the Fund at NAV and Market Price, respectively. An index is a statistical composite that tracks a specified financial market or sector.
Unlike the Fund, the index does not actually hold a portfolio of securities and therefore does not incur the expenses incurred by the Fund. These expenses negatively impact the performance of the Fund. Also, market returns do not include brokerage commissions that may be payable on secondary market transactions.
If brokerage commissions were included, market returns would be lower. The total returns presented reflect the reinvestment of dividends on securities in the index. The returns presented do not reflect the deduction of taxes that a shareholder would pay on Fund distributions or the redemption or sale of Fund shares.
The investment return and principal value of shares of the Fund will vary with changes in market conditions. Shares of the Fund may be worth more or less than their original cost when they are redeemed or sold in the market. The Fund’s past performance is no guarantee of future performance. Page 2 .
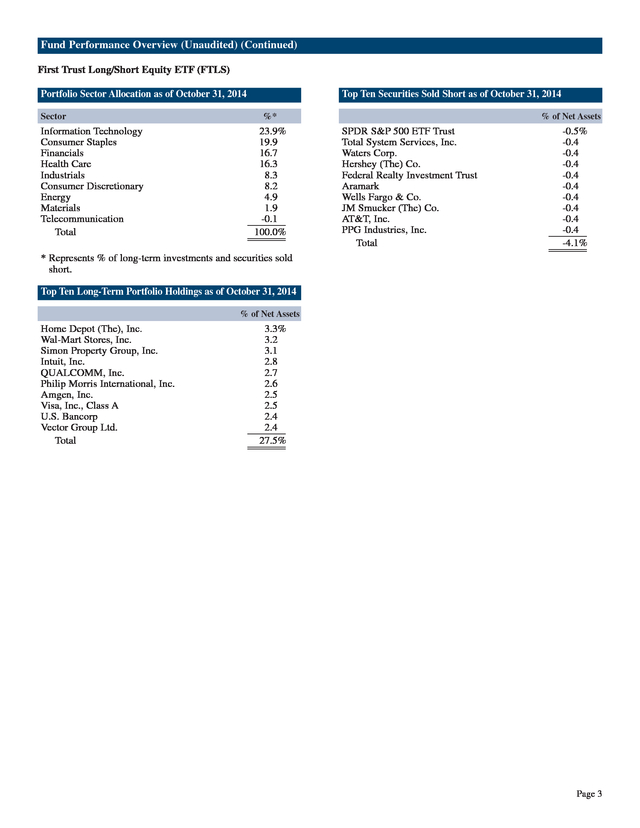
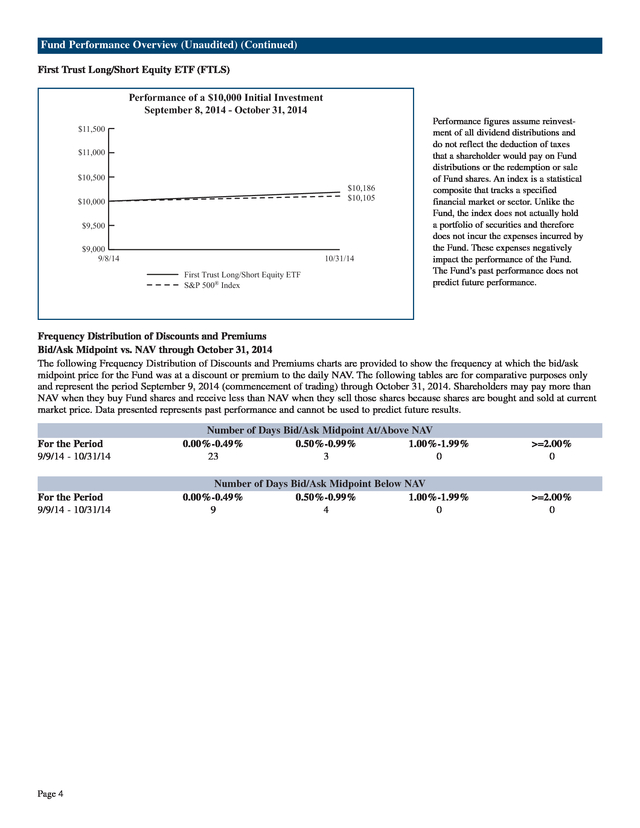
Fund Performance Overview (Unaudited) (Continued) First Trust Long/Short Equity ETF (FTLS) Portfolio Sector Allocation as of October 31, 2014 Sector Information Technology Consumer Staples Financials Health Care Industrials Consumer Discretionary Energy Materials Telecommunication Total Top Ten Securities Sold Short as of October 31, 2014 %* 23.9% 19.9 16.7 16.3 8.3 8.2 4.9 1.9 -0.1 ________ 100.0% ________ ________ % of Net Assets SPDR S&P 500 ETF Trust Total System Services, Inc. Waters Corp. Hershey (The) Co. Federal Realty Investment Trust Aramark Wells Fargo & Co. JM Smucker (The) Co. AT&T, Inc. PPG Industries, Inc. Total -0.5% -0.4 -0.4 -0.4 -0.4 -0.4 -0.4 -0.4 -0.4 -0.4 ________ -4.1% ________ ________ * Represents % of long-term investments and securities sold short. Top Ten Long-Term Portfolio Holdings as of October 31, 2014 % of Net Assets Home Depot (The), Inc. Wal-Mart Stores, Inc. Simon Property Group, Inc. Intuit, Inc. QUALCOMM, Inc. Philip Morris International, Inc. Amgen, Inc. Visa, Inc., Class A U.S. Bancorp Vector Group Ltd. Total 3.3% 3.2 3.1 2.8 2.7 2.6 2.5 2.5 2.4 2.4 ________ 27.5% ________ ________ Page 3 . Fund Performance Overview (Unaudited) (Continued) First Trust Long/Short Equity ETF (FTLS) Performance of a $10,000 Initial Investment September 8, 2014 - October 31, 2014 $11,500 $11,000 $10,500 $10,186 $10,105 $10,000 $9,500 $9,000 9/8/14 10/31/14 First Trust Long/Short Equity ETF S&P 500® Index Performance figures assume reinvestment of all dividend distributions and do not reflect the deduction of taxes that a shareholder would pay on Fund distributions or the redemption or sale of Fund shares. An index is a statistical composite that tracks a specified financial market or sector. Unlike the Fund, the index does not actually hold a portfolio of securities and therefore does not incur the expenses incurred by the Fund. These expenses negatively impact the performance of the Fund. The Fund’s past performance does not predict future performance. Frequency Distribution of Discounts and Premiums Bid/Ask Midpoint vs.
NAV through October 31, 2014 The following Frequency Distribution of Discounts and Premiums charts are provided to show the frequency at which the bid/ask midpoint price for the Fund was at a discount or premium to the daily NAV. The following tables are for comparative purposes only and represent the period September 9, 2014 (commencement of trading) through October 31, 2014. Shareholders may pay more than NAV when they buy Fund shares and receive less than NAV when they sell those shares because shares are bought and sold at current market price.
Data presented represents past performance and cannot be used to predict future results. For the Period 9/9/14 - 10/31/14 Number of Days Bid/Ask Midpoint At/Above NAV 0.00%-0.49% 0.50%-0.99% 1.00%-1.99% 23 3 0 >=2.00% 0 For the Period 9/9/14 - 10/31/14 Number of Days Bid/Ask Midpoint Below NAV 0.00%-0.49% 0.50%-0.99% 1.00%-1.99% 9 4 0 >=2.00% 0 Page 4 . Portfolio Commentary First Trust Long/Short Equity ETF (FTLS) Annual Report October 31, 2014 Investment Manager The First Trust Advisors L.P. (“First Trust”) Alternatives Investment team was formed in July of 2011 and is headed by John Gambla, CFA, FRM, PRM and Rob Guttschow, CFA. Prior to joining First Trust, Messrs. Gambla and Guttschow were Co-Chief Investment Officers at Nuveen Hyde Park, a quantitative money manager.
The team focuses on systematic and disciplined strategies using a variety of statistical techniques along with a fundamental overlay based upon their combined 40+ years of investment experience. Currently the team manages/consults for a variety of portfolios structured as exchanged-traded funds and separately managed accounts in the United States, Canada, and Mexico. Portfolio Management Team John Gambla – CFA, FRM, PRM, Senior Portfolio Manager Rob Guttschow – CFA, Senior Portfolio Manager Commentary First Trust Long/Short Equity ETF The First Trust Long/Short Equity ETF (the “Fund”), which commenced trading on September 8, 2014, is an actively managed exchange-traded fund. The Fund’s investment objective is to seek to provide investors with long-term total return.
The Fund invests at least 80% of its net assets in U.S. exchange-listed equity securities of U.S. and foreign companies such as common stocks and ETFs. The Fund may invest up to 20% of its net assets (plus the amount of any borrowing for investment purposes) in U.S.
exchange-listed equity index future contracts. These futures will be used to gain long or short exposure to broad-based equity indexes. Overall Market Recap This commentary discusses the 12-month overall market performance ended October 31, 2014 and the Fund’s performance for the period from the Fund’s inception date, September 8, 2014, to October 31, 2014. U.S. economic growth dipped into negative territory during the first quarter of 2014, as extremely cold weather throughout the Midwest and East Coast dampened economic activity.
However, growth quickly resumed in the second quarter, jumping from -2.1% annualized growth in the first quarter to 4.6% growth in the second quarter. Third quarter estimates for growth in the U.S. economy show consensus estimates of a 3.0% annualized third quarter growth rate.
Coincident with GDP growth, the widely watched unemployment rate fell to 5.9% by the end of the third quarter. With solid, but certainly not spectacular, economic growth and an unemployment rate falling well through the Federal Reserve’s (the “Fed”) 2013 stated threshold for the removal of “crisis” level interest rates, the third quarter brought forth a more heated debate about when and how the Fed would begin to raise rates. The Fed’s asset purchase program and the ultra-low Fed Funds rate are widely believed to have been supportive of the U.S. equity markets.
With the asset purchase program likely ending in November, the markets have been increasingly focused on when the Fed will begin to raise short-term rates and how that will affect the fixed-income and U.S. equity markets. The Fed’s response to the “when” question, in summary, has been “it depends upon the data.” Regardless of the exact timing of the first rate increases, a data-dependent Fed is likely to result in a data-dependent market, implying that higher levels of market volatility are here to stay, in our opinion. U.S. equity markets, as represented by the S&P 500® Index, have responded to the solid economic growth by rallying 8.34% calendar year-to-date.
Earnings, as reported by Standard & Poor’s, have been supportive with estimated earnings for the S&P 500® Index growing by 10.85% in the third quarter versus 2013 third quarter earnings. That marked the second solid quarter in a row, as second quarter earnings were up 11.3% versus second quarter earnings in 2013. One conundrum in this rosy picture has been the performance of the small-cap sector of the U.S.
equity markets. Small-cap stocks, as represented by the S&P 600® Index, are down -3.73% on the year. Through August, small-cap stocks were slightly positive before falling 5.37% in September.
September brought forth growing concerns that global growth was slowing, and the growth sensitive small-stock sector was the first to respond with a big downturn. Fund Performance The Fund’s inception date was September 8, 2014. The Fund’s performance from inception through October 31, 2014 was 1.99% on a market price basis and 1.86% on NAV. The Fund’s benchmark, the S&P 500® Index (“benchmark”), returned 1.05% during the same period.
The Fund paid its first distribution in September of $.0162/share. FTLS is an actively managed, broadly diversified, long/short strategy that incorporates earnings quality as one of the major components in the investment process. The Fund’s portfolio managers believe that high-earning quality stocks will outperform low-quality earnings stocks over time. Unlike traditional long-only equity funds, FTLS has the potential to benefit not only from buying companies deemed to be high-quality companies, but also by selling (“shorting”) companies viewed as low quality.
The Fund has maintained a long bias of approximately 80% net market exposure with long positions, totaling approximately 100%, and short positions totaling approximately 20% of the Fund’s NAV. Page 5 . Portfolio Commentary (Continued) First Trust Long/Short Equity ETF (FTLS) Annual Report October 31, 2014 The Fund maintained a significant long overweight in Consumer Staples and significant long underweight in Energy and Utilities. The top ten long positions comprised 27.5% of the Fund with Home Depot (HD) being the largest position at 3.3%. The top ten short positions comprised 4.1% of the Fund with S&P 500 Depositary Receipts (SPDR) being the largest short position at 0.5%. During October, the Fund increased the overall size of its short positions in response to a large increase in market volatility by shorting the S&P 500® and Russell 2000® ETFs.
The short position in the Russell 2000® was closed out before fiscal year end as volatility subsided. Market and Fund Outlook Today, we believe the Fund is well positioned to achieve its objective of providing long-term total return. The Fund is invested in a broad array of U.S. equity securities with a focus on earnings quality.
Useful investment information exists across the entire distribution of earnings quality. A long/short approach in which there is a long bias of high-quality stocks and a short bias of lower-earnings quality stocks affords the opportunity to extract additional performance while potentially hedging market exposure. We believe this provides a solid framework to generate attractive risk-adjusted total returns going forward. Page 6 .
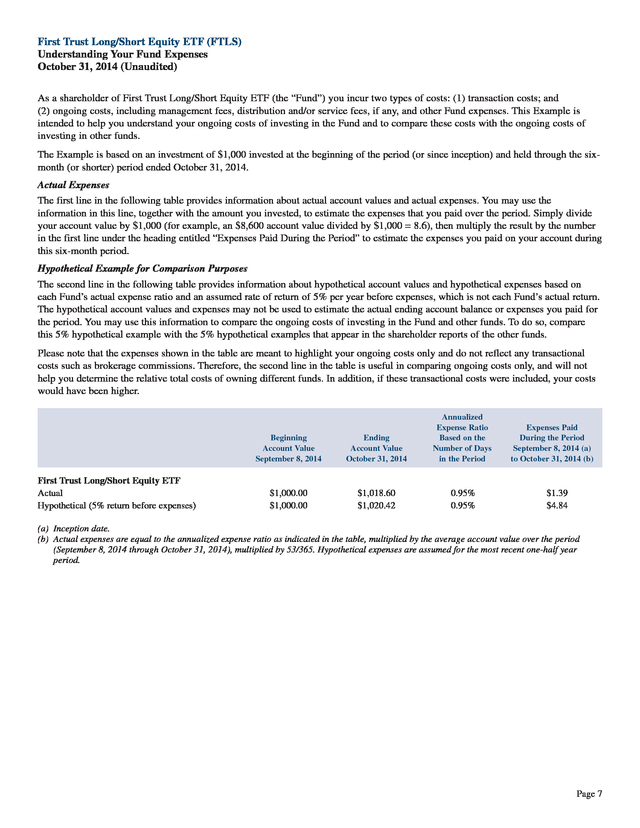
First Trust Long/Short Equity ETF (FTLS) Understanding Your Fund Expenses October 31, 2014 (Unaudited) As a shareholder of First Trust Long/Short Equity ETF (the “Fund”) you incur two types of costs: (1) transaction costs; and (2) ongoing costs, including management fees, distribution and/or service fees, if any, and other Fund expenses. This Example is intended to help you understand your ongoing costs of investing in the Fund and to compare these costs with the ongoing costs of investing in other funds. The Example is based on an investment of $1,000 invested at the beginning of the period (or since inception) and held through the sixmonth (or shorter) period ended October 31, 2014. Actual Expenses The first line in the following table provides information about actual account values and actual expenses. You may use the information in this line, together with the amount you invested, to estimate the expenses that you paid over the period. Simply divide your account value by $1,000 (for example, an $8,600 account value divided by $1,000 = 8.6), then multiply the result by the number in the first line under the heading entitled “Expenses Paid During the Period” to estimate the expenses you paid on your account during this six-month period. Hypothetical Example for Comparison Purposes The second line in the following table provides information about hypothetical account values and hypothetical expenses based on each Fund’s actual expense ratio and an assumed rate of return of 5% per year before expenses, which is not each Fund’s actual return. The hypothetical account values and expenses may not be used to estimate the actual ending account balance or expenses you paid for the period.
You may use this information to compare the ongoing costs of investing in the Fund and other funds. To do so, compare this 5% hypothetical example with the 5% hypothetical examples that appear in the shareholder reports of the other funds. Please note that the expenses shown in the table are meant to highlight your ongoing costs only and do not reflect any transactional costs such as brokerage commissions. Therefore, the second line in the table is useful in comparing ongoing costs only, and will not help you determine the relative total costs of owning different funds.
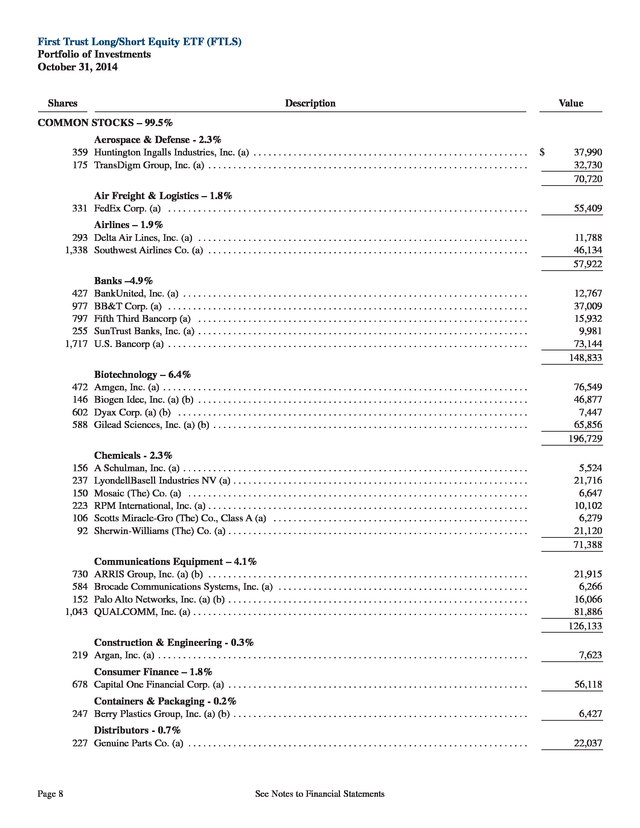
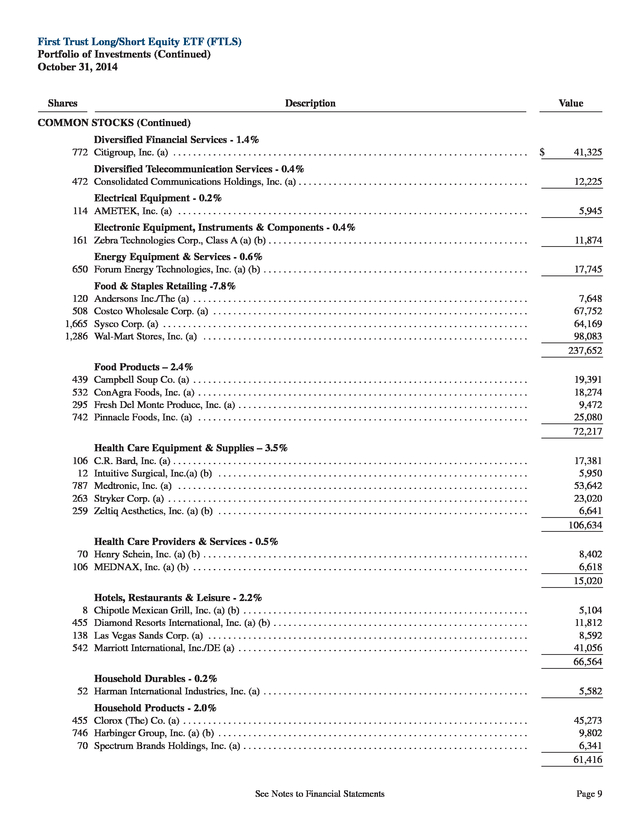
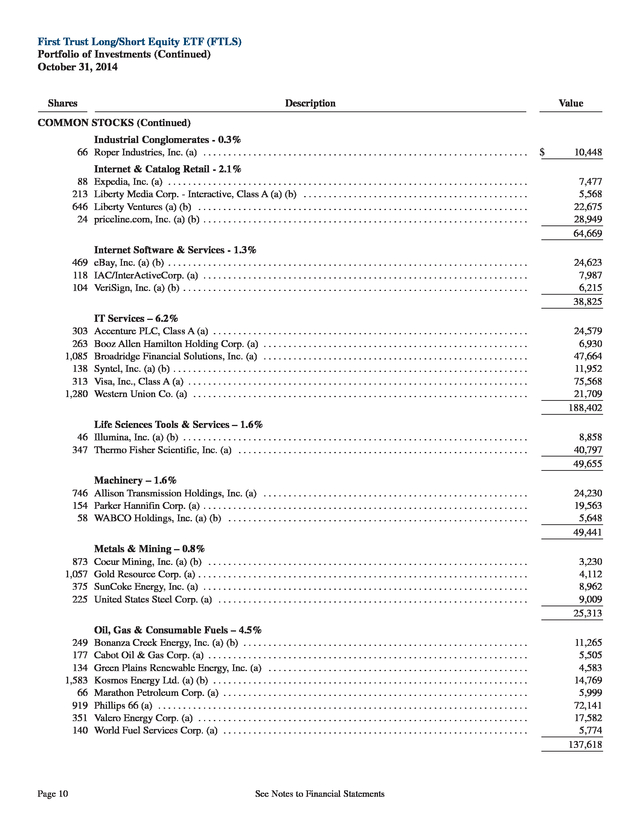
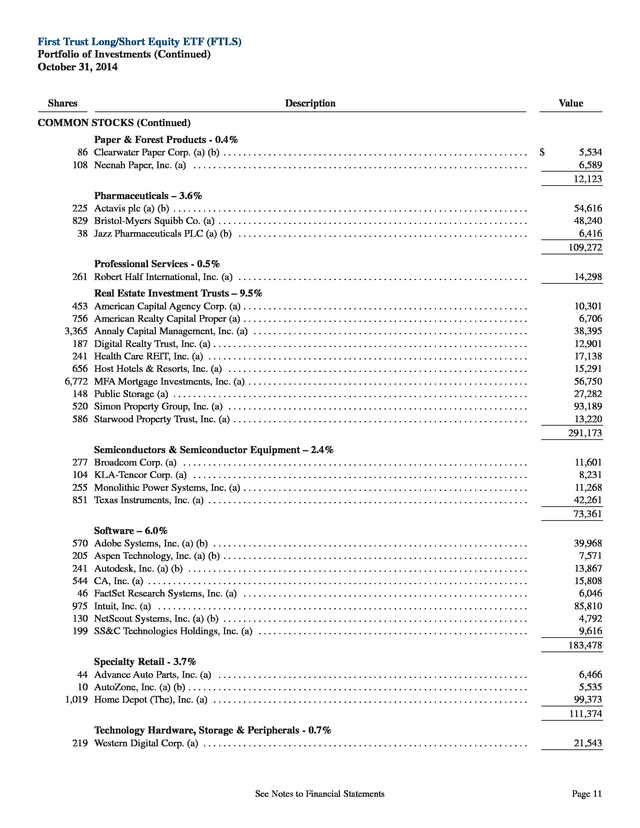
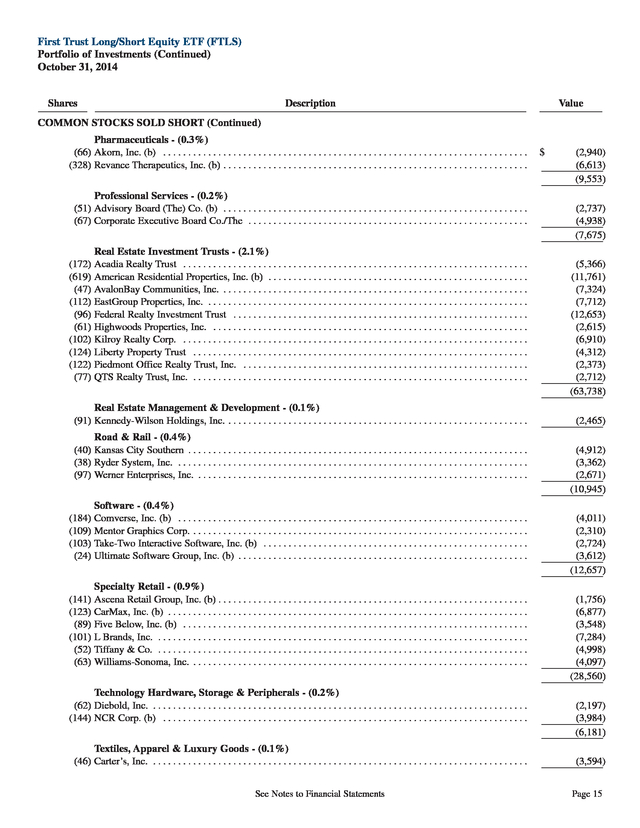
In addition, if these transactional costs were included, your costs would have been higher. Beginning Account Value September 8, 2014 First Trust Long/Short Equity ETF Actual Hypothetical (5% return before expenses) Ending Account Value October 31, 2014 Annualized Expense Ratio Based on the Number of Days in the Period $1,000.00 $1,000.00 $1,018.60 $1,020.42 0.95% 0.95% Expenses Paid During the Period September 8, 2014 (a) to October 31, 2014 (b) $1.39 $4.84 (a) Inception date. (b) Actual expenses are equal to the annualized expense ratio as indicated in the table, multiplied by the average account value over the period (September 8, 2014 through October 31, 2014), multiplied by 53/365. Hypothetical expenses are assumed for the most recent one-half year period. Page 7 . First Trust Long/Short Equity ETF (FTLS) Portfolio of Investments October 31, 2014 Shares Description _____________ _______________________________________________________________________________________________________________________ COMMON STOCKS – 99.5% Aerospace & Defense - 2.3% 359 Huntington Ingalls Industries, Inc. (a) . . .
. . .
. . .
. . .
. . .
. . .
. . .
. . .
. . .
. . .
. . .
. . .
. . .
. . .
. . .
. . .
. . .
. . .
. 175 TransDigm Group, Inc. (a) . .
. . .
. . .
. . .
. . .
. . .
. . .
. . .
. . .
. . .
. . .
. . .
. . .
. . .
. . .
. . .
. . .
. . .
. . .
. . .
. . .
. . Air Freight & Logistics – 1.8% 331 FedEx Corp. (a) .
. . .
. . .
. . .
. . .
. . .
. . .
. . .
. . .
. . .
. . .
. . .
. . .
. . .
. . .
. . .
. . .
. . .
. . .
. . .
. . .
. . .
. . .
. . .
. . Airlines – 1.9% 293 Delta Air Lines, Inc. (a) .
. . .
. . .
. . .
. . .
. . .
. . .
. . .
. . .
. . .
. . .
. . .
. . .
. . .
. . .
. . .
. . .
. . .
. . .
. . .
. . .
. . .
. . 1,338 Southwest Airlines Co. (a) .
. . .
. . .
. . .
. . .
. . .
. . .
. . .
. . .
. . .
. . .
. . .
. . .
. . .
. . .
. . .
. . .
. . .
. . .
. . .
. . .
. . . 427 977 797 255 1,717 Banks –4.9% BankUnited, Inc.
(a) . . .
. . .
. . .
. . .
. . .
. . .
. . .
. . .
. . .
. . .
. . .
. . .
. . .
. . .
. . .
. . .
. . .
. . .
. . .
. . .
. . .
. . .
. . . BB&T Corp.
(a) . . .
. . .
. . .
. . .
. . .
. . .
. . .
. . .
. . .
. . .
. . .
. . .
. . .
. . .
. . .
. . .
. . .
. . .
. . .
. . .
. . .
. . .
. . .
. . . Fifth Third Bancorp (a) .
. . .
. . .
. . .
. . .
. . .
. . .
. . .
. . .
. . .
. . .
. . .
. . .
. . .
. . .
. . .
. . .
. . .
. . .
. . .
. . .
. . .
. . SunTrust Banks, Inc. (a) .
. . .
. . .
. . .
. . .
. . .
. . .
. . .
. . .
. . .
. . .
. . .
. . .
. . .
. . .
. . .
. . .
. . .
. . .
. . .
. . .
. . .
. . U.S. Bancorp (a) .
. . .
. . .
. . .
. . .
. . .
. . .
. . .
. . .
. . .
. . .
. . .
. . .
. . .
. . .
. . .
. . .
. . .
. . .
. . .
. . .
. . .
. . .
. . .
. . 472 146 602 588 Biotechnology – 6.4% Amgen, Inc. (a) .
. . .
. . .
. . .
. . .
. . .
. . .
. . .
. . .
. . .
. . .
. . .
. . .
. . .
. . .
. . .
. . .
. . .
. . .
. . .
. . .
. . .
. . .
. . .
. . . Biogen Idec, Inc.
(a) (b) . . .
. . .
. . .
. . .
. . .
. . .
. . .
. . .
. . .
. . .
. . .
. . .
. . .
. . .
. . .
. . .
. . .
. . .
. . .
. . .
. . .
. . . Dyax Corp.
(a) (b) . . .
. . .
. . .
. . .
. . .
. . .
. . .
. . .
. . .
. . .
. . .
. . .
. . .
. . .
. . .
. . .
. . .
. . .
. . .
. . .
. . .
. . .
. . .
. Gilead Sciences, Inc. (a) (b) . .
. . .
. . .
. . .
. . .
. . .
. . .
. . .
. . .
. . .
. . .
. . .
. . .
. . .
. . .
. . .
. . .
. . .
. . .
. . .
. . .
. 156 237 150 223 106 92 Chemicals - 2.3% A Schulman, Inc. (a) . .
. . .
. . .
. . .
. . .
. . .
. . .
. . .
. . .
. . .
. . .
. . .
. . .
. . .
. . .
. . .
. . .
. . .
. . .
. . .
. . .
. . .
. . .
. LyondellBasell Industries NV (a) . . .
. . .
. . .
. . .
. . .
. . .
. . .
. . .
. . .
. . .
. . .
. . .
. . .
. . .
. . .
. . .
. . .
. . .
. . .
. . Mosaic (The) Co. (a) .
. . .
. . .
. . .
. . .
. . .
. . .
. . .
. . .
. . .
. . .
. . .
. . .
. . .
. . .
. . .
. . .
. . .
. . .
. . .
. . .
. . .
. . .
. RPM International, Inc. (a) . .
. . .
. . .
. . .
. . .
. . .
. . .
. . .
. . .
. . .
. . .
. . .
. . .
. . .
. . .
. . .
. . .
. . .
. . .
. . .
. . .
. . Scotts Miracle-Gro (The) Co., Class A (a) . .
. . .
. . .
. . .
. . .
. . .
. . .
. . .
. . .
. . .
. . .
. . .
. . .
. . .
. . .
. . .
. . .
. Sherwin-Williams (The) Co. (a) . .
. . .
. . .
. . .
. . .
. . .
. . .
. . .
. . .
. . .
. . .
. . .
. . .
. . .
. . .
. . .
. . .
. . .
. . .
. . .
. 730 584 152 1,043 Communications Equipment – 4.1% ARRIS Group, Inc. (a) (b) . .
. . .
. . .
. . .
. . .
. . .
. . .
. . .
. . .
. . .
. . .
. . .
. . .
. . .
. . .
. . .
. . .
. . .
. . .
. . .
. . .
. . Brocade Communications Systems, Inc. (a) .
. . .
. . .
. . .
. . .
. . .
. . .
. . .
. . .
. . .
. . .
. . .
. . .
. . .
. . .
. . .
. . .
. Palo Alto Networks, Inc. (a) (b) . .
. . .
. . .
. . .
. . .
. . .
. . .
. . .
. . .
. . .
. . .
. . .
. . .
. . .
. . .
. . .
. . .
. . .
. . .
. . .
. QUALCOMM, Inc. (a) . .
. . .
. . .
. . .
. . .
. . .
. . .
. . .
. . .
. . .
. . .
. . .
. . .
. . .
. . .
. . .
. . .
. . .
. . .
. . .
. . .
. . .
. . Construction & Engineering - 0.3% 219 Argan, Inc. (a) .
. . .
. . .
. . .
. . .
. . .
. . .
. . .
. . .
. . .
. . .
. . .
. . .
. . .
. . .
. . .
. . .
. . .
. . .
. . .
. . .
. . .
. . .
. . .
. . .
. Consumer Finance – 1.8% 678 Capital One Financial Corp. (a) . .
. . .
. . .
. . .
. . .
. . .
. . .
. . .
. . .
. . .
. . .
. . .
. . .
. . .
. . .
. . .
. . .
. . .
. . .
. . .
. Containers & Packaging - 0.2% 247 Berry Plastics Group, Inc. (a) (b) . .
. . .
. . .
. . .
. . .
. . .
. . .
. . .
. . .
. . .
. . .
. . .
. . .
. . .
. . .
. . .
. . .
. . .
. . .
. . . Distributors - 0.7% 227 Genuine Parts Co.
(a) . . .
. . .
. . .
. . .
. . .
. . .
. . .
. . .
. . .
. . .
. . .
. . .
. . .
. . .
. . .
. . .
. . .
. . .
. . .
. . .
. . .
. . .
. . Page 8 See Notes to Financial Statements Value _________________ $ 37,990 32,730----------------------------------70,720 -----------------------------------55,409 ------------------------------------ 11,788 46,134----------------------------------57,922 -----------------------------------12,767 37,009 15,932 9,981 73,144----------------------------------148,833 -----------------------------------76,549 46,877 7,447 65,856----------------------------------196,729 -----------------------------------5,524 21,716 6,647 10,102 6,279 21,120----------------------------------71,388 -----------------------------------21,915 6,266 16,066 81,886 -----------------------------------126,133----------------------------------7,623 ------------------------------------ 56,118 ------------------------------------ 6,427 ------------------------------------ 22,037 ------------------------------------ . First Trust Long/Short Equity ETF (FTLS) Portfolio of Investments (Continued) October 31, 2014 Shares Description _____________ _______________________________________________________________________________________________________________________ COMMON STOCKS (Continued) Diversified Financial Services - 1.4% 772 Citigroup, Inc. (a) . . .
. . .
. . .
. . .
. . .
. . .
. . .
. . .
. . .
. . .
. . .
. . .
. . .
. . .
. . .
. . .
. . .
. . .
. . .
. . .
. . .
. . .
. . .
. . Diversified Telecommunication Services - 0.4% 472 Consolidated Communications Holdings, Inc. (a) .
. . .
. . .
. . .
. . .
. . .
. . .
. . .
. . .
. . .
. . .
. . .
. . .
. . .
. . .
. . . Electrical Equipment - 0.2% 114 AMETEK, Inc.
(a) . . .
. . .
. . .
. . .
. . .
. . .
. . .
. . .
. . .
. . .
. . .
. . .
. . .
. . .
. . .
. . .
. . .
. . .
. . .
. . .
. . .
. . .
. . .
. Electronic Equipment, Instruments & Components - 0.4% 161 Zebra Technologies Corp., Class A (a) (b) . . .
. . .
. . .
. . .
. . .
. . .
. . .
. . .
. . .
. . .
. . .
. . .
. . .
. . .
. . .
. . .
. . .
. Energy Equipment & Services - 0.6% 650 Forum Energy Technologies, Inc. (a) (b) . .
. . .
. . .
. . .
. . .
. . .
. . .
. . .
. . .
. . .
. . .
. . .
. . .
. . .
. . .
. . .
. . .
. . . 120 508 1,665 1,286 Food & Staples Retailing -7.8% Andersons Inc./The (a) .
. . .
. . .
. . .
. . .
. . .
. . .
. . .
. . .
. . .
. . .
. . .
. . .
. . .
. . .
. . .
. . .
. . .
. . .
. . .
. . .
. . .
. . . Costco Wholesale Corp.
(a) . . .
. . .
. . .
. . .
. . .
. . .
. . .
. . .
. . .
. . .
. . .
. . .
. . .
. . .
. . .
. . .
. . .
. . .
. . .
. . .
. . . Sysco Corp.
(a) . . .
. . .
. . .
. . .
. . .
. . .
. . .
. . .
. . .
. . .
. . .
. . .
. . .
. . .
. . .
. . .
. . .
. . .
. . .
. . .
. . .
. . .
. . .
. . .
. Wal-Mart Stores, Inc. (a) . .
. . .
. . .
. . .
. . .
. . .
. . .
. . .
. . .
. . .
. . .
. . .
. . .
. . .
. . .
. . .
. . .
. . .
. . .
. . .
. . .
. . . 439 532 295 742 Food Products – 2.4% Campbell Soup Co.
(a) . . .
. . .
. . .
. . .
. . .
. . .
. . .
. . .
. . .
. . .
. . .
. . .
. . .
. . .
. . .
. . .
. . .
. . .
. . .
. . .
. . .
. . .
. ConAgra Foods, Inc. (a) . .
. . .
. . .
. . .
. . .
. . .
. . .
. . .
. . .
. . .
. . .
. . .
. . .
. . .
. . .
. . .
. . .
. . .
. . .
. . .
. . .
. . .
. Fresh Del Monte Produce, Inc. (a) . .
. . .
. . .
. . .
. . .
. . .
. . .
. . .
. . .
. . .
. . .
. . .
. . .
. . .
. . .
. . .
. . .
. . .
. . .
. . Pinnacle Foods, Inc. (a) .
. . .
. . .
. . .
. . .
. . .
. . .
. . .
. . .
. . .
. . .
. . .
. . .
. . .
. . .
. . .
. . .
. . .
. . .
. . .
. . .
. . .
. . 106 12 787 263 259 Health Care Equipment & Supplies – 3.5% C.R. Bard, Inc.
(a) . . .
. . .
. . .
. . .
. . .
. . .
. . .
. . .
. . .
. . .
. . .
. . .
. . .
. . .
. . .
. . .
. . .
. . .
. . .
. . .
. . .
. . .
. . .
. . Intuitive Surgical, Inc.(a) (b) . .
. . .
. . .
. . .
. . .
. . .
. . .
. . .
. . .
. . .
. . .
. . .
. . .
. . .
. . .
. . .
. . .
. . .
. . .
. . .
. . . Medtronic, Inc.
(a) . . .
. . .
. . .
. . .
. . .
. . .
. . .
. . .
. . .
. . .
. . .
. . .
. . .
. . .
. . .
. . .
. . .
. . .
. . .
. . .
. . .
. . .
. . .
. Stryker Corp. (a) . .
. . .
. . .
. . .
. . .
. . .
. . .
. . .
. . .
. . .
. . .
. . .
. . .
. . .
. . .
. . .
. . .
. . .
. . .
. . .
. . .
. . .
. . .
. . .
. Zeltiq Aesthetics, Inc. (a) (b) . .
. . .
. . .
. . .
. . .
. . .
. . .
. . .
. . .
. . .
. . .
. . .
. . .
. . .
. . .
. . .
. . .
. . .
. . .
. . .
. . . Health Care Providers & Services - 0.5% 70 Henry Schein, Inc.
(a) (b) . . .
. . .
. . .
. . .
. . .
. . .
. . .
. . .
. . .
. . .
. . .
. . .
. . .
. . .
. . .
. . .
. . .
. . .
. . .
. . .
. . .
. . 106 MEDNAX, Inc. (a) (b) .
. . .
. . .
. . .
. . .
. . .
. . .
. . .
. . .
. . .
. . .
. . .
. . .
. . .
. . .
. . .
. . .
. . .
. . .
. . .
. . .
. . .
. . . 8 455 138 542 Hotels, Restaurants & Leisure - 2.2% Chipotle Mexican Grill, Inc.
(a) (b) . . .
. . .
. . .
. . .
. . .
. . .
. . .
. . .
. . .
. . .
. . .
. . .
. . .
. . .
. . .
. . .
. . .
. . .
. . . Diamond Resorts International, Inc.
(a) (b) . . .
. . .
. . .
. . .
. . .
. . .
. . .
. . .
. . .
. . .
. . .
. . .
. . .
. . .
. . .
. . .
. . . Las Vegas Sands Corp.
(a) . . .
. . .
. . .
. . .
. . .
. . .
. . .
. . .
. . .
. . .
. . .
. . .
. . .
. . .
. . .
. . .
. . .
. . .
. . .
. . .
. . .
. Marriott International, Inc./DE (a) . . .
. . .
. . .
. . .
. . .
. . .
. . .
. . .
. . .
. . .
. . .
. . .
. . .
. . .
. . .
. . .
. . .
. . .
. . .
. Household Durables - 0.2% 52 Harman International Industries, Inc. (a) . .
. . .
. . .
. . .
. . .
. . .
. . .
. . .
. . .
. . .
. . .
. . .
. . .
. . .
. . .
. . .
. . .
. . . Household Products - 2.0% 455 Clorox (The) Co.
(a) . . .
. . .
. . .
. . .
. . .
. . .
. . .
. . .
. . .
. . .
. . .
. . .
. . .
. . .
. . .
. . .
. . .
. . .
. . .
. . .
. . .
. . .
. . . 746 Harbinger Group, Inc.
(a) (b) . . .
. . .
. . .
. . .
. . .
. . .
. . .
. . .
. . .
. . .
. . .
. . .
. . .
. . .
. . .
. . .
. . .
. . .
. . .
. . .
. . 70 Spectrum Brands Holdings, Inc. (a) .
. . .
. . .
. . .
. . .
. . .
. . .
. . .
. . .
. . .
. . .
. . .
. . .
. . .
. . .
. . .
. . .
. . .
. . .
. . See Notes to Financial Statements Value _________________ $----------------------------------41,325 12,225 ------------------------------------ 5,945 ------------------------------------ 11,874 ------------------------------------ 17,745 ------------------------------------ 7,648 67,752 64,169 98,083 -----------------------------------237,652----------------------------------19,391 18,274 9,472 25,080----------------------------------72,217 -----------------------------------17,381 5,950 53,642 23,020 6,641 -----------------------------------106,634 -----------------------------------8,402 6,618 -----------------------------------15,020----------------------------------5,104 11,812 8,592 41,056----------------------------------66,564 -----------------------------------5,582 ------------------------------------ 45,273 9,802 6,341 -----------------------------------61,416----------------------------------Page 9 . First Trust Long/Short Equity ETF (FTLS) Portfolio of Investments (Continued) October 31, 2014 Shares Description _____________ _______________________________________________________________________________________________________________________ COMMON STOCKS (Continued) Industrial Conglomerates - 0.3% 66 Roper Industries, Inc. (a) . . .
. . .
. . .
. . .
. . .
. . .
. . .
. . .
. . .
. . .
. . .
. . .
. . .
. . .
. . .
. . .
. . .
. . .
. . .
. . .
. . .
. . 88 213 646 24 Internet & Catalog Retail - 2.1% Expedia, Inc. (a) .
. . .
. . .
. . .
. . .
. . .
. . .
. . .
. . .
. . .
. . .
. . .
. . .
. . .
. . .
. . .
. . .
. . .
. . .
. . .
. . .
. . .
. . .
. . .
. . Liberty Media Corp. - Interactive, Class A (a) (b) .
. . .
. . .
. . .
. . .
. . .
. . .
. . .
. . .
. . .
. . .
. . .
. . .
. . .
. . .
. . Liberty Ventures (a) (b) . .
. . .
. . .
. . .
. . .
. . .
. . .
. . .
. . .
. . .
. . .
. . .
. . .
. . .
. . .
. . .
. . .
. . .
. . .
. . .
. . .
. . .
. priceline.com, Inc. (a) (b) . .
. . .
. . .
. . .
. . .
. . .
. . .
. . .
. . .
. . .
. . .
. . .
. . .
. . .
. . .
. . .
. . .
. . .
. . .
. . .
. . .
. . . Internet Software & Services - 1.3% 469 eBay, Inc.
(a) (b) . . .
. . .
. . .
. . .
. . .
. . .
. . .
. . .
. . .
. . .
. . .
. . .
. . .
. . .
. . .
. . .
. . .
. . .
. . .
. . .
. . .
. . .
. . .
. . . 118 IAC/InterActiveCorp.
(a) . . .
. . .
. . .
. . .
. . .
. . .
. . .
. . .
. . .
. . .
. . .
. . .
. . .
. . .
. . .
. . .
. . .
. . .
. . .
. . .
. . .
. . 104 VeriSign, Inc. (a) (b) .
. . .
. . .
. . .
. . .
. . .
. . .
. . .
. . .
. . .
. . .
. . .
. . .
. . .
. . .
. . .
. . .
. . .
. . .
. . .
. . .
. . .
. . .
. . 303 263 1,085 138 313 1,280 IT Services – 6.2% Accenture PLC, Class A (a) . .
. . .
. . .
. . .
. . .
. . .
. . .
. . .
. . .
. . .
. . .
. . .
. . .
. . .
. . .
. . .
. . .
. . .
. . .
. . .
. . .
. Booz Allen Hamilton Holding Corp. (a) . .
. . .
. . .
. . .
. . .
. . .
. . .
. . .
. . .
. . .
. . .
. . .
. . .
. . .
. . .
. . .
. . .
. . . Broadridge Financial Solutions, Inc.
(a) . . .
. . .
. . .
. . .
. . .
. . .
. . .
. . .
. . .
. . .
. . .
. . .
. . .
. . .
. . .
. . .
. . .
. . Syntel, Inc. (a) (b) .
. . .
. . .
. . .
. . .
. . .
. . .
. . .
. . .
. . .
. . .
. . .
. . .
. . .
. . .
. . .
. . .
. . .
. . .
. . .
. . .
. . .
. . .
. . .
. Visa, Inc., Class A (a) . . .
. . .
. . .
. . .
. . .
. . .
. . .
. . .
. . .
. . .
. . .
. . .
. . .
. . .
. . .
. . .
. . .
. . .
. . .
. . .
. . .
. . .
. . Western Union Co. (a) .
. . .
. . .
. . .
. . .
. . .
. . .
. . .
. . .
. . .
. . .
. . .
. . .
. . .
. . .
. . .
. . .
. . .
. . .
. . .
. . .
. . .
. . . Life Sciences Tools & Services – 1.6% 46 Illumina, Inc.
(a) (b) . . .
. . .
. . .
. . .
. . .
. . .
. . .
. . .
. . .
. . .
. . .
. . .
. . .
. . .
. . .
. . .
. . .
. . .
. . .
. . .
. . .
. . .
. . . 347 Thermo Fisher Scientific, Inc.
(a) . . .
. . .
. . .
. . .
. . .
. . .
. . .
. . .
. . .
. . .
. . .
. . .
. . .
. . .
. . .
. . .
. . .
. . .
. . .
. Machinery – 1.6% 746 Allison Transmission Holdings, Inc. (a) . .
. . .
. . .
. . .
. . .
. . .
. . .
. . .
. . .
. . .
. . .
. . .
. . .
. . .
. . .
. . .
. . .
. . . 154 Parker Hannifin Corp.
(a) . . .
. . .
. . .
. . .
. . .
. . .
. . .
. . .
. . .
. . .
. . .
. . .
. . .
. . .
. . .
. . .
. . .
. . .
. . .
. . .
. . .
. . 58 WABCO Holdings, Inc. (a) (b) .
. . .
. . .
. . .
. . .
. . .
. . .
. . .
. . .
. . .
. . .
. . .
. . .
. . .
. . .
. . .
. . .
. . .
. . .
. . .
. . 873 1,057 375 225 Metals & Mining – 0.8% Coeur Mining, Inc. (a) (b) .
. . .
. . .
. . .
. . .
. . .
. . .
. . .
. . .
. . .
. . .
. . .
. . .
. . .
. . .
. . .
. . .
. . .
. . .
. . .
. . .
. . . Gold Resource Corp.
(a) . . .
. . .
. . .
. . .
. . .
. . .
. . .
. . .
. . .
. . .
. . .
. . .
. . .
. . .
. . .
. . .
. . .
. . .
. . .
. . .
. . .
. . . SunCoke Energy, Inc.
(a) . . .
. . .
. . .
. . .
. . .
. . .
. . .
. . .
. . .
. . .
. . .
. . .
. . .
. . .
. . .
. . .
. . .
. . .
. . .
. . .
. . .
. . United States Steel Corp. (a) .
. . .
. . .
. . .
. . .
. . .
. . .
. . .
. . .
. . .
. . .
. . .
. . .
. . .
. . .
. . .
. . .
. . .
. . .
. . .
. . .
. 249 177 134 1,583 66 919 351 140 Oil, Gas & Consumable Fuels – 4.5% Bonanza Creek Energy, Inc. (a) (b) . .
. . .
. . .
. . .
. . .
. . .
. . .
. . .
. . .
. . .
. . .
. . .
. . .
. . .
. . .
. . .
. . .
. . .
. . .
. Cabot Oil & Gas Corp. (a) . .
. . .
. . .
. . .
. . .
. . .
. . .
. . .
. . .
. . .
. . .
. . .
. . .
. . .
. . .
. . .
. . .
. . .
. . .
. . .
. . .
. . Green Plains Renewable Energy, Inc. (a) .
. . .
. . .
. . .
. . .
. . .
. . .
. . .
. . .
. . .
. . .
. . .
. . .
. . .
. . .
. . .
. . .
. . . Kosmos Energy Ltd.
(a) (b) . . .
. . .
. . .
. . .
. . .
. . .
. . .
. . .
. . .
. . .
. . .
. . .
. . .
. . .
. . .
. . .
. . .
. . .
. . .
. . .
. . . Marathon Petroleum Corp.
(a) . . .
. . .
. . .
. . .
. . .
. . .
. . .
. . .
. . .
. . .
. . .
. . .
. . .
. . .
. . .
. . .
. . .
. . .
. . .
. . .
. Phillips 66 (a) . . .
. . .
. . .
. . .
. . .
. . .
. . .
. . .
. . .
. . .
. . .
. . .
. . .
. . .
. . .
. . .
. . .
. . .
. . .
. . .
. . .
. . .
. . .
. . .
. . Valero Energy Corp. (a) .
. . .
. . .
. . .
. . .
. . .
. . .
. . .
. . .
. . .
. . .
. . .
. . .
. . .
. . .
. . .
. . .
. . .
. . .
. . .
. . .
. . .
. . World Fuel Services Corp. (a) .
. . .
. . .
. . .
. . .
. . .
. . .
. . .
. . .
. . .
. . .
. . .
. . .
. . .
. . .
. . .
. . .
. . .
. . .
. . .
. . . Page 10 See Notes to Financial Statements Value _________________ $----------------------------------10,448 7,477 5,568 22,675 28,949 -----------------------------------64,669----------------------------------24,623 7,987 6,215----------------------------------38,825 -----------------------------------24,579 6,930 47,664 11,952 75,568 21,709 -----------------------------------188,402 -----------------------------------8,858 40,797----------------------------------49,655 -----------------------------------24,230 19,563 5,648 -----------------------------------49,441 -----------------------------------3,230 4,112 8,962 9,009 -----------------------------------25,313----------------------------------11,265 5,505 4,583 14,769 5,999 72,141 17,582 5,774 -----------------------------------137,618----------------------------------- .
First Trust Long/Short Equity ETF (FTLS) Portfolio of Investments (Continued) October 31, 2014 Shares Description _____________ _______________________________________________________________________________________________________________________ COMMON STOCKS (Continued) Paper & Forest Products - 0.4% 86 Clearwater Paper Corp. (a) (b) . . .
. . .
. . .
. . .
. . .
. . .
. . .
. . .
. . .
. . .
. . .
. . .
. . .
. . .
. . .
. . .
. . .
. . .
. . .
. . .
. 108 Neenah Paper, Inc. (a) . .
. . .
. . .
. . .
. . .
. . .
. . .
. . .
. . .
. . .
. . .
. . .
. . .
. . .
. . .
. . .
. . .
. . .
. . .
. . .
. . .
. . .
. . Pharmaceuticals – 3.6% 225 Actavis plc (a) (b) . .
. . .
. . .
. . .
. . .
. . .
. . .
. . .
. . .
. . .
. . .
. . .
. . .
. . .
. . .
. . .
. . .
. . .
. . .
. . .
. . .
. . .
. . .
. . . 829 Bristol-Myers Squibb Co.
(a) . . .
. . .
. . .
. . .
. . .
. . .
. . .
. . .
. . .
. . .
. . .
. . .
. . .
. . .
. . .
. . .
. . .
. . .
. . .
. . .
. . 38 Jazz Pharmaceuticals PLC (a) (b) . .
. . .
. . .
. . .
. . .
. . .
. . .
. . .
. . .
. . .
. . .
. . .
. . .
. . .
. . .
. . .
. . .
. . .
. . .
. . Professional Services - 0.5% 261 Robert Half International, Inc. (a) .
. . .
. . .
. . .
. . .
. . .
. . .
. . .
. . .
. . .
. . .
. . .
. . .
. . .
. . .
. . .
. . .
. . .
. . .
. . . 453 756 3,365 187 241 656 6,772 148 520 586 Real Estate Investment Trusts – 9.5% American Capital Agency Corp.
(a) . . .
. . .
. . .
. . .
. . .
. . .
. . .
. . .
. . .
. . .
. . .
. . .
. . .
. . .
. . .
. . .
. . .
. . .
. . . American Realty Capital Proper (a) .
. . .
. . .
. . .
. . .
. . .
. . .
. . .
. . .
. . .
. . .
. . .
. . .
. . .
. . .
. . .
. . .
. . .
. . .
. . Annaly Capital Management, Inc. (a) .
. . .
. . .
. . .
. . .
. . .
. . .
. . .
. . .
. . .
. . .
. . .
. . .
. . .
. . .
. . .
. . .
. . .
. . . Digital Realty Trust, Inc.
(a) . . .
. . .
. . .
. . .
. . .
. . .
. . .
. . .
. . .
. . .
. . .
. . .
. . .
. . .
. . .
. . .
. . .
. . .
. . .
. . .
. . . Health Care REIT, Inc.
(a) . . .
. . .
. . .
. . .
. . .
. . .
. . .
. . .
. . .
. . .
. . .
. . .
. . .
. . .
. . .
. . .
. . .
. . .
. . .
. . .
. . .
. Host Hotels & Resorts, Inc. (a) . .
. . .
. . .
. . .
. . .
. . .
. . .
. . .
. . .
. . .
. . .
. . .
. . .
. . .
. . .
. . .
. . .
. . .
. . .
. . .
. MFA Mortgage Investments, Inc. (a) . .
. . .
. . .
. . .
. . .
. . .
. . .
. . .
. . .
. . .
. . .
. . .
. . .
. . .
. . .
. . .
. . .
. . .
. . . Public Storage (a) .
. . .
. . .
. . .
. . .
. . .
. . .
. . .
. . .
. . .
. . .
. . .
. . .
. . .
. . .
. . .
. . .
. . .
. . .
. . .
. . .
. . .
. . .
. . .
. Simon Property Group, Inc. (a) . .
. . .
. . .
. . .
. . .
. . .
. . .
. . .
. . .
. . .
. . .
. . .
. . .
. . .
. . .
. . .
. . .
. . .
. . .
. . .
. Starwood Property Trust, Inc. (a) . .
. . .
. . .
. . .
. . .
. . .
. . .
. . .
. . .
. . .
. . .
. . .
. . .
. . .
. . .
. . .
. . .
. . .
. . .
. . . 277 104 255 851 Semiconductors & Semiconductor Equipment – 2.4% Broadcom Corp.
(a) . . .
. . .
. . .
. . .
. . .
. . .
. . .
. . .
. . .
. . .
. . .
. . .
. . .
. . .
. . .
. . .
. . .
. . .
. . .
. . .
. . .
. . .
. . . KLA-Tencor Corp.
(a) . . .
. . .
. . .
. . .
. . .
. . .
. . .
. . .
. . .
. . .
. . .
. . .
. . .
. . .
. . .
. . .
. . .
. . .
. . .
. . .
. . .
. . .
. Monolithic Power Systems, Inc. (a) . .
. . .
. . .
. . .
. . .
. . .
. . .
. . .
. . .
. . .
. . .
. . .
. . .
. . .
. . .
. . .
. . .
. . .
. . .
. Texas Instruments, Inc. (a) . .
. . .
. . .
. . .
. . .
. . .
. . .
. . .
. . .
. . .
. . .
. . .
. . .
. . .
. . .
. . .
. . .
. . .
. . .
. . .
. . .
. . 570 205 241 544 46 975 130 199 Software – 6.0% Adobe Systems, Inc. (a) (b) .
. . .
. . .
. . .
. . .
. . .
. . .
. . .
. . .
. . .
. . .
. . .
. . .
. . .
. . .
. . .
. . .
. . .
. . .
. . .
. . .
. . Aspen Technology, Inc. (a) (b) .
. . .
. . .
. . .
. . .
. . .
. . .
. . .
. . .
. . .
. . .
. . .
. . .
. . .
. . .
. . .
. . .
. . .
. . .
. . .
. . . Autodesk, Inc.
(a) (b) . . .
. . .
. . .
. . .
. . .
. . .
. . .
. . .
. . .
. . .
. . .
. . .
. . .
. . .
. . .
. . .
. . .
. . .
. . .
. . .
. . .
. . .
. . CA, Inc. (a) .
. . .
. . .
. . .
. . .
. . .
. . .
. . .
. . .
. . .
. . .
. . .
. . .
. . .
. . .
. . .
. . .
. . .
. . .
. . .
. . .
. . .
. . .
. . .
. . .
. . . FactSet Research Systems, Inc.
(a) . . .
. . .
. . .
. . .
. . .
. . .
. . .
. . .
. . .
. . .
. . .
. . .
. . .
. . .
. . .
. . .
. . .
. . .
. . . Intuit, Inc.
(a) . . .
. . .
. . .
. . .
. . .
. . .
. . .
. . .
. . .
. . .
. . .
. . .
. . .
. . .
. . .
. . .
. . .
. . .
. . .
. . .
. . .
. . .
. . .
. . .
. . NetScout Systems, Inc. (a) (b) .
. . .
. . .
. . .
. . .
. . .
. . .
. . .
. . .
. . .
. . .
. . .
. . .
. . .
. . .
. . .
. . .
. . .
. . .
. . .
. . . SS&C Technologies Holdings, Inc.
(a) . . .
. . .
. . .
. . .
. . .
. . .
. . .
. . .
. . .
. . .
. . .
. . .
. . .
. . .
. . .
. . .
. . .
. . . Specialty Retail - 3.7% 44 Advance Auto Parts, Inc.
(a) . . .
. . .
. . .
. . .
. . .
. . .
. . .
. . .
. . .
. . .
. . .
. . .
. . .
. . .
. . .
. . .
. . .
. . .
. . .
. . .
. . 10 AutoZone, Inc. (a) (b) .
. . .
. . .
. . .
. . .
. . .
. . .
. . .
. . .
. . .
. . .
. . .
. . .
. . .
. . .
. . .
. . .
. . .
. . .
. . .
. . .
. . .
. . .
. 1,019 Home Depot (The), Inc. (a) . .
. . .
. . .
. . .
. . .
. . .
. . .
. . .
. . .
. . .
. . .
. . .
. . .
. . .
. . .
. . .
. . .
. . .
. . .
. . .
. . .
. Value _________________ $ 5,534 6,589----------------------------------12,123 -----------------------------------54,616 48,240 6,416 -----------------------------------109,272----------------------------------14,298 ------------------------------------ 10,301 6,706 38,395 12,901 17,138 15,291 56,750 27,282 93,189 13,220 -----------------------------------291,173 -----------------------------------11,601 8,231 11,268 42,261 -----------------------------------73,361----------------------------------39,968 7,571 13,867 15,808 6,046 85,810 4,792 9,616 -----------------------------------183,478 -----------------------------------6,466 5,535 99,373 -----------------------------------111,374 ------------------------------------ Technology Hardware, Storage & Peripherals - 0.7% 219 Western Digital Corp. (a) . .
. . .
. . .
. . .
. . .
. . .
. . .
. . .
. . .
. . .
. . .
. . .
. . .
. . .
. . .
. . .
. . .
. . .
. . .
. . .
. . .
. . . See Notes to Financial Statements 21,543 ------------------------------------ Page 11 .
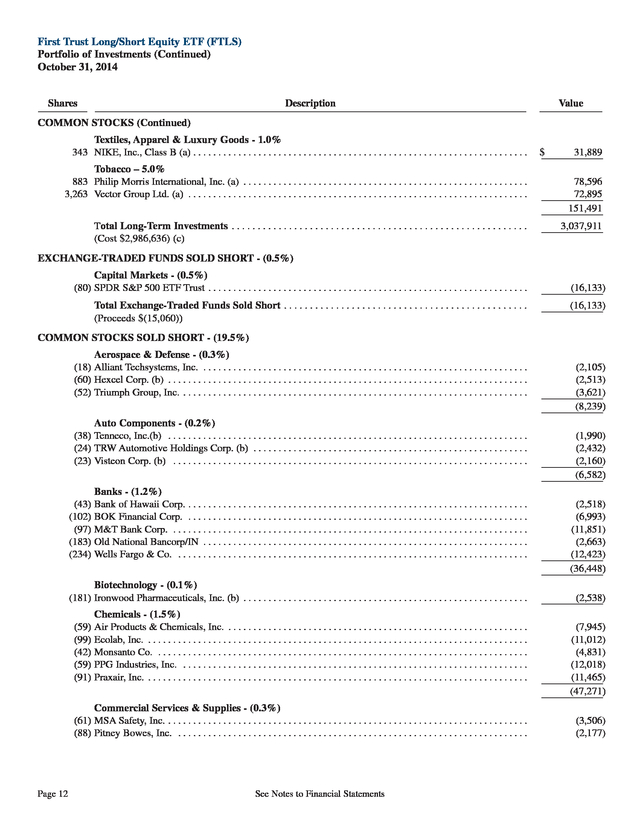
First Trust Long/Short Equity ETF (FTLS) Portfolio of Investments (Continued) October 31, 2014 Shares Description _____________ _______________________________________________________________________________________________________________________ COMMON STOCKS (Continued) Textiles, Apparel & Luxury Goods - 1.0% 343 NIKE, Inc., Class B (a) . . . .
. . .
. . .
. . .
. . .
. . .
. . .
. . .
. . .
. . .
. . .
. . .
. . .
. . .
. . .
. . .
. . .
. . .
. . .
. . .
. . .
. . . Tobacco – 5.0% 883 Philip Morris International, Inc.
(a) . . .
. . .
. . .
. . .
. . .
. . .
. . .
. . .
. . .
. . .
. . .
. . .
. . .
. . .
. . .
. . .
. . .
. . .
. . . 3,263 Vector Group Ltd.
(a) . . .
. . .
. . .
. . .
. . .
. . .
. . .
. . .
. . .
. . .
. . .
. . .
. . .
. . .
. . .
. . .
. . .
. . .
. . .
. . .
. . .
. . .
. . Total Long-Term Investments . .
. . .
. . .
. . .
. . .
. . .
. . .
. . .
. . .
. . .
. . .
. . .
. . .
. . .
. . .
. . .
. . .
. . .
. . .
. (Cost $2,986,636) (c) Value _________________ $----------------------------------31,889 78,596 72,895----------------------------------151,491 -----------------------------------3,037,911 ------------------------------------ EXCHANGE-TRADED FUNDS SOLD SHORT - (0.5%) Capital Markets - (0.5%) (80) SPDR S&P 500 ETF Trust . . .
. . .
. . .
. . .
. . .
. . .
. . .
. . .
. . .
. . .
. . .
. . .
. . .
. . .
. . .
. . .
. . .
. . .
. . .
. . .
. . .
. Total Exchange-Traded Funds Sold Short . . .
. . .
. . .
. . .
. . .
. . .
. . .
. . .
. . .
. . .
. . .
. . .
. . .
. . .
. . .
. . (Proceeds $(15,060)) (16,133) ------------------------------------ (16,133) ------------------------------------ COMMON STOCKS SOLD SHORT - (19.5%) Aerospace & Defense - (0.3%) (18) Alliant Techsystems, Inc. .
. . .
. . .
. . .
. . .
. . .
. . .
. . .
. . .
. . .
. . .
. . .
. . .
. . .
. . .
. . .
. . .
. . .
. . .
. . .
. . .
. . .
. (60) Hexcel Corp. (b) . .
. . .
. . .
. . .
. . .
. . .
. . .
. . .
. . .
. . .
. . .
. . .
. . .
. . .
. . .
. . .
. . .
. . .
. . .
. . .
. . .
. . .
. . .
. . .
. (52) Triumph Group, Inc. . .
. . .
. . .
. . .
. . .
. . .
. . .
. . .
. . .
. . .
. . .
. . .
. . .
. . .
. . .
. . .
. . .
. . .
. . .
. . .
. . .
. . .
. . .
. Auto Components - (0.2%) (38) Tenneco, Inc.(b) . . .
. . .
. . .
. . .
. . .
. . .
. . .
. . .
. . .
. . .
. . .
. . .
. . .
. . .
. . .
. . .
. . .
. . .
. . .
. . .
. . .
. . .
. . .
. . . (24) TRW Automotive Holdings Corp.
(b) . . .
. . .
. . .
. . .
. . .
. . .
. . .
. . .
. . .
. . .
. . .
. . .
. . .
. . .
. . .
. . .
. . .
. . .
. (23) Visteon Corp. (b) . .
. . .
. . .
. . .
. . .
. . .
. . .
. . .
. . .
. . .
. . .
. . .
. . .
. . .
. . .
. . .
. . .
. . .
. . .
. . .
. . .
. . .
. . .
. . . Banks - (1.2%) (43) Bank of Hawaii Corp.
. . .
. . .
. . .
. . .
. . .
. . .
. . .
. . .
. . .
. . .
. . .
. . .
. . .
. . .
. . .
. . .
. . .
. . .
. . .
. . .
. . .
. . .
. . (102) BOK Financial Corp. .
. . .
. . .
. . .
. . .
. . .
. . .
. . .
. . .
. . .
. . .
. . .
. . .
. . .
. . .
. . .
. . .
. . .
. . .
. . .
. . .
. . .
. . .
. (97) M&T Bank Corp. . .
. . .
. . .
. . .
. . .
. . .
. . .
. . .
. . .
. . .
. . .
. . .
. . .
. . .
. . .
. . .
. . .
. . .
. . .
. . .
. . .
. . .
. . .
. . . (183) Old National Bancorp/IN .
. . .
. . .
. . .
. . .
. . .
. . .
. . .
. . .
. . .
. . .
. . .
. . .
. . .
. . .
. . .
. . .
. . .
. . .
. . .
. . .
. . .
. (234) Wells Fargo & Co. . .
. . .
. . .
. . .
. . .
. . .
. . .
. . .
. . .
. . .
. . .
. . .
. . .
. . .
. . .
. . .
. . .
. . .
. . .
. . .
. . .
. . .
. . .
. . Biotechnology - (0.1%) (181) Ironwood Pharmaceuticals, Inc. (b) .
. . .
. . .
. . .
. . .
. . .
. . .
. . .
. . .
. . .
. . .
. . .
. . .
. . .
. . .
. . .
. . .
. . .
. . .
. . Chemicals - (1.5%) (59) Air Products & Chemicals, Inc. .
. . .
. . .
. . .
. . .
. . .
. . .
. . .
. . .
. . .
. . .
. . .
. . .
. . .
. . .
. . .
. . .
. . .
. . .
. . .
. . (99) Ecolab, Inc. .
. . .
. . .
. . .
. . .
. . .
. . .
. . .
. . .
. . .
. . .
. . .
. . .
. . .
. . .
. . .
. . .
. . .
. . .
. . .
. . .
. . .
. . .
. . .
. . .
. . . (42) Monsanto Co.
. . .
. . .
. . .
. . .
. . .
. . .
. . .
. . .
. . .
. . .
. . .
. . .
. . .
. . .
. . .
. . .
. . .
. . .
. . .
. . .
. . .
. . .
. . .
. . .
. . (59) PPG Industries, Inc. .
. . .
. . .
. . .
. . .
. . .
. . .
. . .
. . .
. . .
. . .
. . .
. . .
. . .
. . .
. . .
. . .
. . .
. . .
. . .
. . .
. . .
. . .
. . (91) Praxair, Inc. .
. . .
. . .
. . .
. . .
. . .
. . .
. . .
. . .
. . .
. . .
. . .
. . .
. . .
. . .
. . .
. . .
. . .
. . .
. . .
. . .
. . .
. . .
. . .
. . .
. . . Commercial Services & Supplies - (0.3%) (61) MSA Safety, Inc.
. . .
. . .
. . .
. . .
. . .
. . .
. . .
. . .
. . .
. . .
. . .
. . .
. . .
. . .
. . .
. . .
. . .
. . .
. . .
. . .
. . .
. . .
. . .
. . . (88) Pitney Bowes, Inc.
. . .
. . .
. . .
. . .
. . .
. . .
. . .
. . .
. . .
. . .
. . .
. . .
. . .
. . .
. . .
. . .
. . .
. . .
. . .
. . .
. . .
. . .
. . .
. Page 12 See Notes to Financial Statements (2,105) (2,513) (3,621) -----------------------------------(8,239) -----------------------------------(1,990) (2,432) (2,160) -----------------------------------(6,582) -----------------------------------(2,518) (6,993) (11,851) (2,663) (12,423) -----------------------------------(36,448) -----------------------------------(2,538) ------------------------------------ (7,945) (11,012) (4,831) (12,018) (11,465) -----------------------------------(47,271) -----------------------------------(3,506) (2,177) . First Trust Long/Short Equity ETF (FTLS) Portfolio of Investments (Continued) October 31, 2014 Shares Description _____________ _______________________________________________________________________________________________________________________ COMMON STOCKS SOLD SHORT (Continued) Commercial Services & Supplies (Continued) (33) UniFirst Corp./MA . . . .
. . .
. . .
. . .
. . .
. . .
. . .
. . .
. . .
. . .
. . .
. . .
. . .
. . .
. . .
. . .
. . .
. . .
. . .
. . .
. . .
. . .
. . . Containers & Packaging (0.7%) (177) AptarGroup, Inc.
. . .
. . .
. . .
. . .
. . .
. . .
. . .
. . .
. . .
. . .
. . .
. . .
. . .
. . .
. . .
. . .
. . .
. . .
. . .
. . .
. . .
. . .
. . .
. . . (129) Owens-Illinois, Inc.
(b) . . .
. . .
. . .
. . .
. . .
. . .
. . .
. . .
. . .
. . .
. . .
. . .
. . .
. . .
. . .
. . .
. . .
. . .
. . .
. . .
. . .
. . .
. (146) Silgan Holdings, Inc. . .
. . .
. . .
. . .
. . .
. . .
. . .
. . .
. . .
. . .
. . .
. . .
. . .
. . .
. . .
. . .
. . .
. . .
. . .
. . .
. . .
. . .
. . . Diversified Consumer Services - (0.6%) (56) Grand Canyon Education, Inc.
(b) . . .
. . .
. . .
. . .
. . .
. . .
. . .
. . .
. . .
. . .
. . .
. . .
. . .
. . .
. . .
. . .
. . .
. . .
. . .
. (135) H&R Block, Inc. . .
. . .
. . .
. . .
. . .
. . .
. . .
. . .
. . .
. . .
. . .
. . .
. . .
. . .
. . .
. . .
. . .
. . .
. . .
. . .
. . .
. . .
. . .
. . .
. (546) Houghton Mifflin Harcourt Co. (b) . .
. . .
. . .
. . .
. . .
. . .
. . .
. . .
. . .
. . .
. . .
. . .
. . .
. . .
. . .
. . .
. . .
. . .
. . .
. Diversified Telecommunication Services - (0.4%) (346) AT&T, Inc. . .
. . .
. . .
. . .
. . .
. . .
. . .
. . .
. . .
. . .
. . .
. . .
. . .
. . .
. . .
. . .
. . .
. . .
. . .
. . .
. . .
. . .
. . .
. . .
. . .
. . Electrical Equipment - (0.1%) (83) Babcock & Wilcox Co./The . .
. . .
. . .
. . .
. . .
. . .
. . .
. . .
. . .
. . .
. . .
. . .
. . .
. . .
. . .
. . .
. . .
. . .
. . .
. . .
. . .
. (69) Franklin Electric Co., Inc. . .
. . .
. . .
. . .
. . .
. . .
. . .
. . .
. . .
. . .
. . .
. . .
. . .
. . .
. . .
. . .
. . .
. . .
. . .
. . .
. . .
. . Electronic Equipment, Instruments & Components - (0.4%) (29) FEI Co. .
. . .
. . .
. . .
. . .
. . .
. . .
. . .
. . .
. . .
. . .
. . .
. . .
. . .
. . .
. . .
. . .
. . .
. . .
. . .
. . .
. . .
. . .
. . .
. . .
. . .
. . . (35) IPG Photonics Corp.
(b) . . .
. . .
. . .
. . .
. . .
. . .
. . .
. . .
. . .
. . .
. . .
. . .
. . .
. . .
. . .
. . .
. . .
. . .
. . .
. . .
. . .
. . . (223) National Instruments Corp.
. . .
. . .
. . .
. . .
. . .
. . .
. . .
. . .
. . .
. . .
. . .
. . .
. . .
. . .
. . .
. . .
. . .
. . .
. . .
. . .
. . . Energy Equipment & Services – (0.1%) (34) Bristow Group, Inc.
. . .
. . .
. . .
. . .
. . .
. . .
. . .
. . .
. . .
. . .
. . .
. . .
. . .
. . .
. . .
. . .
. . .
. . .
. . .
. . .
. . .
. . .
. . . Food & Staples Retailing – (0.2%) (90) United Natural Foods, Inc.
(b) . . .
. . .
. . .
. . .
. . .
. . .
. . .
. . .
. . .
. . .
. . .
. . .
. . .
. . .
. . .
. . .
. . .
. . .
. . .
. . .
. Food Products - (1.0%) (132) Hershey (The) Co. . .
. . .
. . .
. . .
. . .
. . .
. . .
. . .
. . .
. . .
. . .
. . .
. . .
. . .
. . .
. . .
. . .
. . .
. . .
. . .
. . .
. . .
. . .
. . (118) JM Smucker (The) Co. .
. . .
. . .
. . .
. . .
. . .
. . .
. . .
. . .
. . .
. . .
. . .
. . .
. . .
. . .
. . .
. . .
. . .
. . .
. . .
. . .
. . .
. . . (130) Post Holdings, Inc.
(b) . . .
. . .
. . .
. . .
. . .
. . .
. . .
. . .
. . .
. . .
. . .
. . .
. . .
. . .
. . .
. . .
. . .
. . .
. . .
. . .
. . .
. . .
. Health Care Equipment & Supplies - (1.2%) (161) Baxter International, Inc. . .
. . .
. . .
. . .
. . .
. . .
. . .
. . .
. . .
. . .
. . .
. . .
. . .
. . .
. . .
. . .
. . .
. . .
. . .
. . .
. . .
. . . (41) Cooper Cos, Inc./The .
. . .
. . .
. . .
. . .
. . .
. . .
. . .
. . .
. . .
. . .
. . .
. . .
. . .
. . .
. . .
. . .
. . .
. . .
. . .
. . .
. . .
. . .
. (179) Haemonetics Corp. (b) . .
. . .
. . .
. . .
. . .
. . .
. . .
. . .
. . .
. . .
. . .
. . .
. . .
. . .
. . .
. . .
. . .
. . .
. . .
. . .
. . .
. . .
. . (117) Masimo Corp. (b) .
. . .
. . .
. . .
. . .
. . .
. . .
. . .
. . .
. . .
. . .
. . .
. . .
. . .
. . .
. . .
. . .
. . .
. . .
. . .
. . .
. . .
. . .
. . .
. (128) Neogen Corp. (b) . .
. . .
. . .
. . .
. . .
. . .
. . .
. . .
. . .
. . .
. . .
. . .
. . .
. . .
. . .
. . .
. . .
. . .
. . .
. . .
. . .
. . .
. . .
. . . (93) Wright Medical Group, Inc.
(b) . . .
. . .
. . .
. . .
. . .
. . .
. . .
. . .
. . .
. . .
. . .
. . .
. . .
. . .
. . .
. . .
. . .
. . .
. . .
. . . Value _________________ $----------------------------------(3,681) (9,364) -----------------------------------(11,017) (3,324) (7,177) -----------------------------------(21,518) -----------------------------------(2,682) (4,362) (10,926) -----------------------------------(17,970) -----------------------------------(12,055) ------------------------------------ (2,374) (2,576) -----------------------------------(4,950) -----------------------------------(2,444) (2,569) (7,065) -----------------------------------(12,078) -----------------------------------(2,513) ------------------------------------ (6,122) ------------------------------------ (12,660) (12,272) (4,875) -----------------------------------(29,807) -----------------------------------(11,292) (6,720) (6,752) (2,953) (5,619) (2,941) -----------------------------------(36,277) ------------------------------------ Health Care Providers & Services - (0.4%) (133) Acadia Healthcare Co., Inc.
(b) . . .
. . .
. . .
. . .
. . .
. . .
. . .
. . .
. . .
. . .
. . .
. . .
. . .
. . .
. . .
. . .
. . .
. . .
. . .
. . . (42) Air Methods Corp.
(b) . . .
. . .
. . .
. . .
. . .
. . .
. . .
. . .
. . .
. . .
. . .
. . .
. . .
. . .
. . .
. . .
. . .
. . .
. . .
. . .
. . .
. . .
. (116) Hanger, Inc. (b) . .
. . .
. . .
. . .
. . .
. . .
. . .
. . .
. . .
. . .
. . .
. . .
. . .
. . .
. . .
. . .
. . .
. . .
. . .
. . .
. . .
. . .
. . .
. . .
. . See Notes to Financial Statements (8,252) (1,984) (2,776) -----------------------------------(13,012) -----------------------------------Page 13 . First Trust Long/Short Equity ETF (FTLS) Portfolio of Investments (Continued) October 31, 2014 Shares Description _____________ _______________________________________________________________________________________________________________________ COMMON STOCKS SOLD SHORT (Continued) Hotels, Restaurants & Leisure - (0.5%) (446) Aramark . . . .
. . .
. . .
. . .
. . .
. . .
. . .
. . .
. . .
. . .
. . .
. . .
. . .
. . .
. . .
. . .
. . .
. . .
. . .
. . .
. . .
. . .
. . .
. . .
. . .
. . (191) Belmond Ltd. (b) .
. . .
. . .
. . .
. . .
. . .
. . .
. . .
. . .
. . .
. . .
. . .
. . .
. . .
. . .
. . .
. . .
. . .
. . .
. . .
. . .
. . .
. . .
. . .
. Household Durables - (0.3%) (133) Jarden Corp. (b) . .
. . .
. . .
. . .
. . .
. . .
. . .
. . .
. . .
. . .
. . .
. . .
. . .
. . .
. . .
. . .
. . .
. . .
. . .
. . .
. . .
. . .
. . .
. . .
. Internet Software & Services - (0.2%) (104) Cornerstone OnDemand, Inc. (b) . .
. . .
. . .
. . .
. . .
. . .
. . .
. . .
. . .
. . .
. . .
. . .
. . .
. . .
. . .
. . .
. . .
. . .
. . .
. . . (10) LinkedIn Corp.
(b) . . .
. . .
. . .
. . .
. . .
. . .
. . .
. . .
. . .
. . .
. . .
. . .
. . .
. . .
. . .
. . .
. . .
. . .
. . .
. . .
. . .
. . .
. . .
. IT Services - (0.7%) (92) TeleTech Holdings, Inc. (b) . .
. . .
. . .
. . .
. . .
. . .
. . .
. . .
. . .
. . .
. . .
. . .
. . .
. . .
. . .
. . .
. . .
. . .
. . .
. . .
. . .
. (386) Total System Services, Inc. . .
. . .
. . .
. . .
. . .
. . .
. . .
. . .
. . .
. . .
. . .
. . .
. . .
. . .
. . .
. . .
. . .
. . .
. . .
. . .
. . .
. (494) Xerox Corp. . .
. . .
. . .
. . .
. . .
. . .
. . .
. . .
. . .
. . .
. . .
. . .
. . .
. . .
. . .
. . .
. . .
. . .
. . .
. . .
. . .
. . .
. . .
. . .
. . .
. . Leisure Products - (0.2%) (58) Hasbro, Inc. .
. . .
. . .
. . .
. . .
. . .
. . .
. . .
. . .
. . .
. . .
. . .
. . .
. . .
. . .
. . .
. . .
. . .
. . .
. . .
. . .
. . .
. . .
. . .
. . .
. . . (70) Mattel, Inc.
. . .
. . .
. . .
. . .
. . .
. . .
. . .
. . .
. . .
. . .
. . .
. . .
. . .
. . .
. . .
. . .
. . .
. . .
. . .
. . .
. . .
. . .
. . .
. . .
. . .
. Life Sciences Tools & Services – (0.9%) (100) Agilent Technologies, Inc. . .
. . .
. . .
. . .
. . .
. . .
. . .
. . .
. . .
. . .
. . .
. . .
. . .
. . .
. . .
. . .
. . .
. . .
. . .
. . .
. . .
. . (76) Bio-Rad Laboratories, Inc. (b) .
. . .
. . .
. . .
. . .
. . .
. . .
. . .
. . .
. . .
. . .
. . .
. . .
. . .
. . .
. . .
. . .
. . .
. . .
. . .
. . . (117) Waters Corp.
(b) . . .
. . .
. . .
. . .
. . .
. . .
. . .
. . .
. . .
. . .
. . .
. . .
. . .
. . .
. . .
. . .
. . .
. . .
. . .
. . .
. . .
. . .
. . .
. . . Machinery – (0.9%) (38) Colfax Corp.
(b) . . .
. . .
. . .
. . .
. . .
. . .
. . .
. . .
. . .
. . .
. . .
. . .
. . .
. . .
. . .
. . .
. . .
. . .
. . .
. . .
. . .
. . .
. . .
. . . (35) EnPro Industries, Inc.
(b) . . .
. . .
. . .
. . .
. . .
. . .
. . .
. . .
. . .
. . .
. . .
. . .
. . .
. . .
. . .
. . .
. . .
. . .
. . .
. . .
. . .
. . (99) ESCO Technologies, Inc. .
. . .
. . .
. . .
. . .
. . .
. . .
. . .
. . .
. . .
. . .
. . .
. . .
. . .
. . .
. . .
. . .
. . .
. . .
. . .
. . .
. . .
. (143) Mueller Industries, Inc. . .
. . .
. . .
. . .
. . .
. . .
. . .
. . .
. . .
. . .
. . .
. . .
. . .
. . .
. . .
. . .
. . .
. . .
. . .
. . .
. . .
. . .
. . (181) PACCAR, Inc. .
. . .
. . .
. . .
. . .
. . .
. . .
. . .
. . .
. . .
. . .
. . .
. . .
. . .
. . .
. . .
. . .
. . .
. . .
. . .
. . .
. . .
. . .
. . .
. . .
. (47) Woodward, Inc. . .
. . .
. . .
. . .
. . .
. . .
. . .
. . .
. . .
. . .
. . .
. . .
. . .
. . .
. . .
. . .
. . .
. . .
. . .
. . .
. . .
. . .
. . .
. . .
. . Media - (0.2%) (82) Scripps Networks Interactive, Inc., Class A . .
. . .
. . .
. . .
. . .
. . .
. . .
. . .
. . .
. . .
. . .
. . .
. . .
. . .
. . .
. . .
. . . Multiline Retail - (0.4%) (159) Nordstrom, Inc.
. . .
. . .
. . .
. . .
. . .
. . .
. . .
. . .
. . .
. . .
. . .
. . .
. . .
. . .
. . .
. . .
. . .
. . .
. . .
. . .
. . .
. . .
. . .
. . .
. Oil, Gas & Consumable Fuels - (1.1%) (74) ConocoPhillips . . .
. . .
. . .
. . .
. . .
. . .
. . .
. . .
. . .
. . .
. . .
. . .
. . .
. . .
. . .
. . .
. . .
. . .
. . .
. . .
. . .
. . .
. . .
. . .
. (66) Continental Resources Inc./OK (b) . . .
. . .
. . .
. . .
. . .
. . .
. . .
. . .
. . .
. . .
. . .
. . .
. . .
. . .
. . .
. . .
. . .
. . .
. . . (690) EP Energy Corp.
(b) . . .
. . .
. . .
. . .
. . .
. . .
. . .
. . .
. . .
. . .
. . .
. . .
. . .
. . .
. . .
. . .
. . .
. . .
. . .
. . .
. . .
. . .
. . . (55) EQT Corp.
. . .
. . .
. . .
. . .
. . .
. . .
. . .
. . .
. . .
. . .
. . .
. . .
. . .
. . .
. . .
. . .
. . .
. . .
. . .
. . .
. . .
. . .
. . .
. . .
. . .
. . (67) Marathon Oil Corp. .
. . .
. . .
. . .
. . .
. . .
. . .
. . .
. . .
. . .
. . .
. . .
. . .
. . .
. . .
. . .
. . .
. . .
. . .
. . .
. . .
. . .
. . .
. . . (70) Noble Energy, Inc.
. . .
. . .
. . .
. . .
. . .
. . .
. . .
. . .
. . .
. . .
. . .
. . .
. . .
. . .
. . .
. . .
. . .
. . .
. . .
. . .
. . .
. . .
. . .
. (71) Southwestern Energy Co. (b) . .
. . .
. . .
. . .
. . .
. . .
. . .
. . .
. . .
. . .
. . .
. . .
. . .
. . .
. . .
. . .
. . .
. . .
. . .
. . .
. . . Value _________________ $ (12,448) (2,189) -----------------------------------(14,637) -----------------------------------(8,657) ------------------------------------ (3,772) (2,290) -----------------------------------(6,062) -----------------------------------(2,375) (13,043) (6,560) -----------------------------------(21,978) -----------------------------------(3,337) (2,175) -----------------------------------(5,512) -----------------------------------(5,528) (8,574) (12,964) -----------------------------------(27,066) -----------------------------------(2,066) (2,258) (3,764) (4,642) (11,823) (2,407) -----------------------------------(26,960) -----------------------------------(6,334) ------------------------------------ (11,545) ------------------------------------ (5,339) (3,721) (10,074) (5,172) (2,372) (4,034) (2,308) -----------------------------------(33,020) ------------------------------------ Page 14 See Notes to Financial Statements .
First Trust Long/Short Equity ETF (FTLS) Portfolio of Investments (Continued) October 31, 2014 Shares Description _____________ _______________________________________________________________________________________________________________________ COMMON STOCKS SOLD SHORT (Continued) Pharmaceuticals - (0.3%) (66) Akorn, Inc. (b) . . .
. . .
. . .
. . .
. . .
. . .
. . .
. . .
. . .
. . .
. . .
. . .
. . .
. . .
. . .
. . .
. . .
. . .
. . .
. . .
. . .
. . .
. . .
. . .
. (328) Revance Therapeutics, Inc. (b) . .
. . .
. . .
. . .
. . .
. . .
. . .
. . .
. . .
. . .
. . .
. . .
. . .
. . .
. . .
. . .
. . .
. . .
. . .
. . .
. . Professional Services - (0.2%) (51) Advisory Board (The) Co. (b) .
. . .
. . .
. . .
. . .
. . .
. . .
. . .
. . .
. . .
. . .
. . .
. . .
. . .
. . .
. . .
. . .
. . .
. . .
. . .
. . . (67) Corporate Executive Board Co./The .
. . .
. . .
. . .
. . .
. . .
. . .
. . .
. . .
. . .
. . .
. . .
. . .
. . .
. . .
. . .
. . .
. . .
. . .
. Real Estate Investment Trusts - (2.1%) (172) Acadia Realty Trust . . .
. . .
. . .
. . .
. . .
. . .
. . .
. . .
. . .
. . .
. . .
. . .
. . .
. . .
. . .
. . .
. . .
. . .
. . .
. . .
. . .
. . .
. . . (619) American Residential Properties, Inc.
(b) . . .
. . .
. . .
. . .
. . .
. . .
. . .
. . .
. . .
. . .
. . .
. . .
. . .
. . .
. . .
. . .
. . .
. (47) AvalonBay Communities, Inc. . .
. . .
. . .
. . .
. . .
. . .
. . .
. . .
. . .
. . .
. . .
. . .
. . .
. . .
. . .
. . .
. . .
. . .
. . .
. . .
. . (112) EastGroup Properties, Inc. .
. . .
. . .
. . .
. . .
. . .
. . .
. . .
. . .
. . .
. . .
. . .
. . .
. . .
. . .
. . .
. . .
. . .
. . .
. . .
. . .
. . . (96) Federal Realty Investment Trust .
. . .
. . .
. . .
. . .
. . .
. . .
. . .
. . .
. . .
. . .
. . .
. . .
. . .
. . .
. . .
. . .
. . .
. . .
. . .
. (61) Highwoods Properties, Inc. . .
. . .
. . .
. . .
. . .
. . .
. . .
. . .
. . .
. . .
. . .
. . .
. . .
. . .
. . .
. . .
. . .
. . .
. . .
. . .
. . .
. (102) Kilroy Realty Corp. . .
. . .
. . .
. . .
. . .
. . .
. . .
. . .
. . .
. . .
. . .
. . .
. . .
. . .
. . .
. . .
. . .
. . .
. . .
. . .
. . .
. . .
. . .
. (124) Liberty Property Trust . . .
. . .
. . .
. . .
. . .
. . .
. . .
. . .
. . .
. . .
. . .
. . .
. . .
. . .
. . .
. . .
. . .
. . .
. . .
. . .
. . .
. . .
. (122) Piedmont Office Realty Trust, Inc. . .
. . .
. . .
. . .
. . .
. . .
. . .
. . .
. . .
. . .
. . .
. . .
. . .
. . .
. . .
. . .
. . .
. . .
. . .
. (77) QTS Realty Trust, Inc. . .
. . .
. . .
. . .
. . .
. . .
. . .
. . .
. . .
. . .
. . .
. . .
. . .
. . .
. . .
. . .
. . .
. . .
. . .
. . .
. . .
. . .
. . Real Estate Management & Development - (0.1%) (91) Kennedy-Wilson Holdings, Inc. .
. . .
. . .
. . .
. . .
. . .
. . .
. . .
. . .
. . .
. . .
. . .
. . .
. . .
. . .
. . .
. . .
. . .
. . .
. . .
. . Road & Rail - (0.4%) (40) Kansas City Southern . .
. . .
. . .
. . .
. . .
. . .
. . .
. . .
. . .
. . .
. . .
. . .
. . .
. . .
. . .
. . .
. . .
. . .
. . .
. . .
. . .
. . .
. . . (38) Ryder System, Inc.
. . .
. . .
. . .
. . .
. . .
. . .
. . .
. . .
. . .
. . .
. . .
. . .
. . .
. . .
. . .
. . .
. . .
. . .
. . .
. . .
. . .
. . .
. . .
. (97) Werner Enterprises, Inc. . .
. . .
. . .
. . .
. . .
. . .
. . .
. . .
. . .
. . .
. . .
. . .
. . .
. . .
. . .
. . .
. . .
. . .
. . .
. . .
. . .
. . .
. Software - (0.4%) (184) Comverse, Inc. (b) . .
. . .
. . .
. . .
. . .
. . .
. . .
. . .
. . .
. . .
. . .
. . .
. . .
. . .
. . .
. . .
. . .
. . .
. . .
. . .
. . .
. . .
. . .
. . (109) Mentor Graphics Corp. .
. . .
. . .
. . .
. . .
. . .
. . .
. . .
. . .
. . .
. . .
. . .
. . .
. . .
. . .
. . .
. . .
. . .
. . .
. . .
. . .
. . .
. . . (103) Take-Two Interactive Software, Inc.
(b) . . .
. . .
. . .
. . .
. . .
. . .
. . .
. . .
. . .
. . .
. . .
. . .
. . .
. . .
. . .
. . .
. . .
. . (24) Ultimate Software Group, Inc. (b) .
. . .
. . .
. . .
. . .
. . .
. . .
. . .
. . .
. . .
. . .
. . .
. . .
. . .
. . .
. . .
. . .
. . .
. . .
. . . Specialty Retail - (0.9%) (141) Ascena Retail Group, Inc.
(b) . . .
. . .
. . .
. . .
. . .
. . .
. . .
. . .
. . .
. . .
. . .
. . .
. . .
. . .
. . .
. . .
. . .
. . .
. . .
. . .
. . (123) CarMax, Inc. (b) .
. . .
. . .
. . .
. . .
. . .
. . .
. . .
. . .
. . .
. . .
. . .
. . .
. . .
. . .
. . .
. . .
. . .
. . .
. . .
. . .
. . .
. . .
. . .
. . (89) Five Below, Inc. (b) .
. . .
. . .
. . .
. . .
. . .
. . .
. . .
. . .
. . .
. . .
. . .
. . .
. . .
. . .
. . .
. . .
. . .
. . .
. . .
. . .
. . .
. . .
. . (101) L Brands, Inc. .
. . .
. . .
. . .
. . .
. . .
. . .
. . .
. . .
. . .
. . .
. . .
. . .
. . .
. . .
. . .
. . .
. . .
. . .
. . .
. . .
. . .
. . .
. . .
. . .
. (52) Tiffany & Co. . .
. . .
. . .
. . .
. . .
. . .
. . .
. . .
. . .
. . .
. . .
. . .
. . .
. . .
. . .
. . .
. . .
. . .
. . .
. . .
. . .
. . .
. . .
. . .
. . . (63) Williams-Sonoma, Inc.
. . .
. . .
. . .
. . .
. . .
. . .
. . .
. . .
. . .
. . .
. . .
. . .
. . .
. . .
. . .
. . .
. . .
. . .
. . .
. . .
. . .
. . .
. Value _________________ $ (2,940) (6,613) -----------------------------------(9,553) -----------------------------------(2,737) (4,938) -----------------------------------(7,675) -----------------------------------(5,366) (11,761) (7,324) (7,712) (12,653) (2,615) (6,910) (4,312) (2,373) (2,712) -----------------------------------(63,738) -----------------------------------(2,465) ------------------------------------ (4,912) (3,362) (2,671) -----------------------------------(10,945) -----------------------------------(4,011) (2,310) (2,724) (3,612) -----------------------------------(12,657) -----------------------------------(1,756) (6,877) (3,548) (7,284) (4,998) (4,097) -----------------------------------(28,560) ------------------------------------ Technology Hardware, Storage & Peripherals - (0.2%) (62) Diebold, Inc. . .
. . .
. . .
. . .
. . .
. . .
. . .
. . .
. . .
. . .
. . .
. . .
. . .
. . .
. . .
. . .
. . .
. . .
. . .
. . .
. . .
. . .
. . .
. . .
. . .
. (144) NCR Corp. (b) . .
. . .
. . .
. . .
. . .
. . .
. . .
. . .
. . .
. . .
. . .
. . .
. . .
. . .
. . .
. . .
. . .
. . .
. . .
. . .
. . .
. . .
. . .
. . .
. . Textiles, Apparel & Luxury Goods - (0.1%) (46) Carter’s, Inc. .
. . .
. . .
. . .
. . .
. . .
. . .
. . .
. . .
. . .
. . .
. . .
. . .
. . .
. . .
. . .
. . .
. . .
. . .
. . .
. . .
. . .
. . .
. . .
. . .
. . See Notes to Financial Statements (2,197) (3,984) -----------------------------------(6,181) -----------------------------------(3,594) ------------------------------------ Page 15 . First Trust Long/Short Equity ETF (FTLS) Portfolio of Investments (Continued) October 31, 2014 Shares Description _____________ _______________________________________________________________________________________________________________________ COMMON STOCKS SOLD SHORT (Continued) Thrifts & Mortgage Finance - (0.4%) (481) Hudson City Bancorp, Inc. . . .
. . .
. . .
. . .
. . .
. . .
. . .
. . .
. . .
. . .
. . .
. . .
. . .
. . .
. . .
. . .
. . .
. . .
. . .
. . .
. . .
. (405) TFS Financial Corp. . .
. . .
. . .
. . .
. . .
. . .
. . .
. . .
. . .
. . .
. . .
. . .
. . .
. . .
. . .
. . .
. . .
. . .
. . .
. . .
. . .
. . .
. . .
. (112) Washington Federal, Inc. . .
. . .
. . .
. . .
. . .
. . .
. . .
. . .
. . .
. . .
. . .
. . .
. . .
. . .
. . .
. . .
. . .
. . .
. . .
. . .
. . .
. . . Tobacco - (0.1%) (68) Universal Corp.
. . .
. . .
. . .
. . .
. . .
. . .
. . .
. . .
. . .
. . .
. . .
. . .
. . .
. . .
. . .
. . .
. . .
. . .
. . .
. . .
. . .
. . .
. . .
. . .
. Trading Companies & Distributors - (0.1%) (64) Fastenal Co. . .
. . .
. . .
. . .
. . .
. . .
. . .
. . .
. . .
. . .
. . .
. . .
. . .
. . .
. . .
. . .
. . .
. . .
. . .
. . .
. . .
. . .
. . .
. . .
. . .
. . Wireless Telecommunication Services - (0.1%) (79) T-Mobile US, Inc. (b) .
. . .
. . .
. . .
. . .
. . .
. . .
. . .
. . .
. . .
. . .
. . .
. . .
. . .
. . .
. . .
. . .
. . .
. . .
. . .
. . .
. . .
. . .
. Total Common Stocks Sold Short . . .
. . .
. . .
. . .
. . .
. . .
. . .
. . .
. . .
. . .
. . .
. . .
. . .
. . .
. . .
. . .
. . .
. . . (Proceeds $(594,067)) Total Investments Sold Short .
. . .
. . .
. . .
. . .
. . .
. . .
. . .
. . .
. . .
. . .
. . .
. . .
. . .
. . .
. . .
. . .
. . .
. . .
. . (Proceeds $(609,127)) Net Other Assets and Liabilities – 20.5% . .
. . .
. . .
. . .
. . .
. . .
. . .
. . .
. . .
. . .
. . .
. . .
. . .
. . .
. . .
. . . Net Assets – 100.0% .
. . .
. . .
. . .
. . .
. . .
. . .
. . .
. . .
. . .
. . .
. . .
. . .
. . .
. . .
. . .
. . .
. . .
. . .
. . .
. . .
. . .
. . .
. Value _________________ $ (4,641) (6,051) (2,445) -----------------------------------(13,137) -----------------------------------(3,026) ------------------------------------ (2,818) ------------------------------------ (2,306) ------------------------------------ (595,170) ------------------------------------ (611,303) 627,271 ------------------------------------ $-----------3,053,879---------------------------------------------------------- (a) The security or a portion of the security is segregated as collateral for investments sold short. (b) Non-income producing security. (c) Aggregate cost for federal income tax purposes is $2,986,636. As of October 31, 2014, the aggregate gross unrealized appreciation for all securities in which there was an excess of value over tax cost was $109,130 and the aggregate gross unrealized depreciation for all securities in which there was an excess of tax cost over value was $57,855. Valuation Inputs A summary of the inputs used to value the Fund’s investments as of October 31, 2014 is as follows (see Note 2A - Portfolio Valuation in the Notes to Financial Statements): ASSETS TABLE Investments ________________________________________________ Common Stocks* . .
. . .
. . .
. . .
. . .
. . .
. . .
. . .
. . .
. . .
. Total Value at 10/31/2014 _____________ Level 1 Quoted Prices ____________ Level 2 Significant Observable Inputs _____________ Level 3 Significant Unobservable Inputs ___________ $ 3,037,911 _____________ _____________ $ 3,037,911 ____________ ____________ $ — _____________ _____________ $ — ___________ ___________ Level 2 Significant Observable Inputs _____________ Level 3 Significant Unobservable Inputs ___________ LIABILITIES TABLE Investments ________________________________________________ Exchange-Traded Funds Sold Short* . . .
. . .
. . .
. . .
. . Common Stocks Sold Short* . .
. . .
. . .
. . .
. . .
. . .
. . . Total .
. . .
. . .
. . .
. . .
. . .
. . .
. . .
. . .
. . .
. . .
. . .
. . .
. . . Total Value at 10/31/2014 _____________ Level 1 Quoted Prices ____________ $ $ (16,133) (595,170) _____________ $ (611,303) _____________ _____________ (16,133) $ — (595,170) _____________ — ____________ $ (611,303) _____________ $ — ____________ ____________ _____________ $ — — ___________ $ — ___________ ___________ * See the Portfolio of Investments for industry breakout. All transfers in and and out of the Levels during the period are assumed to be transferred on the last day of the period at their current value.
There were no transfers between Levels at October 31, 2014. Page 16 See Notes to Financial Statements . First Trust Long/Short Equity ETF (FTLS) Statement of Assets and Liabilities October 31, 2014 ASSETS: Investments, at value (Cost $2,986,636). . . .
. . .
. . .
. . .
. . .
. . .
. . .
. . .
. . . Cash.
. . .
. . .
. . .
. . .
. . .
. . .
. . .
. . .
. . .
. . .
. . .
. . .
. . .
. . .
. . .
. . .
. . .
. . .
. Restricted Cash . . .
. . .
. . .
. . .
. . .
. . .
. . .
. . .
. . .
. . .
. . .
. . .
. . .
. . .
. . .
. . Receivables: Dividends . .
. . .
. . .
. . .
. . .
. . .
. . .
. . .
. . .
. . .
. . .
. . .
. . .
. . .
. . .
. . .
. . Dividend reclaims. .
. . .
. . .
. . .
. . .
. . .
. . .
. . .
. . .
. . .
. . .
. . .
. . .
. . .
. . Total Assets. .
. . .
. . .
. . .
. . .
. . .
. . .
. . .
. . .
. . .
. . .
. . .
. . .
. . .
. . .
. . .
. LIABILITIES: Investments sold short, at value (Proceeds $609,127) . . .
. . .
. . .
. . .
. . .
. . Payables: Investment advisory fees . .
. . .
. . .
. . .
. . .
. . .
. . .
. . .
. . .
. . .
. . .
. . .
. . Dividends payable on investments sold short . .
. . .
. . .
. . .
. . .
. . .
. . .
. Other liabilities . . .
. . .
. . .
. . .
. . .
. . .
. . .
. . .
. . .
. . .
. . .
. . .
. . .
. . .
. . .
. . $ 3,037,911 21,174 606,620 1,917 62 _________________ 3,667,684 _________________ 611,303 Total Liabilities. .
. . .
. . .
. . .
. . .
. . .
. . .
. . .
. . .
. . .
. . .
. . .
. . .
. . .
. . .
. 2,359 38 105 _________________ 613,805 _________________ NET ASSETS . . .
. . .
. . .
. . .
. . .
. . .
. . .
. . .
. . .
. . .
. . .
. . .
. . .
. . .
. . .
. . . $ 3,053,879 _________________ _________________ NET ASSETS consist of: Paid-in capital .
. . .
. . .
. . .
. . .
. . .
. . .
. . .
. . .
. . .
. . .
. . .
. . .
. . .
. . .
. . .
. . Par value . .
. . .
. . .
. . .
. . .
. . .
. . .
. . .
. . .
. . .
. . .
. . .
. . .
. . .
. . .
. . .
. . .
. . Accumulated net investment income (loss) . .
. . .
. . .
. . .
. . .
. . .
. . .
. . .
. . Accumulated net realized gain (loss) on investments and investments sold short. .
. . .
. . .
. . .
. . .
. . .
. . .
. . .
. . .
. . .
. . .
. . .
. . Net unrealized appreciation (depreciation) on investments and investments sold short. .
. . .
. . .
. . .
. . .
. . .
. . .
. . .
. . .
. . .
. . .
. . .
. . $ 2,999,060 1,000 2,994 1,726 NET ASSETS . .
. . .
. . .
. . .
. . .
. . .
. . .
. . .
. . .
. . .
. . .
. . .
. . .
. . .
. . .
. . .
. 49,099 _________________ $ 3,053,879 _________________ _________________ NET ASSET VALUE, per share . . .
. . .
. . .
. . .
. . .
. . .
. . .
. . .
. . .
. . .
. . . $ 30.54 _________________ _________________ Number of shares outstanding (unlimited number of shares authorized, par value $0.01 per share) .
. . .
. . .
. . .
. . .
. . .
. . .
. . . 100,002 _________________ _________________ See Notes to Financial Statements Page 17 .
First Trust Long/Short Equity ETF (FTLS) Statement of Operations For the Period September 8, 2014 (a) through October 31, 2014 INVESTMENT INCOME: Dividends . . . .
. . .
. . .
. . .
. . .
. . .
. . .
. . .
. . .
. . .
. . .
. . .
. . .
. . .
. . .
. . .
. . Other . .
. . .
. . .
. . .
. . .
. . .
. . .
. . .
. . .
. . .
. . .
. . .
. . .
. . .
. . .
. . .
. . .
. . .
. . Total investment income . .
. . .
. . .
. . .
. . .
. . .
. . .
. . .
. . .
. . .
. . .
. . .
. . EXPENSES: Investment advisory fees. .
. . .
. . .
. . .
. . .
. . .
. . .
. . .
. . .
. . .
. . .
. . .
. . .
. . Dividend expense on investments sold short . .
. . .
. . .
. . .
. . .
. . .
. . .
. . .
. $ 9,598 19 _________________ 9,617 _________________ Total expenses . . .
. . .
. . .
. . .
. . .
. . .
. . .
. . .
. . .
. . .
. . .
. . .
. . .
. . .
. . . 4,065 938 _________________ 5,003 _________________ NET INVESTMENT INCOME (LOSS).
. . .
. . .
. . .
. . .
. . .
. . .
. . .
. . .
. 4,614 _________________ NET REALIZED AND UNREALIZED GAIN (LOSS): Net realized gain (loss) on: Investments. . .
. . .
. . .
. . .
. . .
. . .
. . .
. . .
. . .
. . .
. . .
. . .
. . .
. . .
. . .
. . . Short Sales .
. . .
. . .
. . .
. . .
. . .
. . .
. . .
. . .
. . .
. . .
. . .
. . .
. . .
. . .
. . .
. . Net realized gain (loss). .
. . .
. . .
. . .
. . .
. . .
. . .
. . .
. . .
. . .
. . .
. . .
. . .
. Net change in unrealized appreciation (depreciation) on: Investments. . .
. . .
. . .
. . .
. . .
. . .
. . .
. . .
. . .
. . .
. . .
. . .
. . .
. . .
. . .
. . . Short Positions .
. . .
. . .
. . .
. . .
. . .
. . .
. . .
. . .
. . .
. . .
. . .
. . .
. . .
. . .
. . Net change in unrealized appreciation (depreciation) on investments . .
. 3,198 (1,472) _________________ 1,726 51,275 (2,176) _________________ 49,099 _________________ NET REALIZED AND UNREALIZED GAIN (LOSS) . . .
. . .
. . .
. . .
. 50,825 _________________ NET INCREASE (DECREASE) IN NET ASSETS RESULTING FROM OPERATIONS . . .
. . .
. . .
. . .
. . .
. . .
. . .
. . .
. . .
. . .
. . .
. . .
. . $ 55,439 _________________ _________________ (a) Inception date is consistent with the commencement of investment operations and is the date the initial creation units were established. Page 18 See Notes to Financial Statements . First Trust Long/Short Equity ETF (FTLS) Statement of Changes in Net Assets For the Period September 8, 2014 (a) through October 31, 2014 OPERATIONS: Net investment income (loss). . . .
. . .
. . .
. . .
. . .
. . .
. . .
. . .
. . .
. . .
. . . Net realized gain (loss).
. . .
. . .
. . .
. . .
. . .
. . .
. . .
. . .
. . .
. . .
. . .
. . .
. . Net change in unrealized appreciation (depreciation) . .
. . .
. . .
. . .
. . .
. 4,614 1,726 49,099 _________________ Net increase (decrease) in net assets resulting from operations . . .
. . .
. 55,439 _________________ DISTRIBUTIONS TO SHAREHOLDERS FROM: Net investment income. . .
. . .
. . .
. . .
. . .
. . .
. . .
. . .
. . .
. . .
. . .
. . .
. . . $ Total distributions to shareholders .
. . .
. . .
. . .
. . .
. . .
. . .
. . .
. . .
. . .
. . (1,620) _________________ (1,620) _________________ SHAREHOLDER TRANSACTIONS: Proceeds from shares sold . .
. . .
. . .
. . .
. . .
. . .
. . .
. . .
. . .
. . .
. . .
. . .
. Cost of shares redeemed. . .
. . .
. . .
. . .
. . .
. . .
. . .
. . .
. . .
. . .
. . .
. . .
. . 3,000,060 — _________________ Net increase (decrease) in net assets resulting from shareholder transactions . .
. . .
. . .
. . .
. . .
. . .
. . .
. . .
. . .
. . .
. . .
. . .
. . . Total increase (decrease) in net assets .
. . .
. . .
. . .
. . .
. . .
. . .
. . .
. . .
. . NET ASSETS: Beginning of period . .
. . .
. . .
. . .
. . .
. . .
. . .
. . .
. . .
. . .
. . .
. . .
. . .
. . . 3,000,060 _________________ 3,053,879 End of period .
. . .
. . .
. . .
. . .
. . .
. . .
. . .
. . .
. . .
. . .
. . .
. . .
. . .
. . .
. . . — _________________ $ 3,053,879 _________________ _________________ Accumulated net investment income (loss) at end of period.
. . .
. . .
. . . $ 2,994 _________________ _________________ CHANGES IN SHARES OUTSTANDING: Shares outstanding, beginning of period .
. . .
. . .
. . .
. . .
. . .
. . .
. . .
. . . Shares sold .
. . .
. . .
. . .
. . .
. . .
. . .
. . .
. . .
. . .
. . .
. . .
. . .
. . .
. . .
. . .
. . Shares outstanding, end of period . .
. . .
. . .
. . .
. . .
. . .
. . .
. . .
. . .
. . .
. — 100,002 _________________ 100,002 _________________ _________________ (a) Inception date is consistent with the commencement of investment operations and is the date the initial creation units were established. See Notes to Financial Statements Page 19 . First Trust Long/Short Equity ETF (FTLS) Financial Highlights For a Share outstanding throughout the period For the Period 9/8/2014 (a) through 10/31/2014 _________________ Net asset value, beginning of period $ 30.00 ____________ Income from investment operations: Net investment income (loss) Net realized and unrealized gain (loss) 0.05 0.51 ____________ 0.56 ____________ Total from investment operations Distributions paid to shareholders from: Net investment income (0.02) ____________ (0.02) ____________ Total distributions Net asset value, end of period $ 30.54 ____________ ____________ 1.86% TOTAL RETURN (b) RATIOS/SUPPLEMENTAL DATA: Net assets, end of period (in 000’s) Ratios to average net assets: Ratio of total expenses to average net assets Ratio of total expenses to average net assets excluding dividend expense Ratio of net investment income (loss) to average net assets Portfolio turnover rate (d) $ 3,054 1.17% (c) 0.95% (c) 1.08% (c) 1% (a) Inception date is consistent with the commencement of investment operations and is the date the initial creation units were established. (b) Total return is calculated assuming an initial investment made at the net asset value at the beginning of the period, reinvestment of all dividend distributions at net asset value during the period, and redemption at net asset value on the last day of the period. The return presented does not reflect the deduction of taxes that a shareholder would pay on Fund distributions or the redemption or sale of Fund shares. Total return is calculated for the time period presented and is not annualized for periods of less than a year. (c) Annualized. (d) Portfolio turnover is calculated for the time period presented and is not annualized for periods of less than a year and does not include securities received or delivered from processing creations or redemptions and in-kind transactions. Page 20 See Notes to Financial Statements . Notes to Financial Statements First Trust Long/Short Equity ETF (FTLS) October 31, 2014 1. Organization First Trust Exchange-Traded Fund III (the “Trust”) is a non-diversified open-end management investment company organized as a Massachusetts business trust on January 9, 2008, and is registered with the Securities and Exchange Commission under the Investment Company Act of 1940, as amended (the “1940 Act”). The Trust currently consists of three funds that are offering shares. This report covers the First Trust Long/Short Equity ETF (the “Fund”), which trades under the ticker “FTLS” on the NYSE Arca, Inc. (“NYSE Arca”).
Unlike conventional mutual funds, the Fund issues and redeems shares on a continuous basis, at net asset value (“NAV”), only in large specified blocks consisting of 50,000 shares called a “Creation Unit.” Creation Units are issued and redeemed for securities in which the Fund invests or for cash or, in certain circumstances, both. Except when aggregated in Creation Units, the shares are not redeemable securities of the Fund. The investment objective of the Fund is to seek to provide investors with long-term total return. The Fund pursues its investment objective by establishing long and short positions in a portfolio of equity securities.
Under normal circumstances, at least 80% of the Fund’s net assets (plus the amount of any borrowing for investment purposes) will be exposed to U.S. exchange-listed equity securities of U.S. and foreign companies by investing in such securities directly and/or in U.S.
exchange-traded funds (“ETFs”) that provide exposure to such securities. The equity securities held by the Fund may include U.S. exchange-listed equity securities of foreign issuers, as well as investments in the equity securities of foreign issuers that are in the form of depositary receipts.
There can be no assurance that the Fund will achieve its investment objective. The Fund may not be appropriate for all investors. 2. Significant Accounting Policies The following is a summary of significant accounting policies consistently followed by the Fund in the preparation of the financial statements.
The preparation of the financial statements in accordance with accounting principles generally accepted in the United States of America (“U.S. GAAP”) requires management to make estimates and assumptions that affect the reported amounts and disclosures in the financial statements. Actual results could differ from those estimates. A.
Portfolio Valuation The Fund’s NAV is determined daily as of the close of regular trading on The New York Stock Exchange (“NYSE”), normally 4:00 p.m. Eastern time, on each day the NYSE is open for trading. If the NYSE closes early on a valuation day, the NAV is determined as of that time. Domestic debt securities and foreign securities are priced using data reflecting the earlier closing of the principal markets for those securities.
The NAV is calculated by dividing the value of all assets of the Fund (including accrued interest and dividends), less all liabilities (including accrued expenses and dividends declared but unpaid), by the total number of shares outstanding. The Fund’s investments are valued daily at market value or, in absence of market value with respect to any portfolio securities, at fair value. Market value prices represent last sale or official closing prices from a national or foreign exchange (i.e. a regulated market) and are primarily obtained from third party pricing services.
Fair value prices represent any prices not considered market value prices and are either obtained from a third party pricing service or are determined by the Pricing Committee of the Fund’s investment advisor, First Trust Advisors L.P. (“First Trust” or the “Advisor”) in accordance with valuation procedures adopted by the Trust’s Board of Trustees, and in accordance with provisions of the 1940 Act. Investments valued by the Advisor’s Pricing Committee, if any, are footnoted as such in the footnotes to the Portfolio of Investments.
The Fund’s investments are valued as follows: Common stocks and other equity securities listed on any national or foreign exchange (excluding The NASDAQ® Stock Market LLC (“NASDAQ”) and the London Stock Exchange Alternative Investment Market (“AIM”)) are valued at the last sale price on the exchange on which they are principally traded or, for NASDAQ and AIM securities, the official closing price. Securities traded on one or more than one securities exchange are valued at the last sale price or official closing price, as applicable, at the close of the securities exchange representing the principal market for such securities. Securities traded in an over-the-counter market are fair valued at the mean of their most recent bid and asked price, if available, and otherwise at their closing bid price. Certain securities may not be able to be priced by pre-established pricing methods. Such securities may be valued by the Trust’s Board of Trustees or its delegate, the Advisor’s Pricing Committee, at fair value. These securities generally include, but are not limited to, restricted securities (securities which may not be publicly sold without registration under the Securities Act of 1933, as amended for which a pricing service is unable to provide a market price; securities whose trading has been formally suspended; a security whose market or fair value price is not available from a pre-established pricing source; a security with respect to which an event has occurred that is likely to materially affect the value of the security after the market has closed but before the calculation of the Fund’s NAV or make it difficult or impossible to obtain a reliable market quotation; and a security whose price, as provided by the pricing service, does not reflect the security’s fair value.
As a general principle, the current fair value of a security would appear to be the amount which the Page 21 . Notes to Financial Statements (Continued) First Trust Long/Short Equity ETF (FTLS) October 31, 2014 owner might reasonably expect to receive for the security upon its current sale. When fair value prices are used, generally they will differ from market quotations or official closing prices on the applicable exchanges. A variety of factors may be considered in determining the fair value of such securities, including, but not limited to, the following: 1) the type of security; 2) the size of the holding; 3) the initial cost of the security; 4) transactions in comparable securities; 5) price quotes from dealers and/or pricing services; 6) relationships among various securities; 7) information obtained by contacting the issuer, analysts, or the appropriate stock exchange; 8) an analysis of the issuer’s financial statements; and 9) the existence of merger proposals or tender offers that might affect the value of the security. The Fund is subject to fair value accounting standards that define fair value, establish the framework for measuring fair value and provide a three-level hierarchy for fair valuation based upon the inputs to the valuation as of the measurement date. The three levels of the fair value hierarchy are as follows: • Level 1 – Level 1 inputs are quoted prices in active markets for identical investments.
An active market is a market in which transactions for the investment occur with sufficient frequency and volume to provide pricing information on an ongoing basis. • Level 2 – Level 2 inputs are observable inputs, either directly or indirectly, and include the following: o Quoted prices for similar investments in active markets. o Quoted prices for identical or similar investments in markets that are non-active. A non-active market is a market where there are few transactions for the investment, the prices are not current, or price quotations vary substantially either over time or among market makers, or in which little information is released publicly. o Inputs other than quoted prices that are observable for the investment (for example, interest rates and yield curves observable at commonly quoted intervals, volatilities, prepayment speeds, loss severities, credit risks, and default rates). o Inputs that are derived principally from or corroborated by observable market data by correlation or other means. • Level 3 – Level 3 inputs are unobservable inputs. Unobservable inputs may reflect the reporting entity’s own assumptions about the assumptions that market participants would use in pricing the investment. The inputs or methodology used for valuing investments are not necessarily an indication of the risk associated with investing in those investments.
A summary of the inputs used to value the Fund’s investments as of October 31, 2014, is included with the Fund’s Portfolio of Investments. B. Securities Transactions and Investment Income Securities transactions are recorded as of the trade date. Realized gains and losses from securities transactions are recorded on the identified cost basis.
Dividend income is recorded on the ex-dividend date. Interest income, if any, is recorded on the accrual basis. Distributions received from the Fund’s investments in real estate investment trusts (“REITs”) may be comprised of return of capital, capital gains and income. The actual character of the amounts received during the year are not known until after the REIT’s fiscal year end.
The Fund records the character of distributions received from the REITs during the year based on estimates available. The characterization of distributions received by the Fund may be subsequently revised based on information received from the REITs after their tax reporting periods conclude. C. Short Sales Short sales are utilized for investment and risk management purposes and are transactions in which securities or other instruments (such as options forwards, futures or other derivative contracts) are sold that are not currently owned in the Fund’s portfolio.
When a short sale is engaged in, the security sold short must be borrowed and delivered to the counterparty. Short selling allows the Fund to profit from a decline in a market price to the extent such decline exceeds the transaction costs and the costs of borrowing the securities. The Fund will pay a fee or premium to borrow the securities and is obligated to repay the lenders of the securities.
Any dividends or interest that accrues on the securities during the period of the load are due to the lenders. A gain, limited to the price at which the security was sold short, or a loss, unlimited in size, will be recognized upon the termination of the short sale. Any such gain or loss may be offset, completely or in part, by the change in the value of the long portion of the Fund’s portfolio.
The Fund is subject to the risk it may be unable to reacquire a security to terminate a short position except at a price substantially in excess of the last quoted price. Also, there is the risk that the counterparty to a short sale may fail to honor its contractual terms, causing a loss to Page 22 . Notes to Financial Statements (Continued) First Trust Long/Short Equity ETF (FTLS) October 31, 2014 the Fund. The Fund has established an account with Pershing, LLC for the purpose of purchasing securities on margin. The Fund pays interest on any margin balance, which is calculated as the daily margin account balance times the broker’s margin interest rate. Restricted cash in the amount of $606,620, as shown on the Statement of Assets and Liabilities, is associated with collateral at the broker as of October 31, 2014. D. Dividends and Distributions to Shareholders Dividends from net investment income, if any, are declared and paid quarterly, or as the Board of Trustees may determine from time to time.
Distributions of net realized capital gains earned by the Fund, if any, will be distributed at least annually. Distributions from income and capital gains are determined in accordance with income tax regulations, which may differ from U.S. GAAP. Certain capital accounts in the financial statements are periodically adjusted for permanent differences in order to reflect their tax character. These permanent differences are primarily due to the varying treatment of income and gain/loss on portfolio securities held by the Fund and has no impact on net assets or net asset value per share.
Temporary differences, which arise from recognizing certain items of income, expense and gain/loss in different periods for financial statement and tax purposes, will reverse at some time in the future. The tax character of distributions paid during the fiscal period ended October 31, 2014 was as follows: Distributions paid from: Ordinary income . . .
. . .
. . .
. . .
. . .
. . .
. . .
. . .
. . .
. . $ 1,620 As of October 31, 2014, the components of distributable earnings on a tax basis to the Fund were as follows: Undistributed ordinary income . .
. . .
. . .
. . .
. . .
. . .
. Accumulated capital and other losses . . .
. . .
. . .
. . .
. Net unrealized appreciation (depreciation) . . .
. . .
. . . $ 4,502 218 49,099 E.
Income Taxes The Fund intends to qualify as a regulated investment company by complying with the requirements under Subchapter M of the Internal Revenue Code of 1986, as amended, which includes distributing substantially all of its net investment income and net realized gains to shareholders. Accordingly, no provision has been made for federal or state income taxes. However, due to the timing and amount of distributions, the Fund may be subject to an excise tax of 4% of the amount by which approximately 98% of the Fund’s taxable income exceeds the distributions from such taxable income for the calendar year. The Fund is subject to accounting standards that establish a minimum threshold for recognizing, and a system for measuring, the benefits of a tax position taken or expected to be taken in a tax return.
The taxable year ended 2014 remains open to federal and state audit. As of October 31, 2014, management has evaluated the application of these standards to the Fund, and has determined that no provision for income tax is required in the Fund’s financial statements for uncertain tax positions. Net capital losses may be carried forward indefinitely, and their character is retained as short-term and/or long-term losses. At October 31, 2014, the Fund had no net capital losses for federal income tax purposes.
The Fund is subject to certain limitations, under U.S. tax rules, on the use of capital loss carryforwards and net unrealized built-in losses. These limitations apply when there has been a 50% change in ownership. In order to present paid-in capital, accumulated net investment income (loss) and accumulated net realized gain (loss) on investments on the Statement of Assets and Liabilities that more closely represent their tax character, certain adjustments have been made to paidin capital, accumulated net investment income (loss) and accumulated net realized gain (loss) on investments.
These adjustments are primarily due to the difference between book and tax treatments of income and gains on various investment securities held by the Fund and in-kind transactions. The results of operations and net assets were not affected by these adjustments. For the fiscal year ended October 31, 2014, the Fund had no adjustments. F.
Expenses Expenses, other than the investment advisory fee, dividend expenses on investments sold short and other excluded expenses, are paid by the Advisor (See Note 3). Page 23 . Notes to Financial Statements (Continued) First Trust Long/Short Equity ETF (FTLS) October 31, 2014 3. Investment Advisory Fee, Affiliated Transactions and Other Fee Arrangements First Trust, the investment advisor to the Fund, is a limited partnership with one limited partner, Grace Partners of DuPage L.P., and one general partner, The Charger Corporation. The Charger Corporation is an Illinois corporation controlled by James A. Bowen, Chief Executive Officer of First Trust.
First Trust is responsible for the selection and ongoing monitoring of the securities in the Fund’s portfolio, managing the Fund’s business affairs and providing certain administrative services necessary for the management of the Fund. Pursuant to the Investment Management Agreement, First Trust manages the investment of the Fund’s assets and is responsible for the Fund’s expenses, including the cost of transfer agency, custody, fund administration, legal, audit and other services, but excluding fee payments under the Investment Management Agreement, interest, taxes, brokerage commissions and other expenses connected with the execution of portfolio transactions, distribution and service fees pursuant to a 12b-1 plan, if any, dividend expenses on investments sold short, and extraordinary expenses. The Fund has agreed to pay First Trust an annual unitary management fee equal to 0.95% of its average daily net assets. First Trust also provides fund reporting services to the Fund for a flat annual fee in the amount of $9,250, which is covered under the annual unitary management fee. The Fund has multiple service agreements with Brown Brothers Harriman & Co.
(“BBH”). Under the service agreements, BBH performs custodial, fund accounting, certain administrative services, and transfer agency services for the Fund. As custodian, BBH is responsible for custody of the Fund’s assets.
As fund accountant and administrator, BBH is responsible for maintaining the books and records of the Fund’s securities and cash. As transfer agent, BBH is responsible for maintaining shareholder records for the Fund. Each Trustee who is not an officer or employee of First Trust, any sub-advisor or any of their affiliates (“Independent Trustees”) is paid a fixed annual retainer that is allocated pro rata among each fund in the First Trust Fund Complex based on net assets. Each Independent Trustee is also paid an annual per fund fee that varies based on whether the fund is a closed-end or other actively managed fund, or is an index fund. Additionally, the Lead Independent Trustee and the Chairmen of the Audit Committee, Nominating and Governance Committee and Valuation Committee are paid annual fees to serve in such capacities, with such compensation allocated pro rata among each fund in the First Trust Fund Complex based on net assets.
Trustees are reimbursed for travel and out-of-pocket expenses in connection with all meetings. The Lead Independent Trustee and Committee Chairmen rotate every three years. The officers and “Interested” Trustee receive no compensation from the Trust for acting in such capacities. 4.
Purchases and Sales of Securities For the year ended October 31, 2014, the cost of purchases and proceeds from sales of investments, excluding short-term investments and in-kind transactions, for the Fund were $0 and $24,103, respectively. The cost of purchases to cover short sales and the proceeds of short sales were $18,775 and $626,430, respectively. For the year ended October 31, 2014, the cost of in-kind purchases and proceeds from in-kind sales for the Fund was $3,007,812 and $0, respectively. 5. Creations, Redemptions and Transaction Fees Shares are created and redeemed by the Fund only in Creation Unit size aggregations of 50,000 shares.
In order to purchase Creation Units of the Fund, an investor must deposit (i) a designated portfolio of equity securities determined by First Trust (the “Deposit Securities”) and generally make or receive a cash payment referred to as the “Cash Component,” which is an amount equal to the difference between the NAV of the Fund shares (per Creation Unit aggregations) and the market value of the Deposit Securities, and/or (ii) cash in lieu of all or a portion of the Deposit Securities. If the Cash Component is a positive number (i.e., the NAV per Creation Unit Aggregation exceeds the Deposit Amount), the creator will deliver the Cash Component. If the Cash Component is a negative number (i.e., the NAV per Creation Unit Aggregation is less than the Deposit Amount), the creator will receive the Cash Component.
Purchasers of Creation Units must pay to BBH, as transfer agent, a creation fee (the “Creation Transaction Fee”) regardless of the number of Creation Units purchased in the transaction. The Creation Transaction Fee may vary and is based on the composition of the securities included in the Fund’s portfolio and the countries in which the transactions are settled. The Creation Transaction Fee may increase or decrease as the Fund’s portfolio is adjusted to conform to changes in the composition of the securities included in the Fund’s portfolio and the countries in which the transaction settled.
The Creation Transaction fee is currently $550. The price for each Creation Unit will equal the daily NAV per share times the number of shares in a Creation Unit plus the fees described above and, if applicable, any operational processing and brokerage costs, transfer fees or stamp taxes. When the Fund permits an Authorized Participant to substitute cash or a different security in lieu of depositing one or more of the requisite Deposit Securities, the Authorized Participant may also be assessed an amount to cover the cost of purchasing the Deposit Securities and/or disposing of the substituted securities, including operational processing and brokerage costs, transfer fees, stamp taxes, and part or all of the spread between the expected bid and offer side of the market related to such Deposit Securities and/or substitute securities. Page 24 .
Notes to Financial Statements (Continued) First Trust Long/Short Equity ETF (FTLS) October 31, 2014 Parties redeeming Creation Units must pay to BBH, as transfer agent, a redemption transaction fee (the “Redemption Transaction Fee”), regardless of the number of Creation Units redeemed in the transaction. The Redemption Transaction Fee may vary and is based on the composition of the securities included in the Fund’s portfolio and the countries in which the transactions are settled. The Redemption Transaction Fee is currently $550. The Fund reserves the right to affect redemptions in cash.
An Authorized Participant may request cash redemption in lieu of securities; however, the Fund may, in its discretion, reject any such request. 6. Distribution Plan The Board of Trustees adopted a Distribution and Service Plan pursuant to Rule 12b-1 under the 1940 Act. In accordance with the Rule 12b-1 plan, the Fund is authorized to pay an amount up to 0.25% of its average daily net assets each year to reimburse FTP, the distributor of the Fund, for amounts expended to finance activities primarily intended to result in the sale of Creation Units or the provision of investor services.
FTP may also use this amount to compensate securities dealers or other persons that are Authorized Participants for providing distribution assistance, including broker-dealer and shareholder support and educational and promotional services. No 12b-1 fees are currently paid by the Fund, and pursuant to a contractual arrangement, no 12b-1 fees will be paid any time before September 4, 2016. 7. Indemnification The Trust, on behalf of the Fund, has a variety of indemnification obligations under contracts with its service providers. The Fund’s maximum exposure under these arrangements is unknown.
However, the Fund has not had prior claims or losses pursuant to these contracts and expects the risk of loss to be remote. 8. Subsequent Events Management has evaluated the impact of all subsequent events to the Fund through the date the financial statements were issued, and has determined there was the following subsequent event: On November 5, 2014, First Trust Emerging Markets Local Currency Bond ETF, an additional series of the Trust, began trading under the ticker symbol “FEMB” on the NASDAQ. Page 25 . Report of Independent Registered Public Accounting Firm To the Board of Trustees and Shareholders of First Trust Long/Short Equity ETF: We have audited the accompanying statement of assets and liabilities of First Trust Long/Short Equity ETF (the “Fund”), a series of the First Trust Exchange-Traded Fund III, including the portfolio of investments, as of October 31, 2014, and the related statements of operations and changes in net assets and the financial highlights for the period presented. These financial statements and financial highlights are the responsibility of the Fund’s management. Our responsibility is to express an opinion on these financial statements and financial highlights based on our audit. We conducted our audit in accordance with the standards of the Public Company Accounting Oversight Board (United States). Those standards require that we plan and perform the audit to obtain reasonable assurance about whether the financial statements and financial highlights are free of material misstatement.
The Fund is not required to have, nor were we engaged to perform, an audit of its internal control over financial reporting. Our audit included consideration of internal control over financial reporting as a basis for designing audit procedures that are appropriate in the circumstances, but not for the purpose of expressing an opinion on the effectiveness of the Fund’s internal control over financial reporting. Accordingly, we express no such opinion.
An audit also includes examining, on a test basis, evidence supporting the amounts and disclosures in the financial statements, assessing the accounting principles used and significant estimates made by management, as well as evaluating the overall financial statement presentation. Our procedures included confirmation of securities owned as of October 31, 2014 by correspondence with the Fund’s custodians and brokers. We believe that our audit provides a reasonable basis for our opinion. In our opinion, the financial statements and financial highlights referred to above present fairly, in all material respects, the financial position of First Trust Long/Short Equity ETF as of October 31, 2014, and the results of its operations, changes in its net assets, and the financial highlights for the period presented, in conformity with accounting principles generally accepted in the United States of America. Chicago, Illinois December 23, 2014 Page 26 .
Additional Information First Trust Long/Short Equity ETF (FTLS) October 31, 2014 (Unaudited) Proxy Voting Policies and Procedures A description of the policies and procedures that the Trust uses to determine how to vote proxies and information on how the Fund voted proxies relating to portfolio investments during the most recent 12-month period ended June 30 will be available (1) without charge, upon request, by calling (800) 988-5891; (2) on the Fund’s website located at http://www.ftportfolios.com; and (3) on the Securities and Exchange Commission’s (“SEC”) website located at http://www.sec.gov. Portfolio Holdings The Trust files its complete schedule of portfolio holdings with the SEC for the first and third quarters of each fiscal year on Form N-Q. The Trust’s Forms N-Q is available (1) by calling (800) 988-5891; (2) on the Fund’s website located at http://www.ftportfolios.com; (3) on the SEC’s website at http://www.sec.gov; and (4) for review and copying at the SEC’s Public Reference Room (“PRR”) in Washington, DC. Information regarding the operation of the PRR may be obtained by calling (800) SEC-0330. Federal Tax Information For the taxable year ended October 31, 2014, the following percentages of income dividend paid by the Fund qualify for the dividends received deduction available to corporations and is hereby designated as qualified dividend income: Dividends Received Deduction _____________________________ 100% Qualified Dividend Income _____________________________ 100% Advisory Agreement Board Considerations Regarding Approval of Invesment Management Agreement The Board of Trustees of the First Trust Exchange-Traded Fund III (the “Trust”), including the Independent Trustees, unanimously approved the Investment Management Agreement (the “Agreement”) with First Trust Advisors L.P. (“First Trust”) on behalf of the First Trust Long/Short Equity ETF (the “Fund”), for an initial two-year term at a meeting held on July 22, 2014.
The Board of Trustees determined that the Agreement is in the best interests of the Fund in light of the extent and quality of services expected to be provided and such other matters as the Board considered to be relevant in the exercise of its reasonable business judgment. To reach this determination, the Board considered its duties under the Investment Company Act of 1940, as amended (the “1940 Act”), as well as under the general principles of state law in reviewing and approving advisory contracts; the requirements of the 1940 Act in such matters; the fiduciary duty of investment advisors with respect to advisory agreements and compensation; the standards used by courts in determining whether investment company boards have fulfilled their duties; and the factors to be considered by the Board in voting on such agreements. To assist the Board in its evaluation of the Agreement for the Fund, the Independent Trustees received a report in advance of the Board meeting responding to a request for information provided on behalf of the Independent Trustees that, among other things, outlined the services to be provided by First Trust to the Fund (including the relevant personnel responsible for these services and their experience); the proposed unitary fee structure for the Fund as compared to fees charged by advisors to other comparable exchange-traded funds (“ETFs”), and as compared to fees charged to other ETFs managed by First Trust; the estimated expenses to be incurred in providing services to the Fund and the potential for economies of scale, if any; financial data on First Trust; fall out benefits to First Trust and its affiliate, First Trust Portfolios L.P. (“FTP”); and a summary of First Trust’s compliance program. The Independent Trustees also met separately with their independent legal counsel to discuss the information provided by First Trust. The Board applied its business judgment to determine whether the arrangement between the Trust and First Trust is a reasonable business arrangement from the Fund’s perspective as well as from the perspective of shareholders. In evaluating whether to approve the Agreement for the Fund, the Board considered the nature, extent and quality of services to be provided by First Trust under the Agreement and considered that First Trust employees provide management services to other ETFs and to other investment companies in the First Trust fund complex with diligence and care.
The Board considered that the Fund is not designed to track the performance of an index, and investment decisions will be the primary responsibility of First Trust. At the meeting, the Board received a presentation from two members of First Trust’s Alternative Investments Team who would manage the Fund, and were able to ask questions about the proposed investment strategy for the Fund. The Board noted the experience of the Alternative Investments Team, and considered that the First Trust Investment Committee would oversee the Alternative Investments Team in the management of the Fund.
The Board considered that First Trust applies the same oversight model internally with its Alternative Investments Team as it uses for overseeing external sub-advisors. The Board considered the compliance program that had been developed by First Trust and the skills of its employees who would be working with the Fund. It also considered the efforts expended by First Trust in organizing the Trust and in arranging for other entities to provide services to the Fund.
Since the Fund had Page 27 . Additional Information (Continued) First Trust Long/Short Equity ETF (FTLS) October 31, 2014 (Unaudited) yet to commence investment operations, the Board could not consider the historical investment performance of the Fund. In light of the information presented and the considerations made, the Board concluded that the nature, extent and quality of services to be provided to the Fund by First Trust under the Agreement are expected to be satisfactory. The Board reviewed information regarding the proposed unitary fee structure for the Fund. The Board noted that under the Fund’s unitary fee arrangement, the Fund would pay First Trust a fee equal to an annual rate of 0.95% of its average daily net assets and that First Trust would be responsible for the Fund’s ordinary operating expenses, including the cost of transfer agency, custody, fund administration, legal, audit and other services and license fees, but excluding the fee payments under the Agreement, interest, taxes, brokerage commissions and other expenses connected with the execution of portfolio transactions, distribution and service fees pursuant to a Rule 12b-1 plan, if any, and extraordinary expenses. The Board reviewed information provided by First Trust and Lipper Inc.
(“Lipper”), an independent source, for the Fund on the advisory fees and expense ratios of other comparable ETFs, but also noted First Trust’s statements about the limitations on the comparability of the Fund’s Lipper peer group with the Fund. The Board noted that the Fund’s total expense ratio under its proposed unitary fee was equal to the median of its Lipper peer group. The Board also considered data provided by First Trust on the management fees paid by mutual funds following a long/short strategy.
The Board compared the Fund’s unitary fee to the total expense ratios (after fee waivers and/or expense reimbursements, if any) of other First Trust ETFs, including First Trust ETFs that pay a unitary fee, and to the advisory fees charged by First Trust to other advisory clients, noting that First Trust does not provide investment advisory services to registered investment companies that have similar investment objectives and policies to the Fund’s. In light of the information considered and the nature, extent and quality of services expected to be provided to the Fund under the Agreement, the Board determined that the proposed unitary fee for the Fund was fair and reasonable. The Board noted that the proposed unitary fee for the Fund was not structured to pass the benefits of any economies of scale on to shareholders as the Fund’s assets grow. The Board noted that any reduction in fixed costs associated with the management of the Fund would benefit First Trust, but that a unitary fee structure provides a level of certainty in expenses for the Fund.
The Board noted that First Trust has continued to invest in personnel and infrastructure for the First Trust fund complex. The Board took the costs to be borne by First Trust in connection with its services to be performed for the Fund under the Agreement into consideration and noted that First Trust was unable to estimate the profitability of the Agreement for the Fund to First Trust. The Board considered fall-out benefits described by First Trust that may be realized from its relationship with the Fund, including First Trust’s compensation for fund reporting services pursuant to a separate Fund Reporting Services Agreement, which would be included under the unitary fee.
The Board also noted that First Trust would not utilize soft dollars in connection with its management of the Fund’s portfolio. Based on all the information considered and the conclusions reached, the Board, including the Independent Trustees, unanimously determined that the terms of the Agreement are fair and reasonable and that the approval of the Agreement is in the best interests of the Fund. No single factor was determinative in the Board’s analysis. Risk Considerations You could lose money by investing in the Fund. An investment in the Fund is not a deposit of a bank and is not insured or guaranteed by the Federal Deposit Insurance Corporation or any other governmental agency.
There can be no assurance that the Fund’s investment objective will be achieved. CASH TRANSACTIONS RISK. The Fund may, under certain circumstances, effect a portion of creations and redemptions for cash, rather than in-kind securities, particularly for the puts and call options in which the Fund invests. As a result, an investment in the Fund may be less tax-efficient than an investment in an ETF that effects its creations and redemption for in-kind securities. Because the Fund may effect a portion of redemptions for cash, it may be required to sell portfolio securities in order to obtain the cash needed to distribute redemption proceeds.
A sale of shares may result in capital gains or losses, and may also result in higher brokerage costs. DEPOSITARY RECEIPTS RISK. Depositary receipts may be less liquid than the underlying shares in their primary trading market. Any distributions paid to the holders of depositary receipts are usually subject to a fee charged by the depositary.
Holders of depositary receipts may have limited voting rights, and investment restrictions in certain countries may adversely impact the value of depositary receipts because such restrictions may limit the ability to convert the equity shares into depositary receipts and vice versa. Such restrictions may cause the equity shares of the underlying issuer to trade at a discount or premium to the market price of the depositary receipts. DERIVATIVES RISK. The use of futures and other derivatives can lead to losses because of adverse movements in the price or value of the underlying asset, index or rate, which may be magnified by certain features of the derivatives. These risks are heightened when the Fund’s portfolio managers use derivatives to enhance the Fund’s return or as a substitute for a position or security, rather than solely to hedge (or offset) the risk of a position or security held by the Fund. Page 28 .
Additional Information (Continued) First Trust Long/Short Equity ETF (FTLS) October 31, 2014 (Unaudited) EQUITY SECURITIES RISK. The Fund invests in Equity Securities. The value of the shares will fluctuate with changes in the value of these Equity Securities. Equity Securities prices fluctuate for several reasons, including changes in investors’ perceptions of the financial condition of an issuer or the general condition of the relevant stock market, such as the current market volatility, or when political or economic events affecting the issuers occur.
In addition, common stock prices may be particularly sensitive to rising interest rates, as the cost of the capital rises and borrowing costs increase. ETF RISK. The Fund may invest in the shares of other ETFs, and therefore, the Fund’s investment performance and risks may be related to the investment performance and risks of the underlying ETFs. In general, as a shareholder in other ETFs, the Fund bears its ratable share of the underlying ETF’s expenses, and would be subject to duplicative expenses to the extent the Fund invests in other ETFs. MANAGEMENT RISK.
The Fund is subject to management risk because it is an actively managed portfolio. In managing the Fund’s investment portfolio, the Fund’s investment advisor will apply investment techniques and risk analyses that may not have the desired result. There can be no guarantee that the Fund will meet its investment objective. MARKET RISK.
Market risk is the risk that a particular security owned by the Fund or shares of the Fund in general may fall in value. Securities are subject to market fluctuations caused by such factors as economic, political, regulatory or market developments, changes in interest rates and perceived trends in securities prices. Overall securities values could decline generally or could underperform other investments. NEW FUND RISK.
The Fund currently has fewer assets than larger funds, and like other relatively new funds, large inflows and outflows may impact the Fund’s market exposure for limited periods of time. This impact may be positive or negative, depending on the direction of market movement during the period affected. Also, during the initial invest-up period, the Fund may depart from its principal investment strategies and invest a larger amount or all of its assets in cash equivalents or it may hold cash. NON-DIVERSIFICATION RISK.
The Fund is classified as “non-diversified” under the Investment Company Act of 1940, as amended (the “1940 Act”). As a result, the Fund is only limited as to the percentage of its assets that may be invested in the securities of any one issuer by the diversification requirements imposed by the Internal Revenue Code of 1986, as amended (the “Code”). The Fund may invest a relatively high percentage of its assets in a limited number of issuers.
As a result, the Fund may be more susceptible to a single adverse economic or regulatory occurrence affecting one or more of these issuers, experience increased volatility and be highly invested in certain issuers. NON-U.S. SECURITIES RISK. The Fund holds non-U.S.
securities that are either directly listed on a U.S. securities exchange or in the form of depositary receipts. Non-U.S.
securities are subject to higher volatility than securities of domestic issuers due to possible adverse political, social or economic developments; restrictions on foreign investment or exchange of securities; lack of liquidity; currency exchange rates; excessive taxation; government seizure of assets; different legal or accounting standards; and less government supervision and regulation of exchanges in foreign countries. SHORT SALES RISK. The Fund will incur a loss as a result of a short sale if the price of the security sold short increases in value between the date of the short sale and the date on which the Fund purchases the security to replace the borrowed security. In addition, a lender of a security may request, or market conditions may dictate, that securities sold short be returned to the lender on short notice, which may result in the Fund having to buy the securities sold short at an unfavorable price.
If this occurs, any anticipated gain to the Fund may be reduced or eliminated or the short sale may result in a loss. In a rising stock market, the Fund’s short positions may significantly impact the Fund’s overall performance and cause the Fund to underperform traditional long-only equity funds or to sustain losses, particularly in a sharply rising market. The use of short sales may also cause the Fund to have higher expenses than other funds. Page 29 .
Board of Trustees and Officers First Trust Long/Short Equity ETF (FTLS) October 31, 2014 (Unaudited) The Trust’s statement of additional information includes additional information about the Trustees and is available, without charge, upon request, by calling (800) 988-5891. Name, Address, Date of Birth and Position with the Trust Term of Office and Year First Elected or Appointed Principal Occupations During Past 5 Years Number of Portfolios in the First Trust Fund Complex Overseen by Trustee Other Trusteeships or Directorships Held by Trustee During Past 5 Years INDEPENDENT TRUSTEES Richard E. Erickson, Trustee c/o First Trust Advisors L.P. 120 East Liberty Drive, Suite 400 Wheaton, IL 60187 D.O.B.: 04/51 Thomas R. Kadlec, Trustee c/o First Trust Advisors L.P. 120 East Liberty Drive, Suite 400 Wheaton, IL 60187 D.O.B.: 11/57 • Indefinite Term • Since Inception • Indefinite Term • Since Inception Robert F. Keith, Trustee c/o First Trust Advisors L.P. 120 East Liberty Drive, Suite 400 Wheaton, IL 60187 D.O.B.: 11/56 • Indefinite Term Niel B.
Nielson, Trustee c/o First Trust Advisors L.P. 120 East Liberty Drive, Suite 400 Wheaton, IL 60187 D.O.B.: 03/54 • Indefinite Term • Since Inception • Since Inception Physician; President, Wheaton Orthopedics; Limited Partner, Gundersen Real Estate Limited Partnership; Member, Sportsmed LLC 111 None President (March 2010 to Present), Senior Vice President and Chief Financial Officer (May 2007 to March 2010), ADM Investor Services, Inc. (Futures Commission Merchant) 111 Director of ADM Investor Services, Inc., ADM Investor Services International, and Futures Industry Association President (2003 to Present), Hibs Enterprises (Financial and Management Consulting) 111 Director of Trust Company of Illinois Managing Director and Chief Operating Officer (January 2015 to Present), Pelita Harapan Educational Foundation (Educational Products and Services); President and Chief Executive Officer (June 2012 to September 2014), Servant Interactive LLC (Educational Products and Services); President and Chief Executive Officer (June 2012 to September 2014), Dew Learning LLC (Educational Products and Services); President (June 2002 to June 2012), Covenant College 111 Director of Covenant Transport, Inc. (May 2003 to May 2014) 111 None INTERESTED TRUSTEE James A. Bowen(1), Trustee, Chairman of the Board 120 East Liberty Drive, Suite 400 Wheaton, IL 60187 D.O.B.: 09/55 (1) • Indefinite Term • Since Inception Chief Executive Officer (December 2010 to Present), President (until December 2010), First Trust Advisors L.P.
and First Trust Portfolios L.P.; Chairman of the Board of Directors, BondWave LLC (Software Development Company/Investment Advisor and Stonebridge Advisors LLC (Investment Advisor) Mr. Bowen is deemed an “interested person” of the Trust due to his position as Chief Executive Officer of First Trust Advisors L.P., investment advisor of the Trust. Page 30 . Board of Trustees and Officers (Continued) First Trust Long/Short Equity ETF (FTLS) October 31, 2014 (Unaudited) Name, Address and Date of Birth Position and Offices with Trust Term of Office and Length of Service Principal Occupations During Past 5 Years OFFICERS(2) Mark R. Bradley 120 E. Liberty Drive, Suite 400 Wheaton, IL 60187 D.O.B.: 11/57 President and Chief Executive Officer James M. Dykas 120 E.
Liberty Drive, Suite 400 Wheaton, IL 60187 D.O.B.: 01/66 Treasurer, Chief Financial Officer and Chief Accounting Officer W. Scott Jardine 120 E. Liberty Drive, Suite 400 Wheaton, IL 60187 D.O.B.: 05/60 Secretary and Chief Legal Officer Daniel J.
Lindquist 120 E. Liberty Drive, Suite 400 Wheaton, IL 60187 D.O.B.: 02/70 Vice President Kristi A. Maher 120 E.
Liberty Drive, Suite 400 Wheaton, IL 60187 D.O.B.: 12/66 Chief Compliance Officer and Assistant Secretary Roger F. Testin 120 E. Liberty Drive, Suite 400 Wheaton, IL 60187 D.O.B.: 06/66 Vice President Stan Ueland 120 E.
Liberty Drive, Suite 400 Wheaton, IL 60187 D.O.B.: 11/70 Vice President (2) • Indefinite Term • Since Inception • Indefinite Term • Since Inception • Indefinite Term • Since Inception • Indefinite Term • Since Inception • Indefinite Term Chief Operating Officer (December 2010 to Present) and Chief Financial Officer, First Trust Advisors L.P. and First Trust Portfolios L.P.; Chief Financial Officer, BondWave LLC (Software Development Company/Investment Advisor) and Stonebridge Advisors LLC (Investment Advisor) Controller (January 2011 to Present), Senior Vice President (April 2007 to Present), First Trust Advisors L.P. and First Trust Portfolios L.P. General Counsel, First Trust Advisors L.P., First Trust Portfolios L.P.; Secretary and General Counsel, BondWave LLC (Software Development Company/Investment Advisor); Secretary of Stonebridge Advisors LLC (Investment Advisor) Managing Director (July 2012 to Present), Senior Vice President (September 2005 to July 2012), First Trust Advisors L.P.
and First Trust Portfolios L.P. Deputy General Counsel, First Trust Advisors L.P. and First Trust Portfolios L.P. • Since Inception • Indefinite Term Senior Vice President, First Trust Advisors L.P. and First Trust Portfolios L.P. • Since Inception • Indefinite Term • Since Inception Senior Vice President (September 2012 to Present), Vice President (August 2005 to September 2012), First Trust Advisors L.P. and First Trust Portfolios L.P. The term “officer” means the president, vice president, secretary, treasurer, controller or any other officer who performs a policy making function. Page 31 .
Privacy Policy First Trust Long/Short Equity ETF (FTLS) October 31, 2014 (Unaudited) Privacy Policy First Trust values our relationship with you and considers your privacy an important priority in maintaining that relationship. We are committed to protecting the security and confidentiality of your personal information. Sources of Information We collect nonpublic personal information about you from the following sources: • Information we receive from you and your broker-dealer, investment advisor or financial representative through interviews, applications, agreements or other forms; • Information about your transactions with us, our affiliates or others; • Information we receive from your inquiries by mail, e-mail or telephone; and • Information we collect on our website through the use of “cookies”. For example, we may identify the pages on our website that your browser requests or visits. Information Collected The type of data we collect may include your name, address, social security number, age, financial status, assets, income, tax information, retirement and estate plan information, transaction history, account balance, payment history, investment objectives, marital status, family relationships and other personal information. Disclosure of Information We do not disclose any nonpublic personal information about our customers or former customers to anyone, except as permitted by law. In addition to using this information to verify your identity (as required under law), the permitted uses may also include the disclosure of such information to unaffiliated companies for the following reasons: • In order to provide you with products and services and to effect transactions that you request or authorize, we may disclose your personal information as described above to unaffiliated financial service providers and other companies that perform administrative or other services on our behalf, such as transfer agents, custodians and trustees, or that assist us in the distribution of investor materials such as trustees, banks, financial representatives, proxy services, solicitors and printers. • We may release information we have about you if you direct us to do so, if we are compelled by law to do so, or in other legally limited circumstances (for example to protect your account from fraud). In addition, in order to alert you to our other financial products and services, we may share your personal information within First Trust. Privacy Online We allow third-party companies, including AddThis (a social media sharing service), to collect certain anonymous information when you visit our website.
These companies may use non-personally identifiable information during your visits to this and other websites in order to provide advertisements about goods and services likely to be of greater interest to you. These companies typically use a cookie, third party web beacon or pixel tags, to collect this information. To learn more about this behavioral advertising practice, you can visit www.networkadvertising.org. Confidentiality and Security With regard to our internal security procedures, First Trust restricts access to your nonpublic personal information to those First Trust employees who need to know that information to provide products or services to you.
We maintain physical, electronic and procedural safeguards to protect your nonpublic personal information. Policy Updates and Inquiries As required by federal law, we will notify you of our privacy policy annually. We reserve the right to modify this policy at any time, however, if we do change it, we will tell you promptly. For questions about our policy, or for additional copies of this notice, please go to www.ftportfolios.com, or contact us at 1-800-621-1675 (First Trust Portfolios) or 1-800-222-6822 (First Trust Advisors). Page 32 .
First Trust Exchange-Traded Fund III INVESTMENT ADVISOR First Trust Advisors L.P. 120 East Liberty Drive, Suite 400 Wheaton, IL 60187 ADMINISTRATOR, CUSTODIAN, FUND ACCOUNTANT & TRANSFER AGENT Brown Brothers Harriman & Co. 50 Post Office Square Boston, MA 02110 INDEPENDENT REGISTERED PUBLIC ACCOUNTING FIRM Deloitte & Touche LLP 111 S. Wacker Drive Chicago, IL 60606 LEGAL COUNSEL Chapman and Cutler LLP 111 W. Monroe Street Chicago, IL 60603 . .
. . .
. . .
. . .
. . .
. . .
. . .
. . .
. . .
. . .
. . .
. . .
. . .
. . .
. . .
. . .
. . .
. . .
. . .
. . .
. . .
. . .
. . .
. . .
. . .
. . .
. . .
. . .
. . .
. . . Fund Performance Overview .
. . .
. . .
. . .
. . .
. . .
. . .
. . .
. . .
. . .
. . .
. . .
. . .
. . .
. . .
. . .
. . .
. . .
. . .
. . .
. . .
. . .
. . .
. . .
. . .
. . .
. . .
. . . Portfolio Commentary .
. . .
. . .
. . .
. . .
. . .
. . .
. . .
. . .
. . .
. . .
. . .
. . .
. . .
. . .
. . .
. . .
. . .
. . .
. . .
. . .
. . .
. . .
. . .
. . .
. . .
. . .
. . .
. . .
. . . Understanding Your Fund Expenses .
. . .
. . .
. . .
. . .
. . .
. . .
. . .
. . .
. . .
. . .
. . .
. . .
. . .
. . .
. . .
. . .
. . .
. . .
. . .
. . .
. . .
. . .
. . .
. . .
. . .
. Portfolio of Investments . . .
. . .
. . .
. . .
. . .
. . .
. . .
. . .
. . .
. . .
. . .
. . .
. . .
. . .
. . .
. . .
. . .
. . .
. . .
. . .
. . .
. . .
. . .
. . .
. . .
. . .
. . .
. . .
. . Statement of Assets and Liabilities . .
. . .
. . .
. . .
. . .
. . .
. . .
. . .
. . .
. . .
. . .
. . .
. . .
. . .
. . .
. . .
. . .
. . .
. . .
. . .
. . .
. . .
. . .
. . .
. . .
. . .
. Statement of Operations . . .
. . .
. . .
. . .
. . .
. . .
. . .
. . .
. . .
. . .
. . .
. . .
. . .
. . .
. . .
. . .
. . .
. . .
. . .
. . .
. . .
. . .
. . .
. . .
. . .
. . .
. . .
. . .
. . Statement of Changes in Net Assets . .
. . .
. . .
. . .
. . .
. . .
. . .
. . .
. . .
. . .
. . .
. . .
. . .
. . .
. . .
. . .
. . .
. . .
. . .
. . .
. . .
. . .
. . .
. . .
. . .
. . . Financial Highlights .
. . .
. . .
. . .
. . .
. . .
. . .
. . .
. . .
. . .
. . .
. . .
. . .
. . .
. . .
. . .
. . .
. . .
. . .
. . .
. . .
. . .
. . .
. . .
. . .
. . .
. . .
. . .
. . .
. . .
. Notes to Financial Statements . . .
. . .
. . .
. . .
. . .
. . .
. . .
. . .
. . .
. . .
. . .
. . .
. . .
. . .
. . .
. . .
. . .
. . .
. . .
. . .
. . .
. . .
. . .
. . .
. . .
. . .
. . .
. Report of Independent Registered Public Accounting Firm . . .
. . .
. . .
. . .
. . .
. . .
. . .
. . .
. . .
. . .
. . .
. . .
. . .
. . .
. . .
. . .
. . .
. . .
. . .
. . Additional Information . .
. . .
. . .
. . .
. . .
. . .
. . .
. . .
. . .
. . .
. . .
. . .
. . .
. . .
. . .
. . .
. . .
. . .
. . .
. . .
. . .
. . .
. . .
. . .
. . .
. . .
. . .
. . .
. . .
. Board of Trustees and Officers . . .
. . .
. . .
. . .
. . .
. . .
. . .
. . .
. . .
. . .
. . .
. . .
. . .
. . .
. . .
. . .
. . .
. . .
. . .
. . .
. . .
. . .
. . .
. . .
. . .
. . .
. . . Privacy Policy .
. . .
. . .
. . .
. . .
. . .
. . .
. . .
. . .
. . .
. . .
. . .
. . .
. . .
. . .
. . .
. . .
. . .
. . .
. . .
. . .
. . .
. . .
. . .
. . .
. . .
. . .
. . .
. . .
. . .
. . .
. . . 1 2 5 7 8 17 18 19 20 21 26 27 30 32 Caution Regarding Forward-Looking Statements This report contains certain forward-looking statements within the meaning of the Securities Act of 1933, as amended, and the Securities Exchange Act of 1934, as amended.
Forward-looking statements include statements regarding the goals, beliefs, plans or current expectations of First Trust Advisors L.P. (“First Trust” or the “Advisor”) and its representatives, taking into account the information currently available to them. Forward-looking statements include all statements that do not relate solely to current or historical fact.
For example, forward-looking statements include the use of words such as “anticipate,” “estimate,” “intend,” “expect,” “believe,” “plan,” “may,” “should,” “would” or other words that convey uncertainty of future events or outcomes. Forward-looking statements involve known and unknown risks, uncertainties and other factors that may cause the actual results, performance or achievements of the series of First Trust Exchange-Traded Fund III (the “Trust”) described in this report for the First Trust Long/Short Equity ETF (hereinafter referred to as the “Fund”) to be materially different from any future results, performance or achievements expressed or implied by the forward-looking statements. When evaluating the information included in this report, you are cautioned not to place undue reliance on these forward-looking statements, which reflect the judgment of the Advisor and its representatives only as of the date hereof. We undertake no obligation to publicly revise or update these forward-looking statements to reflect events and circumstances that arise after the date hereof. Performance and Risk Disclosure There is no assurance that the Fund will achieve its investment objective.
The Fund is subject to market risk, which is the possibility that the market values of securities owned by the Fund will decline and that the value of the Fund shares may therefore be less than what you paid for them. Accordingly, you can lose money investing in the Fund. See “Risk Considerations” in the Additional Information section of this report for a discussion of certain other risks of investing in the Fund. Performance data quoted represents past performance, which is no guarantee of future results, and current performance may be lower or higher than the figures shown.
For the most recent month-end performance figures, please visit http://www.ftportfolios.com or speak with your financial advisor. Investment returns, net asset value and share price will fluctuate and Fund shares, when sold, may be worth more or less than their original cost. How to Read This Report This report contains information that may help you evaluate your investment. It includes details about the Fund’s portfolio and presents data and analysis that provide insight into the Fund’s performance and investment approach. The statistical information that follows may help you understand the Fund’s performance compared to that of relevant market benchmarks. It is important to keep in mind that the opinions expressed by personnel of the Advisor are just that: informed opinions.
They should not be considered to be promises or advice. The opinions, like the statistics, cover the period through the date on the cover of this report. The risks of investing in the Fund are spelled out in its prospectus, statement of additional information, this report and other Fund regulatory filings. .
Shareholder Letter First Trust Long/Short Equity ETF (FTLS) Annual Letter from the Chairman and CEO October 31, 2014 Dear Shareholders: I am pleased to present you with the annual report for your investment in First Trust Long/Short Equity ETF (the “Fund”). This report provides detailed information about the Fund, including a performance review and the financial statements since the Fund’s inception. I encourage you to read this document and discuss it with your financial advisor. Although markets have seemed choppy over the past 12 months, the U.S. has shown sustained growth over the period.
In fact, the S&P 500® Index, as measured on a total return basis, rose 17.27% during the period. First Trust Advisors L.P. (“First Trust”) believes that staying invested in quality products through different types of markets can benefit investors over the long term. First Trust offers a variety of products that we believe could fit the financial plans for many investors seeking long-term investment success.
We invite you to look at our investment products with your financial advisor to determine if any of them might fit your financial goals. We believe that regularly discussing your financial objectives and investment options with your financial advisor can help keep you on track. First Trust will continue to make available up-to-date information about your investments so you and your financial advisor are current on any First Trust investments you own. We value our relationship with you, and thank you for the opportunity to assist you in achieving your financial goals. Sincerely, James A.
Bowen Chairman of the Board of Trustees Chief Executive Officer of First Trust Advisors L.P. Page 1 . Fund Performance Overview (Unaudited) First Trust Long/Short Equity ETF (FTLS) First Trust Long/Short Equity ETF’s (the “Fund”) investment objective is to seek to provide investors with long-term total return. The Fund pursued its objective by establishing long and short positions in a portfolio of Equity Securities (as defined below). Under normal circumstances, at least 80% of the Fund’s net assets (plus the amount of any borrowing for investment purposes) will be exposed to U.S. exchange-listed equity securities of U.S. and foreign companies by investing in such securities directly and/or in U.S.
exchange-traded funds (“ETFs”) that provide exposure to such securities. The securities of the companies and ETFs in which the Fund will invest are referred to collectively as “Equity Securities.” The Equity Securities held by the Fund may include U.S. exchange-listed equity securities of foreign issuers, as well as investments in the equity securities of foreign issuers that are in the form of depositary receipts. The Fund takes long and short positions in Equity Securities. As opposed to taking long positions in which an investor seeks to profit from increases in the price of a security, short selling is a technique that will be used by the Fund to try and profit from the falling price of a security.
Short selling involves selling a security that has been borrowed from a third party with the intention of buying an identical security back at a later date to return to that third party. Having both long and short positions in an equity security portfolio is a common way to create returns that are independent of market moves. One advantage of a long and short portfolio is that the long and short positions may offset one another in a manner that results in a lower net exposure to the direction of the market. In addition, cash balances arising from the use of short selling typically will be held in money market instruments. Performance Cumulative Total Returns Inception (9/8/14) to 10/31/14 Fund Performance NAV Market Price Index Performance S&P 500® Index 1.86% 1.99% 1.05% Total returns for the period since inception are calculated from the inception date of the Fund. The Fund’s per share net asset value (“NAV”) is the value of one share of the Fund and is computed by dividing the value of all assets of the Fund (including accrued interest and dividends), less all liabilities (including accrued expenses and dividends declared but unpaid), by the total number of outstanding shares.
The price used to calculate market return (“Market Price”) is determined by using the midpoint between the highest bid and the lowest offer on the stock exchange on which shares of the Fund are listed for trading as of the time that the Fund’s NAV is calculated. Since shares of the Fund did not trade in the secondary market until after its inception, for the period from inception to the first day of secondary market trading in shares of the Fund, the NAV of the Fund is used as a proxy for the secondary market trading price to calculate market returns. NAV and market returns assume that all dividend distributions have been reinvested in the Fund at NAV and Market Price, respectively. An index is a statistical composite that tracks a specified financial market or sector.
Unlike the Fund, the index does not actually hold a portfolio of securities and therefore does not incur the expenses incurred by the Fund. These expenses negatively impact the performance of the Fund. Also, market returns do not include brokerage commissions that may be payable on secondary market transactions.
If brokerage commissions were included, market returns would be lower. The total returns presented reflect the reinvestment of dividends on securities in the index. The returns presented do not reflect the deduction of taxes that a shareholder would pay on Fund distributions or the redemption or sale of Fund shares.
The investment return and principal value of shares of the Fund will vary with changes in market conditions. Shares of the Fund may be worth more or less than their original cost when they are redeemed or sold in the market. The Fund’s past performance is no guarantee of future performance. Page 2 .
Fund Performance Overview (Unaudited) (Continued) First Trust Long/Short Equity ETF (FTLS) Portfolio Sector Allocation as of October 31, 2014 Sector Information Technology Consumer Staples Financials Health Care Industrials Consumer Discretionary Energy Materials Telecommunication Total Top Ten Securities Sold Short as of October 31, 2014 %* 23.9% 19.9 16.7 16.3 8.3 8.2 4.9 1.9 -0.1 ________ 100.0% ________ ________ % of Net Assets SPDR S&P 500 ETF Trust Total System Services, Inc. Waters Corp. Hershey (The) Co. Federal Realty Investment Trust Aramark Wells Fargo & Co. JM Smucker (The) Co. AT&T, Inc. PPG Industries, Inc. Total -0.5% -0.4 -0.4 -0.4 -0.4 -0.4 -0.4 -0.4 -0.4 -0.4 ________ -4.1% ________ ________ * Represents % of long-term investments and securities sold short. Top Ten Long-Term Portfolio Holdings as of October 31, 2014 % of Net Assets Home Depot (The), Inc. Wal-Mart Stores, Inc. Simon Property Group, Inc. Intuit, Inc. QUALCOMM, Inc. Philip Morris International, Inc. Amgen, Inc. Visa, Inc., Class A U.S. Bancorp Vector Group Ltd. Total 3.3% 3.2 3.1 2.8 2.7 2.6 2.5 2.5 2.4 2.4 ________ 27.5% ________ ________ Page 3 . Fund Performance Overview (Unaudited) (Continued) First Trust Long/Short Equity ETF (FTLS) Performance of a $10,000 Initial Investment September 8, 2014 - October 31, 2014 $11,500 $11,000 $10,500 $10,186 $10,105 $10,000 $9,500 $9,000 9/8/14 10/31/14 First Trust Long/Short Equity ETF S&P 500® Index Performance figures assume reinvestment of all dividend distributions and do not reflect the deduction of taxes that a shareholder would pay on Fund distributions or the redemption or sale of Fund shares. An index is a statistical composite that tracks a specified financial market or sector. Unlike the Fund, the index does not actually hold a portfolio of securities and therefore does not incur the expenses incurred by the Fund. These expenses negatively impact the performance of the Fund. The Fund’s past performance does not predict future performance. Frequency Distribution of Discounts and Premiums Bid/Ask Midpoint vs.
NAV through October 31, 2014 The following Frequency Distribution of Discounts and Premiums charts are provided to show the frequency at which the bid/ask midpoint price for the Fund was at a discount or premium to the daily NAV. The following tables are for comparative purposes only and represent the period September 9, 2014 (commencement of trading) through October 31, 2014. Shareholders may pay more than NAV when they buy Fund shares and receive less than NAV when they sell those shares because shares are bought and sold at current market price.
Data presented represents past performance and cannot be used to predict future results. For the Period 9/9/14 - 10/31/14 Number of Days Bid/Ask Midpoint At/Above NAV 0.00%-0.49% 0.50%-0.99% 1.00%-1.99% 23 3 0 >=2.00% 0 For the Period 9/9/14 - 10/31/14 Number of Days Bid/Ask Midpoint Below NAV 0.00%-0.49% 0.50%-0.99% 1.00%-1.99% 9 4 0 >=2.00% 0 Page 4 . Portfolio Commentary First Trust Long/Short Equity ETF (FTLS) Annual Report October 31, 2014 Investment Manager The First Trust Advisors L.P. (“First Trust”) Alternatives Investment team was formed in July of 2011 and is headed by John Gambla, CFA, FRM, PRM and Rob Guttschow, CFA. Prior to joining First Trust, Messrs. Gambla and Guttschow were Co-Chief Investment Officers at Nuveen Hyde Park, a quantitative money manager.
The team focuses on systematic and disciplined strategies using a variety of statistical techniques along with a fundamental overlay based upon their combined 40+ years of investment experience. Currently the team manages/consults for a variety of portfolios structured as exchanged-traded funds and separately managed accounts in the United States, Canada, and Mexico. Portfolio Management Team John Gambla – CFA, FRM, PRM, Senior Portfolio Manager Rob Guttschow – CFA, Senior Portfolio Manager Commentary First Trust Long/Short Equity ETF The First Trust Long/Short Equity ETF (the “Fund”), which commenced trading on September 8, 2014, is an actively managed exchange-traded fund. The Fund’s investment objective is to seek to provide investors with long-term total return.
The Fund invests at least 80% of its net assets in U.S. exchange-listed equity securities of U.S. and foreign companies such as common stocks and ETFs. The Fund may invest up to 20% of its net assets (plus the amount of any borrowing for investment purposes) in U.S.
exchange-listed equity index future contracts. These futures will be used to gain long or short exposure to broad-based equity indexes. Overall Market Recap This commentary discusses the 12-month overall market performance ended October 31, 2014 and the Fund’s performance for the period from the Fund’s inception date, September 8, 2014, to October 31, 2014. U.S. economic growth dipped into negative territory during the first quarter of 2014, as extremely cold weather throughout the Midwest and East Coast dampened economic activity.
However, growth quickly resumed in the second quarter, jumping from -2.1% annualized growth in the first quarter to 4.6% growth in the second quarter. Third quarter estimates for growth in the U.S. economy show consensus estimates of a 3.0% annualized third quarter growth rate.
Coincident with GDP growth, the widely watched unemployment rate fell to 5.9% by the end of the third quarter. With solid, but certainly not spectacular, economic growth and an unemployment rate falling well through the Federal Reserve’s (the “Fed”) 2013 stated threshold for the removal of “crisis” level interest rates, the third quarter brought forth a more heated debate about when and how the Fed would begin to raise rates. The Fed’s asset purchase program and the ultra-low Fed Funds rate are widely believed to have been supportive of the U.S. equity markets.
With the asset purchase program likely ending in November, the markets have been increasingly focused on when the Fed will begin to raise short-term rates and how that will affect the fixed-income and U.S. equity markets. The Fed’s response to the “when” question, in summary, has been “it depends upon the data.” Regardless of the exact timing of the first rate increases, a data-dependent Fed is likely to result in a data-dependent market, implying that higher levels of market volatility are here to stay, in our opinion. U.S. equity markets, as represented by the S&P 500® Index, have responded to the solid economic growth by rallying 8.34% calendar year-to-date.
Earnings, as reported by Standard & Poor’s, have been supportive with estimated earnings for the S&P 500® Index growing by 10.85% in the third quarter versus 2013 third quarter earnings. That marked the second solid quarter in a row, as second quarter earnings were up 11.3% versus second quarter earnings in 2013. One conundrum in this rosy picture has been the performance of the small-cap sector of the U.S.
equity markets. Small-cap stocks, as represented by the S&P 600® Index, are down -3.73% on the year. Through August, small-cap stocks were slightly positive before falling 5.37% in September.
September brought forth growing concerns that global growth was slowing, and the growth sensitive small-stock sector was the first to respond with a big downturn. Fund Performance The Fund’s inception date was September 8, 2014. The Fund’s performance from inception through October 31, 2014 was 1.99% on a market price basis and 1.86% on NAV. The Fund’s benchmark, the S&P 500® Index (“benchmark”), returned 1.05% during the same period.
The Fund paid its first distribution in September of $.0162/share. FTLS is an actively managed, broadly diversified, long/short strategy that incorporates earnings quality as one of the major components in the investment process. The Fund’s portfolio managers believe that high-earning quality stocks will outperform low-quality earnings stocks over time. Unlike traditional long-only equity funds, FTLS has the potential to benefit not only from buying companies deemed to be high-quality companies, but also by selling (“shorting”) companies viewed as low quality.
The Fund has maintained a long bias of approximately 80% net market exposure with long positions, totaling approximately 100%, and short positions totaling approximately 20% of the Fund’s NAV. Page 5 . Portfolio Commentary (Continued) First Trust Long/Short Equity ETF (FTLS) Annual Report October 31, 2014 The Fund maintained a significant long overweight in Consumer Staples and significant long underweight in Energy and Utilities. The top ten long positions comprised 27.5% of the Fund with Home Depot (HD) being the largest position at 3.3%. The top ten short positions comprised 4.1% of the Fund with S&P 500 Depositary Receipts (SPDR) being the largest short position at 0.5%. During October, the Fund increased the overall size of its short positions in response to a large increase in market volatility by shorting the S&P 500® and Russell 2000® ETFs.
The short position in the Russell 2000® was closed out before fiscal year end as volatility subsided. Market and Fund Outlook Today, we believe the Fund is well positioned to achieve its objective of providing long-term total return. The Fund is invested in a broad array of U.S. equity securities with a focus on earnings quality.
Useful investment information exists across the entire distribution of earnings quality. A long/short approach in which there is a long bias of high-quality stocks and a short bias of lower-earnings quality stocks affords the opportunity to extract additional performance while potentially hedging market exposure. We believe this provides a solid framework to generate attractive risk-adjusted total returns going forward. Page 6 .
First Trust Long/Short Equity ETF (FTLS) Understanding Your Fund Expenses October 31, 2014 (Unaudited) As a shareholder of First Trust Long/Short Equity ETF (the “Fund”) you incur two types of costs: (1) transaction costs; and (2) ongoing costs, including management fees, distribution and/or service fees, if any, and other Fund expenses. This Example is intended to help you understand your ongoing costs of investing in the Fund and to compare these costs with the ongoing costs of investing in other funds. The Example is based on an investment of $1,000 invested at the beginning of the period (or since inception) and held through the sixmonth (or shorter) period ended October 31, 2014. Actual Expenses The first line in the following table provides information about actual account values and actual expenses. You may use the information in this line, together with the amount you invested, to estimate the expenses that you paid over the period. Simply divide your account value by $1,000 (for example, an $8,600 account value divided by $1,000 = 8.6), then multiply the result by the number in the first line under the heading entitled “Expenses Paid During the Period” to estimate the expenses you paid on your account during this six-month period. Hypothetical Example for Comparison Purposes The second line in the following table provides information about hypothetical account values and hypothetical expenses based on each Fund’s actual expense ratio and an assumed rate of return of 5% per year before expenses, which is not each Fund’s actual return. The hypothetical account values and expenses may not be used to estimate the actual ending account balance or expenses you paid for the period.
You may use this information to compare the ongoing costs of investing in the Fund and other funds. To do so, compare this 5% hypothetical example with the 5% hypothetical examples that appear in the shareholder reports of the other funds. Please note that the expenses shown in the table are meant to highlight your ongoing costs only and do not reflect any transactional costs such as brokerage commissions. Therefore, the second line in the table is useful in comparing ongoing costs only, and will not help you determine the relative total costs of owning different funds.
In addition, if these transactional costs were included, your costs would have been higher. Beginning Account Value September 8, 2014 First Trust Long/Short Equity ETF Actual Hypothetical (5% return before expenses) Ending Account Value October 31, 2014 Annualized Expense Ratio Based on the Number of Days in the Period $1,000.00 $1,000.00 $1,018.60 $1,020.42 0.95% 0.95% Expenses Paid During the Period September 8, 2014 (a) to October 31, 2014 (b) $1.39 $4.84 (a) Inception date. (b) Actual expenses are equal to the annualized expense ratio as indicated in the table, multiplied by the average account value over the period (September 8, 2014 through October 31, 2014), multiplied by 53/365. Hypothetical expenses are assumed for the most recent one-half year period. Page 7 . First Trust Long/Short Equity ETF (FTLS) Portfolio of Investments October 31, 2014 Shares Description _____________ _______________________________________________________________________________________________________________________ COMMON STOCKS – 99.5% Aerospace & Defense - 2.3% 359 Huntington Ingalls Industries, Inc. (a) . . .
. . .
. . .
. . .
. . .
. . .
. . .
. . .
. . .
. . .
. . .
. . .
. . .
. . .
. . .
. . .
. . .
. . .
. 175 TransDigm Group, Inc. (a) . .
. . .
. . .
. . .
. . .
. . .
. . .
. . .
. . .
. . .
. . .
. . .
. . .
. . .
. . .
. . .
. . .
. . .
. . .
. . .
. . .
. . Air Freight & Logistics – 1.8% 331 FedEx Corp. (a) .
. . .
. . .
. . .
. . .
. . .
. . .
. . .
. . .
. . .
. . .
. . .
. . .
. . .
. . .
. . .
. . .
. . .
. . .
. . .
. . .
. . .
. . .
. . .
. . Airlines – 1.9% 293 Delta Air Lines, Inc. (a) .
. . .
. . .
. . .
. . .
. . .
. . .
. . .
. . .
. . .
. . .
. . .
. . .
. . .
. . .
. . .
. . .
. . .
. . .
. . .
. . .
. . .
. . 1,338 Southwest Airlines Co. (a) .
. . .
. . .
. . .
. . .
. . .
. . .
. . .
. . .
. . .
. . .
. . .
. . .
. . .
. . .
. . .
. . .
. . .
. . .
. . .
. . .
. . . 427 977 797 255 1,717 Banks –4.9% BankUnited, Inc.
(a) . . .
. . .
. . .
. . .
. . .
. . .
. . .
. . .
. . .
. . .
. . .
. . .
. . .
. . .
. . .
. . .
. . .
. . .
. . .
. . .
. . .
. . .
. . . BB&T Corp.
(a) . . .
. . .
. . .
. . .
. . .
. . .
. . .
. . .
. . .
. . .
. . .
. . .
. . .
. . .
. . .
. . .
. . .
. . .
. . .
. . .
. . .
. . .
. . .
. . . Fifth Third Bancorp (a) .
. . .
. . .
. . .
. . .
. . .
. . .
. . .
. . .
. . .
. . .
. . .
. . .
. . .
. . .
. . .
. . .
. . .
. . .
. . .
. . .
. . .
. . SunTrust Banks, Inc. (a) .
. . .
. . .
. . .
. . .
. . .
. . .
. . .
. . .
. . .
. . .
. . .
. . .
. . .
. . .
. . .
. . .
. . .
. . .
. . .
. . .
. . .
. . U.S. Bancorp (a) .
. . .
. . .
. . .
. . .
. . .
. . .
. . .
. . .
. . .
. . .
. . .
. . .
. . .
. . .
. . .
. . .
. . .
. . .
. . .
. . .
. . .
. . .
. . .
. . 472 146 602 588 Biotechnology – 6.4% Amgen, Inc. (a) .
. . .
. . .
. . .
. . .
. . .
. . .
. . .
. . .
. . .
. . .
. . .
. . .
. . .
. . .
. . .
. . .
. . .
. . .
. . .
. . .
. . .
. . .
. . .
. . . Biogen Idec, Inc.
(a) (b) . . .
. . .
. . .
. . .
. . .
. . .
. . .
. . .
. . .
. . .
. . .
. . .
. . .
. . .
. . .
. . .
. . .
. . .
. . .
. . .
. . .
. . . Dyax Corp.
(a) (b) . . .
. . .
. . .
. . .
. . .
. . .
. . .
. . .
. . .
. . .
. . .
. . .
. . .
. . .
. . .
. . .
. . .
. . .
. . .
. . .
. . .
. . .
. . .
. Gilead Sciences, Inc. (a) (b) . .
. . .
. . .
. . .
. . .
. . .
. . .
. . .
. . .
. . .
. . .
. . .
. . .
. . .
. . .
. . .
. . .
. . .
. . .
. . .
. . .
. 156 237 150 223 106 92 Chemicals - 2.3% A Schulman, Inc. (a) . .
. . .
. . .
. . .
. . .
. . .
. . .
. . .
. . .
. . .
. . .
. . .
. . .
. . .
. . .
. . .
. . .
. . .
. . .
. . .
. . .
. . .
. . .
. LyondellBasell Industries NV (a) . . .
. . .
. . .
. . .
. . .
. . .
. . .
. . .
. . .
. . .
. . .
. . .
. . .
. . .
. . .
. . .
. . .
. . .
. . .
. . Mosaic (The) Co. (a) .
. . .
. . .
. . .
. . .
. . .
. . .
. . .
. . .
. . .
. . .
. . .
. . .
. . .
. . .
. . .
. . .
. . .
. . .
. . .
. . .
. . .
. . .
. RPM International, Inc. (a) . .
. . .
. . .
. . .
. . .
. . .
. . .
. . .
. . .
. . .
. . .
. . .
. . .
. . .
. . .
. . .
. . .
. . .
. . .
. . .
. . .
. . Scotts Miracle-Gro (The) Co., Class A (a) . .
. . .
. . .
. . .
. . .
. . .
. . .
. . .
. . .
. . .
. . .
. . .
. . .
. . .
. . .
. . .
. . .
. Sherwin-Williams (The) Co. (a) . .
. . .
. . .
. . .
. . .
. . .
. . .
. . .
. . .
. . .
. . .
. . .
. . .
. . .
. . .
. . .
. . .
. . .
. . .
. . .
. 730 584 152 1,043 Communications Equipment – 4.1% ARRIS Group, Inc. (a) (b) . .
. . .
. . .
. . .
. . .
. . .
. . .
. . .
. . .
. . .
. . .
. . .
. . .
. . .
. . .
. . .
. . .
. . .
. . .
. . .
. . .
. . Brocade Communications Systems, Inc. (a) .
. . .
. . .
. . .
. . .
. . .
. . .
. . .
. . .
. . .
. . .
. . .
. . .
. . .
. . .
. . .
. . .
. Palo Alto Networks, Inc. (a) (b) . .
. . .
. . .
. . .
. . .
. . .
. . .
. . .
. . .
. . .
. . .
. . .
. . .
. . .
. . .
. . .
. . .
. . .
. . .
. . .
. QUALCOMM, Inc. (a) . .
. . .
. . .
. . .
. . .
. . .
. . .
. . .
. . .
. . .
. . .
. . .
. . .
. . .
. . .
. . .
. . .
. . .
. . .
. . .
. . .
. . .
. . Construction & Engineering - 0.3% 219 Argan, Inc. (a) .
. . .
. . .
. . .
. . .
. . .
. . .
. . .
. . .
. . .
. . .
. . .
. . .
. . .
. . .
. . .
. . .
. . .
. . .
. . .
. . .
. . .
. . .
. . .
. . .
. Consumer Finance – 1.8% 678 Capital One Financial Corp. (a) . .
. . .
. . .
. . .
. . .
. . .
. . .
. . .
. . .
. . .
. . .
. . .
. . .
. . .
. . .
. . .
. . .
. . .
. . .
. . .
. Containers & Packaging - 0.2% 247 Berry Plastics Group, Inc. (a) (b) . .
. . .
. . .
. . .
. . .
. . .
. . .
. . .
. . .
. . .
. . .
. . .
. . .
. . .
. . .
. . .
. . .
. . .
. . .
. . . Distributors - 0.7% 227 Genuine Parts Co.
(a) . . .
. . .
. . .
. . .
. . .
. . .
. . .
. . .
. . .
. . .
. . .
. . .
. . .
. . .
. . .
. . .
. . .
. . .
. . .
. . .
. . .
. . .
. . Page 8 See Notes to Financial Statements Value _________________ $ 37,990 32,730----------------------------------70,720 -----------------------------------55,409 ------------------------------------ 11,788 46,134----------------------------------57,922 -----------------------------------12,767 37,009 15,932 9,981 73,144----------------------------------148,833 -----------------------------------76,549 46,877 7,447 65,856----------------------------------196,729 -----------------------------------5,524 21,716 6,647 10,102 6,279 21,120----------------------------------71,388 -----------------------------------21,915 6,266 16,066 81,886 -----------------------------------126,133----------------------------------7,623 ------------------------------------ 56,118 ------------------------------------ 6,427 ------------------------------------ 22,037 ------------------------------------ . First Trust Long/Short Equity ETF (FTLS) Portfolio of Investments (Continued) October 31, 2014 Shares Description _____________ _______________________________________________________________________________________________________________________ COMMON STOCKS (Continued) Diversified Financial Services - 1.4% 772 Citigroup, Inc. (a) . . .
. . .
. . .
. . .
. . .
. . .
. . .
. . .
. . .
. . .
. . .
. . .
. . .
. . .
. . .
. . .
. . .
. . .
. . .
. . .
. . .
. . .
. . .
. . Diversified Telecommunication Services - 0.4% 472 Consolidated Communications Holdings, Inc. (a) .
. . .
. . .
. . .
. . .
. . .
. . .
. . .
. . .
. . .
. . .
. . .
. . .
. . .
. . .
. . . Electrical Equipment - 0.2% 114 AMETEK, Inc.
(a) . . .
. . .
. . .
. . .
. . .
. . .
. . .
. . .
. . .
. . .
. . .
. . .
. . .
. . .
. . .
. . .
. . .
. . .
. . .
. . .
. . .
. . .
. . .
. Electronic Equipment, Instruments & Components - 0.4% 161 Zebra Technologies Corp., Class A (a) (b) . . .
. . .
. . .
. . .
. . .
. . .
. . .
. . .
. . .
. . .
. . .
. . .
. . .
. . .
. . .
. . .
. . .
. Energy Equipment & Services - 0.6% 650 Forum Energy Technologies, Inc. (a) (b) . .
. . .
. . .
. . .
. . .
. . .
. . .
. . .
. . .
. . .
. . .
. . .
. . .
. . .
. . .
. . .
. . .
. . . 120 508 1,665 1,286 Food & Staples Retailing -7.8% Andersons Inc./The (a) .
. . .
. . .
. . .
. . .
. . .
. . .
. . .
. . .
. . .
. . .
. . .
. . .
. . .
. . .
. . .
. . .
. . .
. . .
. . .
. . .
. . .
. . . Costco Wholesale Corp.
(a) . . .
. . .
. . .
. . .
. . .
. . .
. . .
. . .
. . .
. . .
. . .
. . .
. . .
. . .
. . .
. . .
. . .
. . .
. . .
. . .
. . . Sysco Corp.
(a) . . .
. . .
. . .
. . .
. . .
. . .
. . .
. . .
. . .
. . .
. . .
. . .
. . .
. . .
. . .
. . .
. . .
. . .
. . .
. . .
. . .
. . .
. . .
. . .
. Wal-Mart Stores, Inc. (a) . .
. . .
. . .
. . .
. . .
. . .
. . .
. . .
. . .
. . .
. . .
. . .
. . .
. . .
. . .
. . .
. . .
. . .
. . .
. . .
. . .
. . . 439 532 295 742 Food Products – 2.4% Campbell Soup Co.
(a) . . .
. . .
. . .
. . .
. . .
. . .
. . .
. . .
. . .
. . .
. . .
. . .
. . .
. . .
. . .
. . .
. . .
. . .
. . .
. . .
. . .
. . .
. ConAgra Foods, Inc. (a) . .
. . .
. . .
. . .
. . .
. . .
. . .
. . .
. . .
. . .
. . .
. . .
. . .
. . .
. . .
. . .
. . .
. . .
. . .
. . .
. . .
. . .
. Fresh Del Monte Produce, Inc. (a) . .
. . .
. . .
. . .
. . .
. . .
. . .
. . .
. . .
. . .
. . .
. . .
. . .
. . .
. . .
. . .
. . .
. . .
. . .
. . Pinnacle Foods, Inc. (a) .
. . .
. . .
. . .
. . .
. . .
. . .
. . .
. . .
. . .
. . .
. . .
. . .
. . .
. . .
. . .
. . .
. . .
. . .
. . .
. . .
. . .
. . 106 12 787 263 259 Health Care Equipment & Supplies – 3.5% C.R. Bard, Inc.
(a) . . .
. . .
. . .
. . .
. . .
. . .
. . .
. . .
. . .
. . .
. . .
. . .
. . .
. . .
. . .
. . .
. . .
. . .
. . .
. . .
. . .
. . .
. . .
. . Intuitive Surgical, Inc.(a) (b) . .
. . .
. . .
. . .
. . .
. . .
. . .
. . .
. . .
. . .
. . .
. . .
. . .
. . .
. . .
. . .
. . .
. . .
. . .
. . .
. . . Medtronic, Inc.
(a) . . .
. . .
. . .
. . .
. . .
. . .
. . .
. . .
. . .
. . .
. . .
. . .
. . .
. . .
. . .
. . .
. . .
. . .
. . .
. . .
. . .
. . .
. . .
. Stryker Corp. (a) . .
. . .
. . .
. . .
. . .
. . .
. . .
. . .
. . .
. . .
. . .
. . .
. . .
. . .
. . .
. . .
. . .
. . .
. . .
. . .
. . .
. . .
. . .
. . .
. Zeltiq Aesthetics, Inc. (a) (b) . .
. . .
. . .
. . .
. . .
. . .
. . .
. . .
. . .
. . .
. . .
. . .
. . .
. . .
. . .
. . .
. . .
. . .
. . .
. . .
. . . Health Care Providers & Services - 0.5% 70 Henry Schein, Inc.
(a) (b) . . .
. . .
. . .
. . .
. . .
. . .
. . .
. . .
. . .
. . .
. . .
. . .
. . .
. . .
. . .
. . .
. . .
. . .
. . .
. . .
. . .
. . 106 MEDNAX, Inc. (a) (b) .
. . .
. . .
. . .
. . .
. . .
. . .
. . .
. . .
. . .
. . .
. . .
. . .
. . .
. . .
. . .
. . .
. . .
. . .
. . .
. . .
. . .
. . . 8 455 138 542 Hotels, Restaurants & Leisure - 2.2% Chipotle Mexican Grill, Inc.
(a) (b) . . .
. . .
. . .
. . .
. . .
. . .
. . .
. . .
. . .
. . .
. . .
. . .
. . .
. . .
. . .
. . .
. . .
. . .
. . . Diamond Resorts International, Inc.
(a) (b) . . .
. . .
. . .
. . .
. . .
. . .
. . .
. . .
. . .
. . .
. . .
. . .
. . .
. . .
. . .
. . .
. . . Las Vegas Sands Corp.
(a) . . .
. . .
. . .
. . .
. . .
. . .
. . .
. . .
. . .
. . .
. . .
. . .
. . .
. . .
. . .
. . .
. . .
. . .
. . .
. . .
. . .
. Marriott International, Inc./DE (a) . . .
. . .
. . .
. . .
. . .
. . .
. . .
. . .
. . .
. . .
. . .
. . .
. . .
. . .
. . .
. . .
. . .
. . .
. . .
. Household Durables - 0.2% 52 Harman International Industries, Inc. (a) . .
. . .
. . .
. . .
. . .
. . .
. . .
. . .
. . .
. . .
. . .
. . .
. . .
. . .
. . .
. . .
. . .
. . . Household Products - 2.0% 455 Clorox (The) Co.
(a) . . .
. . .
. . .
. . .
. . .
. . .
. . .
. . .
. . .
. . .
. . .
. . .
. . .
. . .
. . .
. . .
. . .
. . .
. . .
. . .
. . .
. . .
. . . 746 Harbinger Group, Inc.
(a) (b) . . .
. . .
. . .
. . .
. . .
. . .
. . .
. . .
. . .
. . .
. . .
. . .
. . .
. . .
. . .
. . .
. . .
. . .
. . .
. . .
. . 70 Spectrum Brands Holdings, Inc. (a) .
. . .
. . .
. . .
. . .
. . .
. . .
. . .
. . .
. . .
. . .
. . .
. . .
. . .
. . .
. . .
. . .
. . .
. . .
. . See Notes to Financial Statements Value _________________ $----------------------------------41,325 12,225 ------------------------------------ 5,945 ------------------------------------ 11,874 ------------------------------------ 17,745 ------------------------------------ 7,648 67,752 64,169 98,083 -----------------------------------237,652----------------------------------19,391 18,274 9,472 25,080----------------------------------72,217 -----------------------------------17,381 5,950 53,642 23,020 6,641 -----------------------------------106,634 -----------------------------------8,402 6,618 -----------------------------------15,020----------------------------------5,104 11,812 8,592 41,056----------------------------------66,564 -----------------------------------5,582 ------------------------------------ 45,273 9,802 6,341 -----------------------------------61,416----------------------------------Page 9 . First Trust Long/Short Equity ETF (FTLS) Portfolio of Investments (Continued) October 31, 2014 Shares Description _____________ _______________________________________________________________________________________________________________________ COMMON STOCKS (Continued) Industrial Conglomerates - 0.3% 66 Roper Industries, Inc. (a) . . .
. . .
. . .
. . .
. . .
. . .
. . .
. . .
. . .
. . .
. . .
. . .
. . .
. . .
. . .
. . .
. . .
. . .
. . .
. . .
. . .
. . 88 213 646 24 Internet & Catalog Retail - 2.1% Expedia, Inc. (a) .
. . .
. . .
. . .
. . .
. . .
. . .
. . .
. . .
. . .
. . .
. . .
. . .
. . .
. . .
. . .
. . .
. . .
. . .
. . .
. . .
. . .
. . .
. . .
. . Liberty Media Corp. - Interactive, Class A (a) (b) .
. . .
. . .
. . .
. . .
. . .
. . .
. . .
. . .
. . .
. . .
. . .
. . .
. . .
. . .
. . Liberty Ventures (a) (b) . .
. . .
. . .
. . .
. . .
. . .
. . .
. . .
. . .
. . .
. . .
. . .
. . .
. . .
. . .
. . .
. . .
. . .
. . .
. . .
. . .
. . .
. priceline.com, Inc. (a) (b) . .
. . .
. . .
. . .
. . .
. . .
. . .
. . .
. . .
. . .
. . .
. . .
. . .
. . .
. . .
. . .
. . .
. . .
. . .
. . .
. . .
. . . Internet Software & Services - 1.3% 469 eBay, Inc.
(a) (b) . . .
. . .
. . .
. . .
. . .
. . .
. . .
. . .
. . .
. . .
. . .
. . .
. . .
. . .
. . .
. . .
. . .
. . .
. . .
. . .
. . .
. . .
. . .
. . . 118 IAC/InterActiveCorp.
(a) . . .
. . .
. . .
. . .
. . .
. . .
. . .
. . .
. . .
. . .
. . .
. . .
. . .
. . .
. . .
. . .
. . .
. . .
. . .
. . .
. . .
. . 104 VeriSign, Inc. (a) (b) .
. . .
. . .
. . .
. . .
. . .
. . .
. . .
. . .
. . .
. . .
. . .
. . .
. . .
. . .
. . .
. . .
. . .
. . .
. . .
. . .
. . .
. . .
. . 303 263 1,085 138 313 1,280 IT Services – 6.2% Accenture PLC, Class A (a) . .
. . .
. . .
. . .
. . .
. . .
. . .
. . .
. . .
. . .
. . .
. . .
. . .
. . .
. . .
. . .
. . .
. . .
. . .
. . .
. . .
. Booz Allen Hamilton Holding Corp. (a) . .
. . .
. . .
. . .
. . .
. . .
. . .
. . .
. . .
. . .
. . .
. . .
. . .
. . .
. . .
. . .
. . .
. . . Broadridge Financial Solutions, Inc.
(a) . . .
. . .
. . .
. . .
. . .
. . .
. . .
. . .
. . .
. . .
. . .
. . .
. . .
. . .
. . .
. . .
. . .
. . Syntel, Inc. (a) (b) .
. . .
. . .
. . .
. . .
. . .
. . .
. . .
. . .
. . .
. . .
. . .
. . .
. . .
. . .
. . .
. . .
. . .
. . .
. . .
. . .
. . .
. . .
. . .
. Visa, Inc., Class A (a) . . .
. . .
. . .
. . .
. . .
. . .
. . .
. . .
. . .
. . .
. . .
. . .
. . .
. . .
. . .
. . .
. . .
. . .
. . .
. . .
. . .
. . .
. . Western Union Co. (a) .
. . .
. . .
. . .
. . .
. . .
. . .
. . .
. . .
. . .
. . .
. . .
. . .
. . .
. . .
. . .
. . .
. . .
. . .
. . .
. . .
. . .
. . . Life Sciences Tools & Services – 1.6% 46 Illumina, Inc.
(a) (b) . . .
. . .
. . .
. . .
. . .
. . .
. . .
. . .
. . .
. . .
. . .
. . .
. . .
. . .
. . .
. . .
. . .
. . .
. . .
. . .
. . .
. . .
. . . 347 Thermo Fisher Scientific, Inc.
(a) . . .
. . .
. . .
. . .
. . .
. . .
. . .
. . .
. . .
. . .
. . .
. . .
. . .
. . .
. . .
. . .
. . .
. . .
. . .
. Machinery – 1.6% 746 Allison Transmission Holdings, Inc. (a) . .
. . .
. . .
. . .
. . .
. . .
. . .
. . .
. . .
. . .
. . .
. . .
. . .
. . .
. . .
. . .
. . .
. . . 154 Parker Hannifin Corp.
(a) . . .
. . .
. . .
. . .
. . .
. . .
. . .
. . .
. . .
. . .
. . .
. . .
. . .
. . .
. . .
. . .
. . .
. . .
. . .
. . .
. . .
. . 58 WABCO Holdings, Inc. (a) (b) .
. . .
. . .
. . .
. . .
. . .
. . .
. . .
. . .
. . .
. . .
. . .
. . .
. . .
. . .
. . .
. . .
. . .
. . .
. . .
. . 873 1,057 375 225 Metals & Mining – 0.8% Coeur Mining, Inc. (a) (b) .
. . .
. . .
. . .
. . .
. . .
. . .
. . .
. . .
. . .
. . .
. . .
. . .
. . .
. . .
. . .
. . .
. . .
. . .
. . .
. . .
. . . Gold Resource Corp.
(a) . . .
. . .
. . .
. . .
. . .
. . .
. . .
. . .
. . .
. . .
. . .
. . .
. . .
. . .
. . .
. . .
. . .
. . .
. . .
. . .
. . .
. . . SunCoke Energy, Inc.
(a) . . .
. . .
. . .
. . .
. . .
. . .
. . .
. . .
. . .
. . .
. . .
. . .
. . .
. . .
. . .
. . .
. . .
. . .
. . .
. . .
. . .
. . United States Steel Corp. (a) .
. . .
. . .
. . .
. . .
. . .
. . .
. . .
. . .
. . .
. . .
. . .
. . .
. . .
. . .
. . .
. . .
. . .
. . .
. . .
. . .
. 249 177 134 1,583 66 919 351 140 Oil, Gas & Consumable Fuels – 4.5% Bonanza Creek Energy, Inc. (a) (b) . .
. . .
. . .
. . .
. . .
. . .
. . .
. . .
. . .
. . .
. . .
. . .
. . .
. . .
. . .
. . .
. . .
. . .
. . .
. Cabot Oil & Gas Corp. (a) . .
. . .
. . .
. . .
. . .
. . .
. . .
. . .
. . .
. . .
. . .
. . .
. . .
. . .
. . .
. . .
. . .
. . .
. . .
. . .
. . .
. . Green Plains Renewable Energy, Inc. (a) .
. . .
. . .
. . .
. . .
. . .
. . .
. . .
. . .
. . .
. . .
. . .
. . .
. . .
. . .
. . .
. . .
. . . Kosmos Energy Ltd.
(a) (b) . . .
. . .
. . .
. . .
. . .
. . .
. . .
. . .
. . .
. . .
. . .
. . .
. . .
. . .
. . .
. . .
. . .
. . .
. . .
. . .
. . . Marathon Petroleum Corp.
(a) . . .
. . .
. . .
. . .
. . .
. . .
. . .
. . .
. . .
. . .
. . .
. . .
. . .
. . .
. . .
. . .
. . .
. . .
. . .
. . .
. Phillips 66 (a) . . .
. . .
. . .
. . .
. . .
. . .
. . .
. . .
. . .
. . .
. . .
. . .
. . .
. . .
. . .
. . .
. . .
. . .
. . .
. . .
. . .
. . .
. . .
. . .
. . Valero Energy Corp. (a) .
. . .
. . .
. . .
. . .
. . .
. . .
. . .
. . .
. . .
. . .
. . .
. . .
. . .
. . .
. . .
. . .
. . .
. . .
. . .
. . .
. . .
. . World Fuel Services Corp. (a) .
. . .
. . .
. . .
. . .
. . .
. . .
. . .
. . .
. . .
. . .
. . .
. . .
. . .
. . .
. . .
. . .
. . .
. . .
. . .
. . . Page 10 See Notes to Financial Statements Value _________________ $----------------------------------10,448 7,477 5,568 22,675 28,949 -----------------------------------64,669----------------------------------24,623 7,987 6,215----------------------------------38,825 -----------------------------------24,579 6,930 47,664 11,952 75,568 21,709 -----------------------------------188,402 -----------------------------------8,858 40,797----------------------------------49,655 -----------------------------------24,230 19,563 5,648 -----------------------------------49,441 -----------------------------------3,230 4,112 8,962 9,009 -----------------------------------25,313----------------------------------11,265 5,505 4,583 14,769 5,999 72,141 17,582 5,774 -----------------------------------137,618----------------------------------- .
First Trust Long/Short Equity ETF (FTLS) Portfolio of Investments (Continued) October 31, 2014 Shares Description _____________ _______________________________________________________________________________________________________________________ COMMON STOCKS (Continued) Paper & Forest Products - 0.4% 86 Clearwater Paper Corp. (a) (b) . . .
. . .
. . .
. . .
. . .
. . .
. . .
. . .
. . .
. . .
. . .
. . .
. . .
. . .
. . .
. . .
. . .
. . .
. . .
. . .
. 108 Neenah Paper, Inc. (a) . .
. . .
. . .
. . .
. . .
. . .
. . .
. . .
. . .
. . .
. . .
. . .
. . .
. . .
. . .
. . .
. . .
. . .
. . .
. . .
. . .
. . .
. . Pharmaceuticals – 3.6% 225 Actavis plc (a) (b) . .
. . .
. . .
. . .
. . .
. . .
. . .
. . .
. . .
. . .
. . .
. . .
. . .
. . .
. . .
. . .
. . .
. . .
. . .
. . .
. . .
. . .
. . .
. . . 829 Bristol-Myers Squibb Co.
(a) . . .
. . .
. . .
. . .
. . .
. . .
. . .
. . .
. . .
. . .
. . .
. . .
. . .
. . .
. . .
. . .
. . .
. . .
. . .
. . .
. . 38 Jazz Pharmaceuticals PLC (a) (b) . .
. . .
. . .
. . .
. . .
. . .
. . .
. . .
. . .
. . .
. . .
. . .
. . .
. . .
. . .
. . .
. . .
. . .
. . .
. . Professional Services - 0.5% 261 Robert Half International, Inc. (a) .
. . .
. . .
. . .
. . .
. . .
. . .
. . .
. . .
. . .
. . .
. . .
. . .
. . .
. . .
. . .
. . .
. . .
. . .
. . . 453 756 3,365 187 241 656 6,772 148 520 586 Real Estate Investment Trusts – 9.5% American Capital Agency Corp.
(a) . . .
. . .
. . .
. . .
. . .
. . .
. . .
. . .
. . .
. . .
. . .
. . .
. . .
. . .
. . .
. . .
. . .
. . .
. . . American Realty Capital Proper (a) .
. . .
. . .
. . .
. . .
. . .
. . .
. . .
. . .
. . .
. . .
. . .
. . .
. . .
. . .
. . .
. . .
. . .
. . .
. . Annaly Capital Management, Inc. (a) .
. . .
. . .
. . .
. . .
. . .
. . .
. . .
. . .
. . .
. . .
. . .
. . .
. . .
. . .
. . .
. . .
. . .
. . . Digital Realty Trust, Inc.
(a) . . .
. . .
. . .
. . .
. . .
. . .
. . .
. . .
. . .
. . .
. . .
. . .
. . .
. . .
. . .
. . .
. . .
. . .
. . .
. . .
. . . Health Care REIT, Inc.
(a) . . .
. . .
. . .
. . .
. . .
. . .
. . .
. . .
. . .
. . .
. . .
. . .
. . .
. . .
. . .
. . .
. . .
. . .
. . .
. . .
. . .
. Host Hotels & Resorts, Inc. (a) . .
. . .
. . .
. . .
. . .
. . .
. . .
. . .
. . .
. . .
. . .
. . .
. . .
. . .
. . .
. . .
. . .
. . .
. . .
. . .
. MFA Mortgage Investments, Inc. (a) . .
. . .
. . .
. . .
. . .
. . .
. . .
. . .
. . .
. . .
. . .
. . .
. . .
. . .
. . .
. . .
. . .
. . .
. . . Public Storage (a) .
. . .
. . .
. . .
. . .
. . .
. . .
. . .
. . .
. . .
. . .
. . .
. . .
. . .
. . .
. . .
. . .
. . .
. . .
. . .
. . .
. . .
. . .
. . .
. Simon Property Group, Inc. (a) . .
. . .
. . .
. . .
. . .
. . .
. . .
. . .
. . .
. . .
. . .
. . .
. . .
. . .
. . .
. . .
. . .
. . .
. . .
. . .
. Starwood Property Trust, Inc. (a) . .
. . .
. . .
. . .
. . .
. . .
. . .
. . .
. . .
. . .
. . .
. . .
. . .
. . .
. . .
. . .
. . .
. . .
. . .
. . . 277 104 255 851 Semiconductors & Semiconductor Equipment – 2.4% Broadcom Corp.
(a) . . .
. . .
. . .
. . .
. . .
. . .
. . .
. . .
. . .
. . .
. . .
. . .
. . .
. . .
. . .
. . .
. . .
. . .
. . .
. . .
. . .
. . .
. . . KLA-Tencor Corp.
(a) . . .
. . .
. . .
. . .
. . .
. . .
. . .
. . .
. . .
. . .
. . .
. . .
. . .
. . .
. . .
. . .
. . .
. . .
. . .
. . .
. . .
. . .
. Monolithic Power Systems, Inc. (a) . .
. . .
. . .
. . .
. . .
. . .
. . .
. . .
. . .
. . .
. . .
. . .
. . .
. . .
. . .
. . .
. . .
. . .
. . .
. Texas Instruments, Inc. (a) . .
. . .
. . .
. . .
. . .
. . .
. . .
. . .
. . .
. . .
. . .
. . .
. . .
. . .
. . .
. . .
. . .
. . .
. . .
. . .
. . .
. . 570 205 241 544 46 975 130 199 Software – 6.0% Adobe Systems, Inc. (a) (b) .
. . .
. . .
. . .
. . .
. . .
. . .
. . .
. . .
. . .
. . .
. . .
. . .
. . .
. . .
. . .
. . .
. . .
. . .
. . .
. . .
. . Aspen Technology, Inc. (a) (b) .
. . .
. . .
. . .
. . .
. . .
. . .
. . .
. . .
. . .
. . .
. . .
. . .
. . .
. . .
. . .
. . .
. . .
. . .
. . .
. . . Autodesk, Inc.
(a) (b) . . .
. . .
. . .
. . .
. . .
. . .
. . .
. . .
. . .
. . .
. . .
. . .
. . .
. . .
. . .
. . .
. . .
. . .
. . .
. . .
. . .
. . .
. . CA, Inc. (a) .
. . .
. . .
. . .
. . .
. . .
. . .
. . .
. . .
. . .
. . .
. . .
. . .
. . .
. . .
. . .
. . .
. . .
. . .
. . .
. . .
. . .
. . .
. . .
. . .
. . . FactSet Research Systems, Inc.
(a) . . .
. . .
. . .
. . .
. . .
. . .
. . .
. . .
. . .
. . .
. . .
. . .
. . .
. . .
. . .
. . .
. . .
. . .
. . . Intuit, Inc.
(a) . . .
. . .
. . .
. . .
. . .
. . .
. . .
. . .
. . .
. . .
. . .
. . .
. . .
. . .
. . .
. . .
. . .
. . .
. . .
. . .
. . .
. . .
. . .
. . .
. . NetScout Systems, Inc. (a) (b) .
. . .
. . .
. . .
. . .
. . .
. . .
. . .
. . .
. . .
. . .
. . .
. . .
. . .
. . .
. . .
. . .
. . .
. . .
. . .
. . . SS&C Technologies Holdings, Inc.
(a) . . .
. . .
. . .
. . .
. . .
. . .
. . .
. . .
. . .
. . .
. . .
. . .
. . .
. . .
. . .
. . .
. . .
. . . Specialty Retail - 3.7% 44 Advance Auto Parts, Inc.
(a) . . .
. . .
. . .
. . .
. . .
. . .
. . .
. . .
. . .
. . .
. . .
. . .
. . .
. . .
. . .
. . .
. . .
. . .
. . .
. . .
. . 10 AutoZone, Inc. (a) (b) .
. . .
. . .
. . .
. . .
. . .
. . .
. . .
. . .
. . .
. . .
. . .
. . .
. . .
. . .
. . .
. . .
. . .
. . .
. . .
. . .
. . .
. . .
. 1,019 Home Depot (The), Inc. (a) . .
. . .
. . .
. . .
. . .
. . .
. . .
. . .
. . .
. . .
. . .
. . .
. . .
. . .
. . .
. . .
. . .
. . .
. . .
. . .
. . .
. Value _________________ $ 5,534 6,589----------------------------------12,123 -----------------------------------54,616 48,240 6,416 -----------------------------------109,272----------------------------------14,298 ------------------------------------ 10,301 6,706 38,395 12,901 17,138 15,291 56,750 27,282 93,189 13,220 -----------------------------------291,173 -----------------------------------11,601 8,231 11,268 42,261 -----------------------------------73,361----------------------------------39,968 7,571 13,867 15,808 6,046 85,810 4,792 9,616 -----------------------------------183,478 -----------------------------------6,466 5,535 99,373 -----------------------------------111,374 ------------------------------------ Technology Hardware, Storage & Peripherals - 0.7% 219 Western Digital Corp. (a) . .
. . .
. . .
. . .
. . .
. . .
. . .
. . .
. . .
. . .
. . .
. . .
. . .
. . .
. . .
. . .
. . .
. . .
. . .
. . .
. . .
. . . See Notes to Financial Statements 21,543 ------------------------------------ Page 11 .
First Trust Long/Short Equity ETF (FTLS) Portfolio of Investments (Continued) October 31, 2014 Shares Description _____________ _______________________________________________________________________________________________________________________ COMMON STOCKS (Continued) Textiles, Apparel & Luxury Goods - 1.0% 343 NIKE, Inc., Class B (a) . . . .
. . .
. . .
. . .
. . .
. . .
. . .
. . .
. . .
. . .
. . .
. . .
. . .
. . .
. . .
. . .
. . .
. . .
. . .
. . .
. . .
. . . Tobacco – 5.0% 883 Philip Morris International, Inc.
(a) . . .
. . .
. . .
. . .
. . .
. . .
. . .
. . .
. . .
. . .
. . .
. . .
. . .
. . .
. . .
. . .
. . .
. . .
. . . 3,263 Vector Group Ltd.
(a) . . .
. . .
. . .
. . .
. . .
. . .
. . .
. . .
. . .
. . .
. . .
. . .
. . .
. . .
. . .
. . .
. . .
. . .
. . .
. . .
. . .
. . .
. . Total Long-Term Investments . .
. . .
. . .
. . .
. . .
. . .
. . .
. . .
. . .
. . .
. . .
. . .
. . .
. . .
. . .
. . .
. . .
. . .
. . .
. (Cost $2,986,636) (c) Value _________________ $----------------------------------31,889 78,596 72,895----------------------------------151,491 -----------------------------------3,037,911 ------------------------------------ EXCHANGE-TRADED FUNDS SOLD SHORT - (0.5%) Capital Markets - (0.5%) (80) SPDR S&P 500 ETF Trust . . .
. . .
. . .
. . .
. . .
. . .
. . .
. . .
. . .
. . .
. . .
. . .
. . .
. . .
. . .
. . .
. . .
. . .
. . .
. . .
. . .
. Total Exchange-Traded Funds Sold Short . . .
. . .
. . .
. . .
. . .
. . .
. . .
. . .
. . .
. . .
. . .
. . .
. . .
. . .
. . .
. . (Proceeds $(15,060)) (16,133) ------------------------------------ (16,133) ------------------------------------ COMMON STOCKS SOLD SHORT - (19.5%) Aerospace & Defense - (0.3%) (18) Alliant Techsystems, Inc. .
. . .
. . .
. . .
. . .
. . .
. . .
. . .
. . .
. . .
. . .
. . .
. . .
. . .
. . .
. . .
. . .
. . .
. . .
. . .
. . .
. . .
. (60) Hexcel Corp. (b) . .
. . .
. . .
. . .
. . .
. . .
. . .
. . .
. . .
. . .
. . .
. . .
. . .
. . .
. . .
. . .
. . .
. . .
. . .
. . .
. . .
. . .
. . .
. . .
. (52) Triumph Group, Inc. . .
. . .
. . .
. . .
. . .
. . .
. . .
. . .
. . .
. . .
. . .
. . .
. . .
. . .
. . .
. . .
. . .
. . .
. . .
. . .
. . .
. . .
. . .
. Auto Components - (0.2%) (38) Tenneco, Inc.(b) . . .
. . .
. . .
. . .
. . .
. . .
. . .
. . .
. . .
. . .
. . .
. . .
. . .
. . .
. . .
. . .
. . .
. . .
. . .
. . .
. . .
. . .
. . .
. . . (24) TRW Automotive Holdings Corp.
(b) . . .
. . .
. . .
. . .
. . .
. . .
. . .
. . .
. . .
. . .
. . .
. . .
. . .
. . .
. . .
. . .
. . .
. . .
. (23) Visteon Corp. (b) . .
. . .
. . .
. . .
. . .
. . .
. . .
. . .
. . .
. . .
. . .
. . .
. . .
. . .
. . .
. . .
. . .
. . .
. . .
. . .
. . .
. . .
. . .
. . . Banks - (1.2%) (43) Bank of Hawaii Corp.
. . .
. . .
. . .
. . .
. . .
. . .
. . .
. . .
. . .
. . .
. . .
. . .
. . .
. . .
. . .
. . .
. . .
. . .
. . .
. . .
. . .
. . .
. . (102) BOK Financial Corp. .
. . .
. . .
. . .
. . .
. . .
. . .
. . .
. . .
. . .
. . .
. . .
. . .
. . .
. . .
. . .
. . .
. . .
. . .
. . .
. . .
. . .
. . .
. (97) M&T Bank Corp. . .
. . .
. . .
. . .
. . .
. . .
. . .
. . .
. . .
. . .
. . .
. . .
. . .
. . .
. . .
. . .
. . .
. . .
. . .
. . .
. . .
. . .
. . .
. . . (183) Old National Bancorp/IN .
. . .
. . .
. . .
. . .
. . .
. . .
. . .
. . .
. . .
. . .
. . .
. . .
. . .
. . .
. . .
. . .
. . .
. . .
. . .
. . .
. . .
. (234) Wells Fargo & Co. . .
. . .
. . .
. . .
. . .
. . .
. . .
. . .
. . .
. . .
. . .
. . .
. . .
. . .
. . .
. . .
. . .
. . .
. . .
. . .
. . .
. . .
. . .
. . Biotechnology - (0.1%) (181) Ironwood Pharmaceuticals, Inc. (b) .
. . .
. . .
. . .
. . .
. . .
. . .
. . .
. . .
. . .
. . .
. . .
. . .
. . .
. . .
. . .
. . .
. . .
. . .
. . Chemicals - (1.5%) (59) Air Products & Chemicals, Inc. .
. . .
. . .
. . .
. . .
. . .
. . .
. . .
. . .
. . .
. . .
. . .
. . .
. . .
. . .
. . .
. . .
. . .
. . .
. . .
. . (99) Ecolab, Inc. .
. . .
. . .
. . .
. . .
. . .
. . .
. . .
. . .
. . .
. . .
. . .
. . .
. . .
. . .
. . .
. . .
. . .
. . .
. . .
. . .
. . .
. . .
. . .
. . .
. . . (42) Monsanto Co.
. . .
. . .
. . .
. . .
. . .
. . .
. . .
. . .
. . .
. . .
. . .
. . .
. . .
. . .
. . .
. . .
. . .
. . .
. . .
. . .
. . .
. . .
. . .
. . .
. . (59) PPG Industries, Inc. .
. . .
. . .
. . .
. . .
. . .
. . .
. . .
. . .
. . .
. . .
. . .
. . .
. . .
. . .
. . .
. . .
. . .
. . .
. . .
. . .
. . .
. . .
. . (91) Praxair, Inc. .
. . .
. . .
. . .
. . .
. . .
. . .
. . .
. . .
. . .
. . .
. . .
. . .
. . .
. . .
. . .
. . .
. . .
. . .
. . .
. . .
. . .
. . .
. . .
. . .
. . . Commercial Services & Supplies - (0.3%) (61) MSA Safety, Inc.
. . .
. . .
. . .
. . .
. . .
. . .
. . .
. . .
. . .
. . .
. . .
. . .
. . .
. . .
. . .
. . .
. . .
. . .
. . .
. . .
. . .
. . .
. . .
. . . (88) Pitney Bowes, Inc.
. . .
. . .
. . .
. . .
. . .
. . .
. . .
. . .
. . .
. . .
. . .
. . .
. . .
. . .
. . .
. . .
. . .
. . .
. . .
. . .
. . .
. . .
. . .
. Page 12 See Notes to Financial Statements (2,105) (2,513) (3,621) -----------------------------------(8,239) -----------------------------------(1,990) (2,432) (2,160) -----------------------------------(6,582) -----------------------------------(2,518) (6,993) (11,851) (2,663) (12,423) -----------------------------------(36,448) -----------------------------------(2,538) ------------------------------------ (7,945) (11,012) (4,831) (12,018) (11,465) -----------------------------------(47,271) -----------------------------------(3,506) (2,177) . First Trust Long/Short Equity ETF (FTLS) Portfolio of Investments (Continued) October 31, 2014 Shares Description _____________ _______________________________________________________________________________________________________________________ COMMON STOCKS SOLD SHORT (Continued) Commercial Services & Supplies (Continued) (33) UniFirst Corp./MA . . . .
. . .
. . .
. . .
. . .
. . .
. . .
. . .
. . .
. . .
. . .
. . .
. . .
. . .
. . .
. . .
. . .
. . .
. . .
. . .
. . .
. . .
. . . Containers & Packaging (0.7%) (177) AptarGroup, Inc.
. . .
. . .
. . .
. . .
. . .
. . .
. . .
. . .
. . .
. . .
. . .
. . .
. . .
. . .
. . .
. . .
. . .
. . .
. . .
. . .
. . .
. . .
. . .
. . . (129) Owens-Illinois, Inc.
(b) . . .
. . .
. . .
. . .
. . .
. . .
. . .
. . .
. . .
. . .
. . .
. . .
. . .
. . .
. . .
. . .
. . .
. . .
. . .
. . .
. . .
. . .
. (146) Silgan Holdings, Inc. . .
. . .
. . .
. . .
. . .
. . .
. . .
. . .
. . .
. . .
. . .
. . .
. . .
. . .
. . .
. . .
. . .
. . .
. . .
. . .
. . .
. . .
. . . Diversified Consumer Services - (0.6%) (56) Grand Canyon Education, Inc.
(b) . . .
. . .
. . .
. . .
. . .
. . .
. . .
. . .
. . .
. . .
. . .
. . .
. . .
. . .
. . .
. . .
. . .
. . .
. . .
. (135) H&R Block, Inc. . .
. . .
. . .
. . .
. . .
. . .
. . .
. . .
. . .
. . .
. . .
. . .
. . .
. . .
. . .
. . .
. . .
. . .
. . .
. . .
. . .
. . .
. . .
. . .
. (546) Houghton Mifflin Harcourt Co. (b) . .
. . .
. . .
. . .
. . .
. . .
. . .
. . .
. . .
. . .
. . .
. . .
. . .
. . .
. . .
. . .
. . .
. . .
. . .
. Diversified Telecommunication Services - (0.4%) (346) AT&T, Inc. . .
. . .
. . .
. . .
. . .
. . .
. . .
. . .
. . .
. . .
. . .
. . .
. . .
. . .
. . .
. . .
. . .
. . .
. . .
. . .
. . .
. . .
. . .
. . .
. . .
. . Electrical Equipment - (0.1%) (83) Babcock & Wilcox Co./The . .
. . .
. . .
. . .
. . .
. . .
. . .
. . .
. . .
. . .
. . .
. . .
. . .
. . .
. . .
. . .
. . .
. . .
. . .
. . .
. . .
. (69) Franklin Electric Co., Inc. . .
. . .
. . .
. . .
. . .
. . .
. . .
. . .
. . .
. . .
. . .
. . .
. . .
. . .
. . .
. . .
. . .
. . .
. . .
. . .
. . .
. . Electronic Equipment, Instruments & Components - (0.4%) (29) FEI Co. .
. . .
. . .
. . .
. . .
. . .
. . .
. . .
. . .
. . .
. . .
. . .
. . .
. . .
. . .
. . .
. . .
. . .
. . .
. . .
. . .
. . .
. . .
. . .
. . .
. . .
. . . (35) IPG Photonics Corp.
(b) . . .
. . .
. . .
. . .
. . .
. . .
. . .
. . .
. . .
. . .
. . .
. . .
. . .
. . .
. . .
. . .
. . .
. . .
. . .
. . .
. . .
. . . (223) National Instruments Corp.
. . .
. . .
. . .
. . .
. . .
. . .
. . .
. . .
. . .
. . .
. . .
. . .
. . .
. . .
. . .
. . .
. . .
. . .
. . .
. . .
. . . Energy Equipment & Services – (0.1%) (34) Bristow Group, Inc.
. . .
. . .
. . .
. . .
. . .
. . .
. . .
. . .
. . .
. . .
. . .
. . .
. . .
. . .
. . .
. . .
. . .
. . .
. . .
. . .
. . .
. . .
. . . Food & Staples Retailing – (0.2%) (90) United Natural Foods, Inc.
(b) . . .
. . .
. . .
. . .
. . .
. . .
. . .
. . .
. . .
. . .
. . .
. . .
. . .
. . .
. . .
. . .
. . .
. . .
. . .
. . .
. Food Products - (1.0%) (132) Hershey (The) Co. . .
. . .
. . .
. . .
. . .
. . .
. . .
. . .
. . .
. . .
. . .
. . .
. . .
. . .
. . .
. . .
. . .
. . .
. . .
. . .
. . .
. . .
. . .
. . (118) JM Smucker (The) Co. .
. . .
. . .
. . .
. . .
. . .
. . .
. . .
. . .
. . .
. . .
. . .
. . .
. . .
. . .
. . .
. . .
. . .
. . .
. . .
. . .
. . .
. . . (130) Post Holdings, Inc.
(b) . . .
. . .
. . .
. . .
. . .
. . .
. . .
. . .
. . .
. . .
. . .
. . .
. . .
. . .
. . .
. . .
. . .
. . .
. . .
. . .
. . .
. . .
. Health Care Equipment & Supplies - (1.2%) (161) Baxter International, Inc. . .
. . .
. . .
. . .
. . .
. . .
. . .
. . .
. . .
. . .
. . .
. . .
. . .
. . .
. . .
. . .
. . .
. . .
. . .
. . .
. . .
. . . (41) Cooper Cos, Inc./The .
. . .
. . .
. . .
. . .
. . .
. . .
. . .
. . .
. . .
. . .
. . .
. . .
. . .
. . .
. . .
. . .
. . .
. . .
. . .
. . .
. . .
. . .
. (179) Haemonetics Corp. (b) . .
. . .
. . .
. . .
. . .
. . .
. . .
. . .
. . .
. . .
. . .
. . .
. . .
. . .
. . .
. . .
. . .
. . .
. . .
. . .
. . .
. . .
. . (117) Masimo Corp. (b) .
. . .
. . .
. . .
. . .
. . .
. . .
. . .
. . .
. . .
. . .
. . .
. . .
. . .
. . .
. . .
. . .
. . .
. . .
. . .
. . .
. . .
. . .
. . .
. (128) Neogen Corp. (b) . .
. . .
. . .
. . .
. . .
. . .
. . .
. . .
. . .
. . .
. . .
. . .
. . .
. . .
. . .
. . .
. . .
. . .
. . .
. . .
. . .
. . .
. . .
. . . (93) Wright Medical Group, Inc.
(b) . . .
. . .
. . .
. . .
. . .
. . .
. . .
. . .
. . .
. . .
. . .
. . .
. . .
. . .
. . .
. . .
. . .
. . .
. . .
. . . Value _________________ $----------------------------------(3,681) (9,364) -----------------------------------(11,017) (3,324) (7,177) -----------------------------------(21,518) -----------------------------------(2,682) (4,362) (10,926) -----------------------------------(17,970) -----------------------------------(12,055) ------------------------------------ (2,374) (2,576) -----------------------------------(4,950) -----------------------------------(2,444) (2,569) (7,065) -----------------------------------(12,078) -----------------------------------(2,513) ------------------------------------ (6,122) ------------------------------------ (12,660) (12,272) (4,875) -----------------------------------(29,807) -----------------------------------(11,292) (6,720) (6,752) (2,953) (5,619) (2,941) -----------------------------------(36,277) ------------------------------------ Health Care Providers & Services - (0.4%) (133) Acadia Healthcare Co., Inc.
(b) . . .
. . .
. . .
. . .
. . .
. . .
. . .
. . .
. . .
. . .
. . .
. . .
. . .
. . .
. . .
. . .
. . .
. . .
. . .
. . . (42) Air Methods Corp.
(b) . . .
. . .
. . .
. . .
. . .
. . .
. . .
. . .
. . .
. . .
. . .
. . .
. . .
. . .
. . .
. . .
. . .
. . .
. . .
. . .
. . .
. . .
. (116) Hanger, Inc. (b) . .
. . .
. . .
. . .
. . .
. . .
. . .
. . .
. . .
. . .
. . .
. . .
. . .
. . .
. . .
. . .
. . .
. . .
. . .
. . .
. . .
. . .
. . .
. . .
. . See Notes to Financial Statements (8,252) (1,984) (2,776) -----------------------------------(13,012) -----------------------------------Page 13 . First Trust Long/Short Equity ETF (FTLS) Portfolio of Investments (Continued) October 31, 2014 Shares Description _____________ _______________________________________________________________________________________________________________________ COMMON STOCKS SOLD SHORT (Continued) Hotels, Restaurants & Leisure - (0.5%) (446) Aramark . . . .
. . .
. . .
. . .
. . .
. . .
. . .
. . .
. . .
. . .
. . .
. . .
. . .
. . .
. . .
. . .
. . .
. . .
. . .
. . .
. . .
. . .
. . .
. . .
. . .
. . (191) Belmond Ltd. (b) .
. . .
. . .
. . .
. . .
. . .
. . .
. . .
. . .
. . .
. . .
. . .
. . .
. . .
. . .
. . .
. . .
. . .
. . .
. . .
. . .
. . .
. . .
. . .
. Household Durables - (0.3%) (133) Jarden Corp. (b) . .
. . .
. . .
. . .
. . .
. . .
. . .
. . .
. . .
. . .
. . .
. . .
. . .
. . .
. . .
. . .
. . .
. . .
. . .
. . .
. . .
. . .
. . .
. . .
. Internet Software & Services - (0.2%) (104) Cornerstone OnDemand, Inc. (b) . .
. . .
. . .
. . .
. . .
. . .
. . .
. . .
. . .
. . .
. . .
. . .
. . .
. . .
. . .
. . .
. . .
. . .
. . .
. . . (10) LinkedIn Corp.
(b) . . .
. . .
. . .
. . .
. . .
. . .
. . .
. . .
. . .
. . .
. . .
. . .
. . .
. . .
. . .
. . .
. . .
. . .
. . .
. . .
. . .
. . .
. . .
. IT Services - (0.7%) (92) TeleTech Holdings, Inc. (b) . .
. . .
. . .
. . .
. . .
. . .
. . .
. . .
. . .
. . .
. . .
. . .
. . .
. . .
. . .
. . .
. . .
. . .
. . .
. . .
. . .
. (386) Total System Services, Inc. . .
. . .
. . .
. . .
. . .
. . .
. . .
. . .
. . .
. . .
. . .
. . .
. . .
. . .
. . .
. . .
. . .
. . .
. . .
. . .
. . .
. (494) Xerox Corp. . .
. . .
. . .
. . .
. . .
. . .
. . .
. . .
. . .
. . .
. . .
. . .
. . .
. . .
. . .
. . .
. . .
. . .
. . .
. . .
. . .
. . .
. . .
. . .
. . .
. . Leisure Products - (0.2%) (58) Hasbro, Inc. .
. . .
. . .
. . .
. . .
. . .
. . .
. . .
. . .
. . .
. . .
. . .
. . .
. . .
. . .
. . .
. . .
. . .
. . .
. . .
. . .
. . .
. . .
. . .
. . .
. . . (70) Mattel, Inc.
. . .
. . .
. . .
. . .
. . .
. . .
. . .
. . .
. . .
. . .
. . .
. . .
. . .
. . .
. . .
. . .
. . .
. . .
. . .
. . .
. . .
. . .
. . .
. . .
. . .
. Life Sciences Tools & Services – (0.9%) (100) Agilent Technologies, Inc. . .
. . .
. . .
. . .
. . .
. . .
. . .
. . .
. . .
. . .
. . .
. . .
. . .
. . .
. . .
. . .
. . .
. . .
. . .
. . .
. . .
. . (76) Bio-Rad Laboratories, Inc. (b) .
. . .
. . .
. . .
. . .
. . .
. . .
. . .
. . .
. . .
. . .
. . .
. . .
. . .
. . .
. . .
. . .
. . .
. . .
. . .
. . . (117) Waters Corp.
(b) . . .
. . .
. . .
. . .
. . .
. . .
. . .
. . .
. . .
. . .
. . .
. . .
. . .
. . .
. . .
. . .
. . .
. . .
. . .
. . .
. . .
. . .
. . .
. . . Machinery – (0.9%) (38) Colfax Corp.
(b) . . .
. . .
. . .
. . .
. . .
. . .
. . .
. . .
. . .
. . .
. . .
. . .
. . .
. . .
. . .
. . .
. . .
. . .
. . .
. . .
. . .
. . .
. . .
. . . (35) EnPro Industries, Inc.
(b) . . .
. . .
. . .
. . .
. . .
. . .
. . .
. . .
. . .
. . .
. . .
. . .
. . .
. . .
. . .
. . .
. . .
. . .
. . .
. . .
. . .
. . (99) ESCO Technologies, Inc. .
. . .
. . .
. . .
. . .
. . .
. . .
. . .
. . .
. . .
. . .
. . .
. . .
. . .
. . .
. . .
. . .
. . .
. . .
. . .
. . .
. . .
. (143) Mueller Industries, Inc. . .
. . .
. . .
. . .
. . .
. . .
. . .
. . .
. . .
. . .
. . .
. . .
. . .
. . .
. . .
. . .
. . .
. . .
. . .
. . .
. . .
. . .
. . (181) PACCAR, Inc. .
. . .
. . .
. . .
. . .
. . .
. . .
. . .
. . .
. . .
. . .
. . .
. . .
. . .
. . .
. . .
. . .
. . .
. . .
. . .
. . .
. . .
. . .
. . .
. . .
. (47) Woodward, Inc. . .
. . .
. . .
. . .
. . .
. . .
. . .
. . .
. . .
. . .
. . .
. . .
. . .
. . .
. . .
. . .
. . .
. . .
. . .
. . .
. . .
. . .
. . .
. . .
. . Media - (0.2%) (82) Scripps Networks Interactive, Inc., Class A . .
. . .
. . .
. . .
. . .
. . .
. . .
. . .
. . .
. . .
. . .
. . .
. . .
. . .
. . .
. . .
. . . Multiline Retail - (0.4%) (159) Nordstrom, Inc.
. . .
. . .
. . .
. . .
. . .
. . .
. . .
. . .
. . .
. . .
. . .
. . .
. . .
. . .
. . .
. . .
. . .
. . .
. . .
. . .
. . .
. . .
. . .
. . .
. Oil, Gas & Consumable Fuels - (1.1%) (74) ConocoPhillips . . .
. . .
. . .
. . .
. . .
. . .
. . .
. . .
. . .
. . .
. . .
. . .
. . .
. . .
. . .
. . .
. . .
. . .
. . .
. . .
. . .
. . .
. . .
. . .
. (66) Continental Resources Inc./OK (b) . . .
. . .
. . .
. . .
. . .
. . .
. . .
. . .
. . .
. . .
. . .
. . .
. . .
. . .
. . .
. . .
. . .
. . .
. . . (690) EP Energy Corp.
(b) . . .
. . .
. . .
. . .
. . .
. . .
. . .
. . .
. . .
. . .
. . .
. . .
. . .
. . .
. . .
. . .
. . .
. . .
. . .
. . .
. . .
. . .
. . . (55) EQT Corp.
. . .
. . .
. . .
. . .
. . .
. . .
. . .
. . .
. . .
. . .
. . .
. . .
. . .
. . .
. . .
. . .
. . .
. . .
. . .
. . .
. . .
. . .
. . .
. . .
. . .
. . (67) Marathon Oil Corp. .
. . .
. . .
. . .
. . .
. . .
. . .
. . .
. . .
. . .
. . .
. . .
. . .
. . .
. . .
. . .
. . .
. . .
. . .
. . .
. . .
. . .
. . .
. . . (70) Noble Energy, Inc.
. . .
. . .
. . .
. . .
. . .
. . .
. . .
. . .
. . .
. . .
. . .
. . .
. . .
. . .
. . .
. . .
. . .
. . .
. . .
. . .
. . .
. . .
. . .
. (71) Southwestern Energy Co. (b) . .
. . .
. . .
. . .
. . .
. . .
. . .
. . .
. . .
. . .
. . .
. . .
. . .
. . .
. . .
. . .
. . .
. . .
. . .
. . .
. . . Value _________________ $ (12,448) (2,189) -----------------------------------(14,637) -----------------------------------(8,657) ------------------------------------ (3,772) (2,290) -----------------------------------(6,062) -----------------------------------(2,375) (13,043) (6,560) -----------------------------------(21,978) -----------------------------------(3,337) (2,175) -----------------------------------(5,512) -----------------------------------(5,528) (8,574) (12,964) -----------------------------------(27,066) -----------------------------------(2,066) (2,258) (3,764) (4,642) (11,823) (2,407) -----------------------------------(26,960) -----------------------------------(6,334) ------------------------------------ (11,545) ------------------------------------ (5,339) (3,721) (10,074) (5,172) (2,372) (4,034) (2,308) -----------------------------------(33,020) ------------------------------------ Page 14 See Notes to Financial Statements .
First Trust Long/Short Equity ETF (FTLS) Portfolio of Investments (Continued) October 31, 2014 Shares Description _____________ _______________________________________________________________________________________________________________________ COMMON STOCKS SOLD SHORT (Continued) Pharmaceuticals - (0.3%) (66) Akorn, Inc. (b) . . .
. . .
. . .
. . .
. . .
. . .
. . .
. . .
. . .
. . .
. . .
. . .
. . .
. . .
. . .
. . .
. . .
. . .
. . .
. . .
. . .
. . .
. . .
. . .
. (328) Revance Therapeutics, Inc. (b) . .
. . .
. . .
. . .
. . .
. . .
. . .
. . .
. . .
. . .
. . .
. . .
. . .
. . .
. . .
. . .
. . .
. . .
. . .
. . .
. . Professional Services - (0.2%) (51) Advisory Board (The) Co. (b) .
. . .
. . .
. . .
. . .
. . .
. . .
. . .
. . .
. . .
. . .
. . .
. . .
. . .
. . .
. . .
. . .
. . .
. . .
. . .
. . . (67) Corporate Executive Board Co./The .
. . .
. . .
. . .
. . .
. . .
. . .
. . .
. . .
. . .
. . .
. . .
. . .
. . .
. . .
. . .
. . .
. . .
. . .
. Real Estate Investment Trusts - (2.1%) (172) Acadia Realty Trust . . .
. . .
. . .
. . .
. . .
. . .
. . .
. . .
. . .
. . .
. . .
. . .
. . .
. . .
. . .
. . .
. . .
. . .
. . .
. . .
. . .
. . .
. . . (619) American Residential Properties, Inc.
(b) . . .
. . .
. . .
. . .
. . .
. . .
. . .
. . .
. . .
. . .
. . .
. . .
. . .
. . .
. . .
. . .
. . .
. (47) AvalonBay Communities, Inc. . .
. . .
. . .
. . .
. . .
. . .
. . .
. . .
. . .
. . .
. . .
. . .
. . .
. . .
. . .
. . .
. . .
. . .
. . .
. . .
. . (112) EastGroup Properties, Inc. .
. . .
. . .
. . .
. . .
. . .
. . .
. . .
. . .
. . .
. . .
. . .
. . .
. . .
. . .
. . .
. . .
. . .
. . .
. . .
. . .
. . . (96) Federal Realty Investment Trust .
. . .
. . .
. . .
. . .
. . .
. . .
. . .
. . .
. . .
. . .
. . .
. . .
. . .
. . .
. . .
. . .
. . .
. . .
. . .
. (61) Highwoods Properties, Inc. . .
. . .
. . .
. . .
. . .
. . .
. . .
. . .
. . .
. . .
. . .
. . .
. . .
. . .
. . .
. . .
. . .
. . .
. . .
. . .
. . .
. (102) Kilroy Realty Corp. . .
. . .
. . .
. . .
. . .
. . .
. . .
. . .
. . .
. . .
. . .
. . .
. . .
. . .
. . .
. . .
. . .
. . .
. . .
. . .
. . .
. . .
. . .
. (124) Liberty Property Trust . . .
. . .
. . .
. . .
. . .
. . .
. . .
. . .
. . .
. . .
. . .
. . .
. . .
. . .
. . .
. . .
. . .
. . .
. . .
. . .
. . .
. . .
. (122) Piedmont Office Realty Trust, Inc. . .
. . .
. . .
. . .
. . .
. . .
. . .
. . .
. . .
. . .
. . .
. . .
. . .
. . .
. . .
. . .
. . .
. . .
. . .
. (77) QTS Realty Trust, Inc. . .
. . .
. . .
. . .
. . .
. . .
. . .
. . .
. . .
. . .
. . .
. . .
. . .
. . .
. . .
. . .
. . .
. . .
. . .
. . .
. . .
. . .
. . Real Estate Management & Development - (0.1%) (91) Kennedy-Wilson Holdings, Inc. .
. . .
. . .
. . .
. . .
. . .
. . .
. . .
. . .
. . .
. . .
. . .
. . .
. . .
. . .
. . .
. . .
. . .
. . .
. . .
. . Road & Rail - (0.4%) (40) Kansas City Southern . .
. . .
. . .
. . .
. . .
. . .
. . .
. . .
. . .
. . .
. . .
. . .
. . .
. . .
. . .
. . .
. . .
. . .
. . .
. . .
. . .
. . .
. . . (38) Ryder System, Inc.
. . .
. . .
. . .
. . .
. . .
. . .
. . .
. . .
. . .
. . .
. . .
. . .
. . .
. . .
. . .
. . .
. . .
. . .
. . .
. . .
. . .
. . .
. . .
. (97) Werner Enterprises, Inc. . .
. . .
. . .
. . .
. . .
. . .
. . .
. . .
. . .
. . .
. . .
. . .
. . .
. . .
. . .
. . .
. . .
. . .
. . .
. . .
. . .
. . .
. Software - (0.4%) (184) Comverse, Inc. (b) . .
. . .
. . .
. . .
. . .
. . .
. . .
. . .
. . .
. . .
. . .
. . .
. . .
. . .
. . .
. . .
. . .
. . .
. . .
. . .
. . .
. . .
. . .
. . (109) Mentor Graphics Corp. .
. . .
. . .
. . .
. . .
. . .
. . .
. . .
. . .
. . .
. . .
. . .
. . .
. . .
. . .
. . .
. . .
. . .
. . .
. . .
. . .
. . .
. . . (103) Take-Two Interactive Software, Inc.
(b) . . .
. . .
. . .
. . .
. . .
. . .
. . .
. . .
. . .
. . .
. . .
. . .
. . .
. . .
. . .
. . .
. . .
. . (24) Ultimate Software Group, Inc. (b) .
. . .
. . .
. . .
. . .
. . .
. . .
. . .
. . .
. . .
. . .
. . .
. . .
. . .
. . .
. . .
. . .
. . .
. . .
. . . Specialty Retail - (0.9%) (141) Ascena Retail Group, Inc.
(b) . . .
. . .
. . .
. . .
. . .
. . .
. . .
. . .
. . .
. . .
. . .
. . .
. . .
. . .
. . .
. . .
. . .
. . .
. . .
. . .
. . (123) CarMax, Inc. (b) .
. . .
. . .
. . .
. . .
. . .
. . .
. . .
. . .
. . .
. . .
. . .
. . .
. . .
. . .
. . .
. . .
. . .
. . .
. . .
. . .
. . .
. . .
. . .
. . (89) Five Below, Inc. (b) .
. . .
. . .
. . .
. . .
. . .
. . .
. . .
. . .
. . .
. . .
. . .
. . .
. . .
. . .
. . .
. . .
. . .
. . .
. . .
. . .
. . .
. . .
. . (101) L Brands, Inc. .
. . .
. . .
. . .
. . .
. . .
. . .
. . .
. . .
. . .
. . .
. . .
. . .
. . .
. . .
. . .
. . .
. . .
. . .
. . .
. . .
. . .
. . .
. . .
. . .
. (52) Tiffany & Co. . .
. . .
. . .
. . .
. . .
. . .
. . .
. . .
. . .
. . .
. . .
. . .
. . .
. . .
. . .
. . .
. . .
. . .
. . .
. . .
. . .
. . .
. . .
. . .
. . . (63) Williams-Sonoma, Inc.
. . .
. . .
. . .
. . .
. . .
. . .
. . .
. . .
. . .
. . .
. . .
. . .
. . .
. . .
. . .
. . .
. . .
. . .
. . .
. . .
. . .
. . .
. Value _________________ $ (2,940) (6,613) -----------------------------------(9,553) -----------------------------------(2,737) (4,938) -----------------------------------(7,675) -----------------------------------(5,366) (11,761) (7,324) (7,712) (12,653) (2,615) (6,910) (4,312) (2,373) (2,712) -----------------------------------(63,738) -----------------------------------(2,465) ------------------------------------ (4,912) (3,362) (2,671) -----------------------------------(10,945) -----------------------------------(4,011) (2,310) (2,724) (3,612) -----------------------------------(12,657) -----------------------------------(1,756) (6,877) (3,548) (7,284) (4,998) (4,097) -----------------------------------(28,560) ------------------------------------ Technology Hardware, Storage & Peripherals - (0.2%) (62) Diebold, Inc. . .
. . .
. . .
. . .
. . .
. . .
. . .
. . .
. . .
. . .
. . .
. . .
. . .
. . .
. . .
. . .
. . .
. . .
. . .
. . .
. . .
. . .
. . .
. . .
. . .
. (144) NCR Corp. (b) . .
. . .
. . .
. . .
. . .
. . .
. . .
. . .
. . .
. . .
. . .
. . .
. . .
. . .
. . .
. . .
. . .
. . .
. . .
. . .
. . .
. . .
. . .
. . .
. . Textiles, Apparel & Luxury Goods - (0.1%) (46) Carter’s, Inc. .
. . .
. . .
. . .
. . .
. . .
. . .
. . .
. . .
. . .
. . .
. . .
. . .
. . .
. . .
. . .
. . .
. . .
. . .
. . .
. . .
. . .
. . .
. . .
. . .
. . See Notes to Financial Statements (2,197) (3,984) -----------------------------------(6,181) -----------------------------------(3,594) ------------------------------------ Page 15 . First Trust Long/Short Equity ETF (FTLS) Portfolio of Investments (Continued) October 31, 2014 Shares Description _____________ _______________________________________________________________________________________________________________________ COMMON STOCKS SOLD SHORT (Continued) Thrifts & Mortgage Finance - (0.4%) (481) Hudson City Bancorp, Inc. . . .
. . .
. . .
. . .
. . .
. . .
. . .
. . .
. . .
. . .
. . .
. . .
. . .
. . .
. . .
. . .
. . .
. . .
. . .
. . .
. . .
. (405) TFS Financial Corp. . .
. . .
. . .
. . .
. . .
. . .
. . .
. . .
. . .
. . .
. . .
. . .
. . .
. . .
. . .
. . .
. . .
. . .
. . .
. . .
. . .
. . .
. . .
. (112) Washington Federal, Inc. . .
. . .
. . .
. . .
. . .
. . .
. . .
. . .
. . .
. . .
. . .
. . .
. . .
. . .
. . .
. . .
. . .
. . .
. . .
. . .
. . .
. . . Tobacco - (0.1%) (68) Universal Corp.
. . .
. . .
. . .
. . .
. . .
. . .
. . .
. . .
. . .
. . .
. . .
. . .
. . .
. . .
. . .
. . .
. . .
. . .
. . .
. . .
. . .
. . .
. . .
. . .
. Trading Companies & Distributors - (0.1%) (64) Fastenal Co. . .
. . .
. . .
. . .
. . .
. . .
. . .
. . .
. . .
. . .
. . .
. . .
. . .
. . .
. . .
. . .
. . .
. . .
. . .
. . .
. . .
. . .
. . .
. . .
. . .
. . Wireless Telecommunication Services - (0.1%) (79) T-Mobile US, Inc. (b) .
. . .
. . .
. . .
. . .
. . .
. . .
. . .
. . .
. . .
. . .
. . .
. . .
. . .
. . .
. . .
. . .
. . .
. . .
. . .
. . .
. . .
. . .
. Total Common Stocks Sold Short . . .
. . .
. . .
. . .
. . .
. . .
. . .
. . .
. . .
. . .
. . .
. . .
. . .
. . .
. . .
. . .
. . .
. . . (Proceeds $(594,067)) Total Investments Sold Short .
. . .
. . .
. . .
. . .
. . .
. . .
. . .
. . .
. . .
. . .
. . .
. . .
. . .
. . .
. . .
. . .
. . .
. . .
. . (Proceeds $(609,127)) Net Other Assets and Liabilities – 20.5% . .
. . .
. . .
. . .
. . .
. . .
. . .
. . .
. . .
. . .
. . .
. . .
. . .
. . .
. . .
. . . Net Assets – 100.0% .
. . .
. . .
. . .
. . .
. . .
. . .
. . .
. . .
. . .
. . .
. . .
. . .
. . .
. . .
. . .
. . .
. . .
. . .
. . .
. . .
. . .
. . .
. Value _________________ $ (4,641) (6,051) (2,445) -----------------------------------(13,137) -----------------------------------(3,026) ------------------------------------ (2,818) ------------------------------------ (2,306) ------------------------------------ (595,170) ------------------------------------ (611,303) 627,271 ------------------------------------ $-----------3,053,879---------------------------------------------------------- (a) The security or a portion of the security is segregated as collateral for investments sold short. (b) Non-income producing security. (c) Aggregate cost for federal income tax purposes is $2,986,636. As of October 31, 2014, the aggregate gross unrealized appreciation for all securities in which there was an excess of value over tax cost was $109,130 and the aggregate gross unrealized depreciation for all securities in which there was an excess of tax cost over value was $57,855. Valuation Inputs A summary of the inputs used to value the Fund’s investments as of October 31, 2014 is as follows (see Note 2A - Portfolio Valuation in the Notes to Financial Statements): ASSETS TABLE Investments ________________________________________________ Common Stocks* . .
. . .
. . .
. . .
. . .
. . .
. . .
. . .
. . .
. . .
. Total Value at 10/31/2014 _____________ Level 1 Quoted Prices ____________ Level 2 Significant Observable Inputs _____________ Level 3 Significant Unobservable Inputs ___________ $ 3,037,911 _____________ _____________ $ 3,037,911 ____________ ____________ $ — _____________ _____________ $ — ___________ ___________ Level 2 Significant Observable Inputs _____________ Level 3 Significant Unobservable Inputs ___________ LIABILITIES TABLE Investments ________________________________________________ Exchange-Traded Funds Sold Short* . . .
. . .
. . .
. . .
. . Common Stocks Sold Short* . .
. . .
. . .
. . .
. . .
. . .
. . . Total .
. . .
. . .
. . .
. . .
. . .
. . .
. . .
. . .
. . .
. . .
. . .
. . .
. . . Total Value at 10/31/2014 _____________ Level 1 Quoted Prices ____________ $ $ (16,133) (595,170) _____________ $ (611,303) _____________ _____________ (16,133) $ — (595,170) _____________ — ____________ $ (611,303) _____________ $ — ____________ ____________ _____________ $ — — ___________ $ — ___________ ___________ * See the Portfolio of Investments for industry breakout. All transfers in and and out of the Levels during the period are assumed to be transferred on the last day of the period at their current value.
There were no transfers between Levels at October 31, 2014. Page 16 See Notes to Financial Statements . First Trust Long/Short Equity ETF (FTLS) Statement of Assets and Liabilities October 31, 2014 ASSETS: Investments, at value (Cost $2,986,636). . . .
. . .
. . .
. . .
. . .
. . .
. . .
. . .
. . . Cash.
. . .
. . .
. . .
. . .
. . .
. . .
. . .
. . .
. . .
. . .
. . .
. . .
. . .
. . .
. . .
. . .
. . .
. . .
. Restricted Cash . . .
. . .
. . .
. . .
. . .
. . .
. . .
. . .
. . .
. . .
. . .
. . .
. . .
. . .
. . .
. . Receivables: Dividends . .
. . .
. . .
. . .
. . .
. . .
. . .
. . .
. . .
. . .
. . .
. . .
. . .
. . .
. . .
. . .
. . Dividend reclaims. .
. . .
. . .
. . .
. . .
. . .
. . .
. . .
. . .
. . .
. . .
. . .
. . .
. . .
. . Total Assets. .
. . .
. . .
. . .
. . .
. . .
. . .
. . .
. . .
. . .
. . .
. . .
. . .
. . .
. . .
. . .
. LIABILITIES: Investments sold short, at value (Proceeds $609,127) . . .
. . .
. . .
. . .
. . .
. . Payables: Investment advisory fees . .
. . .
. . .
. . .
. . .
. . .
. . .
. . .
. . .
. . .
. . .
. . .
. . Dividends payable on investments sold short . .
. . .
. . .
. . .
. . .
. . .
. . .
. Other liabilities . . .
. . .
. . .
. . .
. . .
. . .
. . .
. . .
. . .
. . .
. . .
. . .
. . .
. . .
. . .
. . $ 3,037,911 21,174 606,620 1,917 62 _________________ 3,667,684 _________________ 611,303 Total Liabilities. .
. . .
. . .
. . .
. . .
. . .
. . .
. . .
. . .
. . .
. . .
. . .
. . .
. . .
. . .
. 2,359 38 105 _________________ 613,805 _________________ NET ASSETS . . .
. . .
. . .
. . .
. . .
. . .
. . .
. . .
. . .
. . .
. . .
. . .
. . .
. . .
. . .
. . . $ 3,053,879 _________________ _________________ NET ASSETS consist of: Paid-in capital .
. . .
. . .
. . .
. . .
. . .
. . .
. . .
. . .
. . .
. . .
. . .
. . .
. . .
. . .
. . .
. . Par value . .
. . .
. . .
. . .
. . .
. . .
. . .
. . .
. . .
. . .
. . .
. . .
. . .
. . .
. . .
. . .
. . .
. . Accumulated net investment income (loss) . .
. . .
. . .
. . .
. . .
. . .
. . .
. . .
. . Accumulated net realized gain (loss) on investments and investments sold short. .
. . .
. . .
. . .
. . .
. . .
. . .
. . .
. . .
. . .
. . .
. . .
. . Net unrealized appreciation (depreciation) on investments and investments sold short. .
. . .
. . .
. . .
. . .
. . .
. . .
. . .
. . .
. . .
. . .
. . .
. . $ 2,999,060 1,000 2,994 1,726 NET ASSETS . .
. . .
. . .
. . .
. . .
. . .
. . .
. . .
. . .
. . .
. . .
. . .
. . .
. . .
. . .
. . .
. 49,099 _________________ $ 3,053,879 _________________ _________________ NET ASSET VALUE, per share . . .
. . .
. . .
. . .
. . .
. . .
. . .
. . .
. . .
. . .
. . . $ 30.54 _________________ _________________ Number of shares outstanding (unlimited number of shares authorized, par value $0.01 per share) .
. . .
. . .
. . .
. . .
. . .
. . .
. . . 100,002 _________________ _________________ See Notes to Financial Statements Page 17 .
First Trust Long/Short Equity ETF (FTLS) Statement of Operations For the Period September 8, 2014 (a) through October 31, 2014 INVESTMENT INCOME: Dividends . . . .
. . .
. . .
. . .
. . .
. . .
. . .
. . .
. . .
. . .
. . .
. . .
. . .
. . .
. . .
. . .
. . Other . .
. . .
. . .
. . .
. . .
. . .
. . .
. . .
. . .
. . .
. . .
. . .
. . .
. . .
. . .
. . .
. . .
. . .
. . Total investment income . .
. . .
. . .
. . .
. . .
. . .
. . .
. . .
. . .
. . .
. . .
. . .
. . EXPENSES: Investment advisory fees. .
. . .
. . .
. . .
. . .
. . .
. . .
. . .
. . .
. . .
. . .
. . .
. . .
. . Dividend expense on investments sold short . .
. . .
. . .
. . .
. . .
. . .
. . .
. . .
. $ 9,598 19 _________________ 9,617 _________________ Total expenses . . .
. . .
. . .
. . .
. . .
. . .
. . .
. . .
. . .
. . .
. . .
. . .
. . .
. . .
. . . 4,065 938 _________________ 5,003 _________________ NET INVESTMENT INCOME (LOSS).
. . .
. . .
. . .
. . .
. . .
. . .
. . .
. . .
. 4,614 _________________ NET REALIZED AND UNREALIZED GAIN (LOSS): Net realized gain (loss) on: Investments. . .
. . .
. . .
. . .
. . .
. . .
. . .
. . .
. . .
. . .
. . .
. . .
. . .
. . .
. . .
. . . Short Sales .
. . .
. . .
. . .
. . .
. . .
. . .
. . .
. . .
. . .
. . .
. . .
. . .
. . .
. . .
. . .
. . Net realized gain (loss). .
. . .
. . .
. . .
. . .
. . .
. . .
. . .
. . .
. . .
. . .
. . .
. . .
. Net change in unrealized appreciation (depreciation) on: Investments. . .
. . .
. . .
. . .
. . .
. . .
. . .
. . .
. . .
. . .
. . .
. . .
. . .
. . .
. . .
. . . Short Positions .
. . .
. . .
. . .
. . .
. . .
. . .
. . .
. . .
. . .
. . .
. . .
. . .
. . .
. . .
. . Net change in unrealized appreciation (depreciation) on investments . .
. 3,198 (1,472) _________________ 1,726 51,275 (2,176) _________________ 49,099 _________________ NET REALIZED AND UNREALIZED GAIN (LOSS) . . .
. . .
. . .
. . .
. 50,825 _________________ NET INCREASE (DECREASE) IN NET ASSETS RESULTING FROM OPERATIONS . . .
. . .
. . .
. . .
. . .
. . .
. . .
. . .
. . .
. . .
. . .
. . .
. . $ 55,439 _________________ _________________ (a) Inception date is consistent with the commencement of investment operations and is the date the initial creation units were established. Page 18 See Notes to Financial Statements . First Trust Long/Short Equity ETF (FTLS) Statement of Changes in Net Assets For the Period September 8, 2014 (a) through October 31, 2014 OPERATIONS: Net investment income (loss). . . .
. . .
. . .
. . .
. . .
. . .
. . .
. . .
. . .
. . .
. . . Net realized gain (loss).
. . .
. . .
. . .
. . .
. . .
. . .
. . .
. . .
. . .
. . .
. . .
. . .
. . Net change in unrealized appreciation (depreciation) . .
. . .
. . .
. . .
. . .
. 4,614 1,726 49,099 _________________ Net increase (decrease) in net assets resulting from operations . . .
. . .
. 55,439 _________________ DISTRIBUTIONS TO SHAREHOLDERS FROM: Net investment income. . .
. . .
. . .
. . .
. . .
. . .
. . .
. . .
. . .
. . .
. . .
. . .
. . . $ Total distributions to shareholders .
. . .
. . .
. . .
. . .
. . .
. . .
. . .
. . .
. . .
. . (1,620) _________________ (1,620) _________________ SHAREHOLDER TRANSACTIONS: Proceeds from shares sold . .
. . .
. . .
. . .
. . .
. . .
. . .
. . .
. . .
. . .
. . .
. . .
. Cost of shares redeemed. . .
. . .
. . .
. . .
. . .
. . .
. . .
. . .
. . .
. . .
. . .
. . .
. . 3,000,060 — _________________ Net increase (decrease) in net assets resulting from shareholder transactions . .
. . .
. . .
. . .
. . .
. . .
. . .
. . .
. . .
. . .
. . .
. . .
. . . Total increase (decrease) in net assets .
. . .
. . .
. . .
. . .
. . .
. . .
. . .
. . .
. . NET ASSETS: Beginning of period . .
. . .
. . .
. . .
. . .
. . .
. . .
. . .
. . .
. . .
. . .
. . .
. . .
. . . 3,000,060 _________________ 3,053,879 End of period .
. . .
. . .
. . .
. . .
. . .
. . .
. . .
. . .
. . .
. . .
. . .
. . .
. . .
. . .
. . . — _________________ $ 3,053,879 _________________ _________________ Accumulated net investment income (loss) at end of period.
. . .
. . .
. . . $ 2,994 _________________ _________________ CHANGES IN SHARES OUTSTANDING: Shares outstanding, beginning of period .
. . .
. . .
. . .
. . .
. . .
. . .
. . .
. . . Shares sold .
. . .
. . .
. . .
. . .
. . .
. . .
. . .
. . .
. . .
. . .
. . .
. . .
. . .
. . .
. . .
. . Shares outstanding, end of period . .
. . .
. . .
. . .
. . .
. . .
. . .
. . .
. . .
. . .
. — 100,002 _________________ 100,002 _________________ _________________ (a) Inception date is consistent with the commencement of investment operations and is the date the initial creation units were established. See Notes to Financial Statements Page 19 . First Trust Long/Short Equity ETF (FTLS) Financial Highlights For a Share outstanding throughout the period For the Period 9/8/2014 (a) through 10/31/2014 _________________ Net asset value, beginning of period $ 30.00 ____________ Income from investment operations: Net investment income (loss) Net realized and unrealized gain (loss) 0.05 0.51 ____________ 0.56 ____________ Total from investment operations Distributions paid to shareholders from: Net investment income (0.02) ____________ (0.02) ____________ Total distributions Net asset value, end of period $ 30.54 ____________ ____________ 1.86% TOTAL RETURN (b) RATIOS/SUPPLEMENTAL DATA: Net assets, end of period (in 000’s) Ratios to average net assets: Ratio of total expenses to average net assets Ratio of total expenses to average net assets excluding dividend expense Ratio of net investment income (loss) to average net assets Portfolio turnover rate (d) $ 3,054 1.17% (c) 0.95% (c) 1.08% (c) 1% (a) Inception date is consistent with the commencement of investment operations and is the date the initial creation units were established. (b) Total return is calculated assuming an initial investment made at the net asset value at the beginning of the period, reinvestment of all dividend distributions at net asset value during the period, and redemption at net asset value on the last day of the period. The return presented does not reflect the deduction of taxes that a shareholder would pay on Fund distributions or the redemption or sale of Fund shares. Total return is calculated for the time period presented and is not annualized for periods of less than a year. (c) Annualized. (d) Portfolio turnover is calculated for the time period presented and is not annualized for periods of less than a year and does not include securities received or delivered from processing creations or redemptions and in-kind transactions. Page 20 See Notes to Financial Statements . Notes to Financial Statements First Trust Long/Short Equity ETF (FTLS) October 31, 2014 1. Organization First Trust Exchange-Traded Fund III (the “Trust”) is a non-diversified open-end management investment company organized as a Massachusetts business trust on January 9, 2008, and is registered with the Securities and Exchange Commission under the Investment Company Act of 1940, as amended (the “1940 Act”). The Trust currently consists of three funds that are offering shares. This report covers the First Trust Long/Short Equity ETF (the “Fund”), which trades under the ticker “FTLS” on the NYSE Arca, Inc. (“NYSE Arca”).
Unlike conventional mutual funds, the Fund issues and redeems shares on a continuous basis, at net asset value (“NAV”), only in large specified blocks consisting of 50,000 shares called a “Creation Unit.” Creation Units are issued and redeemed for securities in which the Fund invests or for cash or, in certain circumstances, both. Except when aggregated in Creation Units, the shares are not redeemable securities of the Fund. The investment objective of the Fund is to seek to provide investors with long-term total return. The Fund pursues its investment objective by establishing long and short positions in a portfolio of equity securities.
Under normal circumstances, at least 80% of the Fund’s net assets (plus the amount of any borrowing for investment purposes) will be exposed to U.S. exchange-listed equity securities of U.S. and foreign companies by investing in such securities directly and/or in U.S.
exchange-traded funds (“ETFs”) that provide exposure to such securities. The equity securities held by the Fund may include U.S. exchange-listed equity securities of foreign issuers, as well as investments in the equity securities of foreign issuers that are in the form of depositary receipts.
There can be no assurance that the Fund will achieve its investment objective. The Fund may not be appropriate for all investors. 2. Significant Accounting Policies The following is a summary of significant accounting policies consistently followed by the Fund in the preparation of the financial statements.
The preparation of the financial statements in accordance with accounting principles generally accepted in the United States of America (“U.S. GAAP”) requires management to make estimates and assumptions that affect the reported amounts and disclosures in the financial statements. Actual results could differ from those estimates. A.
Portfolio Valuation The Fund’s NAV is determined daily as of the close of regular trading on The New York Stock Exchange (“NYSE”), normally 4:00 p.m. Eastern time, on each day the NYSE is open for trading. If the NYSE closes early on a valuation day, the NAV is determined as of that time. Domestic debt securities and foreign securities are priced using data reflecting the earlier closing of the principal markets for those securities.
The NAV is calculated by dividing the value of all assets of the Fund (including accrued interest and dividends), less all liabilities (including accrued expenses and dividends declared but unpaid), by the total number of shares outstanding. The Fund’s investments are valued daily at market value or, in absence of market value with respect to any portfolio securities, at fair value. Market value prices represent last sale or official closing prices from a national or foreign exchange (i.e. a regulated market) and are primarily obtained from third party pricing services.
Fair value prices represent any prices not considered market value prices and are either obtained from a third party pricing service or are determined by the Pricing Committee of the Fund’s investment advisor, First Trust Advisors L.P. (“First Trust” or the “Advisor”) in accordance with valuation procedures adopted by the Trust’s Board of Trustees, and in accordance with provisions of the 1940 Act. Investments valued by the Advisor’s Pricing Committee, if any, are footnoted as such in the footnotes to the Portfolio of Investments.
The Fund’s investments are valued as follows: Common stocks and other equity securities listed on any national or foreign exchange (excluding The NASDAQ® Stock Market LLC (“NASDAQ”) and the London Stock Exchange Alternative Investment Market (“AIM”)) are valued at the last sale price on the exchange on which they are principally traded or, for NASDAQ and AIM securities, the official closing price. Securities traded on one or more than one securities exchange are valued at the last sale price or official closing price, as applicable, at the close of the securities exchange representing the principal market for such securities. Securities traded in an over-the-counter market are fair valued at the mean of their most recent bid and asked price, if available, and otherwise at their closing bid price. Certain securities may not be able to be priced by pre-established pricing methods. Such securities may be valued by the Trust’s Board of Trustees or its delegate, the Advisor’s Pricing Committee, at fair value. These securities generally include, but are not limited to, restricted securities (securities which may not be publicly sold without registration under the Securities Act of 1933, as amended for which a pricing service is unable to provide a market price; securities whose trading has been formally suspended; a security whose market or fair value price is not available from a pre-established pricing source; a security with respect to which an event has occurred that is likely to materially affect the value of the security after the market has closed but before the calculation of the Fund’s NAV or make it difficult or impossible to obtain a reliable market quotation; and a security whose price, as provided by the pricing service, does not reflect the security’s fair value.
As a general principle, the current fair value of a security would appear to be the amount which the Page 21 . Notes to Financial Statements (Continued) First Trust Long/Short Equity ETF (FTLS) October 31, 2014 owner might reasonably expect to receive for the security upon its current sale. When fair value prices are used, generally they will differ from market quotations or official closing prices on the applicable exchanges. A variety of factors may be considered in determining the fair value of such securities, including, but not limited to, the following: 1) the type of security; 2) the size of the holding; 3) the initial cost of the security; 4) transactions in comparable securities; 5) price quotes from dealers and/or pricing services; 6) relationships among various securities; 7) information obtained by contacting the issuer, analysts, or the appropriate stock exchange; 8) an analysis of the issuer’s financial statements; and 9) the existence of merger proposals or tender offers that might affect the value of the security. The Fund is subject to fair value accounting standards that define fair value, establish the framework for measuring fair value and provide a three-level hierarchy for fair valuation based upon the inputs to the valuation as of the measurement date. The three levels of the fair value hierarchy are as follows: • Level 1 – Level 1 inputs are quoted prices in active markets for identical investments.
An active market is a market in which transactions for the investment occur with sufficient frequency and volume to provide pricing information on an ongoing basis. • Level 2 – Level 2 inputs are observable inputs, either directly or indirectly, and include the following: o Quoted prices for similar investments in active markets. o Quoted prices for identical or similar investments in markets that are non-active. A non-active market is a market where there are few transactions for the investment, the prices are not current, or price quotations vary substantially either over time or among market makers, or in which little information is released publicly. o Inputs other than quoted prices that are observable for the investment (for example, interest rates and yield curves observable at commonly quoted intervals, volatilities, prepayment speeds, loss severities, credit risks, and default rates). o Inputs that are derived principally from or corroborated by observable market data by correlation or other means. • Level 3 – Level 3 inputs are unobservable inputs. Unobservable inputs may reflect the reporting entity’s own assumptions about the assumptions that market participants would use in pricing the investment. The inputs or methodology used for valuing investments are not necessarily an indication of the risk associated with investing in those investments.
A summary of the inputs used to value the Fund’s investments as of October 31, 2014, is included with the Fund’s Portfolio of Investments. B. Securities Transactions and Investment Income Securities transactions are recorded as of the trade date. Realized gains and losses from securities transactions are recorded on the identified cost basis.
Dividend income is recorded on the ex-dividend date. Interest income, if any, is recorded on the accrual basis. Distributions received from the Fund’s investments in real estate investment trusts (“REITs”) may be comprised of return of capital, capital gains and income. The actual character of the amounts received during the year are not known until after the REIT’s fiscal year end.
The Fund records the character of distributions received from the REITs during the year based on estimates available. The characterization of distributions received by the Fund may be subsequently revised based on information received from the REITs after their tax reporting periods conclude. C. Short Sales Short sales are utilized for investment and risk management purposes and are transactions in which securities or other instruments (such as options forwards, futures or other derivative contracts) are sold that are not currently owned in the Fund’s portfolio.
When a short sale is engaged in, the security sold short must be borrowed and delivered to the counterparty. Short selling allows the Fund to profit from a decline in a market price to the extent such decline exceeds the transaction costs and the costs of borrowing the securities. The Fund will pay a fee or premium to borrow the securities and is obligated to repay the lenders of the securities.
Any dividends or interest that accrues on the securities during the period of the load are due to the lenders. A gain, limited to the price at which the security was sold short, or a loss, unlimited in size, will be recognized upon the termination of the short sale. Any such gain or loss may be offset, completely or in part, by the change in the value of the long portion of the Fund’s portfolio.
The Fund is subject to the risk it may be unable to reacquire a security to terminate a short position except at a price substantially in excess of the last quoted price. Also, there is the risk that the counterparty to a short sale may fail to honor its contractual terms, causing a loss to Page 22 . Notes to Financial Statements (Continued) First Trust Long/Short Equity ETF (FTLS) October 31, 2014 the Fund. The Fund has established an account with Pershing, LLC for the purpose of purchasing securities on margin. The Fund pays interest on any margin balance, which is calculated as the daily margin account balance times the broker’s margin interest rate. Restricted cash in the amount of $606,620, as shown on the Statement of Assets and Liabilities, is associated with collateral at the broker as of October 31, 2014. D. Dividends and Distributions to Shareholders Dividends from net investment income, if any, are declared and paid quarterly, or as the Board of Trustees may determine from time to time.
Distributions of net realized capital gains earned by the Fund, if any, will be distributed at least annually. Distributions from income and capital gains are determined in accordance with income tax regulations, which may differ from U.S. GAAP. Certain capital accounts in the financial statements are periodically adjusted for permanent differences in order to reflect their tax character. These permanent differences are primarily due to the varying treatment of income and gain/loss on portfolio securities held by the Fund and has no impact on net assets or net asset value per share.
Temporary differences, which arise from recognizing certain items of income, expense and gain/loss in different periods for financial statement and tax purposes, will reverse at some time in the future. The tax character of distributions paid during the fiscal period ended October 31, 2014 was as follows: Distributions paid from: Ordinary income . . .
. . .
. . .
. . .
. . .
. . .
. . .
. . .
. . .
. . $ 1,620 As of October 31, 2014, the components of distributable earnings on a tax basis to the Fund were as follows: Undistributed ordinary income . .
. . .
. . .
. . .
. . .
. . .
. Accumulated capital and other losses . . .
. . .
. . .
. . .
. Net unrealized appreciation (depreciation) . . .
. . .
. . . $ 4,502 218 49,099 E.
Income Taxes The Fund intends to qualify as a regulated investment company by complying with the requirements under Subchapter M of the Internal Revenue Code of 1986, as amended, which includes distributing substantially all of its net investment income and net realized gains to shareholders. Accordingly, no provision has been made for federal or state income taxes. However, due to the timing and amount of distributions, the Fund may be subject to an excise tax of 4% of the amount by which approximately 98% of the Fund’s taxable income exceeds the distributions from such taxable income for the calendar year. The Fund is subject to accounting standards that establish a minimum threshold for recognizing, and a system for measuring, the benefits of a tax position taken or expected to be taken in a tax return.
The taxable year ended 2014 remains open to federal and state audit. As of October 31, 2014, management has evaluated the application of these standards to the Fund, and has determined that no provision for income tax is required in the Fund’s financial statements for uncertain tax positions. Net capital losses may be carried forward indefinitely, and their character is retained as short-term and/or long-term losses. At October 31, 2014, the Fund had no net capital losses for federal income tax purposes.
The Fund is subject to certain limitations, under U.S. tax rules, on the use of capital loss carryforwards and net unrealized built-in losses. These limitations apply when there has been a 50% change in ownership. In order to present paid-in capital, accumulated net investment income (loss) and accumulated net realized gain (loss) on investments on the Statement of Assets and Liabilities that more closely represent their tax character, certain adjustments have been made to paidin capital, accumulated net investment income (loss) and accumulated net realized gain (loss) on investments.
These adjustments are primarily due to the difference between book and tax treatments of income and gains on various investment securities held by the Fund and in-kind transactions. The results of operations and net assets were not affected by these adjustments. For the fiscal year ended October 31, 2014, the Fund had no adjustments. F.
Expenses Expenses, other than the investment advisory fee, dividend expenses on investments sold short and other excluded expenses, are paid by the Advisor (See Note 3). Page 23 . Notes to Financial Statements (Continued) First Trust Long/Short Equity ETF (FTLS) October 31, 2014 3. Investment Advisory Fee, Affiliated Transactions and Other Fee Arrangements First Trust, the investment advisor to the Fund, is a limited partnership with one limited partner, Grace Partners of DuPage L.P., and one general partner, The Charger Corporation. The Charger Corporation is an Illinois corporation controlled by James A. Bowen, Chief Executive Officer of First Trust.
First Trust is responsible for the selection and ongoing monitoring of the securities in the Fund’s portfolio, managing the Fund’s business affairs and providing certain administrative services necessary for the management of the Fund. Pursuant to the Investment Management Agreement, First Trust manages the investment of the Fund’s assets and is responsible for the Fund’s expenses, including the cost of transfer agency, custody, fund administration, legal, audit and other services, but excluding fee payments under the Investment Management Agreement, interest, taxes, brokerage commissions and other expenses connected with the execution of portfolio transactions, distribution and service fees pursuant to a 12b-1 plan, if any, dividend expenses on investments sold short, and extraordinary expenses. The Fund has agreed to pay First Trust an annual unitary management fee equal to 0.95% of its average daily net assets. First Trust also provides fund reporting services to the Fund for a flat annual fee in the amount of $9,250, which is covered under the annual unitary management fee. The Fund has multiple service agreements with Brown Brothers Harriman & Co.
(“BBH”). Under the service agreements, BBH performs custodial, fund accounting, certain administrative services, and transfer agency services for the Fund. As custodian, BBH is responsible for custody of the Fund’s assets.
As fund accountant and administrator, BBH is responsible for maintaining the books and records of the Fund’s securities and cash. As transfer agent, BBH is responsible for maintaining shareholder records for the Fund. Each Trustee who is not an officer or employee of First Trust, any sub-advisor or any of their affiliates (“Independent Trustees”) is paid a fixed annual retainer that is allocated pro rata among each fund in the First Trust Fund Complex based on net assets. Each Independent Trustee is also paid an annual per fund fee that varies based on whether the fund is a closed-end or other actively managed fund, or is an index fund. Additionally, the Lead Independent Trustee and the Chairmen of the Audit Committee, Nominating and Governance Committee and Valuation Committee are paid annual fees to serve in such capacities, with such compensation allocated pro rata among each fund in the First Trust Fund Complex based on net assets.
Trustees are reimbursed for travel and out-of-pocket expenses in connection with all meetings. The Lead Independent Trustee and Committee Chairmen rotate every three years. The officers and “Interested” Trustee receive no compensation from the Trust for acting in such capacities. 4.
Purchases and Sales of Securities For the year ended October 31, 2014, the cost of purchases and proceeds from sales of investments, excluding short-term investments and in-kind transactions, for the Fund were $0 and $24,103, respectively. The cost of purchases to cover short sales and the proceeds of short sales were $18,775 and $626,430, respectively. For the year ended October 31, 2014, the cost of in-kind purchases and proceeds from in-kind sales for the Fund was $3,007,812 and $0, respectively. 5. Creations, Redemptions and Transaction Fees Shares are created and redeemed by the Fund only in Creation Unit size aggregations of 50,000 shares.
In order to purchase Creation Units of the Fund, an investor must deposit (i) a designated portfolio of equity securities determined by First Trust (the “Deposit Securities”) and generally make or receive a cash payment referred to as the “Cash Component,” which is an amount equal to the difference between the NAV of the Fund shares (per Creation Unit aggregations) and the market value of the Deposit Securities, and/or (ii) cash in lieu of all or a portion of the Deposit Securities. If the Cash Component is a positive number (i.e., the NAV per Creation Unit Aggregation exceeds the Deposit Amount), the creator will deliver the Cash Component. If the Cash Component is a negative number (i.e., the NAV per Creation Unit Aggregation is less than the Deposit Amount), the creator will receive the Cash Component.
Purchasers of Creation Units must pay to BBH, as transfer agent, a creation fee (the “Creation Transaction Fee”) regardless of the number of Creation Units purchased in the transaction. The Creation Transaction Fee may vary and is based on the composition of the securities included in the Fund’s portfolio and the countries in which the transactions are settled. The Creation Transaction Fee may increase or decrease as the Fund’s portfolio is adjusted to conform to changes in the composition of the securities included in the Fund’s portfolio and the countries in which the transaction settled.
The Creation Transaction fee is currently $550. The price for each Creation Unit will equal the daily NAV per share times the number of shares in a Creation Unit plus the fees described above and, if applicable, any operational processing and brokerage costs, transfer fees or stamp taxes. When the Fund permits an Authorized Participant to substitute cash or a different security in lieu of depositing one or more of the requisite Deposit Securities, the Authorized Participant may also be assessed an amount to cover the cost of purchasing the Deposit Securities and/or disposing of the substituted securities, including operational processing and brokerage costs, transfer fees, stamp taxes, and part or all of the spread between the expected bid and offer side of the market related to such Deposit Securities and/or substitute securities. Page 24 .
Notes to Financial Statements (Continued) First Trust Long/Short Equity ETF (FTLS) October 31, 2014 Parties redeeming Creation Units must pay to BBH, as transfer agent, a redemption transaction fee (the “Redemption Transaction Fee”), regardless of the number of Creation Units redeemed in the transaction. The Redemption Transaction Fee may vary and is based on the composition of the securities included in the Fund’s portfolio and the countries in which the transactions are settled. The Redemption Transaction Fee is currently $550. The Fund reserves the right to affect redemptions in cash.
An Authorized Participant may request cash redemption in lieu of securities; however, the Fund may, in its discretion, reject any such request. 6. Distribution Plan The Board of Trustees adopted a Distribution and Service Plan pursuant to Rule 12b-1 under the 1940 Act. In accordance with the Rule 12b-1 plan, the Fund is authorized to pay an amount up to 0.25% of its average daily net assets each year to reimburse FTP, the distributor of the Fund, for amounts expended to finance activities primarily intended to result in the sale of Creation Units or the provision of investor services.
FTP may also use this amount to compensate securities dealers or other persons that are Authorized Participants for providing distribution assistance, including broker-dealer and shareholder support and educational and promotional services. No 12b-1 fees are currently paid by the Fund, and pursuant to a contractual arrangement, no 12b-1 fees will be paid any time before September 4, 2016. 7. Indemnification The Trust, on behalf of the Fund, has a variety of indemnification obligations under contracts with its service providers. The Fund’s maximum exposure under these arrangements is unknown.
However, the Fund has not had prior claims or losses pursuant to these contracts and expects the risk of loss to be remote. 8. Subsequent Events Management has evaluated the impact of all subsequent events to the Fund through the date the financial statements were issued, and has determined there was the following subsequent event: On November 5, 2014, First Trust Emerging Markets Local Currency Bond ETF, an additional series of the Trust, began trading under the ticker symbol “FEMB” on the NASDAQ. Page 25 . Report of Independent Registered Public Accounting Firm To the Board of Trustees and Shareholders of First Trust Long/Short Equity ETF: We have audited the accompanying statement of assets and liabilities of First Trust Long/Short Equity ETF (the “Fund”), a series of the First Trust Exchange-Traded Fund III, including the portfolio of investments, as of October 31, 2014, and the related statements of operations and changes in net assets and the financial highlights for the period presented. These financial statements and financial highlights are the responsibility of the Fund’s management. Our responsibility is to express an opinion on these financial statements and financial highlights based on our audit. We conducted our audit in accordance with the standards of the Public Company Accounting Oversight Board (United States). Those standards require that we plan and perform the audit to obtain reasonable assurance about whether the financial statements and financial highlights are free of material misstatement.
The Fund is not required to have, nor were we engaged to perform, an audit of its internal control over financial reporting. Our audit included consideration of internal control over financial reporting as a basis for designing audit procedures that are appropriate in the circumstances, but not for the purpose of expressing an opinion on the effectiveness of the Fund’s internal control over financial reporting. Accordingly, we express no such opinion.
An audit also includes examining, on a test basis, evidence supporting the amounts and disclosures in the financial statements, assessing the accounting principles used and significant estimates made by management, as well as evaluating the overall financial statement presentation. Our procedures included confirmation of securities owned as of October 31, 2014 by correspondence with the Fund’s custodians and brokers. We believe that our audit provides a reasonable basis for our opinion. In our opinion, the financial statements and financial highlights referred to above present fairly, in all material respects, the financial position of First Trust Long/Short Equity ETF as of October 31, 2014, and the results of its operations, changes in its net assets, and the financial highlights for the period presented, in conformity with accounting principles generally accepted in the United States of America. Chicago, Illinois December 23, 2014 Page 26 .
Additional Information First Trust Long/Short Equity ETF (FTLS) October 31, 2014 (Unaudited) Proxy Voting Policies and Procedures A description of the policies and procedures that the Trust uses to determine how to vote proxies and information on how the Fund voted proxies relating to portfolio investments during the most recent 12-month period ended June 30 will be available (1) without charge, upon request, by calling (800) 988-5891; (2) on the Fund’s website located at http://www.ftportfolios.com; and (3) on the Securities and Exchange Commission’s (“SEC”) website located at http://www.sec.gov. Portfolio Holdings The Trust files its complete schedule of portfolio holdings with the SEC for the first and third quarters of each fiscal year on Form N-Q. The Trust’s Forms N-Q is available (1) by calling (800) 988-5891; (2) on the Fund’s website located at http://www.ftportfolios.com; (3) on the SEC’s website at http://www.sec.gov; and (4) for review and copying at the SEC’s Public Reference Room (“PRR”) in Washington, DC. Information regarding the operation of the PRR may be obtained by calling (800) SEC-0330. Federal Tax Information For the taxable year ended October 31, 2014, the following percentages of income dividend paid by the Fund qualify for the dividends received deduction available to corporations and is hereby designated as qualified dividend income: Dividends Received Deduction _____________________________ 100% Qualified Dividend Income _____________________________ 100% Advisory Agreement Board Considerations Regarding Approval of Invesment Management Agreement The Board of Trustees of the First Trust Exchange-Traded Fund III (the “Trust”), including the Independent Trustees, unanimously approved the Investment Management Agreement (the “Agreement”) with First Trust Advisors L.P. (“First Trust”) on behalf of the First Trust Long/Short Equity ETF (the “Fund”), for an initial two-year term at a meeting held on July 22, 2014.
The Board of Trustees determined that the Agreement is in the best interests of the Fund in light of the extent and quality of services expected to be provided and such other matters as the Board considered to be relevant in the exercise of its reasonable business judgment. To reach this determination, the Board considered its duties under the Investment Company Act of 1940, as amended (the “1940 Act”), as well as under the general principles of state law in reviewing and approving advisory contracts; the requirements of the 1940 Act in such matters; the fiduciary duty of investment advisors with respect to advisory agreements and compensation; the standards used by courts in determining whether investment company boards have fulfilled their duties; and the factors to be considered by the Board in voting on such agreements. To assist the Board in its evaluation of the Agreement for the Fund, the Independent Trustees received a report in advance of the Board meeting responding to a request for information provided on behalf of the Independent Trustees that, among other things, outlined the services to be provided by First Trust to the Fund (including the relevant personnel responsible for these services and their experience); the proposed unitary fee structure for the Fund as compared to fees charged by advisors to other comparable exchange-traded funds (“ETFs”), and as compared to fees charged to other ETFs managed by First Trust; the estimated expenses to be incurred in providing services to the Fund and the potential for economies of scale, if any; financial data on First Trust; fall out benefits to First Trust and its affiliate, First Trust Portfolios L.P. (“FTP”); and a summary of First Trust’s compliance program. The Independent Trustees also met separately with their independent legal counsel to discuss the information provided by First Trust. The Board applied its business judgment to determine whether the arrangement between the Trust and First Trust is a reasonable business arrangement from the Fund’s perspective as well as from the perspective of shareholders. In evaluating whether to approve the Agreement for the Fund, the Board considered the nature, extent and quality of services to be provided by First Trust under the Agreement and considered that First Trust employees provide management services to other ETFs and to other investment companies in the First Trust fund complex with diligence and care.
The Board considered that the Fund is not designed to track the performance of an index, and investment decisions will be the primary responsibility of First Trust. At the meeting, the Board received a presentation from two members of First Trust’s Alternative Investments Team who would manage the Fund, and were able to ask questions about the proposed investment strategy for the Fund. The Board noted the experience of the Alternative Investments Team, and considered that the First Trust Investment Committee would oversee the Alternative Investments Team in the management of the Fund.
The Board considered that First Trust applies the same oversight model internally with its Alternative Investments Team as it uses for overseeing external sub-advisors. The Board considered the compliance program that had been developed by First Trust and the skills of its employees who would be working with the Fund. It also considered the efforts expended by First Trust in organizing the Trust and in arranging for other entities to provide services to the Fund.
Since the Fund had Page 27 . Additional Information (Continued) First Trust Long/Short Equity ETF (FTLS) October 31, 2014 (Unaudited) yet to commence investment operations, the Board could not consider the historical investment performance of the Fund. In light of the information presented and the considerations made, the Board concluded that the nature, extent and quality of services to be provided to the Fund by First Trust under the Agreement are expected to be satisfactory. The Board reviewed information regarding the proposed unitary fee structure for the Fund. The Board noted that under the Fund’s unitary fee arrangement, the Fund would pay First Trust a fee equal to an annual rate of 0.95% of its average daily net assets and that First Trust would be responsible for the Fund’s ordinary operating expenses, including the cost of transfer agency, custody, fund administration, legal, audit and other services and license fees, but excluding the fee payments under the Agreement, interest, taxes, brokerage commissions and other expenses connected with the execution of portfolio transactions, distribution and service fees pursuant to a Rule 12b-1 plan, if any, and extraordinary expenses. The Board reviewed information provided by First Trust and Lipper Inc.
(“Lipper”), an independent source, for the Fund on the advisory fees and expense ratios of other comparable ETFs, but also noted First Trust’s statements about the limitations on the comparability of the Fund’s Lipper peer group with the Fund. The Board noted that the Fund’s total expense ratio under its proposed unitary fee was equal to the median of its Lipper peer group. The Board also considered data provided by First Trust on the management fees paid by mutual funds following a long/short strategy.
The Board compared the Fund’s unitary fee to the total expense ratios (after fee waivers and/or expense reimbursements, if any) of other First Trust ETFs, including First Trust ETFs that pay a unitary fee, and to the advisory fees charged by First Trust to other advisory clients, noting that First Trust does not provide investment advisory services to registered investment companies that have similar investment objectives and policies to the Fund’s. In light of the information considered and the nature, extent and quality of services expected to be provided to the Fund under the Agreement, the Board determined that the proposed unitary fee for the Fund was fair and reasonable. The Board noted that the proposed unitary fee for the Fund was not structured to pass the benefits of any economies of scale on to shareholders as the Fund’s assets grow. The Board noted that any reduction in fixed costs associated with the management of the Fund would benefit First Trust, but that a unitary fee structure provides a level of certainty in expenses for the Fund.
The Board noted that First Trust has continued to invest in personnel and infrastructure for the First Trust fund complex. The Board took the costs to be borne by First Trust in connection with its services to be performed for the Fund under the Agreement into consideration and noted that First Trust was unable to estimate the profitability of the Agreement for the Fund to First Trust. The Board considered fall-out benefits described by First Trust that may be realized from its relationship with the Fund, including First Trust’s compensation for fund reporting services pursuant to a separate Fund Reporting Services Agreement, which would be included under the unitary fee.
The Board also noted that First Trust would not utilize soft dollars in connection with its management of the Fund’s portfolio. Based on all the information considered and the conclusions reached, the Board, including the Independent Trustees, unanimously determined that the terms of the Agreement are fair and reasonable and that the approval of the Agreement is in the best interests of the Fund. No single factor was determinative in the Board’s analysis. Risk Considerations You could lose money by investing in the Fund. An investment in the Fund is not a deposit of a bank and is not insured or guaranteed by the Federal Deposit Insurance Corporation or any other governmental agency.
There can be no assurance that the Fund’s investment objective will be achieved. CASH TRANSACTIONS RISK. The Fund may, under certain circumstances, effect a portion of creations and redemptions for cash, rather than in-kind securities, particularly for the puts and call options in which the Fund invests. As a result, an investment in the Fund may be less tax-efficient than an investment in an ETF that effects its creations and redemption for in-kind securities. Because the Fund may effect a portion of redemptions for cash, it may be required to sell portfolio securities in order to obtain the cash needed to distribute redemption proceeds.
A sale of shares may result in capital gains or losses, and may also result in higher brokerage costs. DEPOSITARY RECEIPTS RISK. Depositary receipts may be less liquid than the underlying shares in their primary trading market. Any distributions paid to the holders of depositary receipts are usually subject to a fee charged by the depositary.
Holders of depositary receipts may have limited voting rights, and investment restrictions in certain countries may adversely impact the value of depositary receipts because such restrictions may limit the ability to convert the equity shares into depositary receipts and vice versa. Such restrictions may cause the equity shares of the underlying issuer to trade at a discount or premium to the market price of the depositary receipts. DERIVATIVES RISK. The use of futures and other derivatives can lead to losses because of adverse movements in the price or value of the underlying asset, index or rate, which may be magnified by certain features of the derivatives. These risks are heightened when the Fund’s portfolio managers use derivatives to enhance the Fund’s return or as a substitute for a position or security, rather than solely to hedge (or offset) the risk of a position or security held by the Fund. Page 28 .
Additional Information (Continued) First Trust Long/Short Equity ETF (FTLS) October 31, 2014 (Unaudited) EQUITY SECURITIES RISK. The Fund invests in Equity Securities. The value of the shares will fluctuate with changes in the value of these Equity Securities. Equity Securities prices fluctuate for several reasons, including changes in investors’ perceptions of the financial condition of an issuer or the general condition of the relevant stock market, such as the current market volatility, or when political or economic events affecting the issuers occur.
In addition, common stock prices may be particularly sensitive to rising interest rates, as the cost of the capital rises and borrowing costs increase. ETF RISK. The Fund may invest in the shares of other ETFs, and therefore, the Fund’s investment performance and risks may be related to the investment performance and risks of the underlying ETFs. In general, as a shareholder in other ETFs, the Fund bears its ratable share of the underlying ETF’s expenses, and would be subject to duplicative expenses to the extent the Fund invests in other ETFs. MANAGEMENT RISK.
The Fund is subject to management risk because it is an actively managed portfolio. In managing the Fund’s investment portfolio, the Fund’s investment advisor will apply investment techniques and risk analyses that may not have the desired result. There can be no guarantee that the Fund will meet its investment objective. MARKET RISK.
Market risk is the risk that a particular security owned by the Fund or shares of the Fund in general may fall in value. Securities are subject to market fluctuations caused by such factors as economic, political, regulatory or market developments, changes in interest rates and perceived trends in securities prices. Overall securities values could decline generally or could underperform other investments. NEW FUND RISK.
The Fund currently has fewer assets than larger funds, and like other relatively new funds, large inflows and outflows may impact the Fund’s market exposure for limited periods of time. This impact may be positive or negative, depending on the direction of market movement during the period affected. Also, during the initial invest-up period, the Fund may depart from its principal investment strategies and invest a larger amount or all of its assets in cash equivalents or it may hold cash. NON-DIVERSIFICATION RISK.
The Fund is classified as “non-diversified” under the Investment Company Act of 1940, as amended (the “1940 Act”). As a result, the Fund is only limited as to the percentage of its assets that may be invested in the securities of any one issuer by the diversification requirements imposed by the Internal Revenue Code of 1986, as amended (the “Code”). The Fund may invest a relatively high percentage of its assets in a limited number of issuers.
As a result, the Fund may be more susceptible to a single adverse economic or regulatory occurrence affecting one or more of these issuers, experience increased volatility and be highly invested in certain issuers. NON-U.S. SECURITIES RISK. The Fund holds non-U.S.
securities that are either directly listed on a U.S. securities exchange or in the form of depositary receipts. Non-U.S.
securities are subject to higher volatility than securities of domestic issuers due to possible adverse political, social or economic developments; restrictions on foreign investment or exchange of securities; lack of liquidity; currency exchange rates; excessive taxation; government seizure of assets; different legal or accounting standards; and less government supervision and regulation of exchanges in foreign countries. SHORT SALES RISK. The Fund will incur a loss as a result of a short sale if the price of the security sold short increases in value between the date of the short sale and the date on which the Fund purchases the security to replace the borrowed security. In addition, a lender of a security may request, or market conditions may dictate, that securities sold short be returned to the lender on short notice, which may result in the Fund having to buy the securities sold short at an unfavorable price.
If this occurs, any anticipated gain to the Fund may be reduced or eliminated or the short sale may result in a loss. In a rising stock market, the Fund’s short positions may significantly impact the Fund’s overall performance and cause the Fund to underperform traditional long-only equity funds or to sustain losses, particularly in a sharply rising market. The use of short sales may also cause the Fund to have higher expenses than other funds. Page 29 .
Board of Trustees and Officers First Trust Long/Short Equity ETF (FTLS) October 31, 2014 (Unaudited) The Trust’s statement of additional information includes additional information about the Trustees and is available, without charge, upon request, by calling (800) 988-5891. Name, Address, Date of Birth and Position with the Trust Term of Office and Year First Elected or Appointed Principal Occupations During Past 5 Years Number of Portfolios in the First Trust Fund Complex Overseen by Trustee Other Trusteeships or Directorships Held by Trustee During Past 5 Years INDEPENDENT TRUSTEES Richard E. Erickson, Trustee c/o First Trust Advisors L.P. 120 East Liberty Drive, Suite 400 Wheaton, IL 60187 D.O.B.: 04/51 Thomas R. Kadlec, Trustee c/o First Trust Advisors L.P. 120 East Liberty Drive, Suite 400 Wheaton, IL 60187 D.O.B.: 11/57 • Indefinite Term • Since Inception • Indefinite Term • Since Inception Robert F. Keith, Trustee c/o First Trust Advisors L.P. 120 East Liberty Drive, Suite 400 Wheaton, IL 60187 D.O.B.: 11/56 • Indefinite Term Niel B.
Nielson, Trustee c/o First Trust Advisors L.P. 120 East Liberty Drive, Suite 400 Wheaton, IL 60187 D.O.B.: 03/54 • Indefinite Term • Since Inception • Since Inception Physician; President, Wheaton Orthopedics; Limited Partner, Gundersen Real Estate Limited Partnership; Member, Sportsmed LLC 111 None President (March 2010 to Present), Senior Vice President and Chief Financial Officer (May 2007 to March 2010), ADM Investor Services, Inc. (Futures Commission Merchant) 111 Director of ADM Investor Services, Inc., ADM Investor Services International, and Futures Industry Association President (2003 to Present), Hibs Enterprises (Financial and Management Consulting) 111 Director of Trust Company of Illinois Managing Director and Chief Operating Officer (January 2015 to Present), Pelita Harapan Educational Foundation (Educational Products and Services); President and Chief Executive Officer (June 2012 to September 2014), Servant Interactive LLC (Educational Products and Services); President and Chief Executive Officer (June 2012 to September 2014), Dew Learning LLC (Educational Products and Services); President (June 2002 to June 2012), Covenant College 111 Director of Covenant Transport, Inc. (May 2003 to May 2014) 111 None INTERESTED TRUSTEE James A. Bowen(1), Trustee, Chairman of the Board 120 East Liberty Drive, Suite 400 Wheaton, IL 60187 D.O.B.: 09/55 (1) • Indefinite Term • Since Inception Chief Executive Officer (December 2010 to Present), President (until December 2010), First Trust Advisors L.P.
and First Trust Portfolios L.P.; Chairman of the Board of Directors, BondWave LLC (Software Development Company/Investment Advisor and Stonebridge Advisors LLC (Investment Advisor) Mr. Bowen is deemed an “interested person” of the Trust due to his position as Chief Executive Officer of First Trust Advisors L.P., investment advisor of the Trust. Page 30 . Board of Trustees and Officers (Continued) First Trust Long/Short Equity ETF (FTLS) October 31, 2014 (Unaudited) Name, Address and Date of Birth Position and Offices with Trust Term of Office and Length of Service Principal Occupations During Past 5 Years OFFICERS(2) Mark R. Bradley 120 E. Liberty Drive, Suite 400 Wheaton, IL 60187 D.O.B.: 11/57 President and Chief Executive Officer James M. Dykas 120 E.
Liberty Drive, Suite 400 Wheaton, IL 60187 D.O.B.: 01/66 Treasurer, Chief Financial Officer and Chief Accounting Officer W. Scott Jardine 120 E. Liberty Drive, Suite 400 Wheaton, IL 60187 D.O.B.: 05/60 Secretary and Chief Legal Officer Daniel J.
Lindquist 120 E. Liberty Drive, Suite 400 Wheaton, IL 60187 D.O.B.: 02/70 Vice President Kristi A. Maher 120 E.
Liberty Drive, Suite 400 Wheaton, IL 60187 D.O.B.: 12/66 Chief Compliance Officer and Assistant Secretary Roger F. Testin 120 E. Liberty Drive, Suite 400 Wheaton, IL 60187 D.O.B.: 06/66 Vice President Stan Ueland 120 E.
Liberty Drive, Suite 400 Wheaton, IL 60187 D.O.B.: 11/70 Vice President (2) • Indefinite Term • Since Inception • Indefinite Term • Since Inception • Indefinite Term • Since Inception • Indefinite Term • Since Inception • Indefinite Term Chief Operating Officer (December 2010 to Present) and Chief Financial Officer, First Trust Advisors L.P. and First Trust Portfolios L.P.; Chief Financial Officer, BondWave LLC (Software Development Company/Investment Advisor) and Stonebridge Advisors LLC (Investment Advisor) Controller (January 2011 to Present), Senior Vice President (April 2007 to Present), First Trust Advisors L.P. and First Trust Portfolios L.P. General Counsel, First Trust Advisors L.P., First Trust Portfolios L.P.; Secretary and General Counsel, BondWave LLC (Software Development Company/Investment Advisor); Secretary of Stonebridge Advisors LLC (Investment Advisor) Managing Director (July 2012 to Present), Senior Vice President (September 2005 to July 2012), First Trust Advisors L.P.
and First Trust Portfolios L.P. Deputy General Counsel, First Trust Advisors L.P. and First Trust Portfolios L.P. • Since Inception • Indefinite Term Senior Vice President, First Trust Advisors L.P. and First Trust Portfolios L.P. • Since Inception • Indefinite Term • Since Inception Senior Vice President (September 2012 to Present), Vice President (August 2005 to September 2012), First Trust Advisors L.P. and First Trust Portfolios L.P. The term “officer” means the president, vice president, secretary, treasurer, controller or any other officer who performs a policy making function. Page 31 .
Privacy Policy First Trust Long/Short Equity ETF (FTLS) October 31, 2014 (Unaudited) Privacy Policy First Trust values our relationship with you and considers your privacy an important priority in maintaining that relationship. We are committed to protecting the security and confidentiality of your personal information. Sources of Information We collect nonpublic personal information about you from the following sources: • Information we receive from you and your broker-dealer, investment advisor or financial representative through interviews, applications, agreements or other forms; • Information about your transactions with us, our affiliates or others; • Information we receive from your inquiries by mail, e-mail or telephone; and • Information we collect on our website through the use of “cookies”. For example, we may identify the pages on our website that your browser requests or visits. Information Collected The type of data we collect may include your name, address, social security number, age, financial status, assets, income, tax information, retirement and estate plan information, transaction history, account balance, payment history, investment objectives, marital status, family relationships and other personal information. Disclosure of Information We do not disclose any nonpublic personal information about our customers or former customers to anyone, except as permitted by law. In addition to using this information to verify your identity (as required under law), the permitted uses may also include the disclosure of such information to unaffiliated companies for the following reasons: • In order to provide you with products and services and to effect transactions that you request or authorize, we may disclose your personal information as described above to unaffiliated financial service providers and other companies that perform administrative or other services on our behalf, such as transfer agents, custodians and trustees, or that assist us in the distribution of investor materials such as trustees, banks, financial representatives, proxy services, solicitors and printers. • We may release information we have about you if you direct us to do so, if we are compelled by law to do so, or in other legally limited circumstances (for example to protect your account from fraud). In addition, in order to alert you to our other financial products and services, we may share your personal information within First Trust. Privacy Online We allow third-party companies, including AddThis (a social media sharing service), to collect certain anonymous information when you visit our website.
These companies may use non-personally identifiable information during your visits to this and other websites in order to provide advertisements about goods and services likely to be of greater interest to you. These companies typically use a cookie, third party web beacon or pixel tags, to collect this information. To learn more about this behavioral advertising practice, you can visit www.networkadvertising.org. Confidentiality and Security With regard to our internal security procedures, First Trust restricts access to your nonpublic personal information to those First Trust employees who need to know that information to provide products or services to you.
We maintain physical, electronic and procedural safeguards to protect your nonpublic personal information. Policy Updates and Inquiries As required by federal law, we will notify you of our privacy policy annually. We reserve the right to modify this policy at any time, however, if we do change it, we will tell you promptly. For questions about our policy, or for additional copies of this notice, please go to www.ftportfolios.com, or contact us at 1-800-621-1675 (First Trust Portfolios) or 1-800-222-6822 (First Trust Advisors). Page 32 .
First Trust Exchange-Traded Fund III INVESTMENT ADVISOR First Trust Advisors L.P. 120 East Liberty Drive, Suite 400 Wheaton, IL 60187 ADMINISTRATOR, CUSTODIAN, FUND ACCOUNTANT & TRANSFER AGENT Brown Brothers Harriman & Co. 50 Post Office Square Boston, MA 02110 INDEPENDENT REGISTERED PUBLIC ACCOUNTING FIRM Deloitte & Touche LLP 111 S. Wacker Drive Chicago, IL 60606 LEGAL COUNSEL Chapman and Cutler LLP 111 W. Monroe Street Chicago, IL 60603 . .