First Eagle Fund of America Quarterly Commentary - December 31, 2015
First Eagle Asset Management


Description
First Eagle Fund of America
Commentary
As of December 31, 2015
The First Eagle Fund of America class A shares (w/out sales charge) returned 5.35%1 for the quarter ending December 31,
2015 versus 7.04% for the S&P 500 Index. We lagged the index as large/mega cap stocks outperformed mid/small cap stocks
as discussed in further detail below.
2015 was a challenging year in global stock markets. Investors watched nervously as the US Federal Reserve waffled over whether
to raise interest rates even as evidence mounted of a global economic slowdown. China, the world’s leading growth engine for the
last 25 years, clearly decelerated.
Significant recessionary conditions took hold in economies linked to China, such as Brazil, and are affecting more developed economies such as Australia and Canada. S&P 500 Index earnings appeared to have declined slightly, in large part due to the pressure on industrial activity from the sharp commodity contraction as well as the strength in the US dollar. Market Breadth & Consolidation For two years we have written about the likelihood of consolidation in the market following over a half decade of strong returns. Whilst we saw the market consolidate in 2015, we believe the real story is not the consolidation that the headline S&P 500 Index return suggests, but that stock market pain has been far more pervasive.
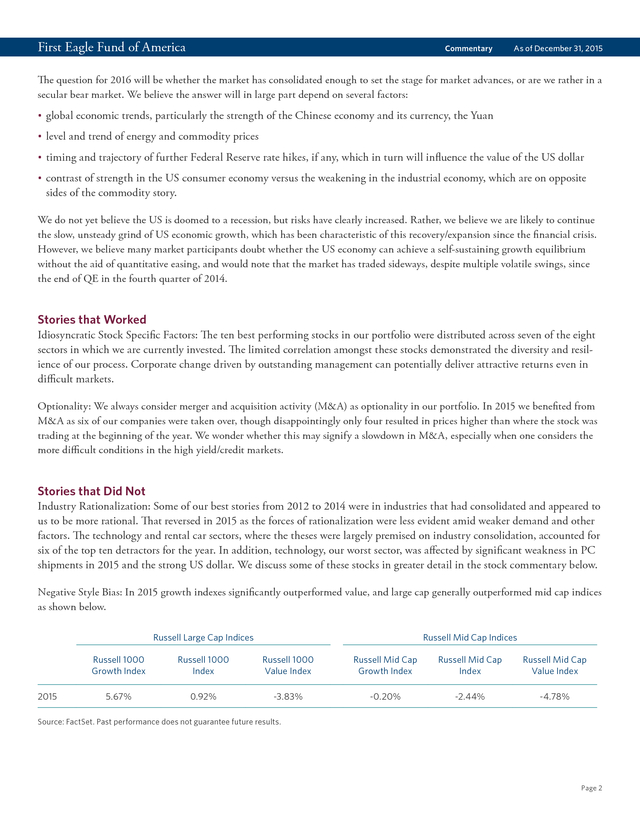
If one were to exclude the top 10 largest companies in the S&P 500 Index (at year end 2015), the remaining stocks were down, on average, 3.65% for 2015.2 As you can see from the table below, almost two thirds or more of stocks were in “Correction mode” (down 10% or more) from their 52 week high by year end 2015, and at least one third finished the year in “Bear mode” (down 20% or more). This proportion became more pronounced in 2016, as by January 15th 50% of the S&P 500 Index were 20% or more below their 52 week high. As of 12/31/2015 from 52 week high As of 1/15/2016 from 52 week high -10% or more (Correction) -20% or more (Bear) -10% or more (Correction) -20% or more (Bear) S&P 500 Index 63% 37% 80% 50% Russell Mid Cap Index 72% 45% 86% 58% Russell 2000 Index 80% 58% 91% 70% Source: Bloomberg 1. Class A shares performance without the effect of sales charges and assumes all distributions have been reinvested and if a sales charge was included values would be lower. The performance data quoted herein represents past performance and does not guarantee future results. Market volatility can dramaticallyimpact the fund’s short term performance.
Current performance may be lower or higher than figures shown. The investment return and principalvalue will fluctuate so that an investor’s shares, when redeemed may be worth more or less than their original cost. Past performance datathrough the most recent month end is available at www.feim.com or by calling 800.334.2143.
The average annual returns for Class A Shares“with sales charge” of First Eagle Fund of America give effect to the deduction of the maximum sales charge of 5.00%. One cannot invest directly in an index. 2. Source: Bloomberg Page 1 . First Eagle Fund of America Commentary As of December 31, 2015 The question for 2016 will be whether the market has consolidated enough to set the stage for market advances, or are we rather in a secular bear market. We believe the answer will in large part depend on several factors: • global economic trends, particularly the strength of the Chinese economy and its currency, the Yuan • level and trend of energy and commodity prices • timing and trajectory of further Federal Reserve rate hikes, if any, which in turn will influence the value of the US dollar • contrast of strength in the US consumer economy versus the weakening in the industrial economy, which are on opposite sides of the commodity story. We do not yet believe the US is doomed to a recession, but risks have clearly increased. Rather, we believe we are likely to continue the slow, unsteady grind of US economic growth, which has been characteristic of this recovery/expansion since the financial crisis. However, we believe many market participants doubt whether the US economy can achieve a selfâ€sustaining growth equilibrium without the aid of quantitative easing, and would note that the market has traded sideways, despite multiple volatile swings, since the end of QE in the fourth quarter of 2014. Stories that Worked Idiosyncratic Stock Specific Factors: The ten best performing stocks in our portfolio were distributed across seven of the eight sectors in which we are currently invested. The limited correlation amongst these stocks demonstrated the diversity and resilience of our process.
Corporate change driven by outstanding management can potentially deliver attractive returns even in difficult markets. Optionality: We always consider merger and acquisition activity (M&A) as optionality in our portfolio. In 2015 we benefited from M&A as six of our companies were taken over, though disappointingly only four resulted in prices higher than where the stock was trading at the beginning of the year. We wonder whether this may signify a slowdown in M&A, especially when one considers the more difficult conditions in the high yield/credit markets. Stories that Did Not Industry Rationalization: Some of our best stories from 2012 to 2014 were in industries that had consolidated and appeared to us to be more rational.
That reversed in 2015 as the forces of rationalization were less evident amid weaker demand and other factors. The technology and rental car sectors, where the theses were largely premised on industry consolidation, accounted for six of the top ten detractors for the year. In addition, technology, our worst sector, was affected by significant weakness in PC shipments in 2015 and the strong US dollar.
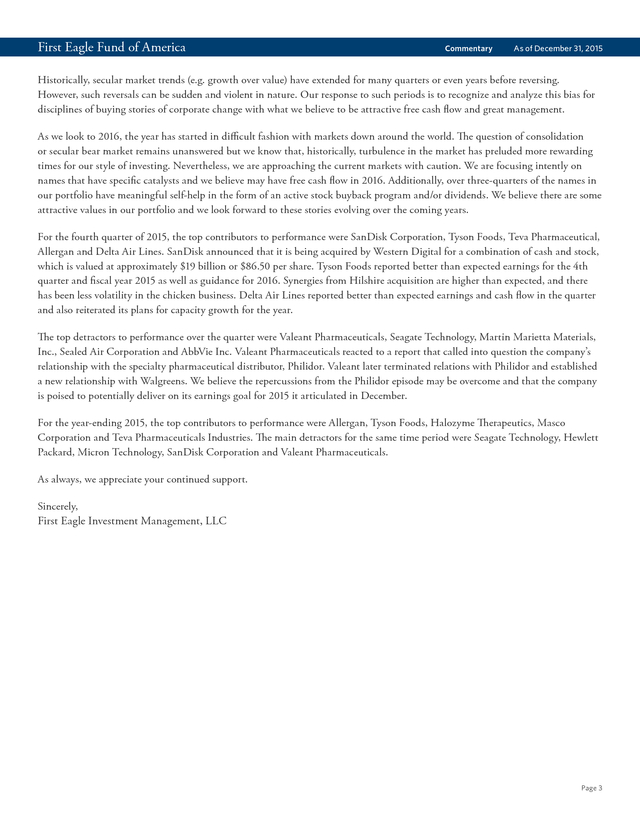
We discuss some of these stocks in greater detail in the stock commentary below. Negative Style Bias: In 2015 growth indexes significantly outperformed value, and large cap generally outperformed mid cap indices as shown below. Russell Large Cap Indices Russell Mid Cap Indices Russell 1000 Growth Index 2015 Russell 1000 Index Russell 1000 Value Index Russell Mid Cap Growth Index Russell Mid Cap Index Russell Mid Cap Value Index 5.67% 0.92% -3.83% -0.20% -2.44% -4.78% Source: FactSet. Past performance does not guarantee future results. Page 2 . First Eagle Fund of America Commentary As of December 31, 2015 Historically, secular market trends (e.g. growth over value) have extended for many quarters or even years before reversing. However, such reversals can be sudden and violent in nature. Our response to such periods is to recognize and analyze this bias for disciplines of buying stories of corporate change with what we believe to be attractive free cash flow and great management. As we look to 2016, the year has started in difficult fashion with markets down around the world. The question of consolidation or secular bear market remains unanswered but we know that, historically, turbulence in the market has preluded more rewarding times for our style of investing.
Nevertheless, we are approaching the current markets with caution. We are focusing intently on names that have specific catalysts and we believe may have free cash flow in 2016. Additionally, over threeâ€quarters of the names in our portfolio have meaningful selfâ€help in the form of an active stock buyback program and/or dividends.
We believe there are some attractive values in our portfolio and we look forward to these stories evolving over the coming years. For the fourth quarter of 2015, the top contributors to performance were SanDisk Corporation, Tyson Foods, Teva Pharmaceutical, Allergan and Delta Air Lines. SanDisk announced that it is being acquired by Western Digital for a combination of cash and stock, which is valued at approximately $19 billion or $86.50 per share. Tyson Foods reported better than expected earnings for the 4th quarter and fiscal year 2015 as well as guidance for 2016.
Synergies from Hilshire acquisition are higher than expected, and there has been less volatility in the chicken business. Delta Air Lines reported better than expected earnings and cash flow in the quarter and also reiterated its plans for capacity growth for the year. The top detractors to performance over the quarter were Valeant Pharmaceuticals, Seagate Technology, Martin Marietta Materials, Inc., Sealed Air Corporation and AbbVie Inc. Valeant Pharmaceuticals reacted to a report that called into question the company’s relationship with the specialty pharmaceutical distributor, Philidor.
Valeant later terminated relations with Philidor and established a new relationship with Walgreens. We believe the repercussions from the Philidor episode may be overcome and that the company is poised to potentially deliver on its earnings goal for 2015 it articulated in December. For the year-ending 2015, the top contributors to performance were Allergan, Tyson Foods, Halozyme Therapeutics, Masco Corporation and Teva Pharmaceuticals Industries. The main detractors for the same time period were Seagate Technology, Hewlett Packard, Micron Technology, SanDisk Corporation and Valeant Pharmaceuticals. As always, we appreciate your continued support. Sincerely, First Eagle Investment Management, LLC Page 3 .
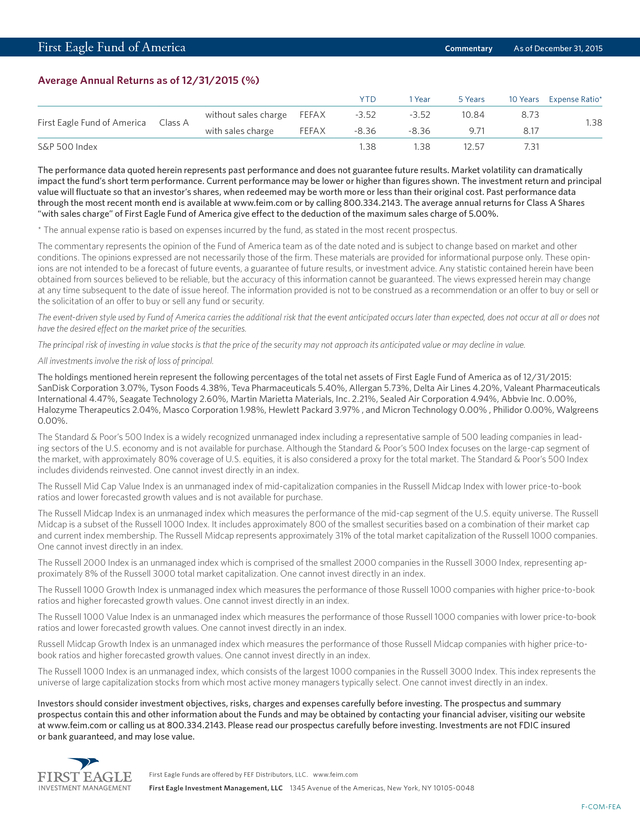
First Eagle Fund of America Commentary As of December 31, 2015 Average Annual Returns as of 12/31/2015 (%) YTD First Eagle Fund of America 1 Year 5 Years 10 Years without sales charge FEFAX -3.52 -3.52 10.84 8.73 with sales charge FEFAX -8.36 -8.36 9.71 8.17 1.38 Class A 1.38 12.57 Expense Ratio* 7.31 S&P 500 Index 1.38 The performance data quoted herein represents past performance and does not guarantee future results. Market volatility can dramatically impact the fund’s short term performance. Current performance may be lower or higher than figures shown. The investment return and principal value will fluctuate so that an investor’s shares, when redeemed may be worth more or less than their original cost.
Past performance data through the most recent month end is available at www.feim.com or by calling 800.334.2143. The average annual returns for Class A Shares “with sales charge” of First Eagle Fund of America give effect to the deduction of the maximum sales charge of 5.00%. * The annual expense ratio is based on expenses incurred by the fund, as stated in the most recent prospectus. The commentary represents the opinion of the Fund of America team as of the date noted and is subject to change based on market and other conditions. The opinions expressed are not necessarily those of the firm.
These materials are provided for informational purpose only. These opinions are not intended to be a forecast of future events, a guarantee of future results, or investment advice. Any statistic contained herein have been obtained from sources believed to be reliable, but the accuracy of this information cannot be guaranteed.
The views expressed herein may change at any time subsequent to the date of issue hereof. The information provided is not to be construed as a recommendation or an offer to buy or sell or the solicitation of an offer to buy or sell any fund or security. The event-driven style used by Fund of America carries the additional risk that the event anticipated occurs later than expected, does not occur at all or does not have the desired effect on the market price of the securities. The principal risk of investing in value stocks is that the price of the security may not approach its anticipated value or may decline in value. All investments involve the risk of loss of principal. The holdings mentioned herein represent the following percentages of the total net assets of First Eagle Fund of America as of 12/31/2015: SanDisk Corporation 3.07%, Tyson Foods 4.38%, Teva Pharmaceuticals 5.40%, Allergan 5.73%, Delta Air Lines 4.20%, Valeant Pharmaceuticals International 4.47%, Seagate Technology 2.60%, Martin Marietta Materials, Inc. 2.21%, Sealed Air Corporation 4.94%, Abbvie Inc.
0.00%, Halozyme Therapeutics 2.04%, Masco Corporation 1.98%, Hewlett Packard 3.97% , and Micron Technology 0.00% , Philidor 0.00%, Walgreens 0.00%. The Standard & Poor’s 500 Index is a widely recognized unmanaged index including a representative sample of 500 leading companies in leading sectors of the U.S. economy and is not available for purchase. Although the Standard & Poor’s 500 Index focuses on the large-cap segment of the market, with approximately 80% coverage of U.S.
equities, it is also considered a proxy for the total market. The Standard & Poor’s 500 Index includes dividends reinvested. One cannot invest directly in an index. The Russell Mid Cap Value Index is an unmanaged index of mid-capitalization companies in the Russell Midcap Index with lower price-to-book ratios and lower forecasted growth values and is not available for purchase. The Russell Midcap Index is an unmanaged index which measures the performance of the mid-cap segment of the U.S.
equity universe. The Russell Midcap is a subset of the Russell 1000 Index. It includes approximately 800 of the smallest securities based on a combination of their market cap and current index membership.
The Russell Midcap represents approximately 31% of the total market capitalization of the Russell 1000 companies. One cannot invest directly in an index. The Russell 2000 Index is an unmanaged index which is comprised of the smallest 2000 companies in the Russell 3000 Index, representing approximately 8% of the Russell 3000 total market capitalization. One cannot invest directly in an index. The Russell 1000 Growth Index is unmanaged index which measures the performance of those Russell 1000 companies with higher price-to-book ratios and higher forecasted growth values. One cannot invest directly in an index. The Russell 1000 Value Index is an unmanaged index which measures the performance of those Russell 1000 companies with lower price-to-book ratios and lower forecasted growth values.
One cannot invest directly in an index. Russell Midcap Growth Index is an unmanaged index which measures the performance of those Russell Midcap companies with higher price-tobook ratios and higher forecasted growth values. One cannot invest directly in an index. The Russell 1000 Index is an unmanaged index, which consists of the largest 1000 companies in the Russell 3000 Index. This index represents the universe of large capitalization stocks from which most active money managers typically select.
One cannot invest directly in an index. Investors should consider investment objectives, risks, charges and expenses carefully before investing. The prospectus and summary prospectus contain this and other information about the Funds and may be obtained by contacting your financial adviser, visiting our website at www.feim.com or calling us at 800.334.2143. Please read our prospectus carefully before investing.
Investments are not FDIC insured or bank guaranteed, and may lose value. First Eagle Funds are offered by FEF Distributors, LLC. www.feim.com First Eagle Investment Management, LLC 1345 Avenue of the Americas, New York, NY 10105-0048 F-COM-FEA .
Significant recessionary conditions took hold in economies linked to China, such as Brazil, and are affecting more developed economies such as Australia and Canada. S&P 500 Index earnings appeared to have declined slightly, in large part due to the pressure on industrial activity from the sharp commodity contraction as well as the strength in the US dollar. Market Breadth & Consolidation For two years we have written about the likelihood of consolidation in the market following over a half decade of strong returns. Whilst we saw the market consolidate in 2015, we believe the real story is not the consolidation that the headline S&P 500 Index return suggests, but that stock market pain has been far more pervasive.
If one were to exclude the top 10 largest companies in the S&P 500 Index (at year end 2015), the remaining stocks were down, on average, 3.65% for 2015.2 As you can see from the table below, almost two thirds or more of stocks were in “Correction mode” (down 10% or more) from their 52 week high by year end 2015, and at least one third finished the year in “Bear mode” (down 20% or more). This proportion became more pronounced in 2016, as by January 15th 50% of the S&P 500 Index were 20% or more below their 52 week high. As of 12/31/2015 from 52 week high As of 1/15/2016 from 52 week high -10% or more (Correction) -20% or more (Bear) -10% or more (Correction) -20% or more (Bear) S&P 500 Index 63% 37% 80% 50% Russell Mid Cap Index 72% 45% 86% 58% Russell 2000 Index 80% 58% 91% 70% Source: Bloomberg 1. Class A shares performance without the effect of sales charges and assumes all distributions have been reinvested and if a sales charge was included values would be lower. The performance data quoted herein represents past performance and does not guarantee future results. Market volatility can dramaticallyimpact the fund’s short term performance.
Current performance may be lower or higher than figures shown. The investment return and principalvalue will fluctuate so that an investor’s shares, when redeemed may be worth more or less than their original cost. Past performance datathrough the most recent month end is available at www.feim.com or by calling 800.334.2143.
The average annual returns for Class A Shares“with sales charge” of First Eagle Fund of America give effect to the deduction of the maximum sales charge of 5.00%. One cannot invest directly in an index. 2. Source: Bloomberg Page 1 . First Eagle Fund of America Commentary As of December 31, 2015 The question for 2016 will be whether the market has consolidated enough to set the stage for market advances, or are we rather in a secular bear market. We believe the answer will in large part depend on several factors: • global economic trends, particularly the strength of the Chinese economy and its currency, the Yuan • level and trend of energy and commodity prices • timing and trajectory of further Federal Reserve rate hikes, if any, which in turn will influence the value of the US dollar • contrast of strength in the US consumer economy versus the weakening in the industrial economy, which are on opposite sides of the commodity story. We do not yet believe the US is doomed to a recession, but risks have clearly increased. Rather, we believe we are likely to continue the slow, unsteady grind of US economic growth, which has been characteristic of this recovery/expansion since the financial crisis. However, we believe many market participants doubt whether the US economy can achieve a selfâ€sustaining growth equilibrium without the aid of quantitative easing, and would note that the market has traded sideways, despite multiple volatile swings, since the end of QE in the fourth quarter of 2014. Stories that Worked Idiosyncratic Stock Specific Factors: The ten best performing stocks in our portfolio were distributed across seven of the eight sectors in which we are currently invested. The limited correlation amongst these stocks demonstrated the diversity and resilience of our process.
Corporate change driven by outstanding management can potentially deliver attractive returns even in difficult markets. Optionality: We always consider merger and acquisition activity (M&A) as optionality in our portfolio. In 2015 we benefited from M&A as six of our companies were taken over, though disappointingly only four resulted in prices higher than where the stock was trading at the beginning of the year. We wonder whether this may signify a slowdown in M&A, especially when one considers the more difficult conditions in the high yield/credit markets. Stories that Did Not Industry Rationalization: Some of our best stories from 2012 to 2014 were in industries that had consolidated and appeared to us to be more rational.
That reversed in 2015 as the forces of rationalization were less evident amid weaker demand and other factors. The technology and rental car sectors, where the theses were largely premised on industry consolidation, accounted for six of the top ten detractors for the year. In addition, technology, our worst sector, was affected by significant weakness in PC shipments in 2015 and the strong US dollar.
We discuss some of these stocks in greater detail in the stock commentary below. Negative Style Bias: In 2015 growth indexes significantly outperformed value, and large cap generally outperformed mid cap indices as shown below. Russell Large Cap Indices Russell Mid Cap Indices Russell 1000 Growth Index 2015 Russell 1000 Index Russell 1000 Value Index Russell Mid Cap Growth Index Russell Mid Cap Index Russell Mid Cap Value Index 5.67% 0.92% -3.83% -0.20% -2.44% -4.78% Source: FactSet. Past performance does not guarantee future results. Page 2 . First Eagle Fund of America Commentary As of December 31, 2015 Historically, secular market trends (e.g. growth over value) have extended for many quarters or even years before reversing. However, such reversals can be sudden and violent in nature. Our response to such periods is to recognize and analyze this bias for disciplines of buying stories of corporate change with what we believe to be attractive free cash flow and great management. As we look to 2016, the year has started in difficult fashion with markets down around the world. The question of consolidation or secular bear market remains unanswered but we know that, historically, turbulence in the market has preluded more rewarding times for our style of investing.
Nevertheless, we are approaching the current markets with caution. We are focusing intently on names that have specific catalysts and we believe may have free cash flow in 2016. Additionally, over threeâ€quarters of the names in our portfolio have meaningful selfâ€help in the form of an active stock buyback program and/or dividends.
We believe there are some attractive values in our portfolio and we look forward to these stories evolving over the coming years. For the fourth quarter of 2015, the top contributors to performance were SanDisk Corporation, Tyson Foods, Teva Pharmaceutical, Allergan and Delta Air Lines. SanDisk announced that it is being acquired by Western Digital for a combination of cash and stock, which is valued at approximately $19 billion or $86.50 per share. Tyson Foods reported better than expected earnings for the 4th quarter and fiscal year 2015 as well as guidance for 2016.
Synergies from Hilshire acquisition are higher than expected, and there has been less volatility in the chicken business. Delta Air Lines reported better than expected earnings and cash flow in the quarter and also reiterated its plans for capacity growth for the year. The top detractors to performance over the quarter were Valeant Pharmaceuticals, Seagate Technology, Martin Marietta Materials, Inc., Sealed Air Corporation and AbbVie Inc. Valeant Pharmaceuticals reacted to a report that called into question the company’s relationship with the specialty pharmaceutical distributor, Philidor.
Valeant later terminated relations with Philidor and established a new relationship with Walgreens. We believe the repercussions from the Philidor episode may be overcome and that the company is poised to potentially deliver on its earnings goal for 2015 it articulated in December. For the year-ending 2015, the top contributors to performance were Allergan, Tyson Foods, Halozyme Therapeutics, Masco Corporation and Teva Pharmaceuticals Industries. The main detractors for the same time period were Seagate Technology, Hewlett Packard, Micron Technology, SanDisk Corporation and Valeant Pharmaceuticals. As always, we appreciate your continued support. Sincerely, First Eagle Investment Management, LLC Page 3 .
First Eagle Fund of America Commentary As of December 31, 2015 Average Annual Returns as of 12/31/2015 (%) YTD First Eagle Fund of America 1 Year 5 Years 10 Years without sales charge FEFAX -3.52 -3.52 10.84 8.73 with sales charge FEFAX -8.36 -8.36 9.71 8.17 1.38 Class A 1.38 12.57 Expense Ratio* 7.31 S&P 500 Index 1.38 The performance data quoted herein represents past performance and does not guarantee future results. Market volatility can dramatically impact the fund’s short term performance. Current performance may be lower or higher than figures shown. The investment return and principal value will fluctuate so that an investor’s shares, when redeemed may be worth more or less than their original cost.
Past performance data through the most recent month end is available at www.feim.com or by calling 800.334.2143. The average annual returns for Class A Shares “with sales charge” of First Eagle Fund of America give effect to the deduction of the maximum sales charge of 5.00%. * The annual expense ratio is based on expenses incurred by the fund, as stated in the most recent prospectus. The commentary represents the opinion of the Fund of America team as of the date noted and is subject to change based on market and other conditions. The opinions expressed are not necessarily those of the firm.
These materials are provided for informational purpose only. These opinions are not intended to be a forecast of future events, a guarantee of future results, or investment advice. Any statistic contained herein have been obtained from sources believed to be reliable, but the accuracy of this information cannot be guaranteed.
The views expressed herein may change at any time subsequent to the date of issue hereof. The information provided is not to be construed as a recommendation or an offer to buy or sell or the solicitation of an offer to buy or sell any fund or security. The event-driven style used by Fund of America carries the additional risk that the event anticipated occurs later than expected, does not occur at all or does not have the desired effect on the market price of the securities. The principal risk of investing in value stocks is that the price of the security may not approach its anticipated value or may decline in value. All investments involve the risk of loss of principal. The holdings mentioned herein represent the following percentages of the total net assets of First Eagle Fund of America as of 12/31/2015: SanDisk Corporation 3.07%, Tyson Foods 4.38%, Teva Pharmaceuticals 5.40%, Allergan 5.73%, Delta Air Lines 4.20%, Valeant Pharmaceuticals International 4.47%, Seagate Technology 2.60%, Martin Marietta Materials, Inc. 2.21%, Sealed Air Corporation 4.94%, Abbvie Inc.
0.00%, Halozyme Therapeutics 2.04%, Masco Corporation 1.98%, Hewlett Packard 3.97% , and Micron Technology 0.00% , Philidor 0.00%, Walgreens 0.00%. The Standard & Poor’s 500 Index is a widely recognized unmanaged index including a representative sample of 500 leading companies in leading sectors of the U.S. economy and is not available for purchase. Although the Standard & Poor’s 500 Index focuses on the large-cap segment of the market, with approximately 80% coverage of U.S.
equities, it is also considered a proxy for the total market. The Standard & Poor’s 500 Index includes dividends reinvested. One cannot invest directly in an index. The Russell Mid Cap Value Index is an unmanaged index of mid-capitalization companies in the Russell Midcap Index with lower price-to-book ratios and lower forecasted growth values and is not available for purchase. The Russell Midcap Index is an unmanaged index which measures the performance of the mid-cap segment of the U.S.
equity universe. The Russell Midcap is a subset of the Russell 1000 Index. It includes approximately 800 of the smallest securities based on a combination of their market cap and current index membership.
The Russell Midcap represents approximately 31% of the total market capitalization of the Russell 1000 companies. One cannot invest directly in an index. The Russell 2000 Index is an unmanaged index which is comprised of the smallest 2000 companies in the Russell 3000 Index, representing approximately 8% of the Russell 3000 total market capitalization. One cannot invest directly in an index. The Russell 1000 Growth Index is unmanaged index which measures the performance of those Russell 1000 companies with higher price-to-book ratios and higher forecasted growth values. One cannot invest directly in an index. The Russell 1000 Value Index is an unmanaged index which measures the performance of those Russell 1000 companies with lower price-to-book ratios and lower forecasted growth values.
One cannot invest directly in an index. Russell Midcap Growth Index is an unmanaged index which measures the performance of those Russell Midcap companies with higher price-tobook ratios and higher forecasted growth values. One cannot invest directly in an index. The Russell 1000 Index is an unmanaged index, which consists of the largest 1000 companies in the Russell 3000 Index. This index represents the universe of large capitalization stocks from which most active money managers typically select.
One cannot invest directly in an index. Investors should consider investment objectives, risks, charges and expenses carefully before investing. The prospectus and summary prospectus contain this and other information about the Funds and may be obtained by contacting your financial adviser, visiting our website at www.feim.com or calling us at 800.334.2143. Please read our prospectus carefully before investing.
Investments are not FDIC insured or bank guaranteed, and may lose value. First Eagle Funds are offered by FEF Distributors, LLC. www.feim.com First Eagle Investment Management, LLC 1345 Avenue of the Americas, New York, NY 10105-0048 F-COM-FEA .


