Advisor Perspectives | The Portfolio Management Team on the Trends Driving Global Opportunities - February 10, 2016
First Eagle Asset Management


Description
The First Eagle Portfolio Management Team
on the Trends Driving Global Opportunities
First Eagle’s Global Fund (SGENX) is
its flagship fund, with over $45 billion
in assets. Its mission is to seek longterm growth of capital by investing
in a range of asset classes from markets in the United States and around
the world.
Since inception (1/1/79)1 , it has returned 13.35% annually, versus 9.50%
for the MSCI World Index. Over the
last 15 years, it has been in the top
2% of its peer group, as well as in the
top 5% for 10 years and the top 15%
for 5 years, based on Morningstar
data. It was the winner of the Lipper
Best Flexible Portfolio Fund Award
for 2015.
Its managers are Matthew B. McLennan and Kimball Brooker, Jr. Advisor Perspectives Editor in Chief Robert Huebscher spoke with Matt and Kimball on January 14. Bob: In a panel discussion back in June, Bruce Greenwald, who is a senior advisor to your firm, made a number of assertions. I am going to ask you about each of them and how your portfolio is structured to potentially benefit from them.
The first one is that manufacturing is dying and that is creating chronic deflationary pressure. Matt: Bruce was making the simple point that factory automation is reducing the need for labor in manufacturing. When he said manufacturing was dying, he wasn’t intimating that we are producing less things, just that it is taking less labor to produce those things. The analogy I draw here is if you went back in time a century or so ago, many people were employed in some form of agriculture.
Today it is a low single-digit percentage of the economy, but we are still eating well, perhaps too well. Jobs moved from the agricultural sector to manufacturing sector throughout the course of the early part of the last century. Of course, during the last jobs moving out of manufacturing into services.
It takes time to retrain people. That has produced a persistent tendency for countries in that region to try and devalue their currency versus the dollar, which in turn has produced a structural current-account deficit in the United States. The quest for is a “ Factory automationfund.very powerfulthat source of ideas for our We’ve seen in the proliferation of robotics, pneumatic systems, electrical sensors and the like. ” generation, it has moved progressively to the services sector. Factory automation is a very powerful source of ideas for our fund. We’ve seen that in the proliferation of robotics, pneumatic systems, electrical sensors and the like.
In fact, if you look at our portfolios, we have benefited from this trend through the ownership of some of the leading franchises in this area. The decline of employment in manufacturing is having a second-order effect on global systemic imbalances. Part of that is driven by the fact that many of the Asian economies have built their economic miracles on manufacturing models fueled in large part by subsidized exchange rates. As they’ve grown rapidly through manufacturing and moved a lot of people from poverty into employment in manufacturing, they prospectively face the headwind of growth through manufacturing in Asia is fueling a savings shortfall in the United States. But the essential point is that factory automation is really taking root.
Initially it was robotics for cutting and welding tools and for basic things like painting. But as sensing technologies improved, and software and robotics capabilities improved, there is the prospect of automation creeping into the assembly stage of manufacturing where most of the jobs are. This trend is going to be with us for quite some time; we are still in the early days of those pressures. Having said that, looking forward a generation from today, I believe it may take a lot fewer people to produce what we are producing now, which should free up resources for other productive enterprises. It just won’t necessarily be a smooth journey, particularly for those economies that have built Performance for periods prior to January 1, 2000 occurred while a prior portfolio manager of the fund was affiliated with another firm.
Inception date shown is when this prior portfolio manager assumed portfolio management responsibilities. 1 1 . their economic strength on manufacturing. Bob: The second trend is that service businesses are local in nature and therefore may grow to be able to earn attractive rates of return. Matt: I made the observation that employment is moving from manufacturing to services. When people think of services, often what comes to mind are very simple things like teaching, public relations, child care, private event management, restaurants, local IT services and the like. But those are not necessarily the kinds of businesses that generate attractive returns, because they are competitive. When we think about service businesses that have the ability to generate attractive returns on capital, we are very focused on businesses that have local economies of scale. Those businesses are orders of magnitude larger than their nearest competitors, which makes it more difficult for new entrants to come into a market. We also focus on service businesses where there is a high degree of customer captivity, or stickiness, because it increases the cost of a new entrant coming into those markets. We have a range of investments both overseas and in the United States in areas such as telecommunications, such as KDDI, a scaled provider of mobile and broadband connectivity in Japan, and Secom, also in Japan, which dominates in the commercial services arena for providing alarm, security services for corporations and homes.
In the United States, we own Comcast, which dominates bandwidth provisioning essentially in the markets in which it competes. We own some of the big tech majors, like Oracle and Microsoft; even though they are global in nature, their dominance is local and rooted in sales force density and customer standardization. When we look at businesses we try to identify those that have local economies of scale and sticky customers. Many of these businesses are not traditional manufacturing businesses. You may have elements of their business that don’t require tangible capital investment, but rather where things like brand and process knowhow matter.
These businesses can potentially generate very attractive returns on their tangible capital. Even in the world of what you would traditionally think of as industrials and manufacturing, local market dominance matters. Think of a company like Flowserve in pumps, valves, and seals. Even though you wouldn’t think of them as services, they have material aftermarket businesses that require density of distribution and dealerships, with aftermarket servicing capability that enable them to potentially get attractive returns on their capital. Bob: The third trend is that the lower 85% of households in terms of wealth have a negative savings rate, and it’s the remaining 15% who are accumulating.
That’s a catastrophe waiting to happen because so many households have a negative savings rate. Matt: What Bruce was referring to is the fact that if you look at the overall savings rates, it has drifted up from the low levels of the mid-2000s to just above 5%. The debt-service ratios seem to have improved. But when you look beneath the surface, debt-service ratios look attractive because interest rates have been repressed. The actual level of debt-to-income remains fairly high. Secondly, even though savings 2 rates are above 5%, the top 15% of households probably save close to 40% of their income.
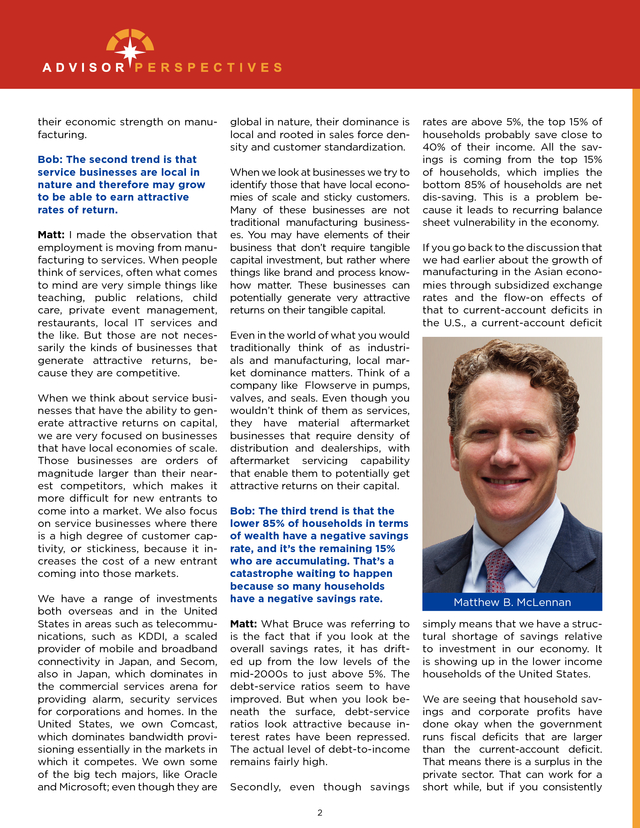
All the savings is coming from the top 15% of households, which implies the bottom 85% of households are net dis-saving. This is a problem because it leads to recurring balance sheet vulnerability in the economy. If you go back to the discussion that we had earlier about the growth of manufacturing in the Asian economies through subsidized exchange rates and the flow-on effects of that to current-account deficits in the U.S., a current-account deficit Matthew B. McLennan simply means that we have a structural shortage of savings relative to investment in our economy.
It is showing up in the lower income households of the United States. We are seeing that household savings and corporate profits have done okay when the government runs fiscal deficits that are larger than the current-account deficit. That means there is a surplus in the private sector. That can work for a short while, but if you consistently . try to run fiscal deficits larger than your current-account deficit in order to promote corporate profit and household savings, you are also going to impair the sovereign balance sheet of the United States. The U.S. ends up with an unfavorable government debt-to-GDP ratio and lower real returns on its government debt as policymakers resort to interest-rate repression in an effort to improve debt-servicing capabilities. Lower real returns exacerbate the problem because if people aren’t saving enough already and they are prospectively getting a lower real return on their savings, they need to save even more in the future. You get this negative feedback loop. That is the struggle that we are dealing with here from a global standpoint. Bob: Gold bullion is your largest position.
Do you own physical gold and why do you own gold if you believe in the scenario of chronic deflation? Matt: We are not intelligent enough to know if we’re going to have chronic deflation or inflation. The crystal ball is foggy at best. We believe the stock of debt in the world is too high. If you look at the aggregate stock of debt—household, plus corporate, plus sovereign debt—and you compare that to GDP it is actually higher than it was in 2007. That is a headwind to inflation.
Creating new money supply through new debt is going to be more challenging. You referred to gold as our largest position, but perhaps that’s not the best way to think about it. The reality is our largest exposure is to the ownership of business. If you look at our key portfolios, over 75% is invested in the ownership of business in one form or another where we try to identify good businesses at good prices.
That means we are very exposed to systemic risk. Our goal at First Eagle has always been to have an all-weather portfolio, one that can endure difficult times. If we think there is too much debt in the world, there are going to be episodic windows of crisis. We want a potential hedge in our Woods agreement. You can intuitively understand why gold may be a good potential hedge against inflation.
If the supply of gold is flat per capita, but the money supply goes up, the equilibrium price of gold ought to go up. Incidentally, when we have inflation it tends to be bad for equities and bonds as well, so gold does have an obvious supply of gold is relative “ Theother commoditiesvery stablevirtually to because all of the gold ever produced still exists above ground. ” portfolio. We view gold as the best potential hedge that we can find. role for us as a potential hedge in an inflationary world. Why is that? It’s pretty simple.
Gold is not that useful as a commodity and its lack of utility as a commodity is actually its usefulness as nature’s alternative to currency. Other commodities such as oil, copper or iron ore are useful real assets that don’t tend to be the best hedge. When things go bad, demand for those commodities generally goes down and their price has historically gone down as we have actually seen the last few years. You posed the alternative question which is, why do you own it if you feel that there is deflationary risk due to excessive debt in the system? My answer to that is that there is no popular appetite—be it in a dictatorship or a democracy— for deflation.
When conditions are deflationary, governments tend to do what it takes to avoid deflation, which typically means running easy fiscal policy with large deficits and very easy monetary policy. That leads over time to bloated levels of government debt. If we look across the world today, there are generationally high levels of government debt relative to GDP and financial repression. Gold, on the other hand, has a price that has very little correlation to the business or the market cycles. In the world of real assets there is very little to own that is less sensitive to the markets than gold.
That is the element of resilience that appeals to us. The supply of gold is very stable relative to other commodities because virtually all of the gold ever produced still exists above ground. When we look at the total stock of gold above ground it’s actually been pretty flat on a per-capita basis for the last 40 years, since the breakdown of the Bretton 3 The rub against gold has always been that it doesn’t offer an interest rate, but really, nor does sovereign debt today as we look around the world. The credit worthiness of sovereign debt has gone down. Gold becomes a more feasible monetary alternative in a world of deflation because the quality of human-made money goes down through fiscal deficits and financial repression. .
Bob: We wrote about research by Michael Mauboussin that examined why so many active managers under performed in 2014. His assertion was that this was due to a lack of opportunities, not a lack of skill. What is your take on his research? How has this factored into the level of cash that you’ve held in your funds? Kimball: The research piece is interesting, and we would certainly agree with the assertion that until recently there have been limited opportunities in the market. But we have a slightly different take on and extension of Mauboussin’s thinking.
One of the things that he did was look back and examine the dispersion of stock returns in 2014 and concluded that it was very, very low, and there was a lower likelihood for active managers to generate excess returns. Incidentally, we think that the dispersion of returns was also very low in 2013 and 2012. He was looking retrospectively to try to explain why active managers were underperforming on a relative basis to their indices. We think about the world a little bit differently in terms of what led to a limited set of opportunities. Our core investment process is very much about buying securities at a discount to our sense of intrinsic value.
What we had seen in the years that Mauboussin had covered in the study was elevated valuations in most of the developed world and a very low dispersion of valuations across different regions and different sectors. That was really the root of the difficulty in finding opportunities to invest. Bob: You tend to build cash positions in bull markets when valuations are very rich and deploy it as the market drops. Thinking back about the days of Jean Marie Eveillard and other past periods when markets were high, how do your cash positions look today? Moreover, you have around 10% in gold and gold-denominated securities, as we discussed. Is this position different from the past and is it going to limit your ability to take advantage of declining valuations? Matt: Let me just start on the gold. For long time we have had approximately 10% in a combination of gold bullion and gold securities. Our logic has been simple.
We view it as a potential hedge. If the combined position were less than 5%, it wouldn’t be material enough to provide a potential hedge to the overall portfolio. On the other hand, we felt a combined position in the 15% to 20% range of our portfolio would start to become more directionally exposed to gold.
There is a common-sense sizing of our gold position. At around about 10%, it’s big enough to be a material potential hedge but not so big that the performance of the portfolio depends upon the gold price. There could be a state of the world where we don’t own gold. If we had a counter-narrative of the crisis in 2008, if the financial system did break and didn’t recover, and if faith were lost in the current monetary structure of the world, there is a state of the world where gold may become a monetary reserve again in which case its clearing price may be very high and it may essentially become a cash equivalent.
At that point, we might sell it to buy businesses at truly bargain levels. If we look back over the last 30 years we’ve had many episodes of financial volatility, but the system hasn’t totally broken. So the potential hedge has remained in place and will do so until such time when it is truly not required or when we feel 4 we are paying too much for that potential hedge relative to history. The best way to think about the cash is that we don’t try to time markets.
We are not top-down in trying to predict the zigs and zags of the market. We view cash as deferred purchasing power. We have, as Kimball alluded to, a very disciplined bottom-up approach where we only want to move out of cash and cash equivalents into the ownership of businesses that we believe are conservatively valued, conservatively capitalized and conservatively run.
When we can’t find those opportunities, and that often tends to be in environments where market valuations are high, we wait. Indeed, we tend to be trimming stocks that have done well and that makes the cash build further. On the other hand, when the markets are in distress, such as in late 2008 or early 2009, we see a relative abundance of opportunities to put the cash to work in what we feel are conservatively valued securities, and therefore the cash gets invested in a countercyclical manner. If you look at the peaks and troughs of our cash positions, you see that they peaked in 2007 at around 20%, and it troughed in the single-digit percentages in the first quarter of 2009. Cash peaked again around a year or so ago when the environment opportunity wasn’t rich, as Kimball referred to, by virtue of a fairly broad bull market across many securities. What has happened in the last 12 months, and particularly in the periodic dips, is that we have found some opportunities to invest the cash.
So while the markets have gone sideways to slightly down, beneath the surface, the market has narrowed dramatically. In fact, if you look at the U.S., more than 80% of securities are below . their 200-day moving averages. That implies that less than 20% are moving higher relative to their 200-day moving averages. The market has been more and more concentrated in highly valued securities that incorporate high expectations about growth—the Facebooks and Amazons2 of the world. As the market has narrowed, that has produced some opportunity for us in these stocks that have not fared so well and trade at what we consider to be depressed valuation levels. In addition, markets have traded off their peaks. There is some risk perception.
We see oil prices at generational lows relative to the cost of extraction. We see the rest of the commodities com- Bob: We have clearly been in a cycle where growth has outperformed value. Do you have any expectation for when the value cycle will kick in? Are there any benchmarks, events or indices that you are observing that would make your timeframe estimates more precise? Matt: Our crystal ball is foggy here too.
It’s very hard to call when growth and value perform well. This cycle reminds me a little of the late 1990s where a smaller and smaller number of hightech growth companies achieved stratospheric valuations, whereas some of the old economy became very cheap. Ironically when the markets corrected, the old-economy stocks generally held up pretty about the cash that “ The best way to think markets.
We areisnot we don’t try to time top-down in trying to predict the zigs and zags of the market. plex and many of the industrial companies being pretty weak. We see some instances of higher spreads in the bond market. If we look at other measures of risk perception, such as implied volatility for hedging the S&P, it has gone from below average to above average. The recessionary conditions in the old economy— the manufacturing economy— and the commodities complex have produced some opportunities. But the market is by no means as distressed as we saw in late 2008 and early 2009.
So our cash level sits firmly between the peaks and troughs of the last seven or eight years at around a mid-teens percentage. ” well in absolute terms while many tech stocks collapsed. When growth outperforms for a sustained period of time the market narrows because you have fewer and fewer companies getting to higher and higher valuations, meeting elevated levels of expectation. One at a time they eventually start to disappoint. We have seen market darlings from a couple of years ago weaken substantially on the back of disappointing earnings relative to elevated growth expectations. On the other hand, if you look at the value universe, these are typically businesses that incorporate much more modest expectations about future growth.
They tend to be more mature businesses and sometimes more exposed to the business cycle. When market fears rise, as they have with China slowing down, some of these businesses de-rate and are priced to reflect a more cyclically challenging environment. That was again the case in the late 1990s. Ironically, what turned things around was a combination of growth rates disappointing in the more elevated areas of the market. When the cyclical fears turned into an actual reality – a recessionary reality—you saw a fiscal and monetary policy easing.
Those who traded the more mature stocks started to look forward at that moment to better times ahead, and value generally outperformed growth quite a bit. We don’t know what is going to happen at this time, but my guess is if we saw dramatic policy easing in China or if the Fed in response to weaker markets and weaker corporate profits does not raise interest rates as much as expected, that could set a more benign backdrop for some of the lower expectation securities in the marketplace today. But we just don’t know. Bob: Turning overseas, what are the economic and market implications of the drawdown in China’s foreign-exchange reserves, and how is that affecting your investment decisions? Matt: This links into our prior discussion on the growth of manufacturing in China and the deflationary forces in the world more broadly, and the savings investment imbalances in the US. Basically, China The top 10 largest contributors to performance for the S&P 500 Index for the year ending 12/31/2015 were Amazon, Microsoft, General Electric, Alphabet, Facebook, Home Depot, Starbucks, Netflix, McDonald’s and Visa. 2 5 . grew dramatically through much of the last 15 or 20 years by having an exchange rate that was essentially undervalued relative to its equilibrium level. That helped its manufacturing sector become very competitive on the global stage and they grew their export businesses dramatically. Over the last four or five years China’s exchange rate, until recently, was modestly appreciating and they had much more growth in wages than prices. So in real effective terms, the Chinese exchange rate went from being at a discount to intrinsic value to a premium. As that has occurred, somewhat predictably, its manufacturing sector has started to slow down.
That is in addition to the unwinding of a construction boom and the secular headwinds we talked about—factory automation and the impact of that on related markets. As that has occurred, the Chinese have started to resort again to weakening their currency to try to stimulate a little bit more growth to halt the slowdown in their economy. While it was going through that prior phase, it kept its exchange rate depressed by accumulating foreign reserves. It was essentially selling its local currency and buying dollars.
That was akin to increasing the money supply in China and it increased the money supply to the world. Now that that is going into reverse, the Chinese are using their reserves to slow the decline in their exchange rate to try and manage it at a modest rate of decline. That is almost like a reverse QE for the world. To the extent that China was the epicenter of global monetary creation, it is starting to reverse and slow at the margin through the sale of its reserves.
That and the end to U.S. QE has had some impact on weakening commodity prices and things that are sensitive to the money supply. We have not seen the full ramifications yet. Chinese money supply measures, such as M2, are still greater than U.S.
money supply expressed in USD terms. Chinese currency has not depreciated enough for us to say it is outright undervalued versus other currencies. We could be stuck with these more complicated monetary trends for a while. Bob: You have a substantial allocation of assets in Japan.
Have you hedged the currency risk there, and if not, why not? And more broadly, many have argued for the ongoing strength of the dollar in large part because of its status as the reserve currency. How has that view affected your overall approach to currency hedging? Kimball: We do hedge, although when we think about hedging currencies, we think about the hedge through a prism of our sense of the fundamental values of the currencies. We have some very fundamental analytical approaches to thinking about currency valuation that range from longer-term purchasing-power-parity models to analysis around exchange rates that would be necessary to bring current-account balances into equilibrium. We do think carefully about the values of these currencies relative to the dollar. As the yen has weakened, our sense is that its value has gotten cheaper relative to the dollar and we have let our hedge on the yen roll down and effectively we are not hedged on it.
Now that could change if our sense of the value of the yen changes. We have a small hedge on the euro, but it 6 has also rolled down over the last two or three years. Bob: Coming back to the US now, are you finding value anywhere in the energy sector? Kimball: Not surprisingly, as oil has drifted down from $100 a barrel to $30 a barrel, it’s been an area of research focus for us. We have seen some opportunities.
The opportunities have been less pronounced in traditional exploration companies. Where we have found opportunities to be is in companies like Flowserve, which Matt mentioned and is a fluid-control business. They make pumps and valves. The stock is down as a result of some aftermarket, or end-market exposure to the energy sector, but it has what we believe is very clean balance sheet.
It has other businesses. It has an aftermarket business that we think gives it persistency as a business. We think it is very well-managed. The capital that we have allocated that’s been connected to the energy sector has not been in the traditional exploration companies. It has more been in service businesses that provide equipment, or manufacture equipment for that sector. Bob: The size of your fund has grown considerably.
It is now a little over $45 billion. How are you avoiding the problems of asset bloat? Are you still able to efficiently and effectively invest in small-cap stocks for which the fund has been noted? Kimball: We are all very focused on seeking to deliver the return and the risk level investors expect and we are mindful of the capacity of our fund. At the size we are at now, very, very small cap or micro-cap companies are going to .
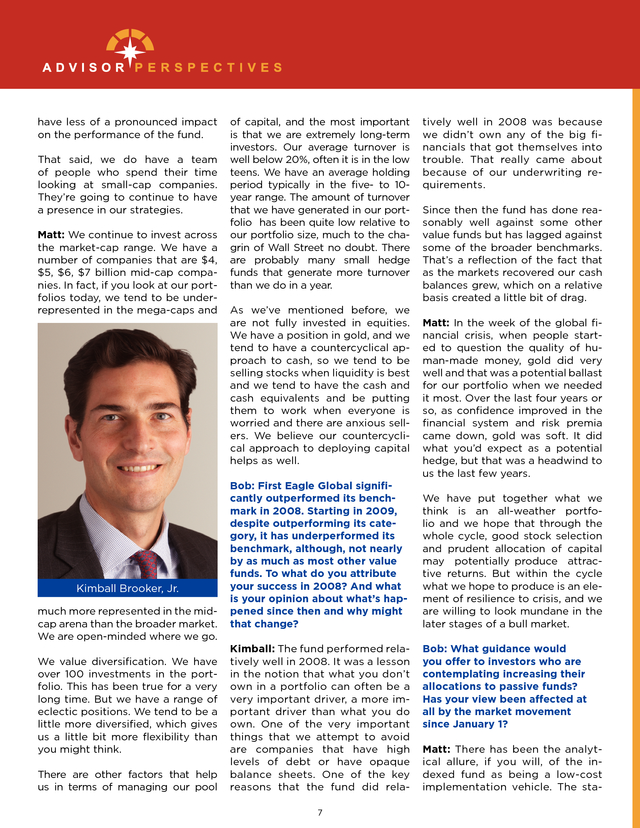
have less of a pronounced impact on the performance of the fund. That said, we do have a team of people who spend their time looking at small-cap companies. They’re going to continue to have a presence in our strategies. Matt: We continue to invest across the market-cap range. We have a number of companies that are $4, $5, $6, $7 billion mid-cap companies. In fact, if you look at our portfolios today, we tend to be underrepresented in the mega-caps and Kimball Brooker, Jr. much more represented in the midcap arena than the broader market. We are open-minded where we go. We value diversification. We have over 100 investments in the portfolio.
This has been true for a very long time. But we have a range of eclectic positions. We tend to be a little more diversified, which gives us a little bit more flexibility than you might think. There are other factors that help us in terms of managing our pool of capital, and the most important is that we are extremely long-term investors.
Our average turnover is well below 20%, often it is in the low teens. We have an average holding period typically in the five- to 10year range. The amount of turnover that we have generated in our portfolio has been quite low relative to our portfolio size, much to the chagrin of Wall Street no doubt.
There are probably many small hedge funds that generate more turnover than we do in a year. As we’ve mentioned before, we are not fully invested in equities. We have a position in gold, and we tend to have a countercyclical approach to cash, so we tend to be selling stocks when liquidity is best and we tend to have the cash and cash equivalents and be putting them to work when everyone is worried and there are anxious sellers. We believe our countercyclical approach to deploying capital helps as well. Bob: First Eagle Global significantly outperformed its benchmark in 2008. Starting in 2009, despite outperforming its category, it has underperformed its benchmark, although, not nearly by as much as most other value funds.
To what do you attribute your success in 2008? And what is your opinion about what’s happened since then and why might that change? Kimball: The fund performed relatively well in 2008. It was a lesson in the notion that what you don’t own in a portfolio can often be a very important driver, a more important driver than what you do own. One of the very important things that we attempt to avoid are companies that have high levels of debt or have opaque balance sheets.
One of the key reasons that the fund did rela7 tively well in 2008 was because we didn’t own any of the big financials that got themselves into trouble. That really came about because of our underwriting requirements. Since then the fund has done reasonably well against some other value funds but has lagged against some of the broader benchmarks. That’s a reflection of the fact that as the markets recovered our cash balances grew, which on a relative basis created a little bit of drag. Matt: In the week of the global financial crisis, when people started to question the quality of human-made money, gold did very well and that was a potential ballast for our portfolio when we needed it most. Over the last four years or so, as confidence improved in the financial system and risk premia came down, gold was soft.
It did what you’d expect as a potential hedge, but that was a headwind to us the last few years. We have put together what we think is an all-weather portfolio and we hope that through the whole cycle, good stock selection and prudent allocation of capital may potentially produce attractive returns. But within the cycle what we hope to produce is an element of resilience to crisis, and we are willing to look mundane in the later stages of a bull market. Bob: What guidance would you offer to investors who are contemplating increasing their allocations to passive funds? Has your view been affected at all by the market movement since January 1? Matt: There has been the analytical allure, if you will, of the indexed fund as being a low-cost implementation vehicle. The sta- .
tistics are often touted about the majority of active managers underperforming. That has understandably attracted a fair amount of capital, and it is likely to attract more capital at the peak of a bull market where just being long the market may be one of the best things that you can do. However, as we stand back from the recent trends and we think about the structure of markets, as advisors think about passive versus active, one thing we know for sure is that 100% of the market cannot be passive. You can’t have an entire market being willfully ignorant of the underlying valuation, balance sheet and management risk that’s being invested in. We think there’s always going to be a role for active investing. One of the problems of passive investing is that it encourages the willful ignorance of underlying fundamentals and valuation. It also implicitly encourages growth-based thematic investing. Over the last 30-odd years of financial market history, during the biggest bubbles of our generation there have been the big growth themes of the day—Japan in the late 1980s, tech in the late 1990s, financials in the mid-2000s, and even more recently the whole BRICs story.
The existence of index funds enabled a lot of capital to flow into these trends that was not discriminating about the un- derlying securities that were being purchased in those markets. The reason most active managers underperform, other than charging relatively higher fees, is that they try to structure their portfolios for prescience or at least the promise of prescience. They try to zig or zag around market trends. They try to identify the next great growth themes. We’ve seen how that has failed historically.
They look for companies that they think will beat the quarter but there is a huge amount of competition to identify short-term surprises. Many active managers are playing in areas that are simply too competitive, or trying to do things that can’t be done such as predicting the future with precision. We acknowledge our crystal ball is foggy at best. But there is a role for thoughtful active managers who are focused on seeking to protect capital over the long term through risk mitigation.
We don’t see risk as tracking error to a benchmark, but rather as avoiding the permanent loss of capital. If you think about our multi-decade track record at First Eagle, the key has often been what we’ve decided not to own, like Japan in the late 1980s; it was the biggest component of the MSCI world index, as was tech in the U.S. index in the late 1990s, but we chose not 8 to go there. The BRICs attracted huge amounts of capital and enthusiastic investing, and we’ve been very cautious because we couldn’t find securities bottom-up to invest there the last few years. By adopting a value-oriented approach, we only leave cash to buy securities that we believe are conservatively valued, conservatively capitalized and conservatively run.
This has really helped us avoid the permanent capital impairment when Japan, tech, the financials, and the BRICS imploded in the past. People pay us to be prudent capital allocators and to only get fully invested when bargains can be had. If this approach to active investing has worked over the long term, why don’t more people do it? Well, number one, it is not comfortable to be investing in a countercyclical fashion, committing capital when markets are in distress, or sitting with cash when markets are rallying to new highs. What we do has a decade-long cycle. Most investors are too impatient to mimic this. There is always going to be a role for thoughtful active investing.
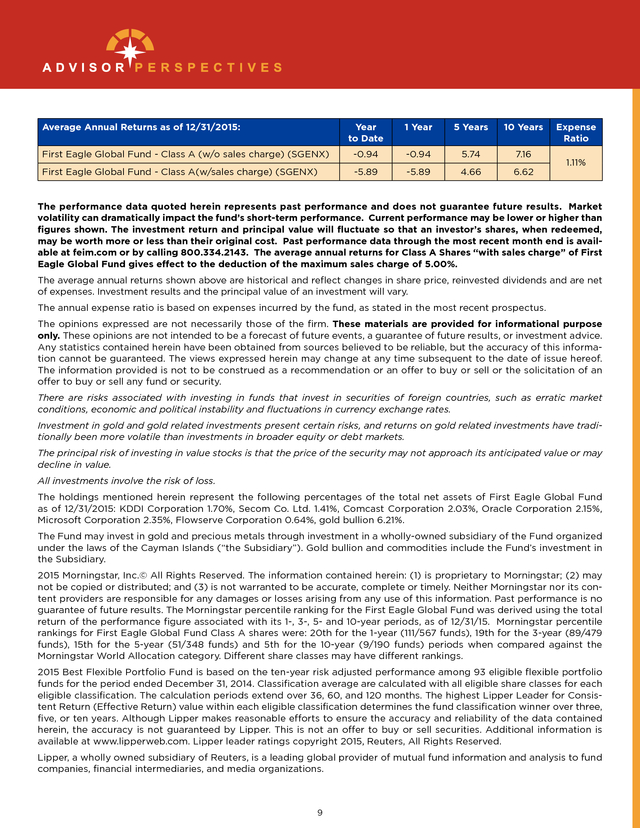
We believe that the market is structurally short patience, and that creates the opportunity for active investors who are patient long-term investors focused on preventing the permanent impairment of capital. . Average Annual Returns as of 12/31/2015: Year to Date 1 Year 5 Years 10 Years First Eagle Global Fund - Class A (w/o sales charge) (SGENX) -0.94 -0.94 5.74 7.16 First Eagle Global Fund - Class A(w/sales charge) (SGENX) -5.89 -5.89 4.66 6.62 Expense Ratio 1.11% The performance data quoted herein represents past performance and does not guarantee future results. Market volatility can dramatically impact the fund’s short-term performance. Current performance may be lower or higher than figures shown. The investment return and principal value will fluctuate so that an investor’s shares, when redeemed, may be worth more or less than their original cost.
Past performance data through the most recent month end is available at feim.com or by calling 800.334.2143. The average annual returns for Class A Shares “with sales charge” of First Eagle Global Fund gives effect to the deduction of the maximum sales charge of 5.00%. The average annual returns shown above are historical and reflect changes in share price, reinvested dividends and are net of expenses. Investment results and the principal value of an investment will vary. The annual expense ratio is based on expenses incurred by the fund, as stated in the most recent prospectus. The opinions expressed are not necessarily those of the firm.
These materials are provided for informational purpose only. These opinions are not intended to be a forecast of future events, a guarantee of future results, or investment advice. Any statistics contained herein have been obtained from sources believed to be reliable, but the accuracy of this information cannot be guaranteed. The views expressed herein may change at any time subsequent to the date of issue hereof. The information provided is not to be construed as a recommendation or an offer to buy or sell or the solicitation of an offer to buy or sell any fund or security. There are risks associated with investing in funds that invest in securities of foreign countries, such as erratic market conditions, economic and political instability and fluctuations in currency exchange rates. Investment in gold and gold related investments present certain risks, and returns on gold related investments have traditionally been more volatile than investments in broader equity or debt markets. The principal risk of investing in value stocks is that the price of the security may not approach its anticipated value or may decline in value. All investments involve the risk of loss. The holdings mentioned herein represent the following percentages of the total net assets of First Eagle Global Fund as of 12/31/2015: KDDI Corporation 1.70%, Secom Co.
Ltd. 1.41%, Comcast Corporation 2.03%, Oracle Corporation 2.15%, Microsoft Corporation 2.35%, Flowserve Corporation 0.64%, gold bullion 6.21%. The Fund may invest in gold and precious metals through investment in a wholly-owned subsidiary of the Fund organized under the laws of the Cayman Islands (“the Subsidiary”). Gold bullion and commodities include the Fund’s investment in the Subsidiary. 2015 Morningstar, Inc.© All Rights Reserved.
The information contained herein: (1) is proprietary to Morningstar; (2) may not be copied or distributed; and (3) is not warranted to be accurate, complete or timely. Neither Morningstar nor its content providers are responsible for any damages or losses arising from any use of this information. Past performance is no guarantee of future results.
The Morningstar percentile ranking for the First Eagle Global Fund was derived using the total return of the performance figure associated with its 1-, 3-, 5- and 10-year periods, as of 12/31/15. Morningstar percentile rankings for First Eagle Global Fund Class A shares were: 20th for the 1-year (111/567 funds), 19th for the 3-year (89/479 funds), 15th for the 5-year (51/348 funds) and 5th for the 10-year (9/190 funds) periods when compared against the Morningstar World Allocation category. Different share classes may have different rankings. 2015 Best Flexible Portfolio Fund is based on the ten-year risk adjusted performance among 93 eligible flexible portfolio funds for the period ended December 31, 2014.
Classification average are calculated with all eligible share classes for each eligible classification. The calculation periods extend over 36, 60, and 120 months. The highest Lipper Leader for Consistent Return (Effective Return) value within each eligible classification determines the fund classification winner over three, five, or ten years.
Although Lipper makes reasonable efforts to ensure the accuracy and reliability of the data contained herein, the accuracy is not guaranteed by Lipper. This is not an offer to buy or sell securities. Additional information is available at www.lipperweb.com.
Lipper leader ratings copyright 2015, Reuters, All Rights Reserved. Lipper, a wholly owned subsidiary of Reuters, is a leading global provider of mutual fund information and analysis to fund companies, financial intermediaries, and media organizations. 9 . Reference to a ranking, a rating or an award does not provide any guarantee of future performance, and is subject to change over time. The information is not intended to provide and should not be relied on for accounting or tax advice. Any tax information presented is not intended to constitute an analysis of all tax considerations. Investors should consider investment objectives, risks, charges and expenses carefully before investing. The prospectus and summary prospectus contain this and other information about the Funds and may be obtained by asking your financial adviser, visiting our website at feim.com or calling us at 800.334.2143. Please read our prospectus carefully before investing.
For further information about the First Eagle Funds, please call 800.334.2143. The First Eagle Funds are offered by FEF Distributors, LLC, 1345 Avenue of the Americas, New York, New York 10105. © 2016, Advisor Perspectives, Inc. All rights reserved 10 .
Its managers are Matthew B. McLennan and Kimball Brooker, Jr. Advisor Perspectives Editor in Chief Robert Huebscher spoke with Matt and Kimball on January 14. Bob: In a panel discussion back in June, Bruce Greenwald, who is a senior advisor to your firm, made a number of assertions. I am going to ask you about each of them and how your portfolio is structured to potentially benefit from them.
The first one is that manufacturing is dying and that is creating chronic deflationary pressure. Matt: Bruce was making the simple point that factory automation is reducing the need for labor in manufacturing. When he said manufacturing was dying, he wasn’t intimating that we are producing less things, just that it is taking less labor to produce those things. The analogy I draw here is if you went back in time a century or so ago, many people were employed in some form of agriculture.
Today it is a low single-digit percentage of the economy, but we are still eating well, perhaps too well. Jobs moved from the agricultural sector to manufacturing sector throughout the course of the early part of the last century. Of course, during the last jobs moving out of manufacturing into services.
It takes time to retrain people. That has produced a persistent tendency for countries in that region to try and devalue their currency versus the dollar, which in turn has produced a structural current-account deficit in the United States. The quest for is a “ Factory automationfund.very powerfulthat source of ideas for our We’ve seen in the proliferation of robotics, pneumatic systems, electrical sensors and the like. ” generation, it has moved progressively to the services sector. Factory automation is a very powerful source of ideas for our fund. We’ve seen that in the proliferation of robotics, pneumatic systems, electrical sensors and the like.
In fact, if you look at our portfolios, we have benefited from this trend through the ownership of some of the leading franchises in this area. The decline of employment in manufacturing is having a second-order effect on global systemic imbalances. Part of that is driven by the fact that many of the Asian economies have built their economic miracles on manufacturing models fueled in large part by subsidized exchange rates. As they’ve grown rapidly through manufacturing and moved a lot of people from poverty into employment in manufacturing, they prospectively face the headwind of growth through manufacturing in Asia is fueling a savings shortfall in the United States. But the essential point is that factory automation is really taking root.
Initially it was robotics for cutting and welding tools and for basic things like painting. But as sensing technologies improved, and software and robotics capabilities improved, there is the prospect of automation creeping into the assembly stage of manufacturing where most of the jobs are. This trend is going to be with us for quite some time; we are still in the early days of those pressures. Having said that, looking forward a generation from today, I believe it may take a lot fewer people to produce what we are producing now, which should free up resources for other productive enterprises. It just won’t necessarily be a smooth journey, particularly for those economies that have built Performance for periods prior to January 1, 2000 occurred while a prior portfolio manager of the fund was affiliated with another firm.
Inception date shown is when this prior portfolio manager assumed portfolio management responsibilities. 1 1 . their economic strength on manufacturing. Bob: The second trend is that service businesses are local in nature and therefore may grow to be able to earn attractive rates of return. Matt: I made the observation that employment is moving from manufacturing to services. When people think of services, often what comes to mind are very simple things like teaching, public relations, child care, private event management, restaurants, local IT services and the like. But those are not necessarily the kinds of businesses that generate attractive returns, because they are competitive. When we think about service businesses that have the ability to generate attractive returns on capital, we are very focused on businesses that have local economies of scale. Those businesses are orders of magnitude larger than their nearest competitors, which makes it more difficult for new entrants to come into a market. We also focus on service businesses where there is a high degree of customer captivity, or stickiness, because it increases the cost of a new entrant coming into those markets. We have a range of investments both overseas and in the United States in areas such as telecommunications, such as KDDI, a scaled provider of mobile and broadband connectivity in Japan, and Secom, also in Japan, which dominates in the commercial services arena for providing alarm, security services for corporations and homes.
In the United States, we own Comcast, which dominates bandwidth provisioning essentially in the markets in which it competes. We own some of the big tech majors, like Oracle and Microsoft; even though they are global in nature, their dominance is local and rooted in sales force density and customer standardization. When we look at businesses we try to identify those that have local economies of scale and sticky customers. Many of these businesses are not traditional manufacturing businesses. You may have elements of their business that don’t require tangible capital investment, but rather where things like brand and process knowhow matter.
These businesses can potentially generate very attractive returns on their tangible capital. Even in the world of what you would traditionally think of as industrials and manufacturing, local market dominance matters. Think of a company like Flowserve in pumps, valves, and seals. Even though you wouldn’t think of them as services, they have material aftermarket businesses that require density of distribution and dealerships, with aftermarket servicing capability that enable them to potentially get attractive returns on their capital. Bob: The third trend is that the lower 85% of households in terms of wealth have a negative savings rate, and it’s the remaining 15% who are accumulating.
That’s a catastrophe waiting to happen because so many households have a negative savings rate. Matt: What Bruce was referring to is the fact that if you look at the overall savings rates, it has drifted up from the low levels of the mid-2000s to just above 5%. The debt-service ratios seem to have improved. But when you look beneath the surface, debt-service ratios look attractive because interest rates have been repressed. The actual level of debt-to-income remains fairly high. Secondly, even though savings 2 rates are above 5%, the top 15% of households probably save close to 40% of their income.
All the savings is coming from the top 15% of households, which implies the bottom 85% of households are net dis-saving. This is a problem because it leads to recurring balance sheet vulnerability in the economy. If you go back to the discussion that we had earlier about the growth of manufacturing in the Asian economies through subsidized exchange rates and the flow-on effects of that to current-account deficits in the U.S., a current-account deficit Matthew B. McLennan simply means that we have a structural shortage of savings relative to investment in our economy.
It is showing up in the lower income households of the United States. We are seeing that household savings and corporate profits have done okay when the government runs fiscal deficits that are larger than the current-account deficit. That means there is a surplus in the private sector. That can work for a short while, but if you consistently . try to run fiscal deficits larger than your current-account deficit in order to promote corporate profit and household savings, you are also going to impair the sovereign balance sheet of the United States. The U.S. ends up with an unfavorable government debt-to-GDP ratio and lower real returns on its government debt as policymakers resort to interest-rate repression in an effort to improve debt-servicing capabilities. Lower real returns exacerbate the problem because if people aren’t saving enough already and they are prospectively getting a lower real return on their savings, they need to save even more in the future. You get this negative feedback loop. That is the struggle that we are dealing with here from a global standpoint. Bob: Gold bullion is your largest position.
Do you own physical gold and why do you own gold if you believe in the scenario of chronic deflation? Matt: We are not intelligent enough to know if we’re going to have chronic deflation or inflation. The crystal ball is foggy at best. We believe the stock of debt in the world is too high. If you look at the aggregate stock of debt—household, plus corporate, plus sovereign debt—and you compare that to GDP it is actually higher than it was in 2007. That is a headwind to inflation.
Creating new money supply through new debt is going to be more challenging. You referred to gold as our largest position, but perhaps that’s not the best way to think about it. The reality is our largest exposure is to the ownership of business. If you look at our key portfolios, over 75% is invested in the ownership of business in one form or another where we try to identify good businesses at good prices.
That means we are very exposed to systemic risk. Our goal at First Eagle has always been to have an all-weather portfolio, one that can endure difficult times. If we think there is too much debt in the world, there are going to be episodic windows of crisis. We want a potential hedge in our Woods agreement. You can intuitively understand why gold may be a good potential hedge against inflation.
If the supply of gold is flat per capita, but the money supply goes up, the equilibrium price of gold ought to go up. Incidentally, when we have inflation it tends to be bad for equities and bonds as well, so gold does have an obvious supply of gold is relative “ Theother commoditiesvery stablevirtually to because all of the gold ever produced still exists above ground. ” portfolio. We view gold as the best potential hedge that we can find. role for us as a potential hedge in an inflationary world. Why is that? It’s pretty simple.
Gold is not that useful as a commodity and its lack of utility as a commodity is actually its usefulness as nature’s alternative to currency. Other commodities such as oil, copper or iron ore are useful real assets that don’t tend to be the best hedge. When things go bad, demand for those commodities generally goes down and their price has historically gone down as we have actually seen the last few years. You posed the alternative question which is, why do you own it if you feel that there is deflationary risk due to excessive debt in the system? My answer to that is that there is no popular appetite—be it in a dictatorship or a democracy— for deflation.
When conditions are deflationary, governments tend to do what it takes to avoid deflation, which typically means running easy fiscal policy with large deficits and very easy monetary policy. That leads over time to bloated levels of government debt. If we look across the world today, there are generationally high levels of government debt relative to GDP and financial repression. Gold, on the other hand, has a price that has very little correlation to the business or the market cycles. In the world of real assets there is very little to own that is less sensitive to the markets than gold.
That is the element of resilience that appeals to us. The supply of gold is very stable relative to other commodities because virtually all of the gold ever produced still exists above ground. When we look at the total stock of gold above ground it’s actually been pretty flat on a per-capita basis for the last 40 years, since the breakdown of the Bretton 3 The rub against gold has always been that it doesn’t offer an interest rate, but really, nor does sovereign debt today as we look around the world. The credit worthiness of sovereign debt has gone down. Gold becomes a more feasible monetary alternative in a world of deflation because the quality of human-made money goes down through fiscal deficits and financial repression. .
Bob: We wrote about research by Michael Mauboussin that examined why so many active managers under performed in 2014. His assertion was that this was due to a lack of opportunities, not a lack of skill. What is your take on his research? How has this factored into the level of cash that you’ve held in your funds? Kimball: The research piece is interesting, and we would certainly agree with the assertion that until recently there have been limited opportunities in the market. But we have a slightly different take on and extension of Mauboussin’s thinking.
One of the things that he did was look back and examine the dispersion of stock returns in 2014 and concluded that it was very, very low, and there was a lower likelihood for active managers to generate excess returns. Incidentally, we think that the dispersion of returns was also very low in 2013 and 2012. He was looking retrospectively to try to explain why active managers were underperforming on a relative basis to their indices. We think about the world a little bit differently in terms of what led to a limited set of opportunities. Our core investment process is very much about buying securities at a discount to our sense of intrinsic value.
What we had seen in the years that Mauboussin had covered in the study was elevated valuations in most of the developed world and a very low dispersion of valuations across different regions and different sectors. That was really the root of the difficulty in finding opportunities to invest. Bob: You tend to build cash positions in bull markets when valuations are very rich and deploy it as the market drops. Thinking back about the days of Jean Marie Eveillard and other past periods when markets were high, how do your cash positions look today? Moreover, you have around 10% in gold and gold-denominated securities, as we discussed. Is this position different from the past and is it going to limit your ability to take advantage of declining valuations? Matt: Let me just start on the gold. For long time we have had approximately 10% in a combination of gold bullion and gold securities. Our logic has been simple.
We view it as a potential hedge. If the combined position were less than 5%, it wouldn’t be material enough to provide a potential hedge to the overall portfolio. On the other hand, we felt a combined position in the 15% to 20% range of our portfolio would start to become more directionally exposed to gold.
There is a common-sense sizing of our gold position. At around about 10%, it’s big enough to be a material potential hedge but not so big that the performance of the portfolio depends upon the gold price. There could be a state of the world where we don’t own gold. If we had a counter-narrative of the crisis in 2008, if the financial system did break and didn’t recover, and if faith were lost in the current monetary structure of the world, there is a state of the world where gold may become a monetary reserve again in which case its clearing price may be very high and it may essentially become a cash equivalent.
At that point, we might sell it to buy businesses at truly bargain levels. If we look back over the last 30 years we’ve had many episodes of financial volatility, but the system hasn’t totally broken. So the potential hedge has remained in place and will do so until such time when it is truly not required or when we feel 4 we are paying too much for that potential hedge relative to history. The best way to think about the cash is that we don’t try to time markets.
We are not top-down in trying to predict the zigs and zags of the market. We view cash as deferred purchasing power. We have, as Kimball alluded to, a very disciplined bottom-up approach where we only want to move out of cash and cash equivalents into the ownership of businesses that we believe are conservatively valued, conservatively capitalized and conservatively run.
When we can’t find those opportunities, and that often tends to be in environments where market valuations are high, we wait. Indeed, we tend to be trimming stocks that have done well and that makes the cash build further. On the other hand, when the markets are in distress, such as in late 2008 or early 2009, we see a relative abundance of opportunities to put the cash to work in what we feel are conservatively valued securities, and therefore the cash gets invested in a countercyclical manner. If you look at the peaks and troughs of our cash positions, you see that they peaked in 2007 at around 20%, and it troughed in the single-digit percentages in the first quarter of 2009. Cash peaked again around a year or so ago when the environment opportunity wasn’t rich, as Kimball referred to, by virtue of a fairly broad bull market across many securities. What has happened in the last 12 months, and particularly in the periodic dips, is that we have found some opportunities to invest the cash.
So while the markets have gone sideways to slightly down, beneath the surface, the market has narrowed dramatically. In fact, if you look at the U.S., more than 80% of securities are below . their 200-day moving averages. That implies that less than 20% are moving higher relative to their 200-day moving averages. The market has been more and more concentrated in highly valued securities that incorporate high expectations about growth—the Facebooks and Amazons2 of the world. As the market has narrowed, that has produced some opportunity for us in these stocks that have not fared so well and trade at what we consider to be depressed valuation levels. In addition, markets have traded off their peaks. There is some risk perception.
We see oil prices at generational lows relative to the cost of extraction. We see the rest of the commodities com- Bob: We have clearly been in a cycle where growth has outperformed value. Do you have any expectation for when the value cycle will kick in? Are there any benchmarks, events or indices that you are observing that would make your timeframe estimates more precise? Matt: Our crystal ball is foggy here too.
It’s very hard to call when growth and value perform well. This cycle reminds me a little of the late 1990s where a smaller and smaller number of hightech growth companies achieved stratospheric valuations, whereas some of the old economy became very cheap. Ironically when the markets corrected, the old-economy stocks generally held up pretty about the cash that “ The best way to think markets.
We areisnot we don’t try to time top-down in trying to predict the zigs and zags of the market. plex and many of the industrial companies being pretty weak. We see some instances of higher spreads in the bond market. If we look at other measures of risk perception, such as implied volatility for hedging the S&P, it has gone from below average to above average. The recessionary conditions in the old economy— the manufacturing economy— and the commodities complex have produced some opportunities. But the market is by no means as distressed as we saw in late 2008 and early 2009.
So our cash level sits firmly between the peaks and troughs of the last seven or eight years at around a mid-teens percentage. ” well in absolute terms while many tech stocks collapsed. When growth outperforms for a sustained period of time the market narrows because you have fewer and fewer companies getting to higher and higher valuations, meeting elevated levels of expectation. One at a time they eventually start to disappoint. We have seen market darlings from a couple of years ago weaken substantially on the back of disappointing earnings relative to elevated growth expectations. On the other hand, if you look at the value universe, these are typically businesses that incorporate much more modest expectations about future growth.
They tend to be more mature businesses and sometimes more exposed to the business cycle. When market fears rise, as they have with China slowing down, some of these businesses de-rate and are priced to reflect a more cyclically challenging environment. That was again the case in the late 1990s. Ironically, what turned things around was a combination of growth rates disappointing in the more elevated areas of the market. When the cyclical fears turned into an actual reality – a recessionary reality—you saw a fiscal and monetary policy easing.
Those who traded the more mature stocks started to look forward at that moment to better times ahead, and value generally outperformed growth quite a bit. We don’t know what is going to happen at this time, but my guess is if we saw dramatic policy easing in China or if the Fed in response to weaker markets and weaker corporate profits does not raise interest rates as much as expected, that could set a more benign backdrop for some of the lower expectation securities in the marketplace today. But we just don’t know. Bob: Turning overseas, what are the economic and market implications of the drawdown in China’s foreign-exchange reserves, and how is that affecting your investment decisions? Matt: This links into our prior discussion on the growth of manufacturing in China and the deflationary forces in the world more broadly, and the savings investment imbalances in the US. Basically, China The top 10 largest contributors to performance for the S&P 500 Index for the year ending 12/31/2015 were Amazon, Microsoft, General Electric, Alphabet, Facebook, Home Depot, Starbucks, Netflix, McDonald’s and Visa. 2 5 . grew dramatically through much of the last 15 or 20 years by having an exchange rate that was essentially undervalued relative to its equilibrium level. That helped its manufacturing sector become very competitive on the global stage and they grew their export businesses dramatically. Over the last four or five years China’s exchange rate, until recently, was modestly appreciating and they had much more growth in wages than prices. So in real effective terms, the Chinese exchange rate went from being at a discount to intrinsic value to a premium. As that has occurred, somewhat predictably, its manufacturing sector has started to slow down.
That is in addition to the unwinding of a construction boom and the secular headwinds we talked about—factory automation and the impact of that on related markets. As that has occurred, the Chinese have started to resort again to weakening their currency to try to stimulate a little bit more growth to halt the slowdown in their economy. While it was going through that prior phase, it kept its exchange rate depressed by accumulating foreign reserves. It was essentially selling its local currency and buying dollars.
That was akin to increasing the money supply in China and it increased the money supply to the world. Now that that is going into reverse, the Chinese are using their reserves to slow the decline in their exchange rate to try and manage it at a modest rate of decline. That is almost like a reverse QE for the world. To the extent that China was the epicenter of global monetary creation, it is starting to reverse and slow at the margin through the sale of its reserves.
That and the end to U.S. QE has had some impact on weakening commodity prices and things that are sensitive to the money supply. We have not seen the full ramifications yet. Chinese money supply measures, such as M2, are still greater than U.S.
money supply expressed in USD terms. Chinese currency has not depreciated enough for us to say it is outright undervalued versus other currencies. We could be stuck with these more complicated monetary trends for a while. Bob: You have a substantial allocation of assets in Japan.
Have you hedged the currency risk there, and if not, why not? And more broadly, many have argued for the ongoing strength of the dollar in large part because of its status as the reserve currency. How has that view affected your overall approach to currency hedging? Kimball: We do hedge, although when we think about hedging currencies, we think about the hedge through a prism of our sense of the fundamental values of the currencies. We have some very fundamental analytical approaches to thinking about currency valuation that range from longer-term purchasing-power-parity models to analysis around exchange rates that would be necessary to bring current-account balances into equilibrium. We do think carefully about the values of these currencies relative to the dollar. As the yen has weakened, our sense is that its value has gotten cheaper relative to the dollar and we have let our hedge on the yen roll down and effectively we are not hedged on it.
Now that could change if our sense of the value of the yen changes. We have a small hedge on the euro, but it 6 has also rolled down over the last two or three years. Bob: Coming back to the US now, are you finding value anywhere in the energy sector? Kimball: Not surprisingly, as oil has drifted down from $100 a barrel to $30 a barrel, it’s been an area of research focus for us. We have seen some opportunities.
The opportunities have been less pronounced in traditional exploration companies. Where we have found opportunities to be is in companies like Flowserve, which Matt mentioned and is a fluid-control business. They make pumps and valves. The stock is down as a result of some aftermarket, or end-market exposure to the energy sector, but it has what we believe is very clean balance sheet.
It has other businesses. It has an aftermarket business that we think gives it persistency as a business. We think it is very well-managed. The capital that we have allocated that’s been connected to the energy sector has not been in the traditional exploration companies. It has more been in service businesses that provide equipment, or manufacture equipment for that sector. Bob: The size of your fund has grown considerably.
It is now a little over $45 billion. How are you avoiding the problems of asset bloat? Are you still able to efficiently and effectively invest in small-cap stocks for which the fund has been noted? Kimball: We are all very focused on seeking to deliver the return and the risk level investors expect and we are mindful of the capacity of our fund. At the size we are at now, very, very small cap or micro-cap companies are going to .
have less of a pronounced impact on the performance of the fund. That said, we do have a team of people who spend their time looking at small-cap companies. They’re going to continue to have a presence in our strategies. Matt: We continue to invest across the market-cap range. We have a number of companies that are $4, $5, $6, $7 billion mid-cap companies. In fact, if you look at our portfolios today, we tend to be underrepresented in the mega-caps and Kimball Brooker, Jr. much more represented in the midcap arena than the broader market. We are open-minded where we go. We value diversification. We have over 100 investments in the portfolio.
This has been true for a very long time. But we have a range of eclectic positions. We tend to be a little more diversified, which gives us a little bit more flexibility than you might think. There are other factors that help us in terms of managing our pool of capital, and the most important is that we are extremely long-term investors.
Our average turnover is well below 20%, often it is in the low teens. We have an average holding period typically in the five- to 10year range. The amount of turnover that we have generated in our portfolio has been quite low relative to our portfolio size, much to the chagrin of Wall Street no doubt.
There are probably many small hedge funds that generate more turnover than we do in a year. As we’ve mentioned before, we are not fully invested in equities. We have a position in gold, and we tend to have a countercyclical approach to cash, so we tend to be selling stocks when liquidity is best and we tend to have the cash and cash equivalents and be putting them to work when everyone is worried and there are anxious sellers. We believe our countercyclical approach to deploying capital helps as well. Bob: First Eagle Global significantly outperformed its benchmark in 2008. Starting in 2009, despite outperforming its category, it has underperformed its benchmark, although, not nearly by as much as most other value funds.
To what do you attribute your success in 2008? And what is your opinion about what’s happened since then and why might that change? Kimball: The fund performed relatively well in 2008. It was a lesson in the notion that what you don’t own in a portfolio can often be a very important driver, a more important driver than what you do own. One of the very important things that we attempt to avoid are companies that have high levels of debt or have opaque balance sheets.
One of the key reasons that the fund did rela7 tively well in 2008 was because we didn’t own any of the big financials that got themselves into trouble. That really came about because of our underwriting requirements. Since then the fund has done reasonably well against some other value funds but has lagged against some of the broader benchmarks. That’s a reflection of the fact that as the markets recovered our cash balances grew, which on a relative basis created a little bit of drag. Matt: In the week of the global financial crisis, when people started to question the quality of human-made money, gold did very well and that was a potential ballast for our portfolio when we needed it most. Over the last four years or so, as confidence improved in the financial system and risk premia came down, gold was soft.
It did what you’d expect as a potential hedge, but that was a headwind to us the last few years. We have put together what we think is an all-weather portfolio and we hope that through the whole cycle, good stock selection and prudent allocation of capital may potentially produce attractive returns. But within the cycle what we hope to produce is an element of resilience to crisis, and we are willing to look mundane in the later stages of a bull market. Bob: What guidance would you offer to investors who are contemplating increasing their allocations to passive funds? Has your view been affected at all by the market movement since January 1? Matt: There has been the analytical allure, if you will, of the indexed fund as being a low-cost implementation vehicle. The sta- .
tistics are often touted about the majority of active managers underperforming. That has understandably attracted a fair amount of capital, and it is likely to attract more capital at the peak of a bull market where just being long the market may be one of the best things that you can do. However, as we stand back from the recent trends and we think about the structure of markets, as advisors think about passive versus active, one thing we know for sure is that 100% of the market cannot be passive. You can’t have an entire market being willfully ignorant of the underlying valuation, balance sheet and management risk that’s being invested in. We think there’s always going to be a role for active investing. One of the problems of passive investing is that it encourages the willful ignorance of underlying fundamentals and valuation. It also implicitly encourages growth-based thematic investing. Over the last 30-odd years of financial market history, during the biggest bubbles of our generation there have been the big growth themes of the day—Japan in the late 1980s, tech in the late 1990s, financials in the mid-2000s, and even more recently the whole BRICs story.
The existence of index funds enabled a lot of capital to flow into these trends that was not discriminating about the un- derlying securities that were being purchased in those markets. The reason most active managers underperform, other than charging relatively higher fees, is that they try to structure their portfolios for prescience or at least the promise of prescience. They try to zig or zag around market trends. They try to identify the next great growth themes. We’ve seen how that has failed historically.
They look for companies that they think will beat the quarter but there is a huge amount of competition to identify short-term surprises. Many active managers are playing in areas that are simply too competitive, or trying to do things that can’t be done such as predicting the future with precision. We acknowledge our crystal ball is foggy at best. But there is a role for thoughtful active managers who are focused on seeking to protect capital over the long term through risk mitigation.
We don’t see risk as tracking error to a benchmark, but rather as avoiding the permanent loss of capital. If you think about our multi-decade track record at First Eagle, the key has often been what we’ve decided not to own, like Japan in the late 1980s; it was the biggest component of the MSCI world index, as was tech in the U.S. index in the late 1990s, but we chose not 8 to go there. The BRICs attracted huge amounts of capital and enthusiastic investing, and we’ve been very cautious because we couldn’t find securities bottom-up to invest there the last few years. By adopting a value-oriented approach, we only leave cash to buy securities that we believe are conservatively valued, conservatively capitalized and conservatively run.
This has really helped us avoid the permanent capital impairment when Japan, tech, the financials, and the BRICS imploded in the past. People pay us to be prudent capital allocators and to only get fully invested when bargains can be had. If this approach to active investing has worked over the long term, why don’t more people do it? Well, number one, it is not comfortable to be investing in a countercyclical fashion, committing capital when markets are in distress, or sitting with cash when markets are rallying to new highs. What we do has a decade-long cycle. Most investors are too impatient to mimic this. There is always going to be a role for thoughtful active investing.
We believe that the market is structurally short patience, and that creates the opportunity for active investors who are patient long-term investors focused on preventing the permanent impairment of capital. . Average Annual Returns as of 12/31/2015: Year to Date 1 Year 5 Years 10 Years First Eagle Global Fund - Class A (w/o sales charge) (SGENX) -0.94 -0.94 5.74 7.16 First Eagle Global Fund - Class A(w/sales charge) (SGENX) -5.89 -5.89 4.66 6.62 Expense Ratio 1.11% The performance data quoted herein represents past performance and does not guarantee future results. Market volatility can dramatically impact the fund’s short-term performance. Current performance may be lower or higher than figures shown. The investment return and principal value will fluctuate so that an investor’s shares, when redeemed, may be worth more or less than their original cost.
Past performance data through the most recent month end is available at feim.com or by calling 800.334.2143. The average annual returns for Class A Shares “with sales charge” of First Eagle Global Fund gives effect to the deduction of the maximum sales charge of 5.00%. The average annual returns shown above are historical and reflect changes in share price, reinvested dividends and are net of expenses. Investment results and the principal value of an investment will vary. The annual expense ratio is based on expenses incurred by the fund, as stated in the most recent prospectus. The opinions expressed are not necessarily those of the firm.
These materials are provided for informational purpose only. These opinions are not intended to be a forecast of future events, a guarantee of future results, or investment advice. Any statistics contained herein have been obtained from sources believed to be reliable, but the accuracy of this information cannot be guaranteed. The views expressed herein may change at any time subsequent to the date of issue hereof. The information provided is not to be construed as a recommendation or an offer to buy or sell or the solicitation of an offer to buy or sell any fund or security. There are risks associated with investing in funds that invest in securities of foreign countries, such as erratic market conditions, economic and political instability and fluctuations in currency exchange rates. Investment in gold and gold related investments present certain risks, and returns on gold related investments have traditionally been more volatile than investments in broader equity or debt markets. The principal risk of investing in value stocks is that the price of the security may not approach its anticipated value or may decline in value. All investments involve the risk of loss. The holdings mentioned herein represent the following percentages of the total net assets of First Eagle Global Fund as of 12/31/2015: KDDI Corporation 1.70%, Secom Co.
Ltd. 1.41%, Comcast Corporation 2.03%, Oracle Corporation 2.15%, Microsoft Corporation 2.35%, Flowserve Corporation 0.64%, gold bullion 6.21%. The Fund may invest in gold and precious metals through investment in a wholly-owned subsidiary of the Fund organized under the laws of the Cayman Islands (“the Subsidiary”). Gold bullion and commodities include the Fund’s investment in the Subsidiary. 2015 Morningstar, Inc.© All Rights Reserved.
The information contained herein: (1) is proprietary to Morningstar; (2) may not be copied or distributed; and (3) is not warranted to be accurate, complete or timely. Neither Morningstar nor its content providers are responsible for any damages or losses arising from any use of this information. Past performance is no guarantee of future results.
The Morningstar percentile ranking for the First Eagle Global Fund was derived using the total return of the performance figure associated with its 1-, 3-, 5- and 10-year periods, as of 12/31/15. Morningstar percentile rankings for First Eagle Global Fund Class A shares were: 20th for the 1-year (111/567 funds), 19th for the 3-year (89/479 funds), 15th for the 5-year (51/348 funds) and 5th for the 10-year (9/190 funds) periods when compared against the Morningstar World Allocation category. Different share classes may have different rankings. 2015 Best Flexible Portfolio Fund is based on the ten-year risk adjusted performance among 93 eligible flexible portfolio funds for the period ended December 31, 2014.
Classification average are calculated with all eligible share classes for each eligible classification. The calculation periods extend over 36, 60, and 120 months. The highest Lipper Leader for Consistent Return (Effective Return) value within each eligible classification determines the fund classification winner over three, five, or ten years.
Although Lipper makes reasonable efforts to ensure the accuracy and reliability of the data contained herein, the accuracy is not guaranteed by Lipper. This is not an offer to buy or sell securities. Additional information is available at www.lipperweb.com.
Lipper leader ratings copyright 2015, Reuters, All Rights Reserved. Lipper, a wholly owned subsidiary of Reuters, is a leading global provider of mutual fund information and analysis to fund companies, financial intermediaries, and media organizations. 9 . Reference to a ranking, a rating or an award does not provide any guarantee of future performance, and is subject to change over time. The information is not intended to provide and should not be relied on for accounting or tax advice. Any tax information presented is not intended to constitute an analysis of all tax considerations. Investors should consider investment objectives, risks, charges and expenses carefully before investing. The prospectus and summary prospectus contain this and other information about the Funds and may be obtained by asking your financial adviser, visiting our website at feim.com or calling us at 800.334.2143. Please read our prospectus carefully before investing.
For further information about the First Eagle Funds, please call 800.334.2143. The First Eagle Funds are offered by FEF Distributors, LLC, 1345 Avenue of the Americas, New York, New York 10105. © 2016, Advisor Perspectives, Inc. All rights reserved 10 .


