Working Paper 15-3: Additional Market Risk Shocks: Prepayment Uncertainty and Option-Adjusted Spreads
FHFA


Description
FHFA WORKING PAPERS
Working Paper 15-3
Additional Market Risk Shocks:
Prepayment Uncertainty and Option-Adjusted Spreads
Alexander Bogin, Senior Economist
Nataliya Polkovnichenko, Senior Economist
Capital Policy Branch
Federal Housing Finance Agency
400 7th Street SW
Washington, D.C. 20024
Alexander.Bogin@fhfa.gov
Nataliya.Polkovnichenko@fhfa.gov
July 2015
Federal Housing Finance Agency (FHFA) Working Papers are preliminary products circulated to
stimulate discussion and critical comment. The analysis and conclusions are those of the authors
and do not necessarily represent the views of FHFA or the U.S.
* The authors would also like to thank Scott Smith, Debra Fuller, William Doerner, Jesse
Weiher, Chi-Cheol Chung, and Stephen Bruestle for significant contributions to the project.
. Additional Market Risk Shocks:
Prepayment Uncertainty and Option-Adjusted Spreads
Abstract
Assessments of market risk for economic or regulatory capital typically involve calculating a
portfolio’s sensitivity to key risk factor movements. Historically, practitioners have focused on
two classical sources of risk, adverse changes in interest rates and volatility. As stress testing has
evolved, additional risk factors have been identified, including several specific to fixed-income
securities with embedded optionality. These include changes in prepayment rates or any of
several other market risk factors, which affect option-adjusted spreads (OAS).
We describe an empirical framework for generating shocks to prepayment rates and mortgage security OAS, which are consistent with simultaneous movements in other key risk factors, including the term structure of interest rates and implied volatility. Our prepayment rate shocks capture model misspecification and are calculated using historical performance data from multiple vendor prepayment models. These shocks are well defined, but capture only a portion of prepayment model error.
Mortgage security OAS serves as a broader measure of model error, which encompasses both, model misspecification and forecasting errors as well as credit and liquidity risk. Our OAS shocks are calculated using historical six-month changes in spreads derived from multiple vendor quotes. 2 . Working Paper 15-3 — “Additional Market Risk Shocks: Prepayment Uncertainty and Option-Adjusted Spreads” Executive Summary Assessments of market risk for economic or regulatory capital typically involve calculating a portfolio’s sensitivity to key risk factor movements. Historically, practitioners have focused on two classical sources of risk, adverse changes in interest rates and volatility. As stress testing has evolved, additional risk factors have been identified, including several specific to fixed-income securities with embedded optionality. These include changes in prepayment rates or any of several other market risk factors, which affect option-adjusted spreads (OAS). We describe an empirical framework for generating shocks to prepayment rates and mortgage security OAS, which are consistent with simultaneous movements in other key risk factors, including the term structure of interest rates and implied volatility.
Our prepayment rate shocks capture model misspecification and are calculated using historical performance data from multiple vendor prepayment models. In contrast, our OAS shocks capture a potentially broader measure of model error, which encompasses misspecification, forecasting errors, and credit and liquidity risk. They are calculated using historical changes in spreads derived from multiple vendor quotes. By conditioning our prepayment rate and OAS shocks on co-movements in other key risk factors, we are able to generate a comprehensive, plausible, and internally consistent set of shocks. Together, interest rate, volatility, and either OAS or prepayment rate shocks can be used to inform institutions about the amount of capital needed to withstand a combination of adverse market events. 3 .
Additional Market Risk Shocks: Prepayment Uncertainty and Option-Adjusted Spreads 1. Introduction Assessments of market risk for economic or regulatory capital typically involve calculating a portfolio’s sensitivity to key risk factor movements. Historically, practitioners have focused on two classical sources of risk, adverse changes in interest rates and volatility. As stress testing has evolved, additional risk factors have been identified, including several specific to fixed-income securities with embedded optionality.
These include changes in prepayment rates or in any of several other market risk factors, which affect option-adjusted spreads (Kopprasch, 1994; Heidari and Wu, 2004; and Levin and Davidson, 2005).1 We can account for unanticipated changes in prepayment speeds by including model error adjustments when stress testing. With access to a sufficient amount of historical model performance data, prepayment model error can be accurately measured and the resulting shocks are well defined. However, this type of adjustment is backward looking and fails to account for potential model advancements, forecasting error, and structural shifts in the consumer lending market (Fabozzi, 1999; Hayre and Rajan, 1995).
In contrast, option-adjusted spreads (OAS) serve as a broader and forward-looking measure of model error, which can encompass prepayment model errors due to misspecification as well as errors in forecasting (Babbel and Zenios, 1992). These shocks can be constructed based upon multiple historical vendor quotes, but their principal components are model dependent and vary across market environments (Heidari and Wu, 2004). Data scarcity is also a concern for non-agency securities. It is current best practice among regulators to include shocks to option-adjusted spreads when market risk stress testing, particularly to shock portfolios containing fixed income securities with embedded optionality (e.g., mortgage backed securities, callable debt).
For instance, option-adjusted spreads are included as a risk factor in the Global Market Shocks under the Federal Reserve’s Comprehensive Capital Analysis and Review (CCAR). 1 4 . To fully account for the risks associated with embedded optionality, we propose to include either prepayment error adjustments or OAS shocks when stress testing. Each type of shock has a distinct set of advantages as well as potential concerns. In order to generate prepayment model error adjustments and OAS shocks, which are consistent with simultaneous movements in the term structure of interest rates and implied volatility, we employ an adaption of the linkage methodology developed by Bogin & Doerner (2014).2 In this earlier work, Bogin & Doerner use historical reduced form dependencies to model the relationship between interest rates and implied volatilities. We use this same manner of linkage to associate interest rate movements to prepayment model error and OAS. Generating a plausible and internally consistent set of risk factor movements allows for a more accurate measure of market risk, which can be used to inform institutions about the amount of capital needed to withstand a combination of adverse market events (Berkowitz, 1999).
Furthermore, a plausible and coherent set of shocks is required to compute market value and cash flow projections, which are indicative of meaningful market sensitivities.3 In Section 2 we describe the relationship between prepayment rate and OAS adjustments. Section 3 discusses how to generate scenario specific prepayment model error adjustments, and Section 4 describes a methodology to generate shocks to mortgage security OAS. Section 5 summarizes and concludes our findings. 2. Two Methods for Equilibrating Model and Market Price Prepayment models generate projected mortgage security cash flows, which are then discounted to solve for the associated security’s model price.
When these model prices diverge from market Bogin and Doerner’s methodology represents a departure from traditional historical simulation. Under the traditional historical simulation approach, a set of historically-based interest rate shocks drive variation in other, portfolio-relevant risk factors using a variant of the traditional factor model. Because the relationship between interest rates and these other risk factors is static, the methodology suffers from some of the same flaws as standard historical simulation (e.g., it is unable to account for time varying volatilities and changes in correlation across risk factors).
For more information on the potential flaws of historical simulation see Pritsker, 2006. 3 Based on the analysis presented in this paper, we recognize that prepayment model error and OAS are model-dependent. This presents several challenges for practical implementation. Despite these challenges, we believe that it is important to account for prepayment uncertainty when measuring market risk. 2 5 .
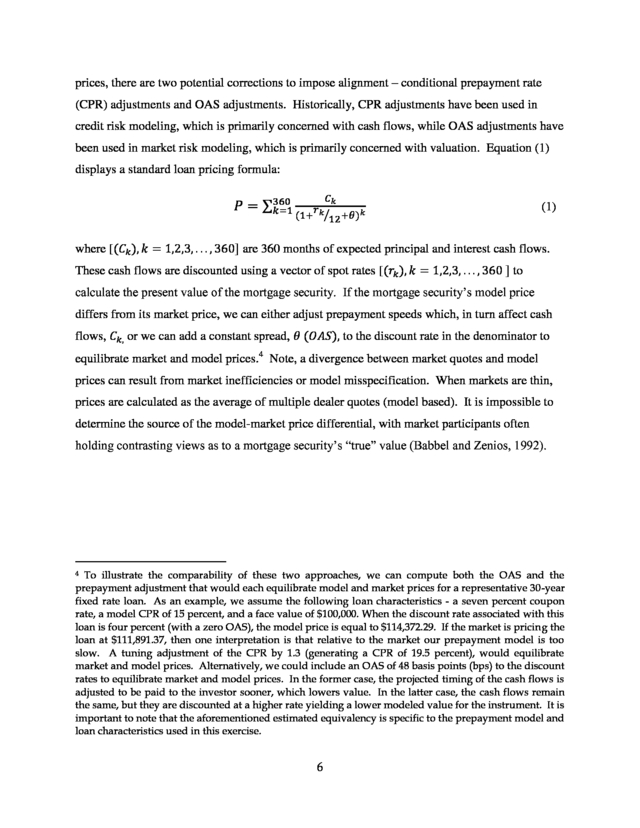
prices, there are two potential corrections to impose alignment – conditional prepayment rate (CPR) adjustments and OAS adjustments. Historically, CPR adjustments have been used in credit risk modeling, which is primarily concerned with cash flows, while OAS adjustments have been used in market risk modeling, which is primarily concerned with valuation. Equation (1) displays a standard loan pricing formula: 𑃠= ∑360 ð‘˜=1 ð¶ð‘˜ ð‘Ÿð‘˜ (1+ ⁄12+ðœƒ) 𑘠(1) where [(ð¶ 𑘠), 𑘠= 1,2,3, . .
. , 360] are 360 months of expected principal and interest cash flows. These cash flows are discounted using a vector of spot rates [(𑟠𑘠), 𑘠= 1,2,3, . .
. , 360 ] to calculate the present value of the mortgage security. If the mortgage security’s model price differs from its market price, we can either adjust prepayment speeds which, in turn affect cash flows, ð¶ ð‘˜, or we can add a constant spread, 𜃠(ð‘‚ð´ð‘†), to the discount rate in the denominator to equilibrate market and model prices.4 Note, a divergence between market quotes and model prices can result from market inefficiencies or model misspecification.
When markets are thin, prices are calculated as the average of multiple dealer quotes (model based). It is impossible to determine the source of the model-market price differential, with market participants often holding contrasting views as to a mortgage security’s “true” value (Babbel and Zenios, 1992). To illustrate the comparability of these two approaches, we can compute both the OAS and the prepayment adjustment that would each equilibrate model and market prices for a representative 30-year fixed rate loan. As an example, we assume the following loan characteristics - a seven percent coupon rate, a model CPR of 15 percent, and a face value of $100,000.
When the discount rate associated with this loan is four percent (with a zero OAS), the model price is equal to $114,372.29. If the market is pricing the loan at $111,891.37, then one interpretation is that relative to the market our prepayment model is too slow. A tuning adjustment of the CPR by 1.3 (generating a CPR of 19.5 percent), would equilibrate market and model prices.
Alternatively, we could include an OAS of 48 basis points (bps) to the discount rates to equilibrate market and model prices. In the former case, the projected timing of the cash flows is adjusted to be paid to the investor sooner, which lowers value. In the latter case, the cash flows remain the same, but they are discounted at a higher rate yielding a lower modeled value for the instrument.
It is important to note that the aforementioned estimated equivalency is specific to the prepayment model and loan characteristics used in this exercise. 4 6 . 3. Prepayment Rates Prepayment models are deployed in mortgage security valuation to estimate pool or loan-level cash flows conditional on a set of collateral characteristics and a macroeconomic forecast.5 These cash flows are then discounted using a projected interest rate path to solve for the present value of the associated mortgage security. One of the primary risks in projecting cash flows comes from prepayment model error, which can arise from two sources – macroeconomic forecasts that deviate from scenarios actually observed, or out-of-model error, and model misspecification, or in-model error (Borodovsky and Lore, 2000). Because our prepayment shocks will be coupled with simultaneous movements in the term structure of interest rates and implied volatility, which already shift the underlying macroeconomic environment, we focus our attention on in-model error. In order to isolate in-model error, model predictions are generated using actual or historically accurate inputs.
These model predictions are then compared with realized conditional prepayment rates (CPR). Any deviation of predicted versus realized CPR is due to model misspecification, which can arise for several reasons. First, prepayment realizations are subject to random shocks and therefore model projections will contain purely statistical error even for a fixed economic scenario.
Second, as market conditions change, prepayment model performance can deteriorate due to misspecified or omitted dependencies among the included model variables. Third, in-model error can persist even when the model is re-parameterized, particularly if there is insufficient information to determine whether or not structural shifts are temporary or permanent (Hayre and Rajan, 1995; and Burns, 2010). After calculating the magnitude of in-model error across several prepayment models and mortgage securities, we generate an initial set of prepayment model error shocks. These are then adjusted based upon scenario specific interest rate changes and portfolio specific loan and prepayment model characteristics. The resulting scenario specific prepayment model error 5Credit models usually differentiate between voluntary and involuntary prepayments (defaults), whereas standard prepayment models or total terminations models typically do not.
It is standard industry practice to use a total termination prepayment model when measuring market risk. 7 . adjustments are well defined, but potentially too narrow in scope to capture the full extent of prepayment error (Hayre and Rajan, 1995). Further, these shocks are backward looking and fail to account for potential model advancements or structural shifts in the consumer lending market (Fabozzi, 1999). 3.1 Methodology Our methodology for constructing prepayment model error adjustments is predicated on two overarching design goals: generalizability and ease of implementation. The generalizability of our prepayment model error adjustments is largely a function of the quality and quantity of available data. In an effort to incorporate prepayment model performance across a wide array of loan types, we use historical performance data from several leading vendors. These data provide model-predicted and historically observed single monthly mortalities (SMM) across different market environments.6 Unfortunately, many of the included time series are brief in nature (e.g., model performance of loans originated with a three percent coupon are only available for two years), which prevents us from constructing a robust measure of model error across origination year, coupon, or loan type.
Instead, we construct a general prepayment model error adjustment, which represents model performance across a wide array of loans. The historical performance data allow us to compute in-model error by annualizing monthly mortality rates as CPR=1-(1-SMM)12 using both model-predicted and historically observed SMM. We then take the ratio of these CPR measures to calculate a CPR multiplier to correct for over-and-under prediction of prepayment speeds: CPR multiplier = CPRrealized / CPRpredicted. We chose this type of adjustment measure because it can be broadly applied across the majority of commercially available valuation models, which all include a tool to speed up or slow down prepayment rates using a multiplier on predicted CPR. If the multiplier is above one, the model predicted CPR speeds are too slow vis-à-vis observed prepayment speeds and require speeding The single monthly mortality rate is the percentage of the principal amount of mortgages that are prepaid in a given month.
It is used for tracking prepayments in a mortgage pool. 6 8 . up. Alternatively, if the multiplier is below one, then predicted CPR speeds are too fast vis-à-vis observed prepayment speeds and require slowing down.7 In this respect, the extent to which predicted prepayment speeds are too fast or too slow is the reciprocal of our CPR multiplier, with the multiplier itself representing the correction. In the following sections, we analyze errors associated with over-prediction and under-prediction separately to allow for asymmetry in the error distributions. This leads to two sets of CPR multipliers to capture over- and under-estimates of actual prepayment speeds. 3.2 Data Sets To estimate the extent of in-model error, we employ historical performance data from several agency and non-agency prepayment models from 2000 to 2013. The data include detailed information on realized and predicted CPRs for a variety of loan types.
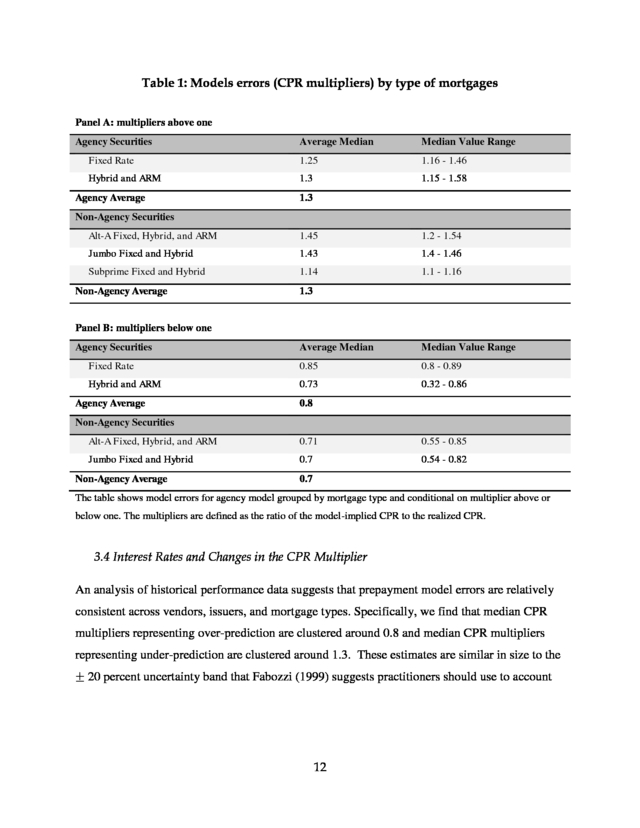
We find that, across vendors, prepayment models have qualitatively similar in-model errors.8 Therefore, we aggregate results across vendors and present our overall assessment below. CPR multipliers are detailed in Table 1 with multipliers above one presented in Panel A and multipliers below one presented in Panel B. 3.3 Data Analysis and Results Agency Model Prepayment Multiplier The historical performance data for agency prepayment models include realized and predicted CPRs for several mortgage types.9 The data contain 55,216 observations, which represent an Note, a similar multiplier can also be constructed using cumulative measures of model error over longer horizons, but we prefer to use SMMs so as to avoid under-estimating the extent of model error. With longer horizons, the error rate is effectively smoothed as errors across different time periods typically offset each other, which results in a downward bias. 8 The prepayment rate errors associated with the prepayment models we examined are higher during the first three to five years of a mortgage’s life and lower thereafter. 9 We analyzed historical agency prepayment models performance data for the following types of loans: Federal National Mortgage Association (FNMA) and Federal Home Loan Mortgage Corporation (FHLMC) fixed rate 30-, 20-, 15-, and 10-year mortgages; FNMA fixed rate 40-year mortgages; Government National Mortgage Association (GNMA) fixed rate 15- and 30-year mortgages; FNMA and 7 9 .
unbalanced panel of 563 coupon/origination year combinations. For the fixed rate mortgages, the bulk of the data is concentrated in 30- and 15-year maturities, which contain 73.9 percent of available observations among fixed rate loans. For each loan type combination, the following variables are available: date, model SMM, historical SMM, origination year, product type, and a coupon, if applicable. We begin our analysis of in-model prepayment error by examining the distribution of CPR multipliers across fixed rate mortgages. Model errors above one, which represent underestimates of actual prepayment speeds, range from 1.16 for 40-year fixed rate mortgages to 1.46 for 10-year fixed rate mortgages.
The average median multiplier above one is is 1.25.10 For multipliers below one, medians range from 0.80 for 20-year fixed rate mortgages to 0.89 for 10year fixed rate mortgages. The average median multiplier below one is 0.85. Among all fixed rate mortgage types, multipliers above one occur more frequently than multipliers below one. Next, we turn to data for hybrids and ARMs.
The upper bound for hybrid mortgage median multipliers associated with under-prediction is considerably higher than that for fixed rate mortgages— 1.58 for GNMA 10-year resets. We also observe a higher upper bound for ARMs. The average median multiplier across hybrids and ARMs is 1.3. For over-predictions, median multipliers range from 0.32 to 0.89 with an average of 0.73. Given the similarity of median multipliers across both product type and securitizing agency, we believe two sets of multipliers should be sufficient to broadly capture prepayment rate error: one to capture the impact of over-estimating prepayment speeds and another to capture the impact of under-estimating prepayment speeds.11 FHLMC 10-, seven-, five-, and three-year hybrid mortgages; GMMA five and three year hybrid mortgages; and FNMA and FHLMC 30-year adjustable rate mortgages (ARMs). 10 In constructing group averages, the median multipliers associated with each loan type are equally weighted. 11 Institutions with large mortgage exposures may want a more disaggregated set of prepayment speed shocks. 10 .
Non-Agency Model Prepayment Multiplier The historical performance data for non-agency models cover 10 types of loans: Alternative Apaper (Alt-A) 15- and 30-year fixed rate mortgages, Alt-A five-year hybrid and 30-year option ARMs, jumbo 15- and 30-year fixed rate and five-year hybrid ARMs, and subprime fixed rate 30-year and two- and three-year hybrid ARMs. The data have 10,236 monthly observations that include information on type of mortgage, origination year, model SMM, and historical SMM. The observations are evenly apportioned across loan types; however, some type/origination year combinations exit the data prior to 2013. For model errors above one, the smallest non-agency median multiplier is equal to 1.1 and is associated with subprime three-year hybrid mortgages. The largest non-agency median multiplier is equal to 1.54 and is associated with Alt-A fixed rate 15-year mortgages. Alt-A mortgages, excluding option ARMs, have an average median multiplier of 1.45.
In contrast, all subprime and Alt-A option ARMs have median multipliers below 1.2. Across all mortgage types, the average median multiplier is 1.33. For model errors below one, median multipliers range from 0.54 for jumbo 15-year fixed rate mortgages to 0.85 for Alt-A 30 year fixed rate mortgages. The average median across all loan types is 0.68. In contrast to the agency model results, non-agency multipliers below one occur more frequently than multipliers above one, indicating that non-agency models tend toward over-predicting prepayment speeds while agency models tend toward under-predicting prepayment speeds.
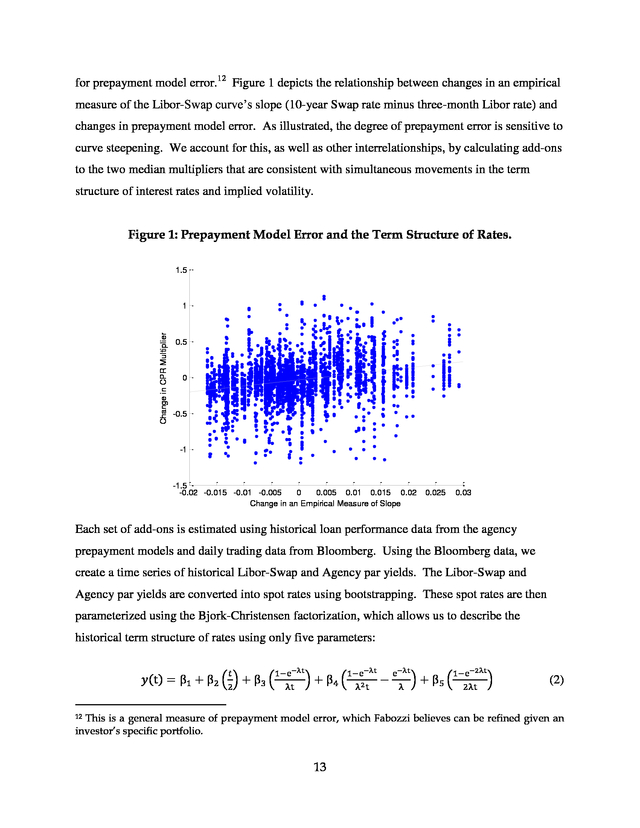
This is largely consistent with anecdotal evidence from the last crisis, where lower credit quality borrowers, disproportionately represented within non-agency loans, were often unable to refinance and take advantage of low interest rates. 11 . Table 1: Models errors (CPR multipliers) by type of mortgages Panel A: multipliers above one Agency Securities Average Median Median Value Range Fixed Rate 1.25 1.16 - 1.46 Hybrid and ARM 1.3 1.15 - 1.58 Agency Average 1.3 Non-Agency Securities Alt-A Fixed, Hybrid, and ARM 1.45 1.2 - 1.54 Jumbo Fixed and Hybrid 1.43 1.4 - 1.46 Subprime Fixed and Hybrid 1.14 1.1 - 1.16 Non-Agency Average 1.3 Panel B: multipliers below one Agency Securities Average Median Median Value Range Fixed Rate 0.85 0.8 - 0.89 Hybrid and ARM 0.73 0.32 - 0.86 Agency Average 0.8 Non-Agency Securities Alt-A Fixed, Hybrid, and ARM 0.71 0.55 - 0.85 Jumbo Fixed and Hybrid 0.7 0.54 - 0.82 Non-Agency Average 0.7 The table shows model errors for agency model grouped by mortgage type and conditional on multiplier above or below one. The multipliers are defined as the ratio of the model-implied CPR to the realized CPR. 3.4 Interest Rates and Changes in the CPR Multiplier An analysis of historical performance data suggests that prepayment model errors are relatively consistent across vendors, issuers, and mortgage types. Specifically, we find that median CPR multipliers representing over-prediction are clustered around 0.8 and median CPR multipliers representing under-prediction are clustered around 1.3. These estimates are similar in size to the ± 20 percent uncertainty band that Fabozzi (1999) suggests practitioners should use to account 12 .
for prepayment model error.12 Figure 1 depicts the relationship between changes in an empirical measure of the Libor-Swap curve’s slope (10-year Swap rate minus three-month Libor rate) and changes in prepayment model error. As illustrated, the degree of prepayment error is sensitive to curve steepening. We account for this, as well as other interrelationships, by calculating add-ons to the two median multipliers that are consistent with simultaneous movements in the term structure of interest rates and implied volatility. Figure 1: Prepayment Model Error and the Term Structure of Rates. 1.5 Change in CPR Multiplier 1 0.5 0 -0.5 -1 -1.5 -0.02 -0.015 -0.01 -0.005 0 0.005 0.01 0.015 0.02 Change in an Empirical Measure of Slope 0.025 0.03 Each set of add-ons is estimated using historical loan performance data from the agency prepayment models and daily trading data from Bloomberg. Using the Bloomberg data, we create a time series of historical Libor-Swap and Agency par yields.
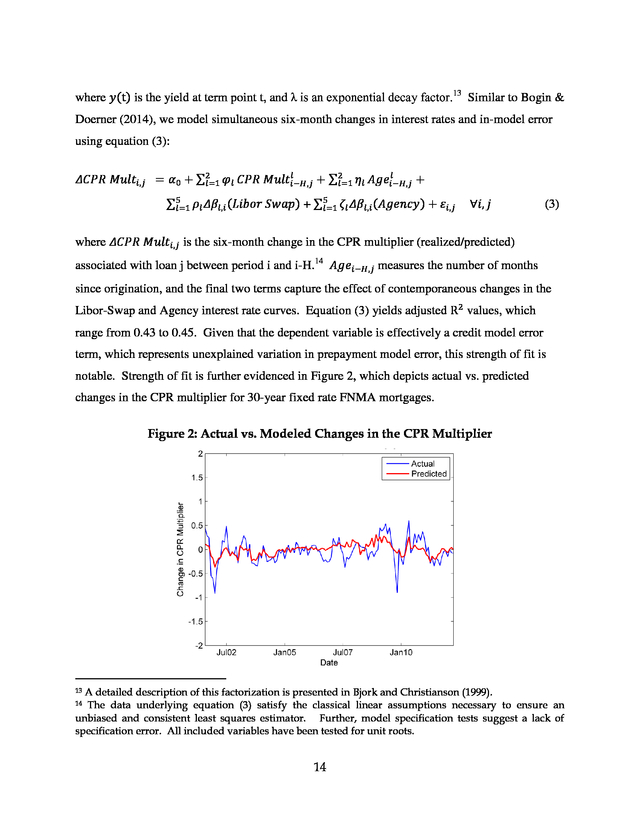
The Libor-Swap and Agency par yields are converted into spot rates using bootstrapping. These spot rates are then parameterized using the Bjork-Christensen factorization, which allows us to describe the historical term structure of rates using only five parameters: ð‘¡ 1−e−λt ð‘¦(t) = β1 + β2 (2) + β3 ( λt 1−e−λt ) + β4 ( λ2 t − e−λt λ 1−e−2λt ) + β5 ( 2λt ) (2) This is a general measure of prepayment model error, which Fabozzi believes can be refined given an investor’s specific portfolio. 12 13 . where ð‘¦(t) is the yield at term point t, and λ is an exponential decay factor.13 Similar to Bogin & Doerner (2014), we model simultaneous six-month changes in interest rates and in-model error using equation (3): ð‘™ ð‘™ ð›¥ð¶ð‘ƒð‘… ð‘€ð‘¢ð‘™ð‘¡ ð‘–,ð‘— = ð›¼0 + ∑2 𜑠𑙠ð¶ð‘ƒð‘… ð‘€ð‘¢ð‘™ð‘¡ ð‘–−ð»,ð‘— + ∑2 𜂠𑙠ð´ð‘”ð‘’ ð‘–−ð»,ð‘— + ð‘™=1 ð‘™=1 ∑5 𜌠𑙠ð›¥ð›½ ð‘™,ð‘– (ð¿ð‘–ð‘ð‘œð‘Ÿ ð‘†ð‘¤ð‘Žð‘) + ∑5 ðœ ð‘™ ð›¥ð›½ ð‘™,ð‘– (ð´ð‘”ð‘’ð‘›ð‘ð‘¦) + 𜀠ð‘–,ð‘— ð‘™=1 ð‘™=1 ∀ð‘–, ð‘— (3) where ð›¥ð¶ð‘ƒð‘… ð‘€ð‘¢ð‘™ð‘¡ ð‘–,ð‘— is the six-month change in the CPR multiplier (realized/predicted) associated with loan j between period i and i-H.14 ð´ð‘”ð‘’ ð‘–−ð»,ð‘— measures the number of months since origination, and the final two terms capture the effect of contemporaneous changes in the Libor-Swap and Agency interest rate curves. Equation (3) yields adjusted R2 values, which range from 0.43 to 0.45. Given that the dependent variable is effectively a credit model error term, which represents unexplained variation in prepayment model error, this strength of fit is notable. Strength of fit is further evidenced in Figure 2, which depicts actual vs.
predicted changes in the CPR multiplier for 30-year fixed rate FNMA mortgages. Figure 2: Actual vs. Modeled Changes in the CPR Multiplier A detailed description of this factorization is presented in Bjork and Christianson (1999). The data underlying equation (3) satisfy the classical linear assumptions necessary to ensure an unbiased and consistent least squares estimator. Further, model specification tests suggest a lack of specification error.
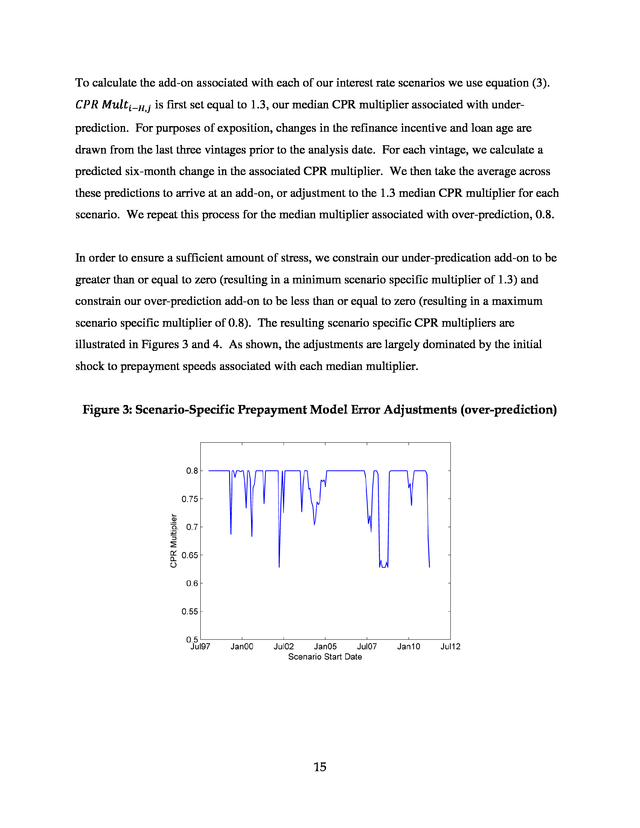
All included variables have been tested for unit roots. 13 14 14 . To calculate the add-on associated with each of our interest rate scenarios we use equation (3). ð¶ð‘ƒð‘… ð‘€ð‘¢ð‘™ð‘¡ ð‘–−ð»,ð‘— is first set equal to 1.3, our median CPR multiplier associated with underprediction. For purposes of exposition, changes in the refinance incentive and loan age are drawn from the last three vintages prior to the analysis date. For each vintage, we calculate a predicted six-month change in the associated CPR multiplier. We then take the average across these predictions to arrive at an add-on, or adjustment to the 1.3 median CPR multiplier for each scenario.
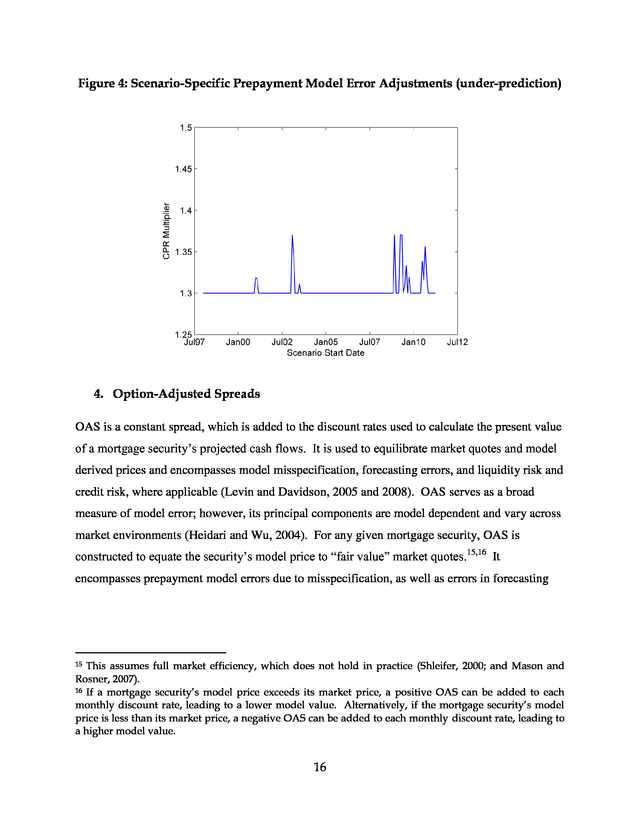
We repeat this process for the median multiplier associated with over-prediction, 0.8. In order to ensure a sufficient amount of stress, we constrain our under-predication add-on to be greater than or equal to zero (resulting in a minimum scenario specific multiplier of 1.3) and constrain our over-prediction add-on to be less than or equal to zero (resulting in a maximum scenario specific multiplier of 0.8). The resulting scenario specific CPR multipliers are illustrated in Figures 3 and 4. As shown, the adjustments are largely dominated by the initial shock to prepayment speeds associated with each median multiplier. Figure 3: Scenario-Specific Prepayment Model Error Adjustments (over-prediction) 15 .
Figure 4: Scenario-Specific Prepayment Model Error Adjustments (under-prediction) 4. Option-Adjusted Spreads OAS is a constant spread, which is added to the discount rates used to calculate the present value of a mortgage security’s projected cash flows. It is used to equilibrate market quotes and model derived prices and encompasses model misspecification, forecasting errors, and liquidity risk and credit risk, where applicable (Levin and Davidson, 2005 and 2008). OAS serves as a broad measure of model error; however, its principal components are model dependent and vary across market environments (Heidari and Wu, 2004).
For any given mortgage security, OAS is constructed to equate the security’s model price to “fair value” market quotes.15,16 It encompasses prepayment model errors due to misspecification, as well as errors in forecasting This assumes full market efficiency, which does not hold in practice (Shleifer, 2000; and Mason and Rosner, 2007). 16 If a mortgage security’s model price exceeds its market price, a positive OAS can be added to each monthly discount rate, leading to a lower model value. Alternatively, if the mortgage security’s model price is less than its market price, a negative OAS can be added to each monthly discount rate, leading to a higher model value. 15 16 . the factors influencing cash flows and their associated discount rates (Babbel and Zenios, 1992).17 From a practitioner’s viewpoint, OAS is often considered synonymous with the premium investors require for taking on prepayment risk. If borrowers were not permitted to prepay their mortgages or if the prepayment penalties were sufficiently onerous to eliminate the uncertainty associated with prepayments, OAS would be significantly muted. However, that is not the case; borrowers in the fixed-rate and adjustable-rate prime space generally incur no penalty fee for prepaying their mortgages, unlike in in the subprime space, and may do so at any time. For fixed-rate loan holders, if interest rates fall, borrowers are predisposed to exercise their options to prepay and refinance their mortgages at lower rates, in direct opposition to the best interest of investors, who would prefer to continue receiving the higher rate. Alternatively, if interest rates rise, borrowers have negligible incentive to prepay their mortgages (short of relocation or other turnover); investors, on the other hand, would prefer to see the below-market interest rate or discount loans disappear in favor of re-investing at higher interest rates.
The OAS required by investors for having given up the prepayment option depends in large part, then, on the accuracy of modeled prepayment speeds. 4.1 Interest Rates and Option-Adjusted Spreads Changes in several types of macroeconomic factors, including the term structure of interest rates, can shift market expectations and mortgage security prices before they are fully incorporated into prepayment models through recalibration or tuning parameter adjustments (Kopprasch, 1994). These unexpected changes can lead to an increase in OAS, which decreases the value of the associated mortgage assets. There is a strong empirical relationship between a mortgage security’s OAS and interest rates (Heidari and Wu, 2004). All else constant, a mortgage security’s OAS will widen when interest Non-Agency OAS also incorporates an investor premium for taking on varying degrees of liquidity and credit risk. 17 17 . rates fall because investors faced with a greater probability of borrowers exercising their prepayment options require a higher premium for taking the prepayment risk. Conversely, OAS will tighten when interest rates rise because investors faced with a lower probability of borrowers exercising their prepayment options require a smaller premium for taking the prepayment risk (Green and Shoven, 1983). This response can also be thought of in mechanical terms. Assume a mortgage model’s pricing error remains fixed at 𜗠across interest rate environments.
As rates increase, mortgage prepayments slow and Macaulay duration, or the security’s weighted average term to maturity, increases. Because a given OAS has a greater effect on the present value of distant cash flows, a narrower spread is required to eliminate ðœ—. Alternatively, as interest rates decrease, prepayments accelerate and Macaulay duration decreases.
This leads to fewer distant cash flows, and a wider spread required to eliminate 𜗠(Kupiec and Kah, 1999). In order to link changes in OAS to simultaneous movements in interest rates, we model their reduced-form historical relationship, again leveraging the methodology proposed by Bogin and Doerner (2014). By calculating OAS shocks conditional on contemporaneous changes in the term structure of interest rates, we ensure an internally consistent set of risk factor movements. Because OAS is sensitive to the choice of both term structure and prepayment model, we work with time series data supplied by multiple vendors (Babbel and Zenios, 1992) to mute the effect of individual idiosyncrasies. Each OAS time series tracks the spread attached to current coupon to-be-announced (TBA) Agency issues.
Using this data, we calculate six-month historical changes in OAS. This serves as the dependent variable in our model linking interest rates to OAS and will allow us to project changes in OAS predicated on a set of simultaneous interest rate shocks. By including these shocks when stress testing, we allow baseline OAS to change along with interest rates during portfolio revaluation.
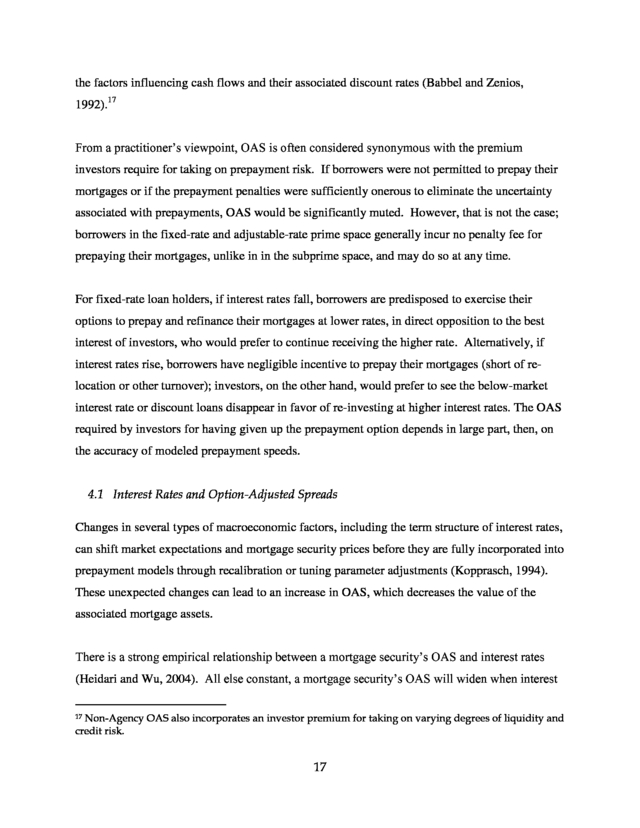
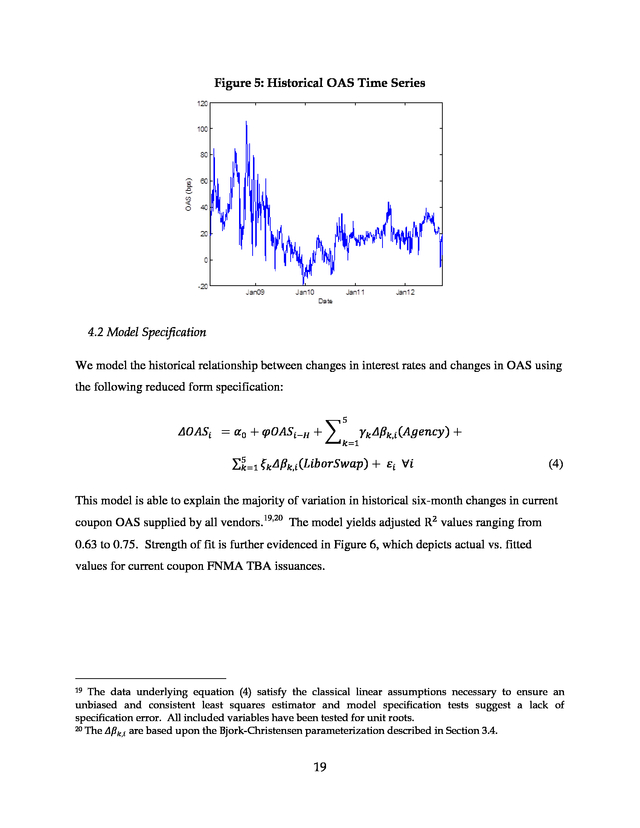
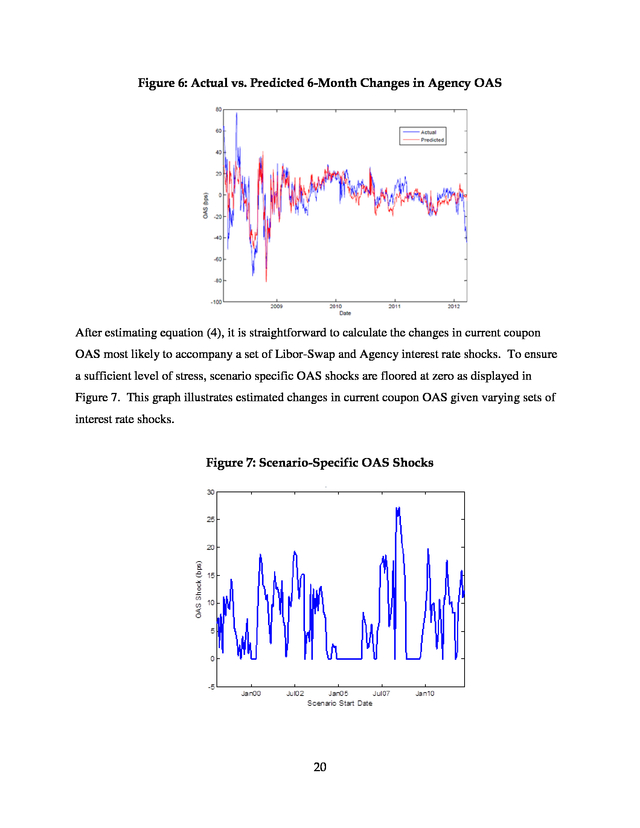
Figure 5 illustrates FNMA current coupon OAS based on several vendor prepayment models. As shown, FNMA OAS has historically ranged from -22 bps to 106 bps.18 Note, a negative OAS increases the present value of projected cash flows, which increases a mortgage security’s model price. 18 18 . Figure 5: Historical OAS Time Series 4.2 Model Specification We model the historical relationship between changes in interest rates and changes in OAS using the following reduced form specification: ð›¥ð‘‚ð´ð‘† ð‘– = ð›¼0 + ðœ‘ð‘‚ð´ð‘† ð‘–−ð» + ∑ 5 ð‘˜=1 𛾠𑘠ð›¥ð›½ ð‘˜,ð‘– (ð´ð‘”ð‘’ð‘›ð‘ð‘¦) + ∑5ð‘˜=1 𜉠𑘠ð›¥ð›½ ð‘˜,ð‘– (ð¿ð‘–ð‘ð‘œð‘Ÿð‘†ð‘¤ð‘Žð‘) + 𜀠𑖠∀ð‘– (4) This model is able to explain the majority of variation in historical six-month changes in current coupon OAS supplied by all vendors.19,20 The model yields adjusted R2 values ranging from 0.63 to 0.75. Strength of fit is further evidenced in Figure 6, which depicts actual vs. fitted values for current coupon FNMA TBA issuances. The data underlying equation (4) satisfy the classical linear assumptions necessary to ensure an unbiased and consistent least squares estimator and model specification tests suggest a lack of specification error. All included variables have been tested for unit roots. 20 The ð›¥ð›½ ð‘˜,ð‘– are based upon the Bjork-Christensen parameterization described in Section 3.4. 19 19 .
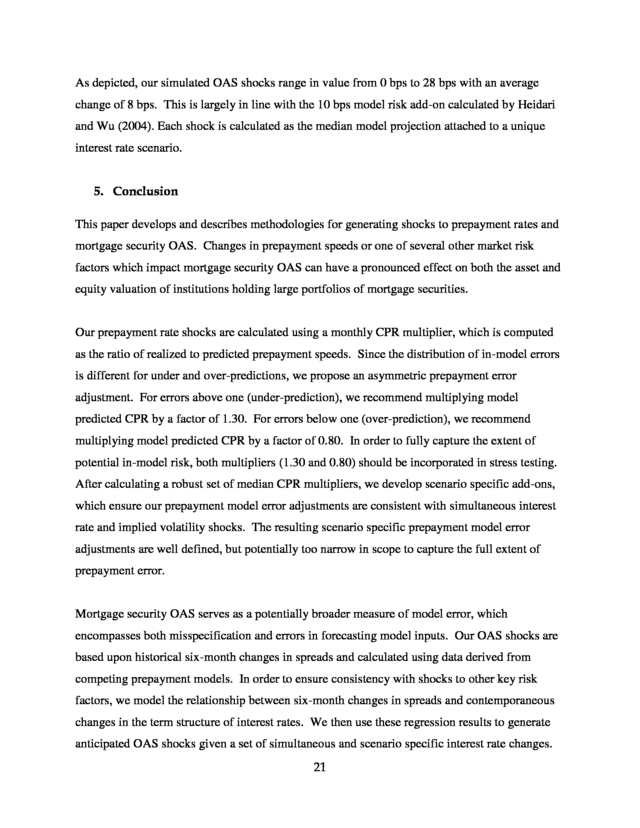
Figure 6: Actual vs. Predicted 6-Month Changes in Agency OAS After estimating equation (4), it is straightforward to calculate the changes in current coupon OAS most likely to accompany a set of Libor-Swap and Agency interest rate shocks. To ensure a sufficient level of stress, scenario specific OAS shocks are floored at zero as displayed in Figure 7. This graph illustrates estimated changes in current coupon OAS given varying sets of interest rate shocks. Figure 7: Scenario-Specific OAS Shocks 20 .
As depicted, our simulated OAS shocks range in value from 0 bps to 28 bps with an average change of 8 bps. This is largely in line with the 10 bps model risk add-on calculated by Heidari and Wu (2004). Each shock is calculated as the median model projection attached to a unique interest rate scenario. 5. Conclusion This paper develops and describes methodologies for generating shocks to prepayment rates and mortgage security OAS.
Changes in prepayment speeds or one of several other market risk factors which impact mortgage security OAS can have a pronounced effect on both the asset and equity valuation of institutions holding large portfolios of mortgage securities. Our prepayment rate shocks are calculated using a monthly CPR multiplier, which is computed as the ratio of realized to predicted prepayment speeds. Since the distribution of in-model errors is different for under and over-predictions, we propose an asymmetric prepayment error adjustment. For errors above one (under-prediction), we recommend multiplying model predicted CPR by a factor of 1.30.
For errors below one (over-prediction), we recommend multiplying model predicted CPR by a factor of 0.80. In order to fully capture the extent of potential in-model risk, both multipliers (1.30 and 0.80) should be incorporated in stress testing. After calculating a robust set of median CPR multipliers, we develop scenario specific add-ons, which ensure our prepayment model error adjustments are consistent with simultaneous interest rate and implied volatility shocks. The resulting scenario specific prepayment model error adjustments are well defined, but potentially too narrow in scope to capture the full extent of prepayment error. Mortgage security OAS serves as a potentially broader measure of model error, which encompasses both misspecification and errors in forecasting model inputs.
Our OAS shocks are based upon historical six-month changes in spreads and calculated using data derived from competing prepayment models. In order to ensure consistency with shocks to other key risk factors, we model the relationship between six-month changes in spreads and contemporaneous changes in the term structure of interest rates. We then use these regression results to generate anticipated OAS shocks given a set of simultaneous and scenario specific interest rate changes. 21 .
While broad in scope, these shocks are based upon a set of specific vendor quotes, which are model dependent. We propose including changes to either OAS or prepayment rates when stress testing in order to more accurately measure market risk. We combine data from different models to arrive at a single set of shocks. For practical implementation this type of aggregation is desirable, but results in a loss of information regarding the distribution of shocks calculated using competing models. In forthcoming research, we plan to evaluate the tradeoffs between OAS and prepayment rate shocks by applying each set of shocks to a representative portfolio of mortgage assets and examining the resulting capital implications under a range of models and market environments. 22 .
References Babbel, David F. and Stavros A. Zenios, (1992) “Pitfalls in the Analysis of Option-Adjusted Spreads,” Financial Analysts Journal, Vol. 48, No.
4, pp. 65-69. Berkowitz, Jeremy, (1999) “A Coherent Framework for Stress-Testing,” FEDS Working Paper No. 99-29. Björk, Tomas and Bent J.
Christensen, (1999) “Interest Rate Dynamics and Consistent Forward Rate Curves,” Mathematical Finance, Vol. 9., No. 4, pp.
323-348. Bogin, Alexander N. and William M. Doerner, (2014) “Generating Historically-Based Stress Scenarios Using Parsimonious Factorization,” Journal of Risk Finance, Vol.
15, No. 5, pp. 591611. Borodovsky, Lev and Marc Lore, The Professional’s Handbook of Financial Risk Management, Woburn, MA: Butterworth-Heinemann, 2000. Burns, William, (2010) “Prepayment Modeling Challenges in the Wake of the 2008 Credit and Mortgage Crisis,” Interactive Data Fixed Income Analytics. Fabozzi, Frank J., Advances in the Valuation and Management of Mortgage-Backed Securities, John Wiley & Sons, In.c, 1999. Green, Jerry and John B.
Shoven, (1983) “The Effects of Interest Rates on Mortgage Prepayments,” NBER Working Paper No. 1246. Hayre, Lakhbir and Arvind Rajan, “Anatomy of Prepayments: The Salomon Brothers Prepayment Model,” Salomon Brothers Inc., June 1995. Heidari, Massoud and Liuren Wu, (2004) “What Constitutes a Good Model? An Analysis of Models for Mortgage Backed Securities,” Working Paper. Kopprasch, Robert W., (1994) “Option-Adjusted Spread Analysis: Going Down the Wrong Path?,” Financial Analysts Journal, Vol. 50, No.
3, pp. 42-47. Kupiec, Paul H. and Adama Kah, (1999) “On the Origin and Interpretation of OAS,” The Journal of Fixed Income, Vol.
9, No. 3, pp. 82-92. 23 .
Levin, Alexander and Andrew Davidson, (2005) “Prepayment Risk- and Option-Adjusted Valuation of MBS,” The Journal of Portfolio Management, Vol. 31, No. 4, pp. 73-85. Levin, Alexander and Andrew Davidson, (2008) “The Concept of Credit OAS in Valuation of MBS,” The Journal of Portfolio Management, Vol.
34, No. 3, pp. 41-55. Mason, Joseph and Josh Rosner, (2007) “Where Did the Risk Go? How Misapplied Bond Ratings Cause Mortgage Backed Securities and Collateralized Debt Obligation Market Disruptions,” Working Paper. Pritsker, Matthew, (2006) “The Hidden Dangers of Historical Simulation,” Journal of Banking and Finance, Vol.
30, pp. 561-582. Shleifer, Andrei, Inefficient Markets: An Introduction to Behavioral Finance, New York: Oxford University Press, 2000. 24 .
We describe an empirical framework for generating shocks to prepayment rates and mortgage security OAS, which are consistent with simultaneous movements in other key risk factors, including the term structure of interest rates and implied volatility. Our prepayment rate shocks capture model misspecification and are calculated using historical performance data from multiple vendor prepayment models. These shocks are well defined, but capture only a portion of prepayment model error.
Mortgage security OAS serves as a broader measure of model error, which encompasses both, model misspecification and forecasting errors as well as credit and liquidity risk. Our OAS shocks are calculated using historical six-month changes in spreads derived from multiple vendor quotes. 2 . Working Paper 15-3 — “Additional Market Risk Shocks: Prepayment Uncertainty and Option-Adjusted Spreads” Executive Summary Assessments of market risk for economic or regulatory capital typically involve calculating a portfolio’s sensitivity to key risk factor movements. Historically, practitioners have focused on two classical sources of risk, adverse changes in interest rates and volatility. As stress testing has evolved, additional risk factors have been identified, including several specific to fixed-income securities with embedded optionality. These include changes in prepayment rates or any of several other market risk factors, which affect option-adjusted spreads (OAS). We describe an empirical framework for generating shocks to prepayment rates and mortgage security OAS, which are consistent with simultaneous movements in other key risk factors, including the term structure of interest rates and implied volatility.
Our prepayment rate shocks capture model misspecification and are calculated using historical performance data from multiple vendor prepayment models. In contrast, our OAS shocks capture a potentially broader measure of model error, which encompasses misspecification, forecasting errors, and credit and liquidity risk. They are calculated using historical changes in spreads derived from multiple vendor quotes. By conditioning our prepayment rate and OAS shocks on co-movements in other key risk factors, we are able to generate a comprehensive, plausible, and internally consistent set of shocks. Together, interest rate, volatility, and either OAS or prepayment rate shocks can be used to inform institutions about the amount of capital needed to withstand a combination of adverse market events. 3 .
Additional Market Risk Shocks: Prepayment Uncertainty and Option-Adjusted Spreads 1. Introduction Assessments of market risk for economic or regulatory capital typically involve calculating a portfolio’s sensitivity to key risk factor movements. Historically, practitioners have focused on two classical sources of risk, adverse changes in interest rates and volatility. As stress testing has evolved, additional risk factors have been identified, including several specific to fixed-income securities with embedded optionality.
These include changes in prepayment rates or in any of several other market risk factors, which affect option-adjusted spreads (Kopprasch, 1994; Heidari and Wu, 2004; and Levin and Davidson, 2005).1 We can account for unanticipated changes in prepayment speeds by including model error adjustments when stress testing. With access to a sufficient amount of historical model performance data, prepayment model error can be accurately measured and the resulting shocks are well defined. However, this type of adjustment is backward looking and fails to account for potential model advancements, forecasting error, and structural shifts in the consumer lending market (Fabozzi, 1999; Hayre and Rajan, 1995).
In contrast, option-adjusted spreads (OAS) serve as a broader and forward-looking measure of model error, which can encompass prepayment model errors due to misspecification as well as errors in forecasting (Babbel and Zenios, 1992). These shocks can be constructed based upon multiple historical vendor quotes, but their principal components are model dependent and vary across market environments (Heidari and Wu, 2004). Data scarcity is also a concern for non-agency securities. It is current best practice among regulators to include shocks to option-adjusted spreads when market risk stress testing, particularly to shock portfolios containing fixed income securities with embedded optionality (e.g., mortgage backed securities, callable debt).
For instance, option-adjusted spreads are included as a risk factor in the Global Market Shocks under the Federal Reserve’s Comprehensive Capital Analysis and Review (CCAR). 1 4 . To fully account for the risks associated with embedded optionality, we propose to include either prepayment error adjustments or OAS shocks when stress testing. Each type of shock has a distinct set of advantages as well as potential concerns. In order to generate prepayment model error adjustments and OAS shocks, which are consistent with simultaneous movements in the term structure of interest rates and implied volatility, we employ an adaption of the linkage methodology developed by Bogin & Doerner (2014).2 In this earlier work, Bogin & Doerner use historical reduced form dependencies to model the relationship between interest rates and implied volatilities. We use this same manner of linkage to associate interest rate movements to prepayment model error and OAS. Generating a plausible and internally consistent set of risk factor movements allows for a more accurate measure of market risk, which can be used to inform institutions about the amount of capital needed to withstand a combination of adverse market events (Berkowitz, 1999).
Furthermore, a plausible and coherent set of shocks is required to compute market value and cash flow projections, which are indicative of meaningful market sensitivities.3 In Section 2 we describe the relationship between prepayment rate and OAS adjustments. Section 3 discusses how to generate scenario specific prepayment model error adjustments, and Section 4 describes a methodology to generate shocks to mortgage security OAS. Section 5 summarizes and concludes our findings. 2. Two Methods for Equilibrating Model and Market Price Prepayment models generate projected mortgage security cash flows, which are then discounted to solve for the associated security’s model price.
When these model prices diverge from market Bogin and Doerner’s methodology represents a departure from traditional historical simulation. Under the traditional historical simulation approach, a set of historically-based interest rate shocks drive variation in other, portfolio-relevant risk factors using a variant of the traditional factor model. Because the relationship between interest rates and these other risk factors is static, the methodology suffers from some of the same flaws as standard historical simulation (e.g., it is unable to account for time varying volatilities and changes in correlation across risk factors).
For more information on the potential flaws of historical simulation see Pritsker, 2006. 3 Based on the analysis presented in this paper, we recognize that prepayment model error and OAS are model-dependent. This presents several challenges for practical implementation. Despite these challenges, we believe that it is important to account for prepayment uncertainty when measuring market risk. 2 5 .
prices, there are two potential corrections to impose alignment – conditional prepayment rate (CPR) adjustments and OAS adjustments. Historically, CPR adjustments have been used in credit risk modeling, which is primarily concerned with cash flows, while OAS adjustments have been used in market risk modeling, which is primarily concerned with valuation. Equation (1) displays a standard loan pricing formula: 𑃠= ∑360 ð‘˜=1 ð¶ð‘˜ ð‘Ÿð‘˜ (1+ ⁄12+ðœƒ) 𑘠(1) where [(ð¶ 𑘠), 𑘠= 1,2,3, . .
. , 360] are 360 months of expected principal and interest cash flows. These cash flows are discounted using a vector of spot rates [(𑟠𑘠), 𑘠= 1,2,3, . .
. , 360 ] to calculate the present value of the mortgage security. If the mortgage security’s model price differs from its market price, we can either adjust prepayment speeds which, in turn affect cash flows, ð¶ ð‘˜, or we can add a constant spread, 𜃠(ð‘‚ð´ð‘†), to the discount rate in the denominator to equilibrate market and model prices.4 Note, a divergence between market quotes and model prices can result from market inefficiencies or model misspecification.
When markets are thin, prices are calculated as the average of multiple dealer quotes (model based). It is impossible to determine the source of the model-market price differential, with market participants often holding contrasting views as to a mortgage security’s “true” value (Babbel and Zenios, 1992). To illustrate the comparability of these two approaches, we can compute both the OAS and the prepayment adjustment that would each equilibrate model and market prices for a representative 30-year fixed rate loan. As an example, we assume the following loan characteristics - a seven percent coupon rate, a model CPR of 15 percent, and a face value of $100,000.
When the discount rate associated with this loan is four percent (with a zero OAS), the model price is equal to $114,372.29. If the market is pricing the loan at $111,891.37, then one interpretation is that relative to the market our prepayment model is too slow. A tuning adjustment of the CPR by 1.3 (generating a CPR of 19.5 percent), would equilibrate market and model prices.
Alternatively, we could include an OAS of 48 basis points (bps) to the discount rates to equilibrate market and model prices. In the former case, the projected timing of the cash flows is adjusted to be paid to the investor sooner, which lowers value. In the latter case, the cash flows remain the same, but they are discounted at a higher rate yielding a lower modeled value for the instrument.
It is important to note that the aforementioned estimated equivalency is specific to the prepayment model and loan characteristics used in this exercise. 4 6 . 3. Prepayment Rates Prepayment models are deployed in mortgage security valuation to estimate pool or loan-level cash flows conditional on a set of collateral characteristics and a macroeconomic forecast.5 These cash flows are then discounted using a projected interest rate path to solve for the present value of the associated mortgage security. One of the primary risks in projecting cash flows comes from prepayment model error, which can arise from two sources – macroeconomic forecasts that deviate from scenarios actually observed, or out-of-model error, and model misspecification, or in-model error (Borodovsky and Lore, 2000). Because our prepayment shocks will be coupled with simultaneous movements in the term structure of interest rates and implied volatility, which already shift the underlying macroeconomic environment, we focus our attention on in-model error. In order to isolate in-model error, model predictions are generated using actual or historically accurate inputs.
These model predictions are then compared with realized conditional prepayment rates (CPR). Any deviation of predicted versus realized CPR is due to model misspecification, which can arise for several reasons. First, prepayment realizations are subject to random shocks and therefore model projections will contain purely statistical error even for a fixed economic scenario.
Second, as market conditions change, prepayment model performance can deteriorate due to misspecified or omitted dependencies among the included model variables. Third, in-model error can persist even when the model is re-parameterized, particularly if there is insufficient information to determine whether or not structural shifts are temporary or permanent (Hayre and Rajan, 1995; and Burns, 2010). After calculating the magnitude of in-model error across several prepayment models and mortgage securities, we generate an initial set of prepayment model error shocks. These are then adjusted based upon scenario specific interest rate changes and portfolio specific loan and prepayment model characteristics. The resulting scenario specific prepayment model error 5Credit models usually differentiate between voluntary and involuntary prepayments (defaults), whereas standard prepayment models or total terminations models typically do not.
It is standard industry practice to use a total termination prepayment model when measuring market risk. 7 . adjustments are well defined, but potentially too narrow in scope to capture the full extent of prepayment error (Hayre and Rajan, 1995). Further, these shocks are backward looking and fail to account for potential model advancements or structural shifts in the consumer lending market (Fabozzi, 1999). 3.1 Methodology Our methodology for constructing prepayment model error adjustments is predicated on two overarching design goals: generalizability and ease of implementation. The generalizability of our prepayment model error adjustments is largely a function of the quality and quantity of available data. In an effort to incorporate prepayment model performance across a wide array of loan types, we use historical performance data from several leading vendors. These data provide model-predicted and historically observed single monthly mortalities (SMM) across different market environments.6 Unfortunately, many of the included time series are brief in nature (e.g., model performance of loans originated with a three percent coupon are only available for two years), which prevents us from constructing a robust measure of model error across origination year, coupon, or loan type.
Instead, we construct a general prepayment model error adjustment, which represents model performance across a wide array of loans. The historical performance data allow us to compute in-model error by annualizing monthly mortality rates as CPR=1-(1-SMM)12 using both model-predicted and historically observed SMM. We then take the ratio of these CPR measures to calculate a CPR multiplier to correct for over-and-under prediction of prepayment speeds: CPR multiplier = CPRrealized / CPRpredicted. We chose this type of adjustment measure because it can be broadly applied across the majority of commercially available valuation models, which all include a tool to speed up or slow down prepayment rates using a multiplier on predicted CPR. If the multiplier is above one, the model predicted CPR speeds are too slow vis-à-vis observed prepayment speeds and require speeding The single monthly mortality rate is the percentage of the principal amount of mortgages that are prepaid in a given month.
It is used for tracking prepayments in a mortgage pool. 6 8 . up. Alternatively, if the multiplier is below one, then predicted CPR speeds are too fast vis-à-vis observed prepayment speeds and require slowing down.7 In this respect, the extent to which predicted prepayment speeds are too fast or too slow is the reciprocal of our CPR multiplier, with the multiplier itself representing the correction. In the following sections, we analyze errors associated with over-prediction and under-prediction separately to allow for asymmetry in the error distributions. This leads to two sets of CPR multipliers to capture over- and under-estimates of actual prepayment speeds. 3.2 Data Sets To estimate the extent of in-model error, we employ historical performance data from several agency and non-agency prepayment models from 2000 to 2013. The data include detailed information on realized and predicted CPRs for a variety of loan types.
We find that, across vendors, prepayment models have qualitatively similar in-model errors.8 Therefore, we aggregate results across vendors and present our overall assessment below. CPR multipliers are detailed in Table 1 with multipliers above one presented in Panel A and multipliers below one presented in Panel B. 3.3 Data Analysis and Results Agency Model Prepayment Multiplier The historical performance data for agency prepayment models include realized and predicted CPRs for several mortgage types.9 The data contain 55,216 observations, which represent an Note, a similar multiplier can also be constructed using cumulative measures of model error over longer horizons, but we prefer to use SMMs so as to avoid under-estimating the extent of model error. With longer horizons, the error rate is effectively smoothed as errors across different time periods typically offset each other, which results in a downward bias. 8 The prepayment rate errors associated with the prepayment models we examined are higher during the first three to five years of a mortgage’s life and lower thereafter. 9 We analyzed historical agency prepayment models performance data for the following types of loans: Federal National Mortgage Association (FNMA) and Federal Home Loan Mortgage Corporation (FHLMC) fixed rate 30-, 20-, 15-, and 10-year mortgages; FNMA fixed rate 40-year mortgages; Government National Mortgage Association (GNMA) fixed rate 15- and 30-year mortgages; FNMA and 7 9 .
unbalanced panel of 563 coupon/origination year combinations. For the fixed rate mortgages, the bulk of the data is concentrated in 30- and 15-year maturities, which contain 73.9 percent of available observations among fixed rate loans. For each loan type combination, the following variables are available: date, model SMM, historical SMM, origination year, product type, and a coupon, if applicable. We begin our analysis of in-model prepayment error by examining the distribution of CPR multipliers across fixed rate mortgages. Model errors above one, which represent underestimates of actual prepayment speeds, range from 1.16 for 40-year fixed rate mortgages to 1.46 for 10-year fixed rate mortgages.
The average median multiplier above one is is 1.25.10 For multipliers below one, medians range from 0.80 for 20-year fixed rate mortgages to 0.89 for 10year fixed rate mortgages. The average median multiplier below one is 0.85. Among all fixed rate mortgage types, multipliers above one occur more frequently than multipliers below one. Next, we turn to data for hybrids and ARMs.
The upper bound for hybrid mortgage median multipliers associated with under-prediction is considerably higher than that for fixed rate mortgages— 1.58 for GNMA 10-year resets. We also observe a higher upper bound for ARMs. The average median multiplier across hybrids and ARMs is 1.3. For over-predictions, median multipliers range from 0.32 to 0.89 with an average of 0.73. Given the similarity of median multipliers across both product type and securitizing agency, we believe two sets of multipliers should be sufficient to broadly capture prepayment rate error: one to capture the impact of over-estimating prepayment speeds and another to capture the impact of under-estimating prepayment speeds.11 FHLMC 10-, seven-, five-, and three-year hybrid mortgages; GMMA five and three year hybrid mortgages; and FNMA and FHLMC 30-year adjustable rate mortgages (ARMs). 10 In constructing group averages, the median multipliers associated with each loan type are equally weighted. 11 Institutions with large mortgage exposures may want a more disaggregated set of prepayment speed shocks. 10 .
Non-Agency Model Prepayment Multiplier The historical performance data for non-agency models cover 10 types of loans: Alternative Apaper (Alt-A) 15- and 30-year fixed rate mortgages, Alt-A five-year hybrid and 30-year option ARMs, jumbo 15- and 30-year fixed rate and five-year hybrid ARMs, and subprime fixed rate 30-year and two- and three-year hybrid ARMs. The data have 10,236 monthly observations that include information on type of mortgage, origination year, model SMM, and historical SMM. The observations are evenly apportioned across loan types; however, some type/origination year combinations exit the data prior to 2013. For model errors above one, the smallest non-agency median multiplier is equal to 1.1 and is associated with subprime three-year hybrid mortgages. The largest non-agency median multiplier is equal to 1.54 and is associated with Alt-A fixed rate 15-year mortgages. Alt-A mortgages, excluding option ARMs, have an average median multiplier of 1.45.
In contrast, all subprime and Alt-A option ARMs have median multipliers below 1.2. Across all mortgage types, the average median multiplier is 1.33. For model errors below one, median multipliers range from 0.54 for jumbo 15-year fixed rate mortgages to 0.85 for Alt-A 30 year fixed rate mortgages. The average median across all loan types is 0.68. In contrast to the agency model results, non-agency multipliers below one occur more frequently than multipliers above one, indicating that non-agency models tend toward over-predicting prepayment speeds while agency models tend toward under-predicting prepayment speeds.
This is largely consistent with anecdotal evidence from the last crisis, where lower credit quality borrowers, disproportionately represented within non-agency loans, were often unable to refinance and take advantage of low interest rates. 11 . Table 1: Models errors (CPR multipliers) by type of mortgages Panel A: multipliers above one Agency Securities Average Median Median Value Range Fixed Rate 1.25 1.16 - 1.46 Hybrid and ARM 1.3 1.15 - 1.58 Agency Average 1.3 Non-Agency Securities Alt-A Fixed, Hybrid, and ARM 1.45 1.2 - 1.54 Jumbo Fixed and Hybrid 1.43 1.4 - 1.46 Subprime Fixed and Hybrid 1.14 1.1 - 1.16 Non-Agency Average 1.3 Panel B: multipliers below one Agency Securities Average Median Median Value Range Fixed Rate 0.85 0.8 - 0.89 Hybrid and ARM 0.73 0.32 - 0.86 Agency Average 0.8 Non-Agency Securities Alt-A Fixed, Hybrid, and ARM 0.71 0.55 - 0.85 Jumbo Fixed and Hybrid 0.7 0.54 - 0.82 Non-Agency Average 0.7 The table shows model errors for agency model grouped by mortgage type and conditional on multiplier above or below one. The multipliers are defined as the ratio of the model-implied CPR to the realized CPR. 3.4 Interest Rates and Changes in the CPR Multiplier An analysis of historical performance data suggests that prepayment model errors are relatively consistent across vendors, issuers, and mortgage types. Specifically, we find that median CPR multipliers representing over-prediction are clustered around 0.8 and median CPR multipliers representing under-prediction are clustered around 1.3. These estimates are similar in size to the ± 20 percent uncertainty band that Fabozzi (1999) suggests practitioners should use to account 12 .
for prepayment model error.12 Figure 1 depicts the relationship between changes in an empirical measure of the Libor-Swap curve’s slope (10-year Swap rate minus three-month Libor rate) and changes in prepayment model error. As illustrated, the degree of prepayment error is sensitive to curve steepening. We account for this, as well as other interrelationships, by calculating add-ons to the two median multipliers that are consistent with simultaneous movements in the term structure of interest rates and implied volatility. Figure 1: Prepayment Model Error and the Term Structure of Rates. 1.5 Change in CPR Multiplier 1 0.5 0 -0.5 -1 -1.5 -0.02 -0.015 -0.01 -0.005 0 0.005 0.01 0.015 0.02 Change in an Empirical Measure of Slope 0.025 0.03 Each set of add-ons is estimated using historical loan performance data from the agency prepayment models and daily trading data from Bloomberg. Using the Bloomberg data, we create a time series of historical Libor-Swap and Agency par yields.
The Libor-Swap and Agency par yields are converted into spot rates using bootstrapping. These spot rates are then parameterized using the Bjork-Christensen factorization, which allows us to describe the historical term structure of rates using only five parameters: ð‘¡ 1−e−λt ð‘¦(t) = β1 + β2 (2) + β3 ( λt 1−e−λt ) + β4 ( λ2 t − e−λt λ 1−e−2λt ) + β5 ( 2λt ) (2) This is a general measure of prepayment model error, which Fabozzi believes can be refined given an investor’s specific portfolio. 12 13 . where ð‘¦(t) is the yield at term point t, and λ is an exponential decay factor.13 Similar to Bogin & Doerner (2014), we model simultaneous six-month changes in interest rates and in-model error using equation (3): ð‘™ ð‘™ ð›¥ð¶ð‘ƒð‘… ð‘€ð‘¢ð‘™ð‘¡ ð‘–,ð‘— = ð›¼0 + ∑2 𜑠𑙠ð¶ð‘ƒð‘… ð‘€ð‘¢ð‘™ð‘¡ ð‘–−ð»,ð‘— + ∑2 𜂠𑙠ð´ð‘”ð‘’ ð‘–−ð»,ð‘— + ð‘™=1 ð‘™=1 ∑5 𜌠𑙠ð›¥ð›½ ð‘™,ð‘– (ð¿ð‘–ð‘ð‘œð‘Ÿ ð‘†ð‘¤ð‘Žð‘) + ∑5 ðœ ð‘™ ð›¥ð›½ ð‘™,ð‘– (ð´ð‘”ð‘’ð‘›ð‘ð‘¦) + 𜀠ð‘–,ð‘— ð‘™=1 ð‘™=1 ∀ð‘–, ð‘— (3) where ð›¥ð¶ð‘ƒð‘… ð‘€ð‘¢ð‘™ð‘¡ ð‘–,ð‘— is the six-month change in the CPR multiplier (realized/predicted) associated with loan j between period i and i-H.14 ð´ð‘”ð‘’ ð‘–−ð»,ð‘— measures the number of months since origination, and the final two terms capture the effect of contemporaneous changes in the Libor-Swap and Agency interest rate curves. Equation (3) yields adjusted R2 values, which range from 0.43 to 0.45. Given that the dependent variable is effectively a credit model error term, which represents unexplained variation in prepayment model error, this strength of fit is notable. Strength of fit is further evidenced in Figure 2, which depicts actual vs.
predicted changes in the CPR multiplier for 30-year fixed rate FNMA mortgages. Figure 2: Actual vs. Modeled Changes in the CPR Multiplier A detailed description of this factorization is presented in Bjork and Christianson (1999). The data underlying equation (3) satisfy the classical linear assumptions necessary to ensure an unbiased and consistent least squares estimator. Further, model specification tests suggest a lack of specification error.
All included variables have been tested for unit roots. 13 14 14 . To calculate the add-on associated with each of our interest rate scenarios we use equation (3). ð¶ð‘ƒð‘… ð‘€ð‘¢ð‘™ð‘¡ ð‘–−ð»,ð‘— is first set equal to 1.3, our median CPR multiplier associated with underprediction. For purposes of exposition, changes in the refinance incentive and loan age are drawn from the last three vintages prior to the analysis date. For each vintage, we calculate a predicted six-month change in the associated CPR multiplier. We then take the average across these predictions to arrive at an add-on, or adjustment to the 1.3 median CPR multiplier for each scenario.
We repeat this process for the median multiplier associated with over-prediction, 0.8. In order to ensure a sufficient amount of stress, we constrain our under-predication add-on to be greater than or equal to zero (resulting in a minimum scenario specific multiplier of 1.3) and constrain our over-prediction add-on to be less than or equal to zero (resulting in a maximum scenario specific multiplier of 0.8). The resulting scenario specific CPR multipliers are illustrated in Figures 3 and 4. As shown, the adjustments are largely dominated by the initial shock to prepayment speeds associated with each median multiplier. Figure 3: Scenario-Specific Prepayment Model Error Adjustments (over-prediction) 15 .
Figure 4: Scenario-Specific Prepayment Model Error Adjustments (under-prediction) 4. Option-Adjusted Spreads OAS is a constant spread, which is added to the discount rates used to calculate the present value of a mortgage security’s projected cash flows. It is used to equilibrate market quotes and model derived prices and encompasses model misspecification, forecasting errors, and liquidity risk and credit risk, where applicable (Levin and Davidson, 2005 and 2008). OAS serves as a broad measure of model error; however, its principal components are model dependent and vary across market environments (Heidari and Wu, 2004).
For any given mortgage security, OAS is constructed to equate the security’s model price to “fair value” market quotes.15,16 It encompasses prepayment model errors due to misspecification, as well as errors in forecasting This assumes full market efficiency, which does not hold in practice (Shleifer, 2000; and Mason and Rosner, 2007). 16 If a mortgage security’s model price exceeds its market price, a positive OAS can be added to each monthly discount rate, leading to a lower model value. Alternatively, if the mortgage security’s model price is less than its market price, a negative OAS can be added to each monthly discount rate, leading to a higher model value. 15 16 . the factors influencing cash flows and their associated discount rates (Babbel and Zenios, 1992).17 From a practitioner’s viewpoint, OAS is often considered synonymous with the premium investors require for taking on prepayment risk. If borrowers were not permitted to prepay their mortgages or if the prepayment penalties were sufficiently onerous to eliminate the uncertainty associated with prepayments, OAS would be significantly muted. However, that is not the case; borrowers in the fixed-rate and adjustable-rate prime space generally incur no penalty fee for prepaying their mortgages, unlike in in the subprime space, and may do so at any time. For fixed-rate loan holders, if interest rates fall, borrowers are predisposed to exercise their options to prepay and refinance their mortgages at lower rates, in direct opposition to the best interest of investors, who would prefer to continue receiving the higher rate. Alternatively, if interest rates rise, borrowers have negligible incentive to prepay their mortgages (short of relocation or other turnover); investors, on the other hand, would prefer to see the below-market interest rate or discount loans disappear in favor of re-investing at higher interest rates.
The OAS required by investors for having given up the prepayment option depends in large part, then, on the accuracy of modeled prepayment speeds. 4.1 Interest Rates and Option-Adjusted Spreads Changes in several types of macroeconomic factors, including the term structure of interest rates, can shift market expectations and mortgage security prices before they are fully incorporated into prepayment models through recalibration or tuning parameter adjustments (Kopprasch, 1994). These unexpected changes can lead to an increase in OAS, which decreases the value of the associated mortgage assets. There is a strong empirical relationship between a mortgage security’s OAS and interest rates (Heidari and Wu, 2004). All else constant, a mortgage security’s OAS will widen when interest Non-Agency OAS also incorporates an investor premium for taking on varying degrees of liquidity and credit risk. 17 17 . rates fall because investors faced with a greater probability of borrowers exercising their prepayment options require a higher premium for taking the prepayment risk. Conversely, OAS will tighten when interest rates rise because investors faced with a lower probability of borrowers exercising their prepayment options require a smaller premium for taking the prepayment risk (Green and Shoven, 1983). This response can also be thought of in mechanical terms. Assume a mortgage model’s pricing error remains fixed at 𜗠across interest rate environments.
As rates increase, mortgage prepayments slow and Macaulay duration, or the security’s weighted average term to maturity, increases. Because a given OAS has a greater effect on the present value of distant cash flows, a narrower spread is required to eliminate ðœ—. Alternatively, as interest rates decrease, prepayments accelerate and Macaulay duration decreases.
This leads to fewer distant cash flows, and a wider spread required to eliminate 𜗠(Kupiec and Kah, 1999). In order to link changes in OAS to simultaneous movements in interest rates, we model their reduced-form historical relationship, again leveraging the methodology proposed by Bogin and Doerner (2014). By calculating OAS shocks conditional on contemporaneous changes in the term structure of interest rates, we ensure an internally consistent set of risk factor movements. Because OAS is sensitive to the choice of both term structure and prepayment model, we work with time series data supplied by multiple vendors (Babbel and Zenios, 1992) to mute the effect of individual idiosyncrasies. Each OAS time series tracks the spread attached to current coupon to-be-announced (TBA) Agency issues.
Using this data, we calculate six-month historical changes in OAS. This serves as the dependent variable in our model linking interest rates to OAS and will allow us to project changes in OAS predicated on a set of simultaneous interest rate shocks. By including these shocks when stress testing, we allow baseline OAS to change along with interest rates during portfolio revaluation.
Figure 5 illustrates FNMA current coupon OAS based on several vendor prepayment models. As shown, FNMA OAS has historically ranged from -22 bps to 106 bps.18 Note, a negative OAS increases the present value of projected cash flows, which increases a mortgage security’s model price. 18 18 . Figure 5: Historical OAS Time Series 4.2 Model Specification We model the historical relationship between changes in interest rates and changes in OAS using the following reduced form specification: ð›¥ð‘‚ð´ð‘† ð‘– = ð›¼0 + ðœ‘ð‘‚ð´ð‘† ð‘–−ð» + ∑ 5 ð‘˜=1 𛾠𑘠ð›¥ð›½ ð‘˜,ð‘– (ð´ð‘”ð‘’ð‘›ð‘ð‘¦) + ∑5ð‘˜=1 𜉠𑘠ð›¥ð›½ ð‘˜,ð‘– (ð¿ð‘–ð‘ð‘œð‘Ÿð‘†ð‘¤ð‘Žð‘) + 𜀠𑖠∀ð‘– (4) This model is able to explain the majority of variation in historical six-month changes in current coupon OAS supplied by all vendors.19,20 The model yields adjusted R2 values ranging from 0.63 to 0.75. Strength of fit is further evidenced in Figure 6, which depicts actual vs. fitted values for current coupon FNMA TBA issuances. The data underlying equation (4) satisfy the classical linear assumptions necessary to ensure an unbiased and consistent least squares estimator and model specification tests suggest a lack of specification error. All included variables have been tested for unit roots. 20 The ð›¥ð›½ ð‘˜,ð‘– are based upon the Bjork-Christensen parameterization described in Section 3.4. 19 19 .
Figure 6: Actual vs. Predicted 6-Month Changes in Agency OAS After estimating equation (4), it is straightforward to calculate the changes in current coupon OAS most likely to accompany a set of Libor-Swap and Agency interest rate shocks. To ensure a sufficient level of stress, scenario specific OAS shocks are floored at zero as displayed in Figure 7. This graph illustrates estimated changes in current coupon OAS given varying sets of interest rate shocks. Figure 7: Scenario-Specific OAS Shocks 20 .
As depicted, our simulated OAS shocks range in value from 0 bps to 28 bps with an average change of 8 bps. This is largely in line with the 10 bps model risk add-on calculated by Heidari and Wu (2004). Each shock is calculated as the median model projection attached to a unique interest rate scenario. 5. Conclusion This paper develops and describes methodologies for generating shocks to prepayment rates and mortgage security OAS.
Changes in prepayment speeds or one of several other market risk factors which impact mortgage security OAS can have a pronounced effect on both the asset and equity valuation of institutions holding large portfolios of mortgage securities. Our prepayment rate shocks are calculated using a monthly CPR multiplier, which is computed as the ratio of realized to predicted prepayment speeds. Since the distribution of in-model errors is different for under and over-predictions, we propose an asymmetric prepayment error adjustment. For errors above one (under-prediction), we recommend multiplying model predicted CPR by a factor of 1.30.
For errors below one (over-prediction), we recommend multiplying model predicted CPR by a factor of 0.80. In order to fully capture the extent of potential in-model risk, both multipliers (1.30 and 0.80) should be incorporated in stress testing. After calculating a robust set of median CPR multipliers, we develop scenario specific add-ons, which ensure our prepayment model error adjustments are consistent with simultaneous interest rate and implied volatility shocks. The resulting scenario specific prepayment model error adjustments are well defined, but potentially too narrow in scope to capture the full extent of prepayment error. Mortgage security OAS serves as a potentially broader measure of model error, which encompasses both misspecification and errors in forecasting model inputs.
Our OAS shocks are based upon historical six-month changes in spreads and calculated using data derived from competing prepayment models. In order to ensure consistency with shocks to other key risk factors, we model the relationship between six-month changes in spreads and contemporaneous changes in the term structure of interest rates. We then use these regression results to generate anticipated OAS shocks given a set of simultaneous and scenario specific interest rate changes. 21 .
While broad in scope, these shocks are based upon a set of specific vendor quotes, which are model dependent. We propose including changes to either OAS or prepayment rates when stress testing in order to more accurately measure market risk. We combine data from different models to arrive at a single set of shocks. For practical implementation this type of aggregation is desirable, but results in a loss of information regarding the distribution of shocks calculated using competing models. In forthcoming research, we plan to evaluate the tradeoffs between OAS and prepayment rate shocks by applying each set of shocks to a representative portfolio of mortgage assets and examining the resulting capital implications under a range of models and market environments. 22 .
References Babbel, David F. and Stavros A. Zenios, (1992) “Pitfalls in the Analysis of Option-Adjusted Spreads,” Financial Analysts Journal, Vol. 48, No.
4, pp. 65-69. Berkowitz, Jeremy, (1999) “A Coherent Framework for Stress-Testing,” FEDS Working Paper No. 99-29. Björk, Tomas and Bent J.
Christensen, (1999) “Interest Rate Dynamics and Consistent Forward Rate Curves,” Mathematical Finance, Vol. 9., No. 4, pp.
323-348. Bogin, Alexander N. and William M. Doerner, (2014) “Generating Historically-Based Stress Scenarios Using Parsimonious Factorization,” Journal of Risk Finance, Vol.
15, No. 5, pp. 591611. Borodovsky, Lev and Marc Lore, The Professional’s Handbook of Financial Risk Management, Woburn, MA: Butterworth-Heinemann, 2000. Burns, William, (2010) “Prepayment Modeling Challenges in the Wake of the 2008 Credit and Mortgage Crisis,” Interactive Data Fixed Income Analytics. Fabozzi, Frank J., Advances in the Valuation and Management of Mortgage-Backed Securities, John Wiley & Sons, In.c, 1999. Green, Jerry and John B.
Shoven, (1983) “The Effects of Interest Rates on Mortgage Prepayments,” NBER Working Paper No. 1246. Hayre, Lakhbir and Arvind Rajan, “Anatomy of Prepayments: The Salomon Brothers Prepayment Model,” Salomon Brothers Inc., June 1995. Heidari, Massoud and Liuren Wu, (2004) “What Constitutes a Good Model? An Analysis of Models for Mortgage Backed Securities,” Working Paper. Kopprasch, Robert W., (1994) “Option-Adjusted Spread Analysis: Going Down the Wrong Path?,” Financial Analysts Journal, Vol. 50, No.
3, pp. 42-47. Kupiec, Paul H. and Adama Kah, (1999) “On the Origin and Interpretation of OAS,” The Journal of Fixed Income, Vol.
9, No. 3, pp. 82-92. 23 .
Levin, Alexander and Andrew Davidson, (2005) “Prepayment Risk- and Option-Adjusted Valuation of MBS,” The Journal of Portfolio Management, Vol. 31, No. 4, pp. 73-85. Levin, Alexander and Andrew Davidson, (2008) “The Concept of Credit OAS in Valuation of MBS,” The Journal of Portfolio Management, Vol.
34, No. 3, pp. 41-55. Mason, Joseph and Josh Rosner, (2007) “Where Did the Risk Go? How Misapplied Bond Ratings Cause Mortgage Backed Securities and Collateralized Debt Obligation Market Disruptions,” Working Paper. Pritsker, Matthew, (2006) “The Hidden Dangers of Historical Simulation,” Journal of Banking and Finance, Vol.
30, pp. 561-582. Shleifer, Andrei, Inefficient Markets: An Introduction to Behavioral Finance, New York: Oxford University Press, 2000. 24 .


