


Description
A new normal,
or the bottom of
the cycle?
Mergers, acquisitions
and capital raising in
mining and metals —
2015 trends and
2016 outlook
The better the question.
The better the answer.
The better the world works.
. Contents
Executive summary
Widespread signs of distress
3
Mergers and
acquisitions
(M&A) trends
• Who is buying?
• Where are they buying?
6
Divestment: reducing
execution risk in a
buyers’ market
• What are they buying?
10
16
Capital raising trends
• Loans
• Bonds
• Convertible bonds
• Initial public offerings (IPOs)
• Follow-on equity
20
. Executive summary
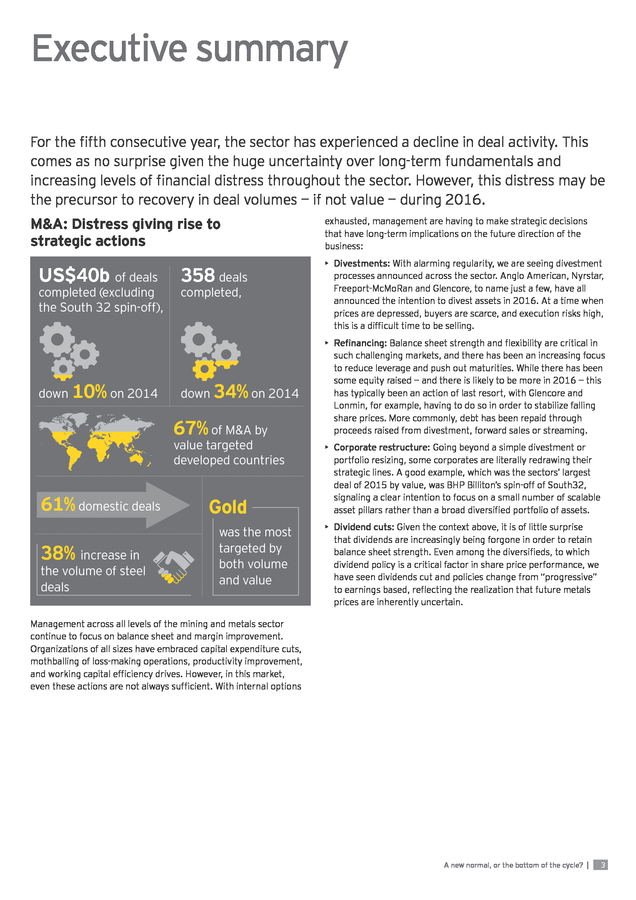
For the fifth consecutive year, the sector has experienced a decline in deal activity. This
comes as no surprise given the huge uncertainty over long-term fundamentals and
increasing levels of financial distress throughout the sector. However, this distress may be
the precursor to recovery in deal volumes — if not value — during 2016.
M&A: Distress giving rise to
strategic actions
US$40b of deals
completed (excluding
the South 32 spin-off),
down 10% on 2014
completed,
• Divestments: With alarming regularity, we are seeing divestment
processes announced across the sector. Anglo American, Nyrstar,
Freeport-McMoRan and Glencore, to name just a few, have all
announced the intention to divest assets in 2016.
At a time when prices are depressed, buyers are scarce, and execution risks high, this is a difficult time to be selling. down 34% on 2014 • Refinancing: Balance sheet strength and flexibility are critical in such challenging markets, and there has been an increasing focus to reduce leverage and push out maturities. While there has been some equity raised — and there is likely to be more in 2016 — this has typically been an action of last resort, with Glencore and Lonmin, for example, having to do so in order to stabilize falling share prices. More commonly, debt has been repaid through proceeds raised from divestment, forward sales or streaming. 358 deals 67% of M&A by value targeted developed countries 61% domestic deals 38% increase in the volume of steel deals exhausted, management are having to make strategic decisions that have long-term implications on the future direction of the business: Gold was the most targeted by both volume and value • Corporate restructure: Going beyond a simple divestment or portfolio resizing, some corporates are literally redrawing their strategic lines.
A good example, which was the sectors’ largest deal of 2015 by value, was BHP Billiton’s spin-off of South32, signaling a clear intention to focus on a small number of scalable asset pillars rather than a broad diversified portfolio of assets. • Dividend cuts: Given the context above, it is of little surprise that dividends are increasingly being forgone in order to retain balance sheet strength. Even among the diversifieds, to which dividend policy is a critical factor in share price performance, we have seen dividends cut and policies change from “progressive” to earnings based, reflecting the realization that future metals prices are inherently uncertain. Management across all levels of the mining and metals sector continue to focus on balance sheet and margin improvement. Organizations of all sizes have embraced capital expenditure cuts, mothballing of loss-making operations, productivity improvement, and working capital efficiency drives. However, in this market, even these actions are not always sufficient.
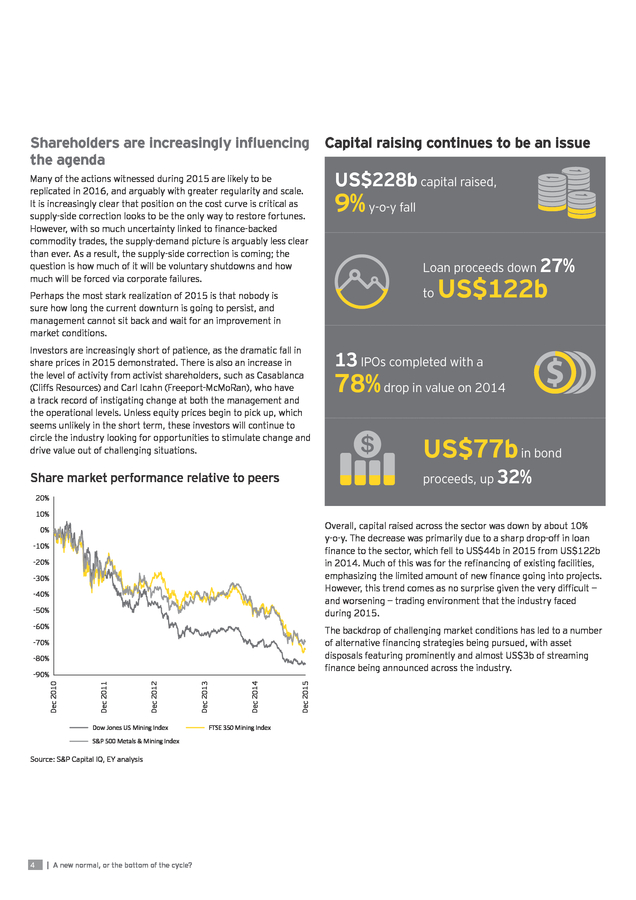
With internal options A new normal, or the bottom of the cycle? | 3 . Shareholders are increasingly influencing Capital raising continues to be an issue the agenda Many of the actions witnessed during 2015 are likely to be replicated in 2016, and arguably with greater regularity and scale. It is increasingly clear that position on the cost curve is critical as supply-side correction looks to be the only way to restore fortunes. However, with so much uncertainty linked to finance-backed commodity trades, the supply-demand picture is arguably less clear than ever. As a result, the supply-side correction is coming; the question is how much of it will be voluntary shutdowns and how much will be forced via corporate failures. Perhaps the most stark realization of 2015 is that nobody is sure how long the current downturn is going to persist, and management cannot sit back and wait for an improvement in market conditions. Investors are increasingly short of patience, as the dramatic fall in share prices in 2015 demonstrated. There is also an increase in the level of activity from activist shareholders, such as Casablanca (Cliffs Resources) and Carl Icahn (Freeport-McMoRan), who have a track record of instigating change at both the management and the operational levels. Unless equity prices begin to pick up, which seems unlikely in the short term, these investors will continue to circle the industry looking for opportunities to stimulate change and drive value out of challenging situations. US$228b capital raised, 9% y-o-y fall Loan proceeds down 27% to US$122b 13 IPOs completed with a 78% drop in value on 2014 US$77b in bond proceeds, up 32% Share market performance relative to peers 20% 10% Overall, capital raised across the sector was down by about 10% y-o-y.
The decrease was primarily due to a sharp drop-off in loan finance to the sector, which fell to US$44b in 2015 from US$122b in 2014. Much of this was for the refinancing of existing facilities, emphasizing the limited amount of new finance going into projects. However, this trend comes as no surprise given the very difficult — and worsening — trading environment that the industry faced during 2015. 0% -10% -20% -30% -40% -50% -60% The backdrop of challenging market conditions has led to a number of alternative financing strategies being pursued, with asset disposals featuring prominently and almost US$3b of streaming finance being announced across the industry. -70% -80% Dow Jones US Mining Index S&P 500 Metals & Mining Index Source: S&P Capital IQ, EY analysis 4 | A new normal, or the bottom of the cycle? FTSE 350 Mining Index Dec 2015 Dec 2014 Dec 2013 Dec 2012 Dec 2011 Dec 2010 -90% . Outlook: the face of M&A and capital raising will continue to evolve Gone are the megadeals with the unashamed focus on consolidating market share. At its 2007 peak, we saw over US$200b of deal value across the sector, with a small number of proposed deals at the time valued well in excess of US$70b. This deal rationale has limited currency in the sector right now; size is not all-important, but instead the focus is on higher returns on capital, greater optionality and flexibility across asset portfolios, and an improved cost curve position. The following are the key M&A trends that EY sees continuing into 2016. • Sell-side will continue to be the catalyst for M&A, with assets going to market from distressed sellers in need of capital. This isn’t expected to turn into a mass fire sale, but there is clearly a greater “push” from sellers than a “pull” from willing buyers.
The challenge for those divesting is to present the asset properly so that buyers remain confident in the underlying valuation and a competitive process is maintained. • Private capital may well be the new face of M&A across the sector, but it doesn’t yet dominate proceedings and may forever be a relatively small player in the sector’s overall deal activity. Both Magris Resources and Audley Capital demonstrated in 2015 that deals were to be done by specialist funds with a focus on the sector. The model looks more attractive than ever given the relative value of potential targets and the increasingly distressed disposition of sellers. EY expects to see a greater volume of deals completed by these funds during 2016.
But, with a significant increase in assets available for sale, only the best assets will attract their focus and pricing will remain disciplined. • Deferred consideration appears to be growing in popularity, while previously it was largely unheard of in the sector. For example, Anglo American has shown it is prepared to consider bids with upside with the sale of Anglo Norte SA and Rustenburg. With increased sales processes, limited buyers and extreme price uncertainty, EY expects to see a greater level of deals incorporating deferred consideration in 2016. value deal, BHP Billiton’s spin-off of South32, which raised a number of contrasting views on the process. Whether sparked by the South32 process, or otherwise, the idea of packaged asset spin-offs increasingly feature in boardroom discussions. The challenge in a distressed situation is the level of working capital required to go with the spun-off entity in order for it to survive independently; capital that is much needed for both parties and can often be the critical factor in preventing such a deal from successfully completing.
Given this challenge, spin-offs are expected to continue to be high on the strategic agenda, but relatively few will actually consummate during 2016. • Joint ventures and mergers of equals have also grown in popularity as companies look to leverage synergies and economies of scale in challenging market conditions. Despite the difficulties, a merger of equals can be successfully structured, as demonstrated by Alamos Gold and Aurico Gold’s US$1.5b combination during the year. On the flip side, as the recent discussions between Randgold and AngloGold Ashanti over the redevelopment of the Obuasi mine demonstrate, getting two parties to agree on the terms of such a deal is incredibly challenging.
EY expects to see a greater level of mergers and joint ventures pursued during 2016, with the key focus on derisking and preserving capital; the challenges around execution will remain very high, but an acute need to consummate will drive deals through. In terms of capital raising, the financing markets are expected to remain challenging in the year ahead, with corporate rating agencies taking a very close look at future cash generation and corporate refinancing strategies. Likewise, the availability of equity will remain an option of last resort only and will be highly dilutive to those looking to raise secondary equity. Now would appear to be the time for well-capitalized producers to look at lending opportunities into the sector that position them for future strategic growth and alternative finance providers to evaluate the opportunities in distress.
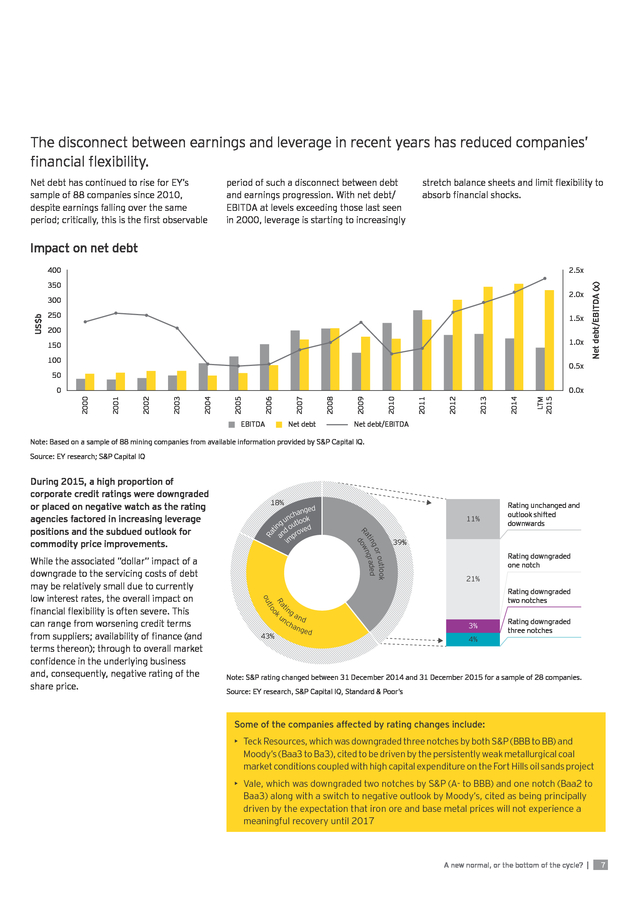
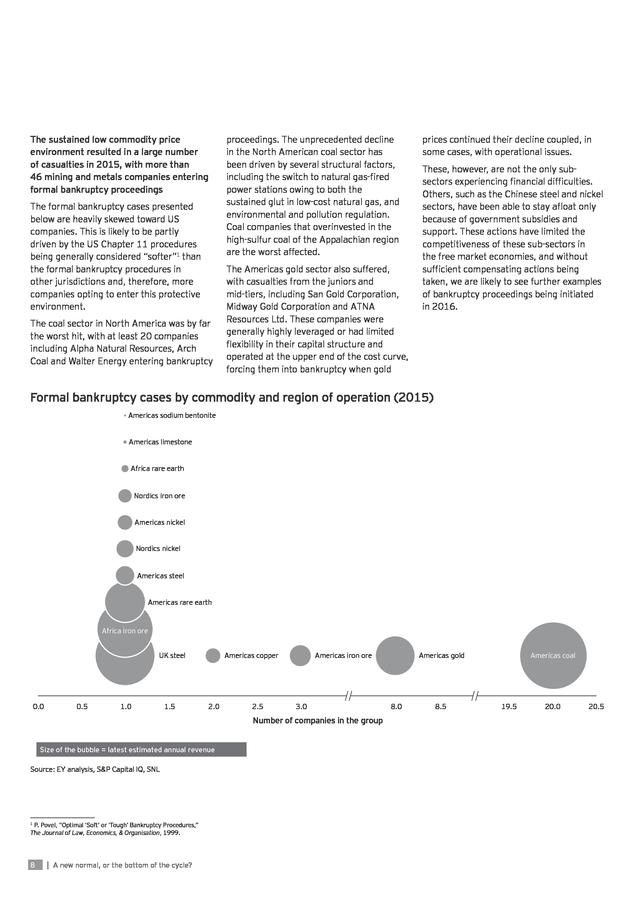
World-class assets trapped in difficult corporate situations may still provide strong financial returns to the canny investor. • Spin-offs are emerging as a key consideration for the diversified producers. This is perhaps best illustrated by this year’s highest A new normal, or the bottom of the cycle? | 5 . 01 6 | A new normal, or the bottom of the cycle? Widespread signs of distress . The disconnect between earnings and leverage in recent years has reduced companies’ financial flexibility. Net debt has continued to rise for EY’s sample of 88 companies since 2010, despite earnings falling over the same period; critically, this is the first observable period of such a disconnect between debt and earnings progression. With net debt/ EBITDA at levels exceeding those last seen in 2000, leverage is starting to increasingly stretch balance sheets and limit flexibility to absorb financial shocks. Impact on net debt 2.5x 350 2.0x US$b 300 250 1.5x 200 1.0x 150 100 Net debt/EBITDA (x) 400 0.5x 50 EBITDA Net debt LTM 2015 2014 2013 2012 2011 2010 2009 2008 2007 2006 2005 2004 2003 2002 2001 0.0x 2000 0 Net debt/EBITDA Note: Based on a sample of 88 mining companies from available information provided by S&P Capital IQ. Source: EY research; S&P Capital IQ i Ra ti a nged cha un tlook ng ou ed nd prov m 11% 43% Rating unchanged and outlook shifted downwards 39% Rating downgraded one notch 21% Rating downgraded two notches t Ra k lo o o ut While the associated ”dollar” impact of a downgrade to the servicing costs of debt may be relatively small due to currently low interest rates, the overall impact on financial flexibility is often severe. This can range from worsening credit terms from suppliers; availability of finance (and terms thereon); through to overall market confidence in the underlying business and, consequently, negative rating of the share price. 18% o r outlo k go tin graded Ra own d During 2015, a high proportion of corporate credit ratings were downgraded or placed on negative watch as the rating agencies factored in increasing leverage positions and the subdued outlook for commodity price improvements. in g un a n d ch ang ed 3% 4% Rating downgraded three notches Note: S&P rating changed between 31 December 2014 and 31 December 2015 for a sample of 28 companies. Source: EY research, S&P Capital IQ, Standard & Poor’s Some of the companies affected by rating changes include: • Teck Resources, which was downgraded three notches by both S&P (BBB to BB) and Moody’s (Baa3 to Ba3), cited to be driven by the persistently weak metallurgical coal market conditions coupled with high capital expenditure on the Fort Hills oil sands project • Vale, which was downgraded two notches by S&P (A- to BBB) and one notch (Baa2 to Baa3) along with a switch to negative outlook by Moody’s, cited as being principally driven by the expectation that iron ore and base metal prices will not experience a meaningful recovery until 2017 A new normal, or the bottom of the cycle? | 7 . The sustained low commodity price environment resulted in a large number of casualties in 2015, with more than 46 mining and metals companies entering formal bankruptcy proceedings The formal bankruptcy cases presented below are heavily skewed toward US companies. This is likely to be partly driven by the US Chapter 11 procedures being generally considered “softer”1 than the formal bankruptcy procedures in other jurisdictions and, therefore, more companies opting to enter this protective environment. The coal sector in North America was by far the worst hit, with at least 20 companies including Alpha Natural Resources, Arch Coal and Walter Energy entering bankruptcy proceedings. The unprecedented decline in the North American coal sector has been driven by several structural factors, including the switch to natural gas-fired power stations owing to both the sustained glut in low-cost natural gas, and environmental and pollution regulation. Coal companies that overinvested in the high-sulfur coal of the Appalachian region are the worst affected. The Americas gold sector also suffered, with casualties from the juniors and mid-tiers, including San Gold Corporation, Midway Gold Corporation and ATNA Resources Ltd. These companies were generally highly leveraged or had limited flexibility in their capital structure and operated at the upper end of the cost curve, forcing them into bankruptcy when gold prices continued their decline coupled, in some cases, with operational issues. These, however, are not the only subsectors experiencing financial difficulties. Others, such as the Chinese steel and nickel sectors, have been able to stay afloat only because of government subsidies and support.
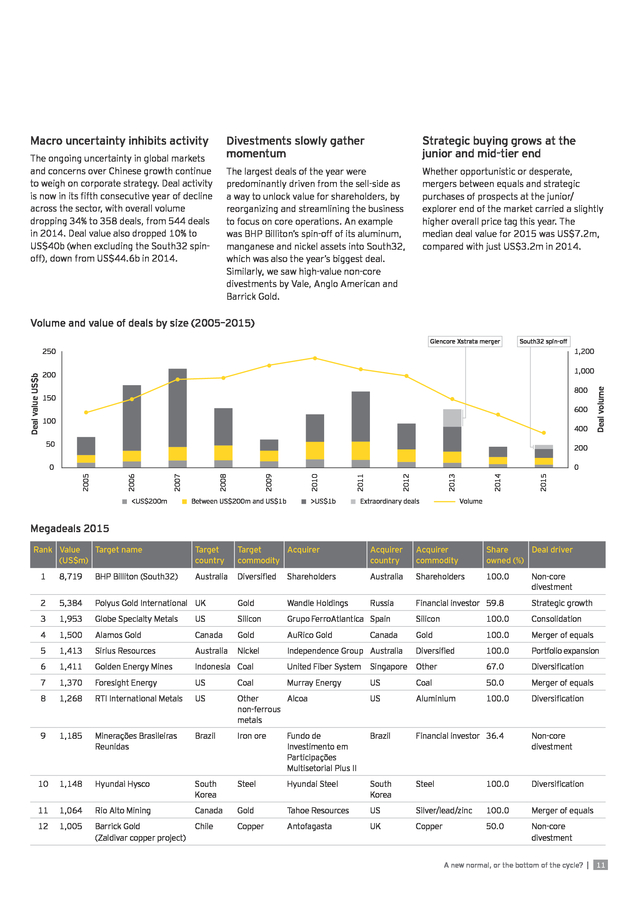
These actions have limited the competitiveness of these sub-sectors in the free market economies, and without sufficient compensating actions being taken, we are likely to see further examples of bankruptcy proceedings being initiated in 2016. Formal bankruptcy cases by commodity and region of operation (2015) Americas sodium bentonite Americas limestone Africa rare earth Nordics iron ore Americas nickel Nordics nickel Americas steel Americas rare earth Africa iron ore Americas copper UK steel 0.0 0.5 1.0 1.5 2.0 2.5 Americas iron ore 3.0 Number of companies in the group Size of the bubble = latest estimated annual revenue Source: EY analysis, S&P Capital IQ, SNL P. Povel, “Optimal ‘Soft’ or ‘Tough’ Bankruptcy Procedures,” The Journal of Law, Economics, & Organisation, 1999. 1 8 | A new normal, or the bottom of the cycle? Americas coal Americas gold 8.0 8.5 19.5 20.0 20.5 . A new normal, or the bottom of the cycle? | 9 . 02 M&A trends 10 | A new normal, or the bottom of the cycle? . Macro uncertainty inhibits activity Divestments slowly gather momentum The largest deals of the year were predominantly driven from the sell-side as a way to unlock value for shareholders, by reorganizing and streamlining the business to focus on core operations. An example was BHP Billiton’s spin-off of its aluminum, manganese and nickel assets into South32, which was also the year’s biggest deal. Similarly, we saw high-value non-core divestments by Vale, Anglo American and Barrick Gold. The ongoing uncertainty in global markets and concerns over Chinese growth continue to weigh on corporate strategy. Deal activity is now in its fifth consecutive year of decline across the sector, with overall volume dropping 34% to 358 deals, from 544 deals in 2014. Deal value also dropped 10% to US$40b (when excluding the South32 spinoff), down from US$44.6b in 2014. Strategic buying grows at the junior and mid-tier end Whether opportunistic or desperate, mergers between equals and strategic purchases of prospects at the junior/ explorer end of the market carried a slightly higher overall price tag this year.
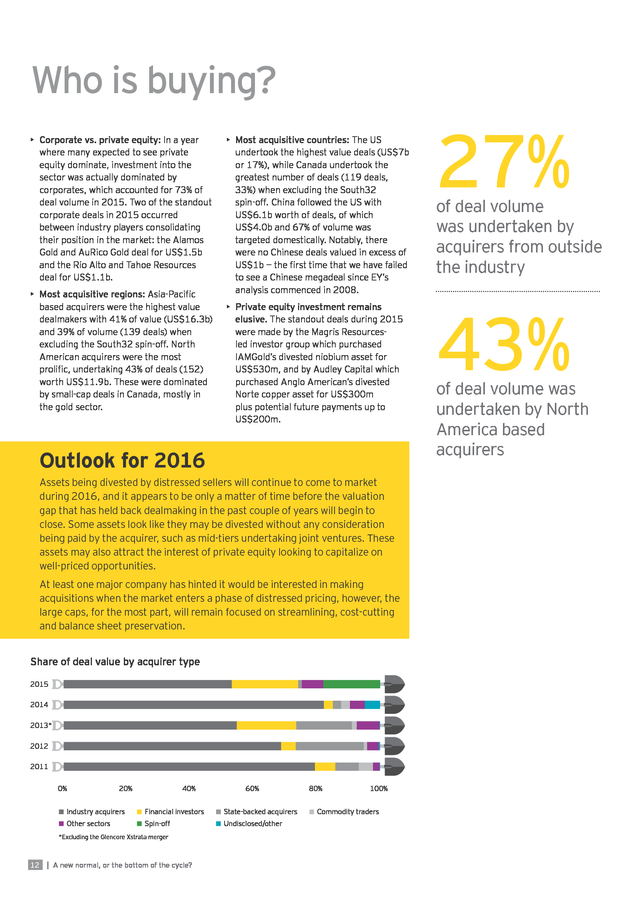
The median deal value for 2015 was US$7.2m, compared with just US$3.2m in 2014. Volume and value of deals by size (2005–2015) Glencore Xstrata merger South32 spin-off 1,200 1,000 200 800 150 600 100 400 50 Deal volume Deal value US$b 250 200 0 <US$200m Between US$200m and US$1b >US$1b Extraordinary deals 2015 2014 2013 2012 2011 2010 2009 2008 2007 2006 2005 0 Volume Megadeals 2015 Rank Value Target name (US$m) Target country Target Acquirer commodity Acquirer country Acquirer commodity Share Deal driver owned (%) Australia Diversified Shareholders Australia Shareholders 100.0 Russia Financial investor 59.8 Strategic growth Silicon Consolidation 1 8,719 BHP Billiton (South32) 2 5,384 Polyus Gold International UK Gold Wandle Holdings 3 1,953 Globe Specialty Metals Silicon Grupo FerroAtlantica Spain US 4 1,500 Alamos Gold Canada Gold AuRico Gold 5 1,413 Sirius Resources Australia Nickel Independence Group Australia Canada 6 1,411 Golden Energy Mines Indonesia Coal United Fiber System 7 1,370 Foresight Energy US Coal Murray Energy 8 1,268 RTI International Metals US 9 1,185 Minerações Brasileiras Reunidas 10 1,148 Hyundai Hysco 100.0 Non-core divestment Gold 100.0 Merger of equals Diversified 100.0 Portfolio expansion Singapore Other 67.0 Diversification US Coal 50.0 Merger of equals Other Alcoa non-ferrous metals US Aluminium 100.0 Diversification Brazil Iron ore Fundo de Investimento em Participações Multisetorial Plus II Brazil Financial investor 36.4 Non-core divestment South Korea Steel Hyundai Steel South Korea Steel Diversification 100.0 11 1,064 Rio Alto Mining Canada Gold Tahoe Resources US Silver/lead/zinc 100.0 Merger of equals 12 1,005 Barrick Gold (Zaldivar copper project) Chile Copper Antofagasta UK Copper 50.0 Non-core divestment A new normal, or the bottom of the cycle? | 11 . Who is buying? • Corporate vs. private equity: In a year where many expected to see private equity dominate, investment into the sector was actually dominated by corporates, which accounted for 73% of deal volume in 2015. Two of the standout corporate deals in 2015 occurred between industry players consolidating their position in the market: the Alamos Gold and AuRico Gold deal for US$1.5b and the Rio Alto and Tahoe Resources deal for US$1.1b. • Most acquisitive regions: Asia-Pacific based acquirers were the highest value dealmakers with 41% of value (US$16.3b) and 39% of volume (139 deals) when excluding the South32 spin-off. North American acquirers were the most prolific, undertaking 43% of deals (152) worth US$11.9b.
These were dominated by small-cap deals in Canada, mostly in the gold sector. • Most acquisitive countries: The US undertook the highest value deals (US$7b or 17%), while Canada undertook the greatest number of deals (119 deals, 33%) when excluding the South32 spin-off. China followed the US with US$6.1b worth of deals, of which US$4.0b and 67% of volume was targeted domestically. Notably, there were no Chinese deals valued in excess of US$1b — the first time that we have failed to see a Chinese megadeal since EY’s analysis commenced in 2008. • Private equity investment remains elusive.
The standout deals during 2015 were made by the Magris Resourcesled investor group which purchased IAMGold’s divested niobium asset for US$530m, and by Audley Capital which purchased Anglo American’s divested Norte copper asset for US$300m plus potential future payments up to US$200m. Outlook for 2016 Assets being divested by distressed sellers will continue to come to market during 2016, and it appears to be only a matter of time before the valuation gap that has held back dealmaking in the past couple of years will begin to close. Some assets look like they may be divested without any consideration being paid by the acquirer, such as mid-tiers undertaking joint ventures. These assets may also attract the interest of private equity looking to capitalize on well-priced opportunities. At least one major company has hinted it would be interested in making acquisitions when the market enters a phase of distressed pricing, however, the large caps, for the most part, will remain focused on streamlining, cost-cutting and balance sheet preservation. Share of deal value by acquirer type 2015 2014 2013* 2012 2011 0% 20% 40% 60% Industry acquirers Financial investors State-backed acquirers Other sectors Spin-off Undisclosed/other *Excluding the Glencore Xstrata merger 12 | A new normal, or the bottom of the cycle? 80% 100% Commodity traders 27% of deal volume was undertaken by acquirers from outside the industry 43% of deal volume was undertaken by North America based acquirers .
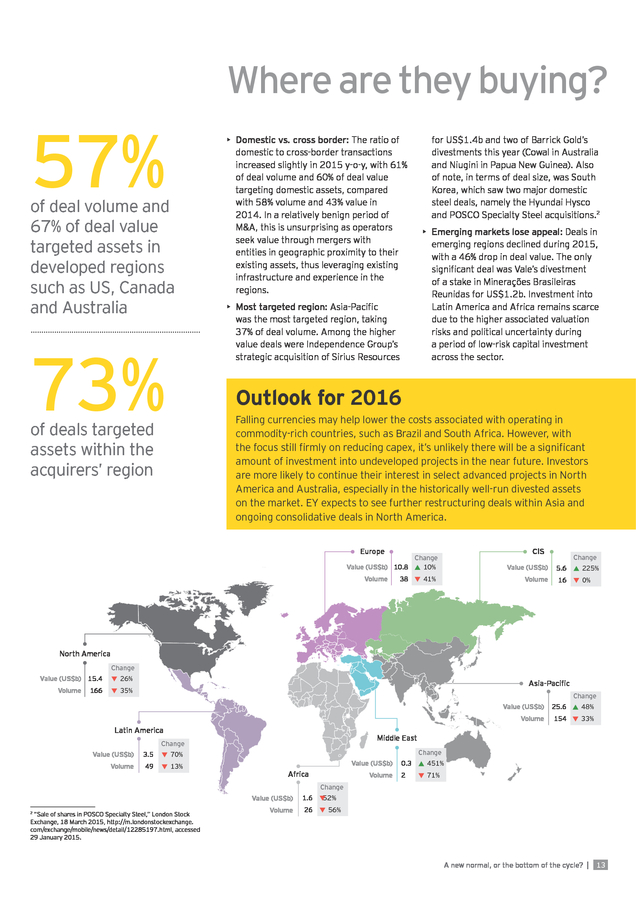
Where are they buying? 57% of deal volume and 67% of deal value targeted assets in developed regions such as US, Canada and Australia 73% • Domestic vs. cross border: The ratio of domestic to cross-border transactions increased slightly in 2015 y-o-y, with 61% of deal volume and 60% of deal value targeting domestic assets, compared with 58% volume and 43% value in 2014. In a relatively benign period of M&A, this is unsurprising as operators seek value through mergers with entities in geographic proximity to their existing assets, thus leveraging existing infrastructure and experience in the regions. • Most targeted region: Asia-Pacific was the most targeted region, taking 37% of deal volume. Among the higher value deals were Independence Group’s strategic acquisition of Sirius Resources for US$1.4b and two of Barrick Gold’s divestments this year (Cowal in Australia and Niugini in Papua New Guinea).
Also of note, in terms of deal size, was South Korea, which saw two major domestic steel deals, namely the Hyundai Hysco and POSCO Specialty Steel acquisitions.2 • Emerging markets lose appeal: Deals in emerging regions declined during 2015, with a 46% drop in deal value. The only significant deal was Vale’s divestment of a stake in Minerações Brasileiras Reunidas for US$1.2b. Investment into Latin America and Africa remains scarce due to the higher associated valuation risks and political uncertainty during a period of low-risk capital investment across the sector. Outlook for 2016 Falling currencies may help lower the costs associated with operating in commodity-rich countries, such as Brazil and South Africa.
However, with the focus still firmly on reducing capex, it’s unlikely there will be a significant amount of investment into undeveloped projects in the near future. Investors are more likely to continue their interest in select advanced projects in North America and Australia, especially in the historically well-run divested assets on the market. EY expects to see further restructuring deals within Asia and ongoing consolidative deals in North America. of deals targeted assets within the acquirers’ region Europe CIS Change 10% Value (US$b) 10.8 Volume 38 Change Value (US$b) 225% Volume 41% 5.6 16 0% North America Change Value (US$b) 15.4 26% Volume 35% 166 Asia-Paciï¬c Change Value (US$b) 3.5 49 13% 33% Change 70% Volume 154 Middle East Change Value (US$b) 48% Volume Latin America 25.6 Value (US$b) Africa Volume 0.3 451% 2 71% Change Value (US$b) “Sale of shares in POSCO Specialty Steel,” London Stock Exchange, 18 March 2015, http://m.londonstockexchange. com/exchange/mobile/news/detail/12285197.html, accessed 29 January 2015. 2 1.6 Volume 26 52% 56% A new normal, or the bottom of the cycle? | 13 .
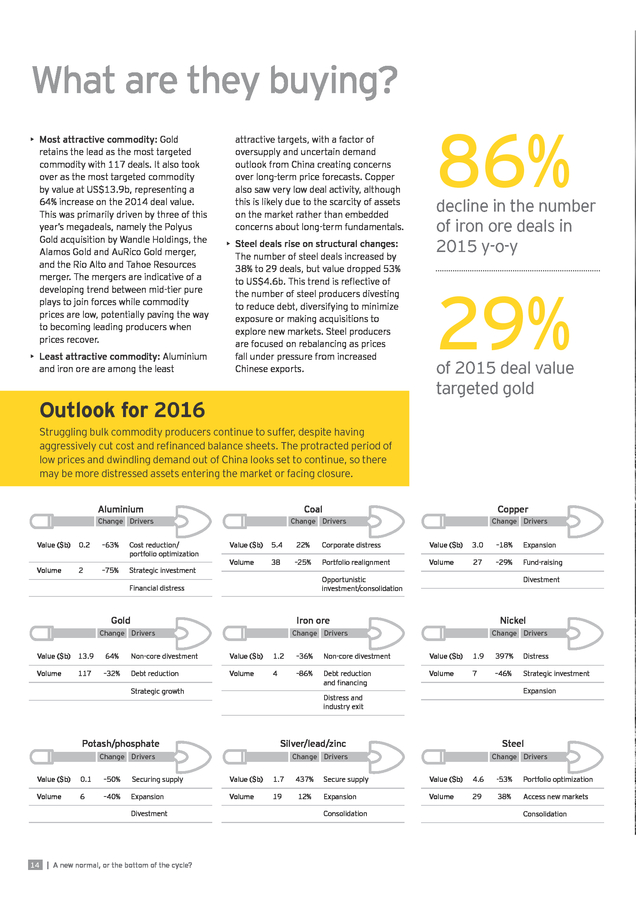
What are they buying? • Most attractive commodity: Gold retains the lead as the most targeted commodity with 117 deals. It also took over as the most targeted commodity by value at US$13.9b, representing a 64% increase on the 2014 deal value. This was primarily driven by three of this year’s megadeals, namely the Polyus Gold acquisition by Wandle Holdings, the Alamos Gold and AuRico Gold merger, and the Rio Alto and Tahoe Resources merger. The mergers are indicative of a developing trend between mid-tier pure plays to join forces while commodity prices are low, potentially paving the way to becoming leading producers when prices recover. • Least attractive commodity: Aluminium and iron ore are among the least attractive targets, with a factor of oversupply and uncertain demand outlook from China creating concerns over long-term price forecasts. Copper also saw very low deal activity, although this is likely due to the scarcity of assets on the market rather than embedded concerns about long-term fundamentals. • Steel deals rise on structural changes: The number of steel deals increased by 38% to 29 deals, but value dropped 53% to US$4.6b.
This trend is reflective of the number of steel producers divesting to reduce debt, diversifying to minimize exposure or making acquisitions to explore new markets. Steel producers are focused on rebalancing as prices fall under pressure from increased Chinese exports. Outlook for 2016 86% decline in the number of iron ore deals in 2015 y-o-y 29% of 2015 deal value targeted gold Struggling bulk commodity producers continue to suffer, despite having aggressively cut cost and refinanced balance sheets. The protracted period of low prices and dwindling demand out of China looks set to continue, so there may be more distressed assets entering the market or facing closure. Aluminium Coal Value ($b) 0.2 –63% Cost reduction/ portfolio optimization Volume 2 –75% Strategic investment Copper Change Drivers Change Drivers Change Drivers Value ($b) 5.4 22% Corporate distress Value ($b) 3.0 –18% Expansion Volume 38 –25% Portfolio realignment Volume 27 –29% Fund-raising Divestment Opportunistic investment/consolidation Financial distress Gold Iron ore Change Drivers Nickel Change Drivers Change Drivers Value ($b) 13.9 64% Non-core divestment Value ($b) 1.2 –36% Non-core divestment Value ($b) 1.9 397% Distress Volume 117 –32% Debt reduction Volume 4 –86% Debt reduction and ï¬nancing Volume 7 –46% Strategic investment Strategic growth Potash/phosphate Change Drivers Value ($b) 0.1 –50% Securing supply Value ($b) 1.7 437% Volume 6 –40% Expansion Volume 19 12% 14 | A new normal, or the bottom of the cycle? Steel Silver/lead/zinc Change Drivers Divestment Expansion Distress and industry exit Change Drivers Secure supply Value ($b) 4.6 -53% Portfolio optimization Expansion Volume 29 38% Access new markets Consolidation Consolidation .
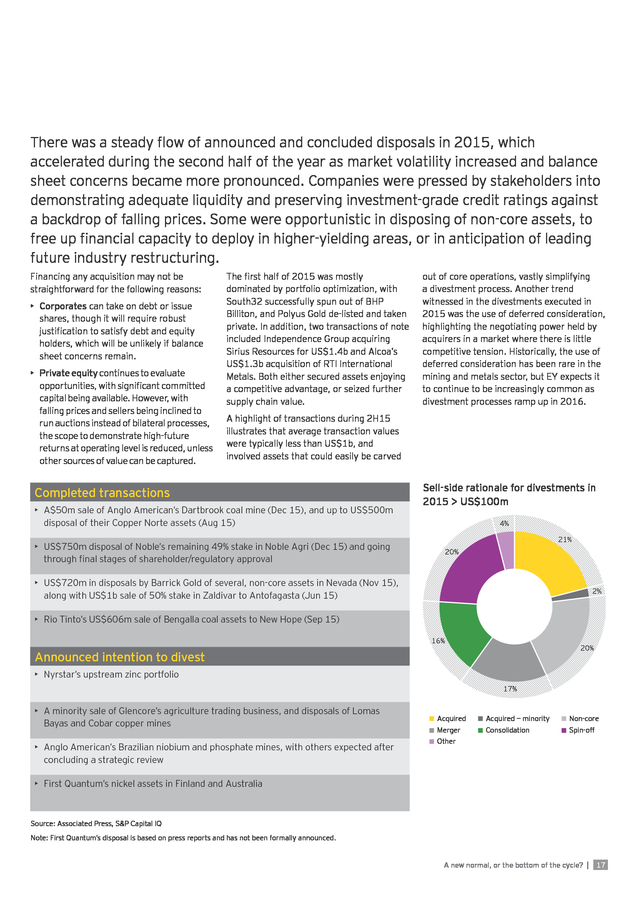
A new normal, or the bottom of the cycle? | 15 . 03 16 | A new normal, or the bottom of the cycle? How do you reduce execution risk in a buyers’ market? . There was a steady flow of announced and concluded disposals in 2015, which accelerated during the second half of the year as market volatility increased and balance sheet concerns became more pronounced. Companies were pressed by stakeholders into demonstrating adequate liquidity and preserving investment-grade credit ratings against a backdrop of falling prices. Some were opportunistic in disposing of non-core assets, to free up financial capacity to deploy in higher-yielding areas, or in anticipation of leading future industry restructuring. Financing any acquisition may not be straightforward for the following reasons: • Corporates can take on debt or issue shares, though it will require robust justification to satisfy debt and equity holders, which will be unlikely if balance sheet concerns remain. • Private equity continues to evaluate opportunities, with significant committed capital being available. However, with falling prices and sellers being inclined to run auctions instead of bilateral processes, the scope to demonstrate high-future returns at operating level is reduced, unless other sources of value can be captured. The first half of 2015 was mostly dominated by portfolio optimization, with South32 successfully spun out of BHP Billiton, and Polyus Gold de-listed and taken private.
In addition, two transactions of note included Independence Group acquiring Sirius Resources for US$1.4b and Alcoa’s US$1.3b acquisition of RTI International Metals. Both either secured assets enjoying a competitive advantage, or seized further supply chain value. out of core operations, vastly simplifying a divestment process. Another trend witnessed in the divestments executed in 2015 was the use of deferred consideration, highlighting the negotiating power held by acquirers in a market where there is little competitive tension.
Historically, the use of deferred consideration has been rare in the mining and metals sector, but EY expects it to continue to be increasingly common as divestment processes ramp up in 2016. A highlight of transactions during 2H15 illustrates that average transaction values were typically less than US$1b, and involved assets that could easily be carved Completed transactions • A$50m sale of Anglo American’s Dartbrook coal mine (Dec 15), and up to US$500m disposal of their Copper Norte assets (Aug 15) • US$750m disposal of Noble’s remaining 49% stake in Noble Agri (Dec 15) and going through final stages of shareholder/regulatory approval Sell-side rationale for divestments in 2015 > US$100m 4% 21% 20% • US$720m in disposals by Barrick Gold of several, non-core assets in Nevada (Nov 15), along with US$1b sale of 50% stake in Zaldivar to Antofagasta (Jun 15) 2% • Rio Tinto’s US$606m sale of Bengalla coal assets to New Hope (Sep 15) 16% 20% Announced intention to divest • Nyrstar’s upstream zinc portfolio 17% • A minority sale of Glencore’s agriculture trading business, and disposals of Lomas Bayas and Cobar copper mines • Anglo American’s Brazilian niobium and phosphate mines, with others expected after concluding a strategic review Acquired Acquired — minority Non-core Merger Other Consolidation Spin-off • First Quantum’s nickel assets in Finland and Australia Source: Associated Press, S&P Capital IQ Note: First Quantum’s disposal is based on press reports and has not been formally announced. A new normal, or the bottom of the cycle? | 17 . A total of 77% sell-side disposals during 2015 appear to have been motivated by: • Strengthening balance sheets and overall liquidity • Lowering cash costs through the sale of non-core assets or entering into mergers to realize synergies • Focusing on specific commodities and/or geographies, also through non-core asset sales, or spinning off assets • Attempting to share the cost of developing assets by disposing of minority stakes Not all these transactions may have been prompted by management strategies, with external factors including pressure from stakeholders, which materialized in lower share prices, or rising debt yields. This in turn may have encouraged divestments otherwise not considered, or accelerated such plans. Equally, not all divestments have sought to improve credit metrics. Rio Tinto’s disposal of its Bengalla coal mine has augmented a repositioning toward bauxite, with a US$1.9b capex commitment to developing its Amrun mine announced in November. Ivanhoe’s sale of a 49.5% stake in the Kamoa project to Zijin Mining, while raising capital, has also enabled project development risk and capital costs to be shared. 18 | A new normal, or the bottom of the cycle? Best practices in maximizing divestment value 44% of PE buyers say lack of confidence in information is the most significant factor that causes a PE firm to reduce its offer price or walk away from the deal Source: EY Global Corporate Divestment Study 2016 33% more companies generate a sale price above expectations with an operational separation plan Source: EY Global Corporate Divestment Study 2016 The importance of correctly structuring a divestment process will prove essential in generating and sustaining sufficient competitive tension prior to financial close. With a glut of assets available, a scarcity of capital and continued risk aversion requiring higher returns to justify acquisitions, poor structuring can undermine the value attained even from disposing of highquality, tier 1 assets. This is exacerbated by market conditions prompting sellers to run accelerated sale processes, which combined with the limited attention span of investors underlines the value from comprehensive preparations. This in turn can help guide and satisfactorily de-risk operating characteristics without compromising deal value, reinforce transaction upside and facilitate a smooth process without distracting management from core activities. Preparing for divestment In combination with understanding how best to package a disposal relative to investor appetite, there are several factors that can help increase both sale proceeds and the speed of execution. • Preparation of equity story: An external review of financial and operating data, besides documentation and data-room preparations, can help identify and .
critique potential productivity and working capital improvements while substantiating capex plans to support growth scenarios. For cost reduction and working capital improvements already implemented, it is important to evidence the sustainability of the actions taken. • Anticipating transaction risks: Examples may include receiving regulatory approval to transfer licenses, quantifying site reclamation or restructuring costs and gaining the support of labor unions. Foreseeing these items and being upfront with bidders about the actions being taken can guard against delays while protecting disposal value. • Tax planning and optimization: Evaluating how different disposal options will impact net proceeds received, and any post-transaction arrangements, in conjunction with strategies available to investors, may help apportion further value to the seller. • Disentangling company-to-company dependency: This can vary from implementing suitable transfer pricing arrangements, separating IT and ERP systems, to successfully transitioning HR processes and liabilities (e.g., pensions) to a new owner. Although preferences will differ between bidders with respect to how and what interdependent elements of the business are separated, it is important for a seller to be able to clearly articulate the “as is” position prior to commencing the sales process. Optimally, the business would look to embed improvements 12–18 months prior to the sales process to demonstrate to potential buyers that these savings can be realized and sustained over the long term. However, this may not be possible in the current environment. Alternatively, vendors should ensure sufficient data is provided in the seller documentation to illustrate how such savings will be achieved and the costs/ process to achieve these savings.
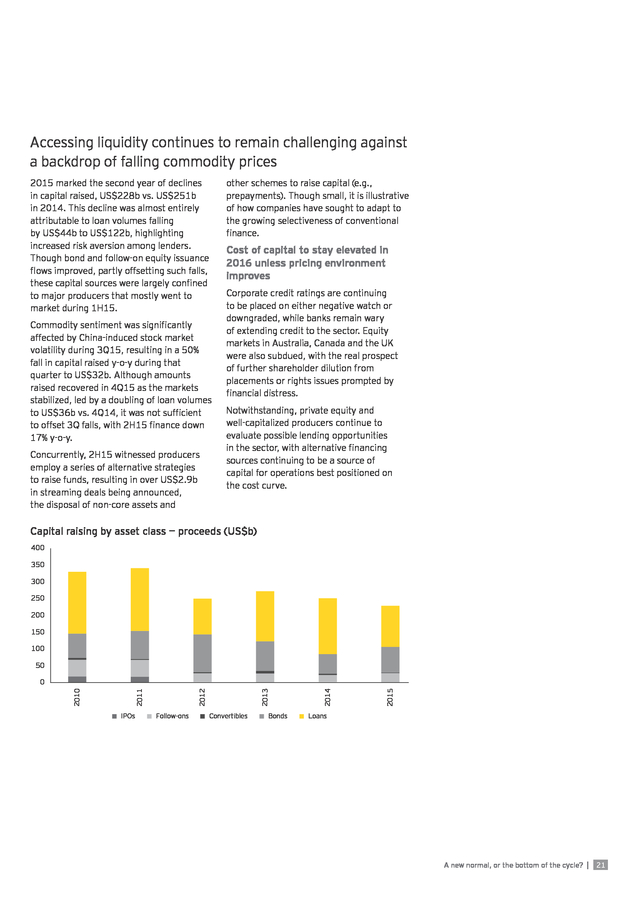
If the speed of execution is critical, ”quick wins” may still generate value. Outlook for 2016 The year will likely see further sale announcements of non-core assets, in conjunction with announced disposals reaching financial close. However, ongoing price volatility could see hostile takeover bids from better capitalized entities, but only where the target operates desirable, low-cost assets in stable jurisdictions. A new normal, or the bottom of the cycle? | 19 . 02 20 | A new normal, or the bottom of the cycle? Capital raising . Accessing liquidity continues to remain challenging against a backdrop of falling commodity prices 2015 marked the second year of declines in capital raised, US$228b vs. US$251b in 2014. This decline was almost entirely attributable to loan volumes falling by US$44b to US$122b, highlighting increased risk aversion among lenders. Though bond and follow-on equity issuance flows improved, partly offsetting such falls, these capital sources were largely confined to major producers that mostly went to market during 1H15. Commodity sentiment was significantly affected by China-induced stock market volatility during 3Q15, resulting in a 50% fall in capital raised y-o-y during that quarter to US$32b. Although amounts raised recovered in 4Q15 as the markets stabilized, led by a doubling of loan volumes to US$36b vs.
4Q14, it was not sufficient to offset 3Q falls, with 2H15 finance down 17% y-o-y. Concurrently, 2H15 witnessed producers employ a series of alternative strategies to raise funds, resulting in over US$2.9b in streaming deals being announced, the disposal of non-core assets and other schemes to raise capital (e.g., prepayments). Though small, it is illustrative of how companies have sought to adapt to the growing selectiveness of conventional finance. Cost of capital to stay elevated in 2016 unless pricing environment improves Corporate credit ratings are continuing to be placed on either negative watch or downgraded, while banks remain wary of extending credit to the sector. Equity markets in Australia, Canada and the UK were also subdued, with the real prospect of further shareholder dilution from placements or rights issues prompted by financial distress. Notwithstanding, private equity and well-capitalized producers continue to evaluate possible lending opportunities in the sector, with alternative financing sources continuing to be a source of capital for operations best positioned on the cost curve. Capital raising by asset class — proceeds (US$b) 400 350 300 250 200 150 100 50 IPOs Follow-ons Convertibles Bonds 2015 2014 2013 2012 2011 2010 0 Loans A new normal, or the bottom of the cycle? | 21 .
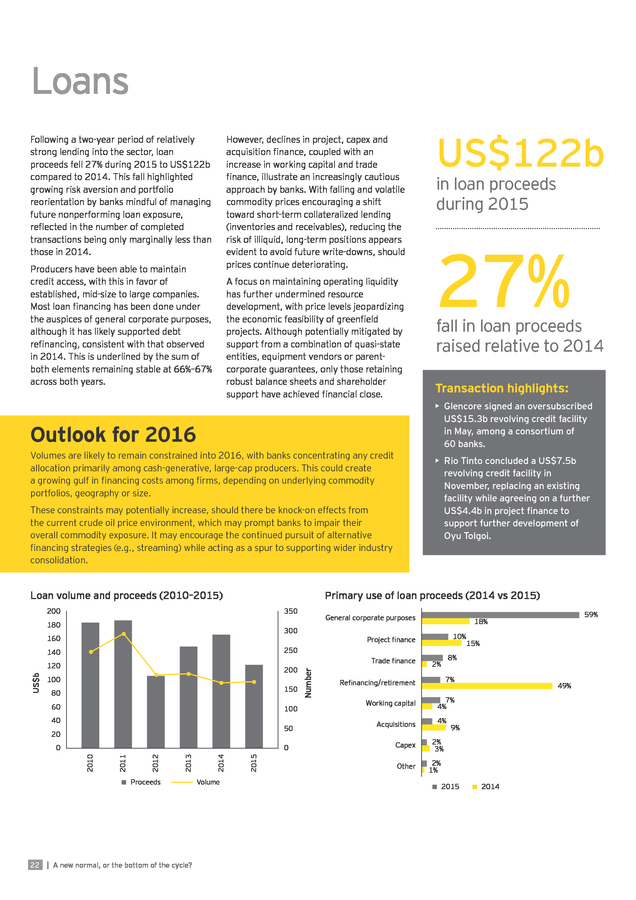
Loans Following a two-year period of relatively strong lending into the sector, loan proceeds fell 27% during 2015 to US$122b compared to 2014. This fall highlighted growing risk aversion and portfolio reorientation by banks mindful of managing future nonperforming loan exposure, reflected in the number of completed transactions being only marginally less than those in 2014. However, declines in project, capex and acquisition finance, coupled with an increase in working capital and trade finance, illustrate an increasingly cautious approach by banks. With falling and volatile commodity prices encouraging a shift toward short-term collateralized lending (inventories and receivables), reducing the risk of illiquid, long-term positions appears evident to avoid future write-downs, should prices continue deteriorating. Producers have been able to maintain credit access, with this in favor of established, mid-size to large companies. Most loan financing has been done under the auspices of general corporate purposes, although it has likely supported debt refinancing, consistent with that observed in 2014. This is underlined by the sum of both elements remaining stable at 66%–67% across both years. A focus on maintaining operating liquidity has further undermined resource development, with price levels jeopardizing the economic feasibility of greenfield projects.
Although potentially mitigated by support from a combination of quasi-state entities, equipment vendors or parentcorporate guarantees, only those retaining robust balance sheets and shareholder support have achieved financial close. Outlook for 2016 Volumes are likely to remain constrained into 2016, with banks concentrating any credit allocation primarily among cash-generative, large-cap producers. This could create a growing gulf in financing costs among firms, depending on underlying commodity portfolios, geography or size. 350 180 fall in loan proceeds raised relative to 2014 Transaction highlights: • Glencore signed an oversubscribed US$15.3b revolving credit facility in May, among a consortium of 60 banks. General corporate purposes 300 160 10% 15% Project ï¬nance 200 100 150 80 60 100 40 50 20 0 Proceeds | A new normal, or the bottom of the cycle? Volume 2015 2014 2013 2012 2011 2010 0 Trade ï¬nance Number 120 8% 2% Reï¬nancing/retirement 7% Working capital 7% 4% Acquisitions Capex Other 59% 18% 250 140 US$b 27% Primary use of loan proceeds (2014 vs 2015) 200 22 in loan proceeds during 2015 • Rio Tinto concluded a US$7.5b revolving credit facility in November, replacing an existing facility while agreeing on a further US$4.4b in project finance to support further development of Oyu Tolgoi. These constraints may potentially increase, should there be knock-on effects from the current crude oil price environment, which may prompt banks to impair their overall commodity exposure. It may encourage the continued pursuit of alternative financing strategies (e.g., streaming) while acting as a spur to supporting wider industry consolidation. Loan volume and proceeds (2010–2015) US$122b 4% 49% 9% 2% 3% 2% 1% 2015 2014 .
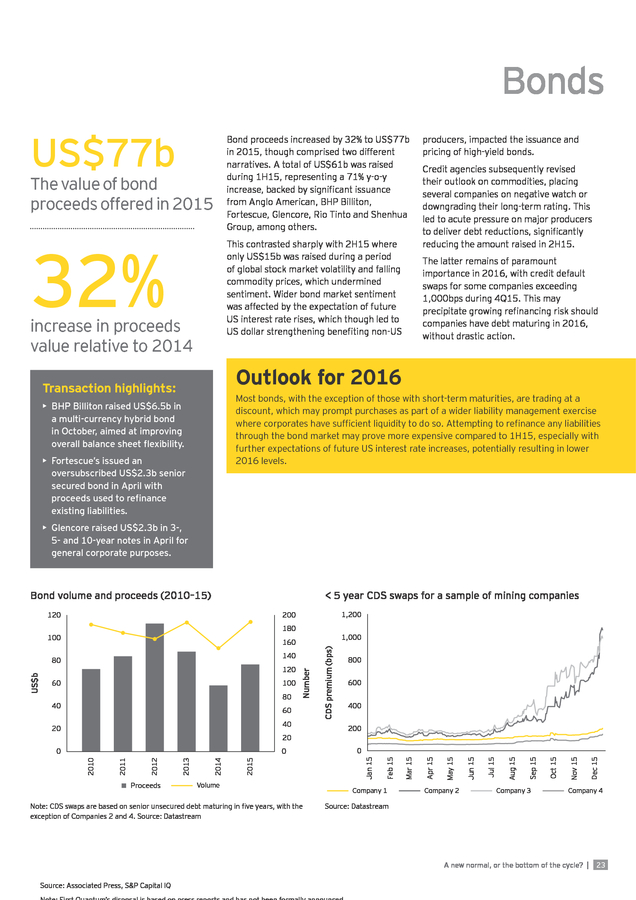
Bonds US$77b The value of bond proceeds offered in 2015 32% Bond proceeds increased by 32% to US$77b in 2015, though comprised two different narratives. A total of US$61b was raised during 1H15, representing a 71% y-o-y increase, backed by significant issuance from Anglo American, BHP Billiton, Fortescue, Glencore, Rio Tinto and Shenhua Group, among others. This contrasted sharply with 2H15 where only US$15b was raised during a period of global stock market volatility and falling commodity prices, which undermined sentiment. Wider bond market sentiment was affected by the expectation of future US interest rate rises, which though led to US dollar strengthening benefiting non-US increase in proceeds value relative to 2014 producers, impacted the issuance and pricing of high-yield bonds. Credit agencies subsequently revised their outlook on commodities, placing several companies on negative watch or downgrading their long-term rating. This led to acute pressure on major producers to deliver debt reductions, significantly reducing the amount raised in 2H15. The latter remains of paramount importance in 2016, with credit default swaps for some companies exceeding 1,000bps during 4Q15.
This may precipitate growing refinancing risk should companies have debt maturing in 2016, without drastic action. Outlook for 2016 Transaction highlights: Most bonds, with the exception of those with short-term maturities, are trading at a discount, which may prompt purchases as part of a wider liability management exercise where corporates have sufficient liquidity to do so. Attempting to refinance any liabilities through the bond market may prove more expensive compared to 1H15, especially with further expectations of future US interest rate increases, potentially resulting in lower 2016 levels. • BHP Billiton raised US$6.5b in a multi-currency hybrid bond in October, aimed at improving overall balance sheet flexibility. • Fortescue’s issued an oversubscribed US$2.3b senior secured bond in April with proceeds used to refinance existing liabilities. • Glencore raised US$2.3b in 3-, 5- and 10-year notes in April for general corporate purposes. Bond volume and proceeds (2010–15) < 5 year CDS swaps for a sample of mining companies 180 1,000 Proceeds Volume Note: CDS swaps are based on senior unsecured debt maturing in five years, with the exception of Companies 2 and 4. Source: Datastream 0 Company 1 Company 2 Company 3 Company 4 Source: Datastream A new normal, or the bottom of the cycle? | Source: Associated Press, S&P Capital IQ Dec 15 2015 2014 2013 2012 2011 2010 0 Nov 15 0 200 Oct 15 20 Sep 15 40 20 400 Aug 15 60 Jul 15 40 600 Jun 15 80 May 15 100 Apr 15 60 800 Mar 15 120 Number 140 80 Jan 15 160 CDS premium (bps) 100 US$b 1,200 200 Feb 15 120 23 .
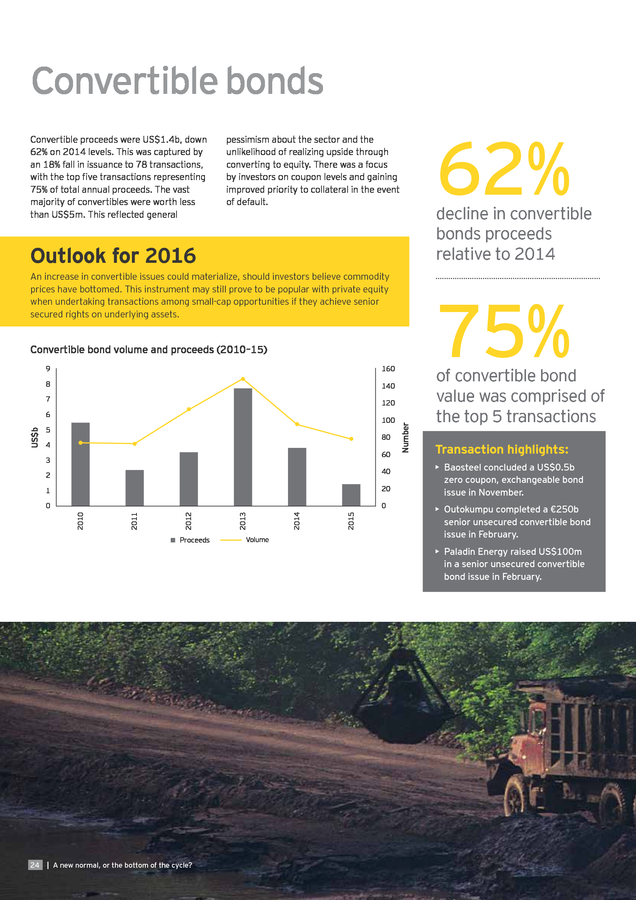
Convertible bonds Convertible proceeds were US$1.4b, down 62% on 2014 levels. This was captured by an 18% fall in issuance to 78 transactions, with the top five transactions representing 75% of total annual proceeds. The vast majority of convertibles were worth less than US$5m. This reflected general pessimism about the sector and the unlikelihood of realizing upside through converting to equity.
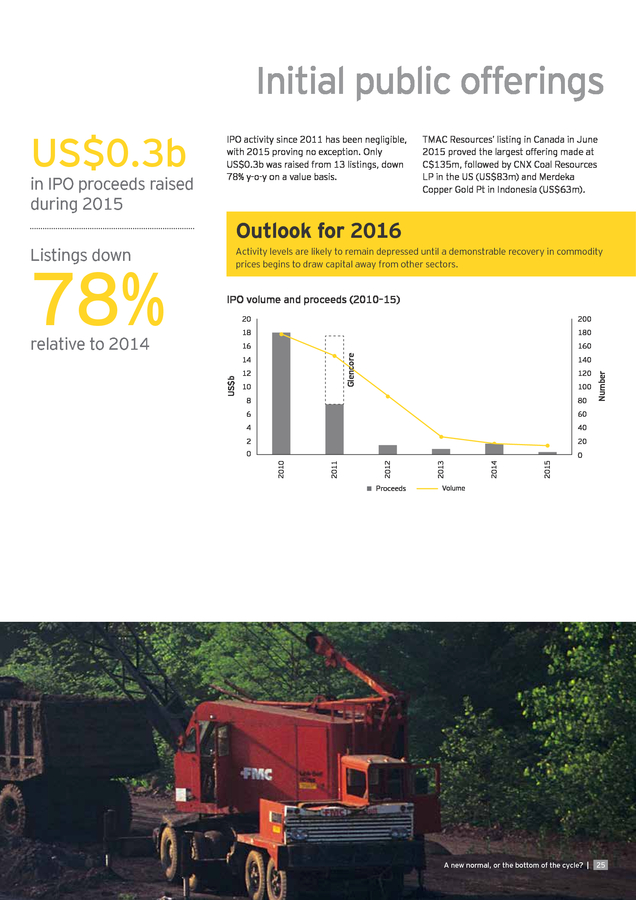
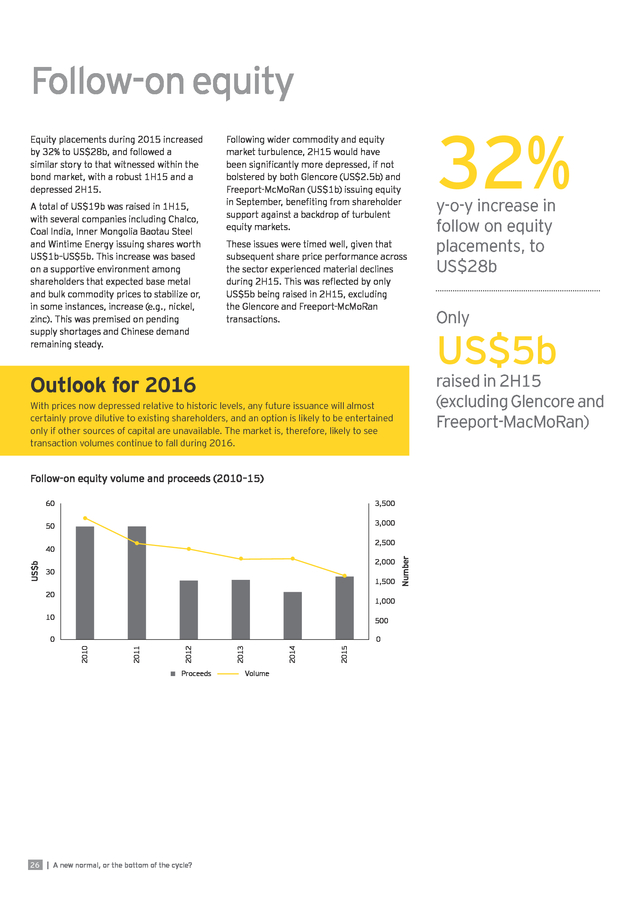
There was a focus by investors on coupon levels and gaining improved priority to collateral in the event of default. Outlook for 2016 An increase in convertible issues could materialize, should investors believe commodity prices have bottomed. This instrument may still prove to be popular with private equity when undertaking transactions among small-cap opportunities if they achieve senior secured rights on underlying assets. 160 8 140 7 US$b 100 5 80 4 60 3 40 2 Proceeds Volume 2015 2014 2013 0 2012 0 2011 20 2010 1 Number 120 6 decline in convertible bonds proceeds relative to 2014 75% Convertible bond volume and proceeds (2010–15) 9 62% of convertible bond value was comprised of the top 5 transactions Transaction highlights: • Baosteel concluded a US$0.5b zero coupon, exchangeable bond issue in November. • Outokumpu completed a €250b senior unsecured convertible bond issue in February. • Paladin Energy raised US$100m in a senior unsecured convertible bond issue in February. 24 | A new normal, or the bottom of the cycle? . Initial public offerings IPO volume and proceeds (2010–15) 20 180 16 160 10 140 120 100 80 6 60 4 40 2 20 0 0 Proceeds 2015 8 Number 12 2014 US$b 14 2013 relative to 2014 200 18 2012 78% Activity levels are likely to remain depressed until a demonstrable recovery in commodity prices begins to draw capital away from other sectors. Glencore Listings down TMAC Resources’ listing in Canada in June 2015 proved the largest offering made at C$135m, followed by CNX Coal Resources LP in the US (US$83m) and Merdeka Copper Gold Pt in Indonesia (US$63m). Outlook for 2016 2011 in IPO proceeds raised during 2015 2010 US$0.3b IPO activity since 2011 has been negligible, with 2015 proving no exception. Only US$0.3b was raised from 13 listings, down 78% y-o-y on a value basis. Volume A new normal, or the bottom of the cycle? | 25 . Follow-on equity Equity placements during 2015 increased by 32% to US$28b, and followed a similar story to that witnessed within the bond market, with a robust 1H15 and a depressed 2H15. A total of US$19b was raised in 1H15, with several companies including Chalco, Coal India, Inner Mongolia Baotau Steel and Wintime Energy issuing shares worth US$1b–US$5b. This increase was based on a supportive environment among shareholders that expected base metal and bulk commodity prices to stabilize or, in some instances, increase (e.g., nickel, zinc). This was premised on pending supply shortages and Chinese demand remaining steady. Following wider commodity and equity market turbulence, 2H15 would have been significantly more depressed, if not bolstered by both Glencore (US$2.5b) and Freeport-McMoRan (US$1b) issuing equity in September, benefiting from shareholder support against a backdrop of turbulent equity markets. These issues were timed well, given that subsequent share price performance across the sector experienced material declines during 2H15. This was reflected by only US$5b being raised in 2H15, excluding the Glencore and Freeport-McMoRan transactions. With prices now depressed relative to historic levels, any future issuance will almost certainly prove dilutive to existing shareholders, and an option is likely to be entertained only if other sources of capital are unavailable.
The market is, therefore, likely to see transaction volumes continue to fall during 2016. Follow-on equity volume and proceeds (2010–15) 3,500 50 3,000 US$b 2,000 30 1,500 20 1,000 10 500 0 Proceeds 26 | A new normal, or the bottom of the cycle? Volume 2015 2014 2013 2012 2011 2010 0 Number 2,500 40 y-o-y increase in follow on equity placements, to US$28b Only US$5b raised in 2H15 (excluding Glencore and Freeport-MacMoRan) Outlook for 2016 60 32% . About this study • The data is primarily sourced from ThomsonONE. • Unless otherwise stated, all values are in US dollars. Mergers and acquisitions • Only completed deals are included. Deals identified as incomplete, pending, partly incomplete, conditional or intended as of 31 December 2015 were excluded. • The acquirer country is based on the ultimate owner’s geographic headquarters. The target country is determined by where the primary targeted asset or company is located. • “Country-based” refers to domestic and inbound deals. • A country’s acquisition refers to domestic and outbound deals. • Commodity analysis is based on the company’s primary commodity focus. • The value of M&A activity by commodity includes deals where the given commodity is the acquirer and/or target’s primary commodity. Commodity charts illustrate the value of deals where the given commodity is the target. Capital raising The primary source for this data is ThomsonONE. Certain details have been supplemented with information from company and stock exchange websites and major business press.
Only completed transactions are included. • Only initial public offerings, the first time a company issues equity to the public — are included in the IPO analysis. Proceeds are allocated to the primary exchange of listing. • Equity issues are geographically categorized by the primary exchange where the issuer’s stock trades, except where stated. Where a company offers Global Depositary Receipts or American Depositary Receipts, the issue is allocated to the destination market of those shares. • Loan data and proceeds include refinancing and amendments to existing debt, and are as per ThomsonONE intelligence.
Proceeds are allocated to the geography of the borrower. • The data does not capture the value of transactions where this information is not publicly available. Contributors • “Megadeals” refer to all deals with a value equal to, or greater than, US$1b. Lee Downham Global Mining & Metals Transactions Leader ldownham@uk.ey.com Jenny Bessey Assistant Director, Mining & Metals Transaction Advisory Services, UKI jbessey@uk.ey.com Jodie Eldridge M&A Analyst, Mining & Metals jodie.eldridge@au.ey.com Karim Awad Senior Strategic Analyst, Mining & Metals kawad@uk.ey.com A new normal, or the bottom of the cycle? | 27 . How EY’s Global Mining & Metals Network can help your business With a volatile outlook for mining and metals, the global mining and metals sector is focused on margin and productivity improvements, while poised for value-based growth opportunities as they arise. The sector also faces the increased challenges of maintaining its social license to operate, balancing its talent requirements, effectively managing its capital projects and engaging with government around revenue expectations. EY’s Global Mining & Metals Network is where people and ideas come together to help mining and metals companies meet the issues of today and anticipate those of tomorrow by developing solutions to meet these challenges. It brings together a worldwide team of professionals to help you succeed — a team with deep technical experience in providing assurance, tax, transactions and advisory services to the mining and metals sector. Ultimately it enables us to help you meet your goals and compete more effectively. Tel: +55 11 2573 3363 miguel.zweig@br.ey.com Oceania Scott Grimley Tel: +61 3 9655 2509 scott.grimley@au.ey.com China and Mongolia Peter Markey Tel: +86 21 2228 2616 peter.markey@cn.ey.com Japan Andrew Cowell Tel: +81 3 3503 3435 cowell-ndrw@shinnihon.or.jp Africa Wickus Botha Tel: +27 11 772 3386 wickus.botha@za.ey.com Commonwealth of Independent States Evgeni Khrustalev Tel: +7 495 648 9624 evgeni.khrustalev@ru.ey.com France, Luxemburg, Maghreb, MENA Christian Mion Tel: +33 1 46 93 65 47 christian.mion@fr.ey.com India Anjani Agrawal Tel: +91 22 6192 0150 anjani.agrawal@in.ey.com United Kingdom and Ireland Lee Downham Tel: +44 20 7951 2178 ldownham@uk.ey.com About EY EY is a global leader in assurance, tax, transaction and advisory services. The insights and quality services we deliver help build trust and confidence in the capital markets and in economies the world over. We develop outstanding leaders who team to deliver on our promises to all of our stakeholders.
In so doing, we play a critical role in building a better working world for our people, for our clients and for our communities. EY refers to the global organization, and may refer to one or more, of the member firms of Ernst & Young Global Limited, each of which is a separate legal entity. Ernst & Young Global Limited, a UK company limited by guarantee, does not provide services to clients. For more information about our organization, please visit ey.com. © 2016 EYGM Limited. All Rights Reserved. EYG no.
ER0295 BMC Agency GA 0000_04661 Area contacts Global Mining & Metals Leader Miguel Zweig EY | Assurance | Tax | Transactions | Advisory United States Andy Miller ED None Canada Bruce Sprague ey.com/miningmetals Tel: +1 314 290 1205 andy.miller@ey.com Tel: +1 604 891 8415 bruce.f.sprague@ca.ey.com Brazil Afonso Sartorio Tel: +551125733074 afonso.sartorio@br.ey.com Chile María Javiera Contreras Tel: + 562 2676 1492 maria.javiera.contreras@cl.ey.com Service line contacts Global Advisory Leader Paul Mitchell Tel: +61 2 9248 5110 paul.mitchell@au.ey.com Global Assurance Leader Alexei Ivanov Tel: +7 495 228 3661 alexei.ivanov@ru.ey.com Global IFRS Leader Tracey Waring Tel: +61 3 9288 8638 tracey.waring@au.ey.com Global Tax Leader Andy Miller Tel: +1 314 290 1205 andy.miller@ey.com Global Transactions Leader Lee Downham Tel: +44 20 7951 2178 ldownham@uk.ey.com This material has been prepared for general informational purposes only and is not intended to be relied upon as accounting, tax or other professional advice. Please refer to your advisors for specific advice. .
At a time when prices are depressed, buyers are scarce, and execution risks high, this is a difficult time to be selling. down 34% on 2014 • Refinancing: Balance sheet strength and flexibility are critical in such challenging markets, and there has been an increasing focus to reduce leverage and push out maturities. While there has been some equity raised — and there is likely to be more in 2016 — this has typically been an action of last resort, with Glencore and Lonmin, for example, having to do so in order to stabilize falling share prices. More commonly, debt has been repaid through proceeds raised from divestment, forward sales or streaming. 358 deals 67% of M&A by value targeted developed countries 61% domestic deals 38% increase in the volume of steel deals exhausted, management are having to make strategic decisions that have long-term implications on the future direction of the business: Gold was the most targeted by both volume and value • Corporate restructure: Going beyond a simple divestment or portfolio resizing, some corporates are literally redrawing their strategic lines.
A good example, which was the sectors’ largest deal of 2015 by value, was BHP Billiton’s spin-off of South32, signaling a clear intention to focus on a small number of scalable asset pillars rather than a broad diversified portfolio of assets. • Dividend cuts: Given the context above, it is of little surprise that dividends are increasingly being forgone in order to retain balance sheet strength. Even among the diversifieds, to which dividend policy is a critical factor in share price performance, we have seen dividends cut and policies change from “progressive” to earnings based, reflecting the realization that future metals prices are inherently uncertain. Management across all levels of the mining and metals sector continue to focus on balance sheet and margin improvement. Organizations of all sizes have embraced capital expenditure cuts, mothballing of loss-making operations, productivity improvement, and working capital efficiency drives. However, in this market, even these actions are not always sufficient.
With internal options A new normal, or the bottom of the cycle? | 3 . Shareholders are increasingly influencing Capital raising continues to be an issue the agenda Many of the actions witnessed during 2015 are likely to be replicated in 2016, and arguably with greater regularity and scale. It is increasingly clear that position on the cost curve is critical as supply-side correction looks to be the only way to restore fortunes. However, with so much uncertainty linked to finance-backed commodity trades, the supply-demand picture is arguably less clear than ever. As a result, the supply-side correction is coming; the question is how much of it will be voluntary shutdowns and how much will be forced via corporate failures. Perhaps the most stark realization of 2015 is that nobody is sure how long the current downturn is going to persist, and management cannot sit back and wait for an improvement in market conditions. Investors are increasingly short of patience, as the dramatic fall in share prices in 2015 demonstrated. There is also an increase in the level of activity from activist shareholders, such as Casablanca (Cliffs Resources) and Carl Icahn (Freeport-McMoRan), who have a track record of instigating change at both the management and the operational levels. Unless equity prices begin to pick up, which seems unlikely in the short term, these investors will continue to circle the industry looking for opportunities to stimulate change and drive value out of challenging situations. US$228b capital raised, 9% y-o-y fall Loan proceeds down 27% to US$122b 13 IPOs completed with a 78% drop in value on 2014 US$77b in bond proceeds, up 32% Share market performance relative to peers 20% 10% Overall, capital raised across the sector was down by about 10% y-o-y.
The decrease was primarily due to a sharp drop-off in loan finance to the sector, which fell to US$44b in 2015 from US$122b in 2014. Much of this was for the refinancing of existing facilities, emphasizing the limited amount of new finance going into projects. However, this trend comes as no surprise given the very difficult — and worsening — trading environment that the industry faced during 2015. 0% -10% -20% -30% -40% -50% -60% The backdrop of challenging market conditions has led to a number of alternative financing strategies being pursued, with asset disposals featuring prominently and almost US$3b of streaming finance being announced across the industry. -70% -80% Dow Jones US Mining Index S&P 500 Metals & Mining Index Source: S&P Capital IQ, EY analysis 4 | A new normal, or the bottom of the cycle? FTSE 350 Mining Index Dec 2015 Dec 2014 Dec 2013 Dec 2012 Dec 2011 Dec 2010 -90% . Outlook: the face of M&A and capital raising will continue to evolve Gone are the megadeals with the unashamed focus on consolidating market share. At its 2007 peak, we saw over US$200b of deal value across the sector, with a small number of proposed deals at the time valued well in excess of US$70b. This deal rationale has limited currency in the sector right now; size is not all-important, but instead the focus is on higher returns on capital, greater optionality and flexibility across asset portfolios, and an improved cost curve position. The following are the key M&A trends that EY sees continuing into 2016. • Sell-side will continue to be the catalyst for M&A, with assets going to market from distressed sellers in need of capital. This isn’t expected to turn into a mass fire sale, but there is clearly a greater “push” from sellers than a “pull” from willing buyers.
The challenge for those divesting is to present the asset properly so that buyers remain confident in the underlying valuation and a competitive process is maintained. • Private capital may well be the new face of M&A across the sector, but it doesn’t yet dominate proceedings and may forever be a relatively small player in the sector’s overall deal activity. Both Magris Resources and Audley Capital demonstrated in 2015 that deals were to be done by specialist funds with a focus on the sector. The model looks more attractive than ever given the relative value of potential targets and the increasingly distressed disposition of sellers. EY expects to see a greater volume of deals completed by these funds during 2016.
But, with a significant increase in assets available for sale, only the best assets will attract their focus and pricing will remain disciplined. • Deferred consideration appears to be growing in popularity, while previously it was largely unheard of in the sector. For example, Anglo American has shown it is prepared to consider bids with upside with the sale of Anglo Norte SA and Rustenburg. With increased sales processes, limited buyers and extreme price uncertainty, EY expects to see a greater level of deals incorporating deferred consideration in 2016. value deal, BHP Billiton’s spin-off of South32, which raised a number of contrasting views on the process. Whether sparked by the South32 process, or otherwise, the idea of packaged asset spin-offs increasingly feature in boardroom discussions. The challenge in a distressed situation is the level of working capital required to go with the spun-off entity in order for it to survive independently; capital that is much needed for both parties and can often be the critical factor in preventing such a deal from successfully completing.
Given this challenge, spin-offs are expected to continue to be high on the strategic agenda, but relatively few will actually consummate during 2016. • Joint ventures and mergers of equals have also grown in popularity as companies look to leverage synergies and economies of scale in challenging market conditions. Despite the difficulties, a merger of equals can be successfully structured, as demonstrated by Alamos Gold and Aurico Gold’s US$1.5b combination during the year. On the flip side, as the recent discussions between Randgold and AngloGold Ashanti over the redevelopment of the Obuasi mine demonstrate, getting two parties to agree on the terms of such a deal is incredibly challenging.
EY expects to see a greater level of mergers and joint ventures pursued during 2016, with the key focus on derisking and preserving capital; the challenges around execution will remain very high, but an acute need to consummate will drive deals through. In terms of capital raising, the financing markets are expected to remain challenging in the year ahead, with corporate rating agencies taking a very close look at future cash generation and corporate refinancing strategies. Likewise, the availability of equity will remain an option of last resort only and will be highly dilutive to those looking to raise secondary equity. Now would appear to be the time for well-capitalized producers to look at lending opportunities into the sector that position them for future strategic growth and alternative finance providers to evaluate the opportunities in distress.
World-class assets trapped in difficult corporate situations may still provide strong financial returns to the canny investor. • Spin-offs are emerging as a key consideration for the diversified producers. This is perhaps best illustrated by this year’s highest A new normal, or the bottom of the cycle? | 5 . 01 6 | A new normal, or the bottom of the cycle? Widespread signs of distress . The disconnect between earnings and leverage in recent years has reduced companies’ financial flexibility. Net debt has continued to rise for EY’s sample of 88 companies since 2010, despite earnings falling over the same period; critically, this is the first observable period of such a disconnect between debt and earnings progression. With net debt/ EBITDA at levels exceeding those last seen in 2000, leverage is starting to increasingly stretch balance sheets and limit flexibility to absorb financial shocks. Impact on net debt 2.5x 350 2.0x US$b 300 250 1.5x 200 1.0x 150 100 Net debt/EBITDA (x) 400 0.5x 50 EBITDA Net debt LTM 2015 2014 2013 2012 2011 2010 2009 2008 2007 2006 2005 2004 2003 2002 2001 0.0x 2000 0 Net debt/EBITDA Note: Based on a sample of 88 mining companies from available information provided by S&P Capital IQ. Source: EY research; S&P Capital IQ i Ra ti a nged cha un tlook ng ou ed nd prov m 11% 43% Rating unchanged and outlook shifted downwards 39% Rating downgraded one notch 21% Rating downgraded two notches t Ra k lo o o ut While the associated ”dollar” impact of a downgrade to the servicing costs of debt may be relatively small due to currently low interest rates, the overall impact on financial flexibility is often severe. This can range from worsening credit terms from suppliers; availability of finance (and terms thereon); through to overall market confidence in the underlying business and, consequently, negative rating of the share price. 18% o r outlo k go tin graded Ra own d During 2015, a high proportion of corporate credit ratings were downgraded or placed on negative watch as the rating agencies factored in increasing leverage positions and the subdued outlook for commodity price improvements. in g un a n d ch ang ed 3% 4% Rating downgraded three notches Note: S&P rating changed between 31 December 2014 and 31 December 2015 for a sample of 28 companies. Source: EY research, S&P Capital IQ, Standard & Poor’s Some of the companies affected by rating changes include: • Teck Resources, which was downgraded three notches by both S&P (BBB to BB) and Moody’s (Baa3 to Ba3), cited to be driven by the persistently weak metallurgical coal market conditions coupled with high capital expenditure on the Fort Hills oil sands project • Vale, which was downgraded two notches by S&P (A- to BBB) and one notch (Baa2 to Baa3) along with a switch to negative outlook by Moody’s, cited as being principally driven by the expectation that iron ore and base metal prices will not experience a meaningful recovery until 2017 A new normal, or the bottom of the cycle? | 7 . The sustained low commodity price environment resulted in a large number of casualties in 2015, with more than 46 mining and metals companies entering formal bankruptcy proceedings The formal bankruptcy cases presented below are heavily skewed toward US companies. This is likely to be partly driven by the US Chapter 11 procedures being generally considered “softer”1 than the formal bankruptcy procedures in other jurisdictions and, therefore, more companies opting to enter this protective environment. The coal sector in North America was by far the worst hit, with at least 20 companies including Alpha Natural Resources, Arch Coal and Walter Energy entering bankruptcy proceedings. The unprecedented decline in the North American coal sector has been driven by several structural factors, including the switch to natural gas-fired power stations owing to both the sustained glut in low-cost natural gas, and environmental and pollution regulation. Coal companies that overinvested in the high-sulfur coal of the Appalachian region are the worst affected. The Americas gold sector also suffered, with casualties from the juniors and mid-tiers, including San Gold Corporation, Midway Gold Corporation and ATNA Resources Ltd. These companies were generally highly leveraged or had limited flexibility in their capital structure and operated at the upper end of the cost curve, forcing them into bankruptcy when gold prices continued their decline coupled, in some cases, with operational issues. These, however, are not the only subsectors experiencing financial difficulties. Others, such as the Chinese steel and nickel sectors, have been able to stay afloat only because of government subsidies and support.
These actions have limited the competitiveness of these sub-sectors in the free market economies, and without sufficient compensating actions being taken, we are likely to see further examples of bankruptcy proceedings being initiated in 2016. Formal bankruptcy cases by commodity and region of operation (2015) Americas sodium bentonite Americas limestone Africa rare earth Nordics iron ore Americas nickel Nordics nickel Americas steel Americas rare earth Africa iron ore Americas copper UK steel 0.0 0.5 1.0 1.5 2.0 2.5 Americas iron ore 3.0 Number of companies in the group Size of the bubble = latest estimated annual revenue Source: EY analysis, S&P Capital IQ, SNL P. Povel, “Optimal ‘Soft’ or ‘Tough’ Bankruptcy Procedures,” The Journal of Law, Economics, & Organisation, 1999. 1 8 | A new normal, or the bottom of the cycle? Americas coal Americas gold 8.0 8.5 19.5 20.0 20.5 . A new normal, or the bottom of the cycle? | 9 . 02 M&A trends 10 | A new normal, or the bottom of the cycle? . Macro uncertainty inhibits activity Divestments slowly gather momentum The largest deals of the year were predominantly driven from the sell-side as a way to unlock value for shareholders, by reorganizing and streamlining the business to focus on core operations. An example was BHP Billiton’s spin-off of its aluminum, manganese and nickel assets into South32, which was also the year’s biggest deal. Similarly, we saw high-value non-core divestments by Vale, Anglo American and Barrick Gold. The ongoing uncertainty in global markets and concerns over Chinese growth continue to weigh on corporate strategy. Deal activity is now in its fifth consecutive year of decline across the sector, with overall volume dropping 34% to 358 deals, from 544 deals in 2014. Deal value also dropped 10% to US$40b (when excluding the South32 spinoff), down from US$44.6b in 2014. Strategic buying grows at the junior and mid-tier end Whether opportunistic or desperate, mergers between equals and strategic purchases of prospects at the junior/ explorer end of the market carried a slightly higher overall price tag this year.
The median deal value for 2015 was US$7.2m, compared with just US$3.2m in 2014. Volume and value of deals by size (2005–2015) Glencore Xstrata merger South32 spin-off 1,200 1,000 200 800 150 600 100 400 50 Deal volume Deal value US$b 250 200 0 <US$200m Between US$200m and US$1b >US$1b Extraordinary deals 2015 2014 2013 2012 2011 2010 2009 2008 2007 2006 2005 0 Volume Megadeals 2015 Rank Value Target name (US$m) Target country Target Acquirer commodity Acquirer country Acquirer commodity Share Deal driver owned (%) Australia Diversified Shareholders Australia Shareholders 100.0 Russia Financial investor 59.8 Strategic growth Silicon Consolidation 1 8,719 BHP Billiton (South32) 2 5,384 Polyus Gold International UK Gold Wandle Holdings 3 1,953 Globe Specialty Metals Silicon Grupo FerroAtlantica Spain US 4 1,500 Alamos Gold Canada Gold AuRico Gold 5 1,413 Sirius Resources Australia Nickel Independence Group Australia Canada 6 1,411 Golden Energy Mines Indonesia Coal United Fiber System 7 1,370 Foresight Energy US Coal Murray Energy 8 1,268 RTI International Metals US 9 1,185 Minerações Brasileiras Reunidas 10 1,148 Hyundai Hysco 100.0 Non-core divestment Gold 100.0 Merger of equals Diversified 100.0 Portfolio expansion Singapore Other 67.0 Diversification US Coal 50.0 Merger of equals Other Alcoa non-ferrous metals US Aluminium 100.0 Diversification Brazil Iron ore Fundo de Investimento em Participações Multisetorial Plus II Brazil Financial investor 36.4 Non-core divestment South Korea Steel Hyundai Steel South Korea Steel Diversification 100.0 11 1,064 Rio Alto Mining Canada Gold Tahoe Resources US Silver/lead/zinc 100.0 Merger of equals 12 1,005 Barrick Gold (Zaldivar copper project) Chile Copper Antofagasta UK Copper 50.0 Non-core divestment A new normal, or the bottom of the cycle? | 11 . Who is buying? • Corporate vs. private equity: In a year where many expected to see private equity dominate, investment into the sector was actually dominated by corporates, which accounted for 73% of deal volume in 2015. Two of the standout corporate deals in 2015 occurred between industry players consolidating their position in the market: the Alamos Gold and AuRico Gold deal for US$1.5b and the Rio Alto and Tahoe Resources deal for US$1.1b. • Most acquisitive regions: Asia-Pacific based acquirers were the highest value dealmakers with 41% of value (US$16.3b) and 39% of volume (139 deals) when excluding the South32 spin-off. North American acquirers were the most prolific, undertaking 43% of deals (152) worth US$11.9b.
These were dominated by small-cap deals in Canada, mostly in the gold sector. • Most acquisitive countries: The US undertook the highest value deals (US$7b or 17%), while Canada undertook the greatest number of deals (119 deals, 33%) when excluding the South32 spin-off. China followed the US with US$6.1b worth of deals, of which US$4.0b and 67% of volume was targeted domestically. Notably, there were no Chinese deals valued in excess of US$1b — the first time that we have failed to see a Chinese megadeal since EY’s analysis commenced in 2008. • Private equity investment remains elusive.
The standout deals during 2015 were made by the Magris Resourcesled investor group which purchased IAMGold’s divested niobium asset for US$530m, and by Audley Capital which purchased Anglo American’s divested Norte copper asset for US$300m plus potential future payments up to US$200m. Outlook for 2016 Assets being divested by distressed sellers will continue to come to market during 2016, and it appears to be only a matter of time before the valuation gap that has held back dealmaking in the past couple of years will begin to close. Some assets look like they may be divested without any consideration being paid by the acquirer, such as mid-tiers undertaking joint ventures. These assets may also attract the interest of private equity looking to capitalize on well-priced opportunities. At least one major company has hinted it would be interested in making acquisitions when the market enters a phase of distressed pricing, however, the large caps, for the most part, will remain focused on streamlining, cost-cutting and balance sheet preservation. Share of deal value by acquirer type 2015 2014 2013* 2012 2011 0% 20% 40% 60% Industry acquirers Financial investors State-backed acquirers Other sectors Spin-off Undisclosed/other *Excluding the Glencore Xstrata merger 12 | A new normal, or the bottom of the cycle? 80% 100% Commodity traders 27% of deal volume was undertaken by acquirers from outside the industry 43% of deal volume was undertaken by North America based acquirers .
Where are they buying? 57% of deal volume and 67% of deal value targeted assets in developed regions such as US, Canada and Australia 73% • Domestic vs. cross border: The ratio of domestic to cross-border transactions increased slightly in 2015 y-o-y, with 61% of deal volume and 60% of deal value targeting domestic assets, compared with 58% volume and 43% value in 2014. In a relatively benign period of M&A, this is unsurprising as operators seek value through mergers with entities in geographic proximity to their existing assets, thus leveraging existing infrastructure and experience in the regions. • Most targeted region: Asia-Pacific was the most targeted region, taking 37% of deal volume. Among the higher value deals were Independence Group’s strategic acquisition of Sirius Resources for US$1.4b and two of Barrick Gold’s divestments this year (Cowal in Australia and Niugini in Papua New Guinea).
Also of note, in terms of deal size, was South Korea, which saw two major domestic steel deals, namely the Hyundai Hysco and POSCO Specialty Steel acquisitions.2 • Emerging markets lose appeal: Deals in emerging regions declined during 2015, with a 46% drop in deal value. The only significant deal was Vale’s divestment of a stake in Minerações Brasileiras Reunidas for US$1.2b. Investment into Latin America and Africa remains scarce due to the higher associated valuation risks and political uncertainty during a period of low-risk capital investment across the sector. Outlook for 2016 Falling currencies may help lower the costs associated with operating in commodity-rich countries, such as Brazil and South Africa.
However, with the focus still firmly on reducing capex, it’s unlikely there will be a significant amount of investment into undeveloped projects in the near future. Investors are more likely to continue their interest in select advanced projects in North America and Australia, especially in the historically well-run divested assets on the market. EY expects to see further restructuring deals within Asia and ongoing consolidative deals in North America. of deals targeted assets within the acquirers’ region Europe CIS Change 10% Value (US$b) 10.8 Volume 38 Change Value (US$b) 225% Volume 41% 5.6 16 0% North America Change Value (US$b) 15.4 26% Volume 35% 166 Asia-Paciï¬c Change Value (US$b) 3.5 49 13% 33% Change 70% Volume 154 Middle East Change Value (US$b) 48% Volume Latin America 25.6 Value (US$b) Africa Volume 0.3 451% 2 71% Change Value (US$b) “Sale of shares in POSCO Specialty Steel,” London Stock Exchange, 18 March 2015, http://m.londonstockexchange. com/exchange/mobile/news/detail/12285197.html, accessed 29 January 2015. 2 1.6 Volume 26 52% 56% A new normal, or the bottom of the cycle? | 13 .
What are they buying? • Most attractive commodity: Gold retains the lead as the most targeted commodity with 117 deals. It also took over as the most targeted commodity by value at US$13.9b, representing a 64% increase on the 2014 deal value. This was primarily driven by three of this year’s megadeals, namely the Polyus Gold acquisition by Wandle Holdings, the Alamos Gold and AuRico Gold merger, and the Rio Alto and Tahoe Resources merger. The mergers are indicative of a developing trend between mid-tier pure plays to join forces while commodity prices are low, potentially paving the way to becoming leading producers when prices recover. • Least attractive commodity: Aluminium and iron ore are among the least attractive targets, with a factor of oversupply and uncertain demand outlook from China creating concerns over long-term price forecasts. Copper also saw very low deal activity, although this is likely due to the scarcity of assets on the market rather than embedded concerns about long-term fundamentals. • Steel deals rise on structural changes: The number of steel deals increased by 38% to 29 deals, but value dropped 53% to US$4.6b.
This trend is reflective of the number of steel producers divesting to reduce debt, diversifying to minimize exposure or making acquisitions to explore new markets. Steel producers are focused on rebalancing as prices fall under pressure from increased Chinese exports. Outlook for 2016 86% decline in the number of iron ore deals in 2015 y-o-y 29% of 2015 deal value targeted gold Struggling bulk commodity producers continue to suffer, despite having aggressively cut cost and refinanced balance sheets. The protracted period of low prices and dwindling demand out of China looks set to continue, so there may be more distressed assets entering the market or facing closure. Aluminium Coal Value ($b) 0.2 –63% Cost reduction/ portfolio optimization Volume 2 –75% Strategic investment Copper Change Drivers Change Drivers Change Drivers Value ($b) 5.4 22% Corporate distress Value ($b) 3.0 –18% Expansion Volume 38 –25% Portfolio realignment Volume 27 –29% Fund-raising Divestment Opportunistic investment/consolidation Financial distress Gold Iron ore Change Drivers Nickel Change Drivers Change Drivers Value ($b) 13.9 64% Non-core divestment Value ($b) 1.2 –36% Non-core divestment Value ($b) 1.9 397% Distress Volume 117 –32% Debt reduction Volume 4 –86% Debt reduction and ï¬nancing Volume 7 –46% Strategic investment Strategic growth Potash/phosphate Change Drivers Value ($b) 0.1 –50% Securing supply Value ($b) 1.7 437% Volume 6 –40% Expansion Volume 19 12% 14 | A new normal, or the bottom of the cycle? Steel Silver/lead/zinc Change Drivers Divestment Expansion Distress and industry exit Change Drivers Secure supply Value ($b) 4.6 -53% Portfolio optimization Expansion Volume 29 38% Access new markets Consolidation Consolidation .
A new normal, or the bottom of the cycle? | 15 . 03 16 | A new normal, or the bottom of the cycle? How do you reduce execution risk in a buyers’ market? . There was a steady flow of announced and concluded disposals in 2015, which accelerated during the second half of the year as market volatility increased and balance sheet concerns became more pronounced. Companies were pressed by stakeholders into demonstrating adequate liquidity and preserving investment-grade credit ratings against a backdrop of falling prices. Some were opportunistic in disposing of non-core assets, to free up financial capacity to deploy in higher-yielding areas, or in anticipation of leading future industry restructuring. Financing any acquisition may not be straightforward for the following reasons: • Corporates can take on debt or issue shares, though it will require robust justification to satisfy debt and equity holders, which will be unlikely if balance sheet concerns remain. • Private equity continues to evaluate opportunities, with significant committed capital being available. However, with falling prices and sellers being inclined to run auctions instead of bilateral processes, the scope to demonstrate high-future returns at operating level is reduced, unless other sources of value can be captured. The first half of 2015 was mostly dominated by portfolio optimization, with South32 successfully spun out of BHP Billiton, and Polyus Gold de-listed and taken private.
In addition, two transactions of note included Independence Group acquiring Sirius Resources for US$1.4b and Alcoa’s US$1.3b acquisition of RTI International Metals. Both either secured assets enjoying a competitive advantage, or seized further supply chain value. out of core operations, vastly simplifying a divestment process. Another trend witnessed in the divestments executed in 2015 was the use of deferred consideration, highlighting the negotiating power held by acquirers in a market where there is little competitive tension.
Historically, the use of deferred consideration has been rare in the mining and metals sector, but EY expects it to continue to be increasingly common as divestment processes ramp up in 2016. A highlight of transactions during 2H15 illustrates that average transaction values were typically less than US$1b, and involved assets that could easily be carved Completed transactions • A$50m sale of Anglo American’s Dartbrook coal mine (Dec 15), and up to US$500m disposal of their Copper Norte assets (Aug 15) • US$750m disposal of Noble’s remaining 49% stake in Noble Agri (Dec 15) and going through final stages of shareholder/regulatory approval Sell-side rationale for divestments in 2015 > US$100m 4% 21% 20% • US$720m in disposals by Barrick Gold of several, non-core assets in Nevada (Nov 15), along with US$1b sale of 50% stake in Zaldivar to Antofagasta (Jun 15) 2% • Rio Tinto’s US$606m sale of Bengalla coal assets to New Hope (Sep 15) 16% 20% Announced intention to divest • Nyrstar’s upstream zinc portfolio 17% • A minority sale of Glencore’s agriculture trading business, and disposals of Lomas Bayas and Cobar copper mines • Anglo American’s Brazilian niobium and phosphate mines, with others expected after concluding a strategic review Acquired Acquired — minority Non-core Merger Other Consolidation Spin-off • First Quantum’s nickel assets in Finland and Australia Source: Associated Press, S&P Capital IQ Note: First Quantum’s disposal is based on press reports and has not been formally announced. A new normal, or the bottom of the cycle? | 17 . A total of 77% sell-side disposals during 2015 appear to have been motivated by: • Strengthening balance sheets and overall liquidity • Lowering cash costs through the sale of non-core assets or entering into mergers to realize synergies • Focusing on specific commodities and/or geographies, also through non-core asset sales, or spinning off assets • Attempting to share the cost of developing assets by disposing of minority stakes Not all these transactions may have been prompted by management strategies, with external factors including pressure from stakeholders, which materialized in lower share prices, or rising debt yields. This in turn may have encouraged divestments otherwise not considered, or accelerated such plans. Equally, not all divestments have sought to improve credit metrics. Rio Tinto’s disposal of its Bengalla coal mine has augmented a repositioning toward bauxite, with a US$1.9b capex commitment to developing its Amrun mine announced in November. Ivanhoe’s sale of a 49.5% stake in the Kamoa project to Zijin Mining, while raising capital, has also enabled project development risk and capital costs to be shared. 18 | A new normal, or the bottom of the cycle? Best practices in maximizing divestment value 44% of PE buyers say lack of confidence in information is the most significant factor that causes a PE firm to reduce its offer price or walk away from the deal Source: EY Global Corporate Divestment Study 2016 33% more companies generate a sale price above expectations with an operational separation plan Source: EY Global Corporate Divestment Study 2016 The importance of correctly structuring a divestment process will prove essential in generating and sustaining sufficient competitive tension prior to financial close. With a glut of assets available, a scarcity of capital and continued risk aversion requiring higher returns to justify acquisitions, poor structuring can undermine the value attained even from disposing of highquality, tier 1 assets. This is exacerbated by market conditions prompting sellers to run accelerated sale processes, which combined with the limited attention span of investors underlines the value from comprehensive preparations. This in turn can help guide and satisfactorily de-risk operating characteristics without compromising deal value, reinforce transaction upside and facilitate a smooth process without distracting management from core activities. Preparing for divestment In combination with understanding how best to package a disposal relative to investor appetite, there are several factors that can help increase both sale proceeds and the speed of execution. • Preparation of equity story: An external review of financial and operating data, besides documentation and data-room preparations, can help identify and .
critique potential productivity and working capital improvements while substantiating capex plans to support growth scenarios. For cost reduction and working capital improvements already implemented, it is important to evidence the sustainability of the actions taken. • Anticipating transaction risks: Examples may include receiving regulatory approval to transfer licenses, quantifying site reclamation or restructuring costs and gaining the support of labor unions. Foreseeing these items and being upfront with bidders about the actions being taken can guard against delays while protecting disposal value. • Tax planning and optimization: Evaluating how different disposal options will impact net proceeds received, and any post-transaction arrangements, in conjunction with strategies available to investors, may help apportion further value to the seller. • Disentangling company-to-company dependency: This can vary from implementing suitable transfer pricing arrangements, separating IT and ERP systems, to successfully transitioning HR processes and liabilities (e.g., pensions) to a new owner. Although preferences will differ between bidders with respect to how and what interdependent elements of the business are separated, it is important for a seller to be able to clearly articulate the “as is” position prior to commencing the sales process. Optimally, the business would look to embed improvements 12–18 months prior to the sales process to demonstrate to potential buyers that these savings can be realized and sustained over the long term. However, this may not be possible in the current environment. Alternatively, vendors should ensure sufficient data is provided in the seller documentation to illustrate how such savings will be achieved and the costs/ process to achieve these savings.
If the speed of execution is critical, ”quick wins” may still generate value. Outlook for 2016 The year will likely see further sale announcements of non-core assets, in conjunction with announced disposals reaching financial close. However, ongoing price volatility could see hostile takeover bids from better capitalized entities, but only where the target operates desirable, low-cost assets in stable jurisdictions. A new normal, or the bottom of the cycle? | 19 . 02 20 | A new normal, or the bottom of the cycle? Capital raising . Accessing liquidity continues to remain challenging against a backdrop of falling commodity prices 2015 marked the second year of declines in capital raised, US$228b vs. US$251b in 2014. This decline was almost entirely attributable to loan volumes falling by US$44b to US$122b, highlighting increased risk aversion among lenders. Though bond and follow-on equity issuance flows improved, partly offsetting such falls, these capital sources were largely confined to major producers that mostly went to market during 1H15. Commodity sentiment was significantly affected by China-induced stock market volatility during 3Q15, resulting in a 50% fall in capital raised y-o-y during that quarter to US$32b. Although amounts raised recovered in 4Q15 as the markets stabilized, led by a doubling of loan volumes to US$36b vs.
4Q14, it was not sufficient to offset 3Q falls, with 2H15 finance down 17% y-o-y. Concurrently, 2H15 witnessed producers employ a series of alternative strategies to raise funds, resulting in over US$2.9b in streaming deals being announced, the disposal of non-core assets and other schemes to raise capital (e.g., prepayments). Though small, it is illustrative of how companies have sought to adapt to the growing selectiveness of conventional finance. Cost of capital to stay elevated in 2016 unless pricing environment improves Corporate credit ratings are continuing to be placed on either negative watch or downgraded, while banks remain wary of extending credit to the sector. Equity markets in Australia, Canada and the UK were also subdued, with the real prospect of further shareholder dilution from placements or rights issues prompted by financial distress. Notwithstanding, private equity and well-capitalized producers continue to evaluate possible lending opportunities in the sector, with alternative financing sources continuing to be a source of capital for operations best positioned on the cost curve. Capital raising by asset class — proceeds (US$b) 400 350 300 250 200 150 100 50 IPOs Follow-ons Convertibles Bonds 2015 2014 2013 2012 2011 2010 0 Loans A new normal, or the bottom of the cycle? | 21 .
Loans Following a two-year period of relatively strong lending into the sector, loan proceeds fell 27% during 2015 to US$122b compared to 2014. This fall highlighted growing risk aversion and portfolio reorientation by banks mindful of managing future nonperforming loan exposure, reflected in the number of completed transactions being only marginally less than those in 2014. However, declines in project, capex and acquisition finance, coupled with an increase in working capital and trade finance, illustrate an increasingly cautious approach by banks. With falling and volatile commodity prices encouraging a shift toward short-term collateralized lending (inventories and receivables), reducing the risk of illiquid, long-term positions appears evident to avoid future write-downs, should prices continue deteriorating. Producers have been able to maintain credit access, with this in favor of established, mid-size to large companies. Most loan financing has been done under the auspices of general corporate purposes, although it has likely supported debt refinancing, consistent with that observed in 2014. This is underlined by the sum of both elements remaining stable at 66%–67% across both years. A focus on maintaining operating liquidity has further undermined resource development, with price levels jeopardizing the economic feasibility of greenfield projects.
Although potentially mitigated by support from a combination of quasi-state entities, equipment vendors or parentcorporate guarantees, only those retaining robust balance sheets and shareholder support have achieved financial close. Outlook for 2016 Volumes are likely to remain constrained into 2016, with banks concentrating any credit allocation primarily among cash-generative, large-cap producers. This could create a growing gulf in financing costs among firms, depending on underlying commodity portfolios, geography or size. 350 180 fall in loan proceeds raised relative to 2014 Transaction highlights: • Glencore signed an oversubscribed US$15.3b revolving credit facility in May, among a consortium of 60 banks. General corporate purposes 300 160 10% 15% Project ï¬nance 200 100 150 80 60 100 40 50 20 0 Proceeds | A new normal, or the bottom of the cycle? Volume 2015 2014 2013 2012 2011 2010 0 Trade ï¬nance Number 120 8% 2% Reï¬nancing/retirement 7% Working capital 7% 4% Acquisitions Capex Other 59% 18% 250 140 US$b 27% Primary use of loan proceeds (2014 vs 2015) 200 22 in loan proceeds during 2015 • Rio Tinto concluded a US$7.5b revolving credit facility in November, replacing an existing facility while agreeing on a further US$4.4b in project finance to support further development of Oyu Tolgoi. These constraints may potentially increase, should there be knock-on effects from the current crude oil price environment, which may prompt banks to impair their overall commodity exposure. It may encourage the continued pursuit of alternative financing strategies (e.g., streaming) while acting as a spur to supporting wider industry consolidation. Loan volume and proceeds (2010–2015) US$122b 4% 49% 9% 2% 3% 2% 1% 2015 2014 .
Bonds US$77b The value of bond proceeds offered in 2015 32% Bond proceeds increased by 32% to US$77b in 2015, though comprised two different narratives. A total of US$61b was raised during 1H15, representing a 71% y-o-y increase, backed by significant issuance from Anglo American, BHP Billiton, Fortescue, Glencore, Rio Tinto and Shenhua Group, among others. This contrasted sharply with 2H15 where only US$15b was raised during a period of global stock market volatility and falling commodity prices, which undermined sentiment. Wider bond market sentiment was affected by the expectation of future US interest rate rises, which though led to US dollar strengthening benefiting non-US increase in proceeds value relative to 2014 producers, impacted the issuance and pricing of high-yield bonds. Credit agencies subsequently revised their outlook on commodities, placing several companies on negative watch or downgrading their long-term rating. This led to acute pressure on major producers to deliver debt reductions, significantly reducing the amount raised in 2H15. The latter remains of paramount importance in 2016, with credit default swaps for some companies exceeding 1,000bps during 4Q15.
This may precipitate growing refinancing risk should companies have debt maturing in 2016, without drastic action. Outlook for 2016 Transaction highlights: Most bonds, with the exception of those with short-term maturities, are trading at a discount, which may prompt purchases as part of a wider liability management exercise where corporates have sufficient liquidity to do so. Attempting to refinance any liabilities through the bond market may prove more expensive compared to 1H15, especially with further expectations of future US interest rate increases, potentially resulting in lower 2016 levels. • BHP Billiton raised US$6.5b in a multi-currency hybrid bond in October, aimed at improving overall balance sheet flexibility. • Fortescue’s issued an oversubscribed US$2.3b senior secured bond in April with proceeds used to refinance existing liabilities. • Glencore raised US$2.3b in 3-, 5- and 10-year notes in April for general corporate purposes. Bond volume and proceeds (2010–15) < 5 year CDS swaps for a sample of mining companies 180 1,000 Proceeds Volume Note: CDS swaps are based on senior unsecured debt maturing in five years, with the exception of Companies 2 and 4. Source: Datastream 0 Company 1 Company 2 Company 3 Company 4 Source: Datastream A new normal, or the bottom of the cycle? | Source: Associated Press, S&P Capital IQ Dec 15 2015 2014 2013 2012 2011 2010 0 Nov 15 0 200 Oct 15 20 Sep 15 40 20 400 Aug 15 60 Jul 15 40 600 Jun 15 80 May 15 100 Apr 15 60 800 Mar 15 120 Number 140 80 Jan 15 160 CDS premium (bps) 100 US$b 1,200 200 Feb 15 120 23 .
Convertible bonds Convertible proceeds were US$1.4b, down 62% on 2014 levels. This was captured by an 18% fall in issuance to 78 transactions, with the top five transactions representing 75% of total annual proceeds. The vast majority of convertibles were worth less than US$5m. This reflected general pessimism about the sector and the unlikelihood of realizing upside through converting to equity.
There was a focus by investors on coupon levels and gaining improved priority to collateral in the event of default. Outlook for 2016 An increase in convertible issues could materialize, should investors believe commodity prices have bottomed. This instrument may still prove to be popular with private equity when undertaking transactions among small-cap opportunities if they achieve senior secured rights on underlying assets. 160 8 140 7 US$b 100 5 80 4 60 3 40 2 Proceeds Volume 2015 2014 2013 0 2012 0 2011 20 2010 1 Number 120 6 decline in convertible bonds proceeds relative to 2014 75% Convertible bond volume and proceeds (2010–15) 9 62% of convertible bond value was comprised of the top 5 transactions Transaction highlights: • Baosteel concluded a US$0.5b zero coupon, exchangeable bond issue in November. • Outokumpu completed a €250b senior unsecured convertible bond issue in February. • Paladin Energy raised US$100m in a senior unsecured convertible bond issue in February. 24 | A new normal, or the bottom of the cycle? . Initial public offerings IPO volume and proceeds (2010–15) 20 180 16 160 10 140 120 100 80 6 60 4 40 2 20 0 0 Proceeds 2015 8 Number 12 2014 US$b 14 2013 relative to 2014 200 18 2012 78% Activity levels are likely to remain depressed until a demonstrable recovery in commodity prices begins to draw capital away from other sectors. Glencore Listings down TMAC Resources’ listing in Canada in June 2015 proved the largest offering made at C$135m, followed by CNX Coal Resources LP in the US (US$83m) and Merdeka Copper Gold Pt in Indonesia (US$63m). Outlook for 2016 2011 in IPO proceeds raised during 2015 2010 US$0.3b IPO activity since 2011 has been negligible, with 2015 proving no exception. Only US$0.3b was raised from 13 listings, down 78% y-o-y on a value basis. Volume A new normal, or the bottom of the cycle? | 25 . Follow-on equity Equity placements during 2015 increased by 32% to US$28b, and followed a similar story to that witnessed within the bond market, with a robust 1H15 and a depressed 2H15. A total of US$19b was raised in 1H15, with several companies including Chalco, Coal India, Inner Mongolia Baotau Steel and Wintime Energy issuing shares worth US$1b–US$5b. This increase was based on a supportive environment among shareholders that expected base metal and bulk commodity prices to stabilize or, in some instances, increase (e.g., nickel, zinc). This was premised on pending supply shortages and Chinese demand remaining steady. Following wider commodity and equity market turbulence, 2H15 would have been significantly more depressed, if not bolstered by both Glencore (US$2.5b) and Freeport-McMoRan (US$1b) issuing equity in September, benefiting from shareholder support against a backdrop of turbulent equity markets. These issues were timed well, given that subsequent share price performance across the sector experienced material declines during 2H15. This was reflected by only US$5b being raised in 2H15, excluding the Glencore and Freeport-McMoRan transactions. With prices now depressed relative to historic levels, any future issuance will almost certainly prove dilutive to existing shareholders, and an option is likely to be entertained only if other sources of capital are unavailable.
The market is, therefore, likely to see transaction volumes continue to fall during 2016. Follow-on equity volume and proceeds (2010–15) 3,500 50 3,000 US$b 2,000 30 1,500 20 1,000 10 500 0 Proceeds 26 | A new normal, or the bottom of the cycle? Volume 2015 2014 2013 2012 2011 2010 0 Number 2,500 40 y-o-y increase in follow on equity placements, to US$28b Only US$5b raised in 2H15 (excluding Glencore and Freeport-MacMoRan) Outlook for 2016 60 32% . About this study • The data is primarily sourced from ThomsonONE. • Unless otherwise stated, all values are in US dollars. Mergers and acquisitions • Only completed deals are included. Deals identified as incomplete, pending, partly incomplete, conditional or intended as of 31 December 2015 were excluded. • The acquirer country is based on the ultimate owner’s geographic headquarters. The target country is determined by where the primary targeted asset or company is located. • “Country-based” refers to domestic and inbound deals. • A country’s acquisition refers to domestic and outbound deals. • Commodity analysis is based on the company’s primary commodity focus. • The value of M&A activity by commodity includes deals where the given commodity is the acquirer and/or target’s primary commodity. Commodity charts illustrate the value of deals where the given commodity is the target. Capital raising The primary source for this data is ThomsonONE. Certain details have been supplemented with information from company and stock exchange websites and major business press.
Only completed transactions are included. • Only initial public offerings, the first time a company issues equity to the public — are included in the IPO analysis. Proceeds are allocated to the primary exchange of listing. • Equity issues are geographically categorized by the primary exchange where the issuer’s stock trades, except where stated. Where a company offers Global Depositary Receipts or American Depositary Receipts, the issue is allocated to the destination market of those shares. • Loan data and proceeds include refinancing and amendments to existing debt, and are as per ThomsonONE intelligence.
Proceeds are allocated to the geography of the borrower. • The data does not capture the value of transactions where this information is not publicly available. Contributors • “Megadeals” refer to all deals with a value equal to, or greater than, US$1b. Lee Downham Global Mining & Metals Transactions Leader ldownham@uk.ey.com Jenny Bessey Assistant Director, Mining & Metals Transaction Advisory Services, UKI jbessey@uk.ey.com Jodie Eldridge M&A Analyst, Mining & Metals jodie.eldridge@au.ey.com Karim Awad Senior Strategic Analyst, Mining & Metals kawad@uk.ey.com A new normal, or the bottom of the cycle? | 27 . How EY’s Global Mining & Metals Network can help your business With a volatile outlook for mining and metals, the global mining and metals sector is focused on margin and productivity improvements, while poised for value-based growth opportunities as they arise. The sector also faces the increased challenges of maintaining its social license to operate, balancing its talent requirements, effectively managing its capital projects and engaging with government around revenue expectations. EY’s Global Mining & Metals Network is where people and ideas come together to help mining and metals companies meet the issues of today and anticipate those of tomorrow by developing solutions to meet these challenges. It brings together a worldwide team of professionals to help you succeed — a team with deep technical experience in providing assurance, tax, transactions and advisory services to the mining and metals sector. Ultimately it enables us to help you meet your goals and compete more effectively. Tel: +55 11 2573 3363 miguel.zweig@br.ey.com Oceania Scott Grimley Tel: +61 3 9655 2509 scott.grimley@au.ey.com China and Mongolia Peter Markey Tel: +86 21 2228 2616 peter.markey@cn.ey.com Japan Andrew Cowell Tel: +81 3 3503 3435 cowell-ndrw@shinnihon.or.jp Africa Wickus Botha Tel: +27 11 772 3386 wickus.botha@za.ey.com Commonwealth of Independent States Evgeni Khrustalev Tel: +7 495 648 9624 evgeni.khrustalev@ru.ey.com France, Luxemburg, Maghreb, MENA Christian Mion Tel: +33 1 46 93 65 47 christian.mion@fr.ey.com India Anjani Agrawal Tel: +91 22 6192 0150 anjani.agrawal@in.ey.com United Kingdom and Ireland Lee Downham Tel: +44 20 7951 2178 ldownham@uk.ey.com About EY EY is a global leader in assurance, tax, transaction and advisory services. The insights and quality services we deliver help build trust and confidence in the capital markets and in economies the world over. We develop outstanding leaders who team to deliver on our promises to all of our stakeholders.
In so doing, we play a critical role in building a better working world for our people, for our clients and for our communities. EY refers to the global organization, and may refer to one or more, of the member firms of Ernst & Young Global Limited, each of which is a separate legal entity. Ernst & Young Global Limited, a UK company limited by guarantee, does not provide services to clients. For more information about our organization, please visit ey.com. © 2016 EYGM Limited. All Rights Reserved. EYG no.
ER0295 BMC Agency GA 0000_04661 Area contacts Global Mining & Metals Leader Miguel Zweig EY | Assurance | Tax | Transactions | Advisory United States Andy Miller ED None Canada Bruce Sprague ey.com/miningmetals Tel: +1 314 290 1205 andy.miller@ey.com Tel: +1 604 891 8415 bruce.f.sprague@ca.ey.com Brazil Afonso Sartorio Tel: +551125733074 afonso.sartorio@br.ey.com Chile María Javiera Contreras Tel: + 562 2676 1492 maria.javiera.contreras@cl.ey.com Service line contacts Global Advisory Leader Paul Mitchell Tel: +61 2 9248 5110 paul.mitchell@au.ey.com Global Assurance Leader Alexei Ivanov Tel: +7 495 228 3661 alexei.ivanov@ru.ey.com Global IFRS Leader Tracey Waring Tel: +61 3 9288 8638 tracey.waring@au.ey.com Global Tax Leader Andy Miller Tel: +1 314 290 1205 andy.miller@ey.com Global Transactions Leader Lee Downham Tel: +44 20 7951 2178 ldownham@uk.ey.com This material has been prepared for general informational purposes only and is not intended to be relied upon as accounting, tax or other professional advice. Please refer to your advisors for specific advice. .


