


Description
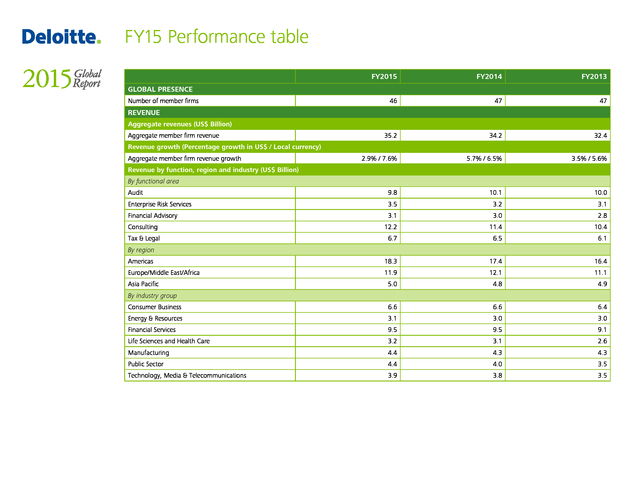
FY15 Performance table
FY2015
FY2014
FY2013
46
47
47
GLOBAL PRESENCE
Number of member firms
REVENUE
Aggregate revenues (US$ Billion)
35.2
34.2
32.4
2.9% / 7.6%
5.7% / 6.5%
3.5% / 5.6%
Audit
9.8
10.1
10.0
Enterprise Risk Services
3.5
3.2
3.1
Aggregate member firm revenue
Revenue growth (Percentage growth in US$ / Local currency)
Aggregate member firm revenue growth
Revenue by function, region and industry (US$ Billion)
By functional area
Financial Advisory
3.1
3.0
2.8
Consulting
12.2
11.4
10.4
Tax & Legal
6.7
6.5
6.1
Americas
18.3
17.4
16.4
Europe/Middle East/Africa
11.9
12.1
11.1
5.0
4.8
4.9
Consumer Business
6.6
6.6
6.4
Energy & Resources
3.1
3.0
3.0
Financial Services
9.5
9.5
9.1
Life Sciences and Health Care
3.2
3.1
2.6
Manufacturing
4.4
4.3
4.3
Public Sector
4.4
4.0
3.5
Technology, Media & Telecommunications
3.9
3.8
3.5
By region
Asia Pacific
By industry group
. FY2015
FY2014
FY2013
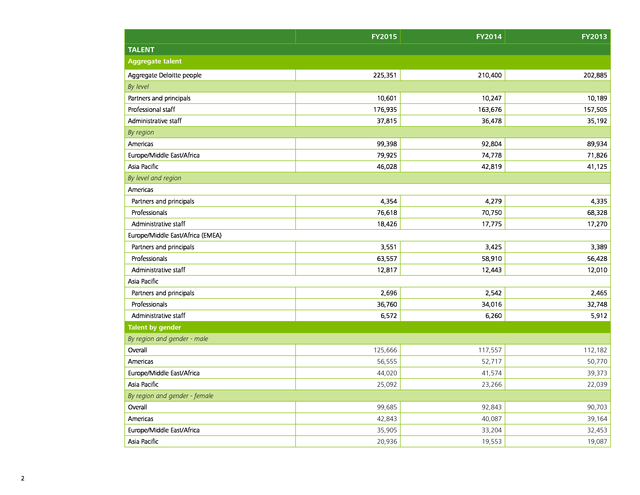
225,351
210,400
202,885
TALENT
Aggregate talent
Aggregate Deloitte people
By level
Partners and principals
10,601
10,247
10,189
176,935
163,676
157,505
37,815
36,478
35,192
Americas
99,398
92,804
89,934
Europe/Middle East/Africa
79,925
74,778
71,826
Asia Pacific
46,028
42,819
41,125
4,354
4,279
4,335
Professionals
76,618
70,750
68,328
Administrative staff
18,426
17,775
17,270
Professional staff
Administrative staff
By region
By level and region
Americas
Partners and principals
Europe/Middle East/Africa (EMEA)
Partners and principals
3,551
3,425
3,389
Professionals
63,557
58,910
56,428
Administrative staff
12,817
12,443
12,010
Asia Pacific
Partners and principals
2,696
2,542
2,465
36,760
34,016
32,748
6,572
6,260
5,912
125,666
117,557
112,182
Americas
56,555
52,717
50,770
Europe/Middle East/Africa
44,020
41,574
39,373
Asia Pacific
25,092
23,266
22,039
Overall
99,685
92,843
90,703
Americas
42,843
40,087
39,164
Europe/Middle East/Africa
35,905
33,204
32,453
Asia Pacific
20,936
19,553
19,087
Professionals
Administrative staff
Talent by gender
By region and gender - male
Overall
By region and gender - female
2
. FY2015
FY2014
FY2013
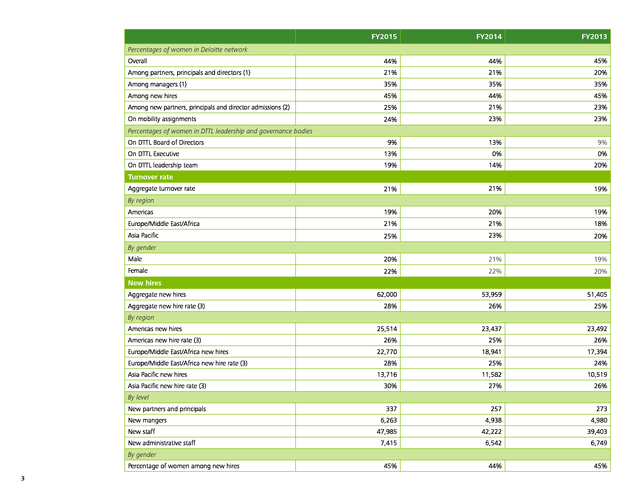
Overall
44%
44%
45%
Among partners, principals and directors (1)
21%
21%
20%
Among managers (1)
35%
35%
35%
Among new hires
45%
44%
45%
Among new partners, principals and director admissions (2)
25%
21%
23%
On mobility assignments
24%
23%
23%
9%
13%
9%
Percentages of women in Deloitte network
Percentages of women in DTTL leadership and governance bodies
On DTTL Board of Directors
On DTTL Executive
13%
0%
0%
On DTTL leadership team
19%
14%
20%
21%
21%
19%
Americas
19%
20%
19%
Europe/Middle East/Africa
21%
21%
18%
Asia Pacific
25%
23%
20%
Male
20%
21%
19%
Female
22%
22%
20%
62,000
53,959
51,405
28%
26%
25%
25,514
23,437
23,492
26%
25%
26%
22,770
18,941
17,394
28%
25%
24%
13,716
11,582
10,519
30%
27%
26%
Turnover rate
Aggregate turnover rate
By region
By gender
New hires
Aggregate new hires
Aggregate new hire rate (3)
By region
Americas new hires
Americas new hire rate (3)
Europe/Middle East/Africa new hires
Europe/Middle East/Africa new hire rate (3)
Asia Pacific new hires
Asia Pacific new hire rate (3)
By level
New partners and principals
New mangers
New staff
New administrative staff
337
257
273
6,263
4,938
4,980
47,985
42,222
39,403
7,415
6,542
6,749
45%
44%
45%
By gender
Percentage of women among new hires
3
. FY2015
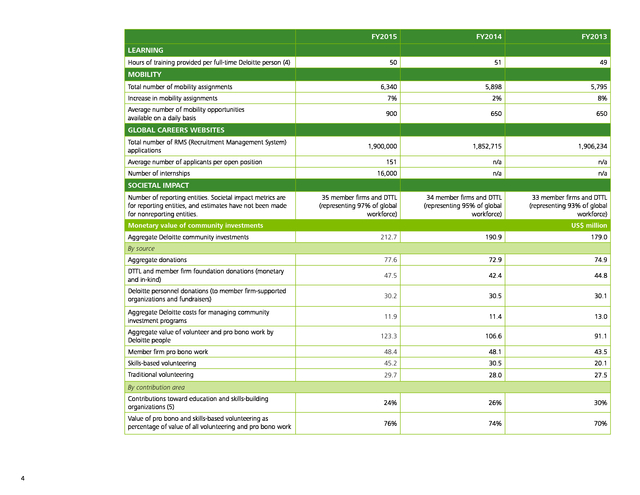
LEARNING
Hours of training provided per full-time Deloitte person (4)
MOBILITY
Total number of mobility assignments
FY2014
FY2013
50
51
49
6,340
5,898
5,795
Increase in mobility assignments
7%
2%
8%
Average number of mobility opportunities
available on a daily basis
900
650
650
GLOBAL CAREERS WEBSITES
Total number of RMS (Recruitment Management System)
applications
1,900,000
1,852,715
1,906,234
151
n/a
n/a
16,000
n/a
n/a
35 member firms and DTTL
(representing 97% of global
workforce)
34 member firms and DTTL
(representing 95% of global
workforce)
33 member firms and DTTL
(representing 93% of global
workforce)
212.7
190.9
179.0
Aggregate donations
77.6
72.9
74.9
DTTL and member firm foundation donations (monetary
and in-kind)
47.5
42.4
44.8
Deloitte personnel donations (to member firm-supported
organizations and fundraisers)
30.2
30.5
30.1
Aggregate Deloitte costs for managing community
investment programs
11.9
11.4
13.0
123.3
106.6
91.1
Member firm pro bono work
48.4
48.1
43.5
Skills-based volunteering
45.2
30.5
20.1
Traditional volunteering
29.7
28.0
27.5
Contributions toward education and skills-building
organizations (5)
24%
26%
30%
Value of pro bono and skills-based volunteering as
percentage of value of all volunteering and pro bono work
76%
74%
70%
Average number of applicants per open position
Number of internships
SOCIETAL IMPACT
Number of reporting entities. Societal impact metrics are
for reporting entities, and estimates have not been made
for nonreporting entities.
Monetary value of community investments
Aggregate Deloitte community investments
US$ million
By source
Aggregate value of volunteer and pro bono work by
Deloitte people
By contribution area
4
. FY2015
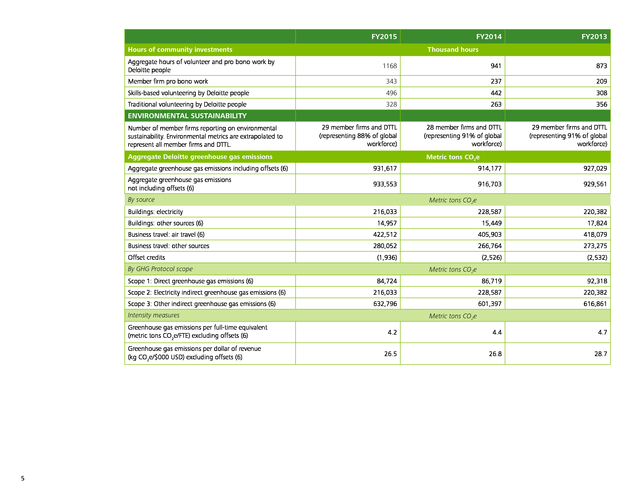
Hours of community investments
Aggregate hours of volunteer and pro bono work by
Deloitte people
FY2014
FY2013
Thousand hours
1168
941
873
Member firm pro bono work
343
237
209
Skills-based volunteering by Deloitte people
496
442
308
Traditional volunteering by Deloitte people
328
263
356
ENVIRONMENTAL SUSTAINABILITY
Number of member firms reporting on environmental
sustainability. Environmental metrics are extrapolated to
represent all member firms and DTTL.
29 member firms and DTTL
(representing 88% of global
workforce)
Aggregate Deloitte greenhouse gas emissions
28 member firms and DTTL
(representing 91% of global
workforce)
29 member firms and DTTL
(representing 91% of global
workforce)
Metric tons CO2e
Aggregate greenhouse gas emissions including offsets (6)
931,617
914,177
927,029
Aggregate greenhouse gas emissions
not including offsets (6)
933,553
916,703
929,561
By source
Buildings: electricity
Metric tons CO2e
216,033
228,587
220,382
Buildings: other sources (6)
14,957
15,449
17,824
Business travel: air travel (6)
422,512
405,903
418,079
Business travel: other sources
280,052
266,764
273,275
(2,526)
(2,532)
84,724
86,719
92,318
Scope 2: Electricity indirect greenhouse gas emissions (6)
216,033
228,587
220,382
Scope 3: Other indirect greenhouse gas emissions (6)
632,796
601,397
616,861
4.2
4.4
4.7
26.5
26.8
28.7
Offset credits
(1,936)
By GHG Protocol scope
Scope 1: Direct greenhouse gas emissions (6)
Metric tons CO2e
Intensity measures
Greenhouse gas emissions per full-time equivalent
(metric tons CO2e/FTE) excluding offsets (6)
Greenhouse gas emissions per dollar of revenue
(kg CO2e/$000 USD) excluding offsets (6)
5
Metric tons CO2e
. FY2015
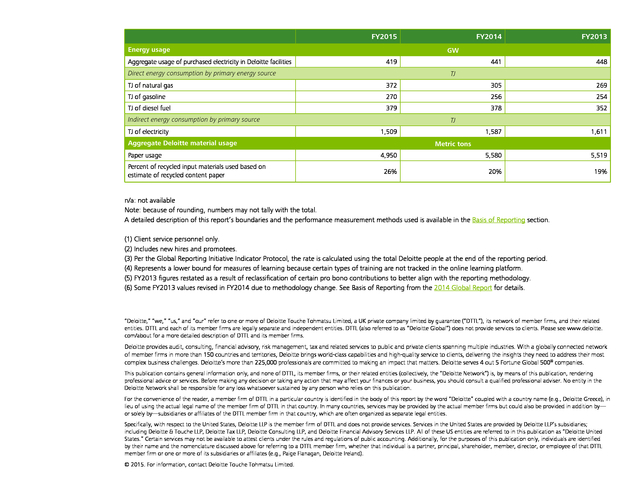
Energy usage
Aggregate usage of purchased electricity in Deloitte facilities
FY2014
FY2013
441
448
GW
419
Direct energy consumption by primary energy source
TJ
TJ of natural gas
372
305
269
TJ of gasoline
270
256
254
TJ of diesel fuel
379
378
352
1,587
1,611
4,950
5,580
5,519
26%
20%
19%
Indirect energy consumption by primary source
TJ of electricity
TJ
1,509
Aggregate Deloitte material usage
Paper usage
Percent of recycled input materials used based on
estimate of recycled content paper
Metric tons
n/a: not available
Note: because of rounding, numbers may not tally with the total.
A detailed description of this report’s boundaries and the performance measurement methods used is available in the Basis of Reporting section.
(1) Client service personnel only.
(2) Includes new hires and promotees.
(3) Per the Global Reporting Initiative Indicator Protocol, the rate is calculated using the total Deloitte people at the end of the reporting period.
(4) Represents a lower bound for measures of learning because certain types of training are not tracked in the online learning platform.
(5) FY2013 figures restated as a result of reclassification of certain pro bono contributions to better align with the reporting methodology.
(6) Some FY2013 values revised in FY2014 due to methodology change. See Basis of Reporting from the 2014 Global Report for details.
“Deloitte,” “we,” “us,” and “our” refer to one or more of Deloitte Touche Tohmatsu Limited, a UK private company limited by guarantee (“DTTL”), its network of member firms, and their related
entities. DTTL and each of its member firms are legally separate and independent entities. DTTL (also referred to as “Deloitte Global”) does not provide services to clients.
Please see www.deloitte. com/about for a more detailed description of DTTL and its member firms. Deloitte provides audit, consulting, financial advisory, risk management, tax and related services to public and private clients spanning multiple industries. With a globally connected network of member firms in more than 150 countries and territories, Deloitte brings world-class capabilities and high-quality service to clients, delivering the insights they need to address their most complex business challenges. Deloitte’s more than 225,000 professionals are committed to making an impact that matters.
Deloitte serves 4 out 5 Fortune Global 500® companies. This publication contains general information only, and none of DTTL, its member firms, or their related entities (collectively, the “Deloitte Network”) is, by means of this publication, rendering professional advice or services. Before making any decision or taking any action that may affect your finances or your business, you should consult a qualified professional adviser. No entity in the Deloitte Network shall be responsible for any loss whatsoever sustained by any person who relies on this publication. For the convenience of the reader, a member firm of DTTL in a particular country is identified in the body of this report by the word “Deloitte” coupled with a country name (e.g., Deloitte Greece), in lieu of using the actual legal name of the member firm of DTTL in that country.
In many countries, services may be provided by the actual member firms but could also be provided in addition by— or solely by—subsidiaries or affiliates of the DTTL member firm in that country, which are often organized as separate legal entities. Specifically, with respect to the United States, Deloitte LLP is the member firm of DTTL and does not provide services. Services in the United States are provided by Deloitte LLP’s subsidiaries; including Deloitte & Touche LLP, Deloitte Tax LLP, Deloitte Consulting LLP, and Deloitte Financial Advisory Services LLP. All of these US entities are referred to in this publication as “Deloitte United States.” Certain services may not be available to attest clients under the rules and regulations of public accounting.
Additionally, for the purposes of this publication only, individuals are identified by their name and the nomenclature discussed above for referring to a DTTL member firm, whether that individual is a partner, principal, shareholder, member, director, or employee of that DTTL member firm or one or more of its subsidiaries or affiliates (e.g., Paige Flanagan, Deloitte Ireland). © 2015. For information, contact Deloitte Touche Tohmatsu Limited. .