


Description
®
The Global
Corporate Advisor
March 2016
The Corporate Finance newsletter of Crowe Horwath International
Welcome to the March 2016 issue of
Global Corporate Advisor.
In this issue, from France we have
an article on valuation methodologies
used for goodwill impairment tests
under IAS 36. The piece examines
relevant concepts such as measuring
recoverable amount and the various
scenarios in which it is pertinent to
account for goodwill impairment.
An article from India reports on the
Ease of Doing Business index and
the country’s improved position on
it. Regulatory changes in processes
related to businesses in various sectors
are listed as well.
In the last of M&A updates from 2015,
we look at Canada where, fueled by
macroeconomic factors conducive to
a positive private equity environment,
transaction values in H1 2015 reached
C$11.4 billion. There is every reason
to believe that some key regions and
sectors are poised for a strong 2016.
Andrew Fressl
Regional Leader, Oceania
+61 2 9619 1669
andrew.fressl@crowehorwath.com.au
Inside This Issue:
Contact Us
The GCA team is here to respond to your needs relating to M&A transaction
support, valuations and advisory services.
If there is a topic you would like us to cover in future issues of the GCA newsletter, don’t hesitate to contact Peter Varley, Chairman of GCA, at peter.varley@crowecw.co.uk. Alternatively, please contact your local GCA team member to discuss your ideas. Audit | Tax | Advisory ©2016 Crowe Horwath International Welcome 1 Goodwill Impairment Tests under IAS 36: Valuation Methodology 2 Ease of Doing Business in India 6 M&A Update 2015: Canada 9 www.crowehorwath.net 1 . March 2016 ® Goodwill Impairment Tests Under IAS 36: Valuation Methodology By Olivier Grivillers and Maxime Hazim, Paris Several studies have shown that goodwill represents an important part of total assets of listed companies. In 2014, companies listed on the French index CAC40 displayed more than €490 billion of intangible assets (of which €300 billion was by way of goodwill) i.e. roughly 59% of equity. Goodwill can be defined as the result of the difference between the purchase price of a company and its net equity amount. As a consequence, goodwill only results from external growth, i.e. the acquisition of another company, which means that companies growing organically do not record any goodwill in their accounts. The weight of goodwill depends on the company policy. A high level of goodwill is synonymous with external growth and acquisitions.
Goodwill impairment reflects a poor acquisition since it points up to a market value inferior to its acquisition value. It is then important to know the methodology followed to review the goodwill value and indirectly follow-up on the value of the underlying acquired business. International accounting standards (IAS 36 - Impairment of Assets) force companies to review goodwill value over time. Indeed, goodwill can be impaired but cannot be subject to revaluation. The European Securities and Markets Authority (ESMA) provided in a report dated January 7, 2013 an overview of accounting practices related to impairment testing of goodwill and other intangible assets.
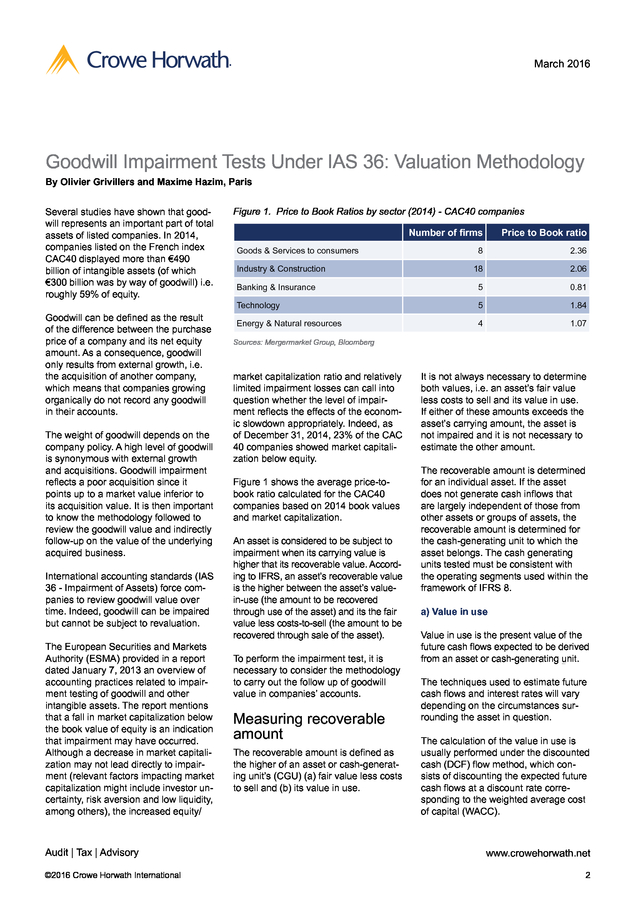
The report mentions that a fall in market capitalization below the book value of equity is an indication that impairment may have occurred. Although a decrease in market capitalization may not lead directly to impairment (relevant factors impacting market capitalization might include investor uncertainty, risk aversion and low liquidity, among others), the increased equity/ Audit | Tax | Advisory ©2016 Crowe Horwath International Figure 1. Price to Book Ratios by sector (2014) - CAC40 companies Number of firms Price to Book ratio 8 2.36 18 2.06 Banking & Insurance 5 0.81 Technology 5 1.84 Energy & Natural resources 4 1.07 Goods & Services to consumers Industry & Construction Sources: Mergermarket Group, Bloomberg market capitalization ratio and relatively limited impairment losses can call into question whether the level of impairment reflects the effects of the economic slowdown appropriately. Indeed, as of December 31, 2014, 23% of the CAC 40 companies showed market capitalization below equity. Figure 1 shows the average price-tobook ratio calculated for the CAC40 companies based on 2014 book values and market capitalization. An asset is considered to be subject to impairment when its carrying value is higher that its recoverable value.
According to IFRS, an asset’s recoverable value is the higher between the asset’s valuein-use (the amount to be recovered through use of the asset) and its the fair value less costs-to-sell (the amount to be recovered through sale of the asset). To perform the impairment test, it is necessary to consider the methodology to carry out the follow up of goodwill value in companies’ accounts. Measuring recoverable amount The recoverable amount is defined as the higher of an asset or cash-generating unit’s (CGU) (a) fair value less costs to sell and (b) its value in use. It is not always necessary to determine both values, i.e. an asset’s fair value less costs to sell and its value in use. If either of these amounts exceeds the asset’s carrying amount, the asset is not impaired and it is not necessary to estimate the other amount. The recoverable amount is determined for an individual asset. If the asset does not generate cash inflows that are largely independent of those from other assets or groups of assets, the recoverable amount is determined for the cash-generating unit to which the asset belongs.
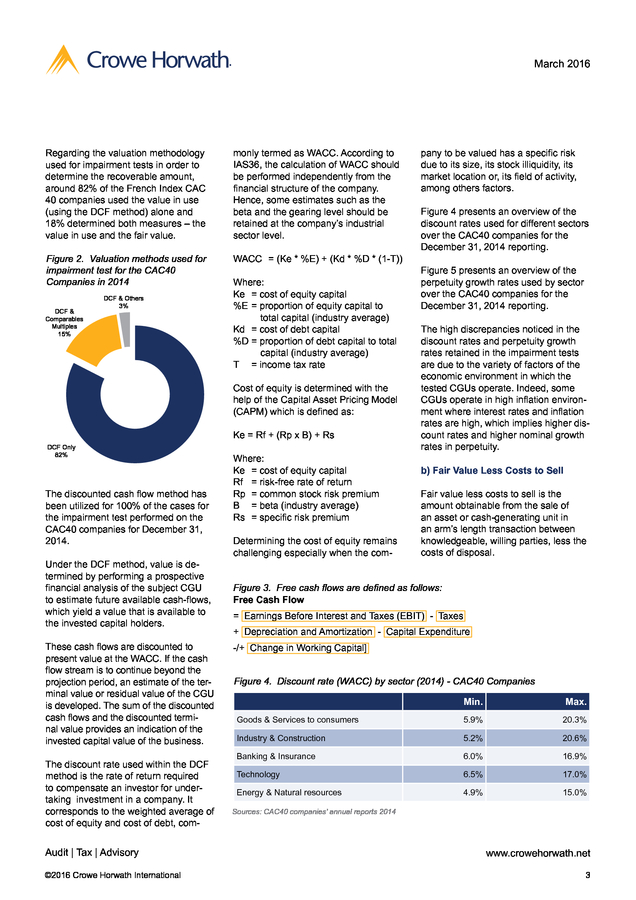
The cash generating units tested must be consistent with the operating segments used within the framework of IFRS 8. a) Value in use Value in use is the present value of the future cash flows expected to be derived from an asset or cash-generating unit. The techniques used to estimate future cash flows and interest rates will vary depending on the circumstances surrounding the asset in question. The calculation of the value in use is usually performed under the discounted cash (DCF) flow method, which consists of discounting the expected future cash flows at a discount rate corresponding to the weighted average cost of capital (WACC). www.crowehorwath.net 2 . March 2016 ® Regarding the valuation methodology used for impairment tests in order to determine the recoverable amount, around 82% of the French Index CAC 40 companies used the value in use (using the DCF method) alone and 18% determined both measures – the value in use and the fair value. monly termed as WACC. According to IAS36, the calculation of WACC should be performed independently from the financial structure of the company. Hence, some estimates such as the beta and the gearing level should be retained at the company’s industrial sector level. Figure 2. Valuation methods used for impairment test for the CAC40 Companies in 2014 WACC = (Ke * %E) + (Kd * %D * (1-T)) DCF & Comparables Multiples 15% DCF & Others 3% Where: Ke = cost of equity capital %E proportion of equity capital to = total capital (industry average) Kd = cost of debt capital %D = proportion of debt capital to total capital (industry average) T = income tax rate Cost of equity is determined with the help of the Capital Asset Pricing Model (CAPM) which is defined as: Ke = Rf + (Rp x B) + Rs DCF Only 82% The discounted cash flow method has been utilized for 100% of the cases for the impairment test performed on the CAC40 companies for December 31, 2014. Under the DCF method, value is determined by performing a prospective financial analysis of the subject CGU to estimate future available cash-flows, which yield a value that is available to the invested capital holders. These cash flows are discounted to present value at the WACC. If the cash flow stream is to continue beyond the projection period, an estimate of the terminal value or residual value of the CGU is developed.
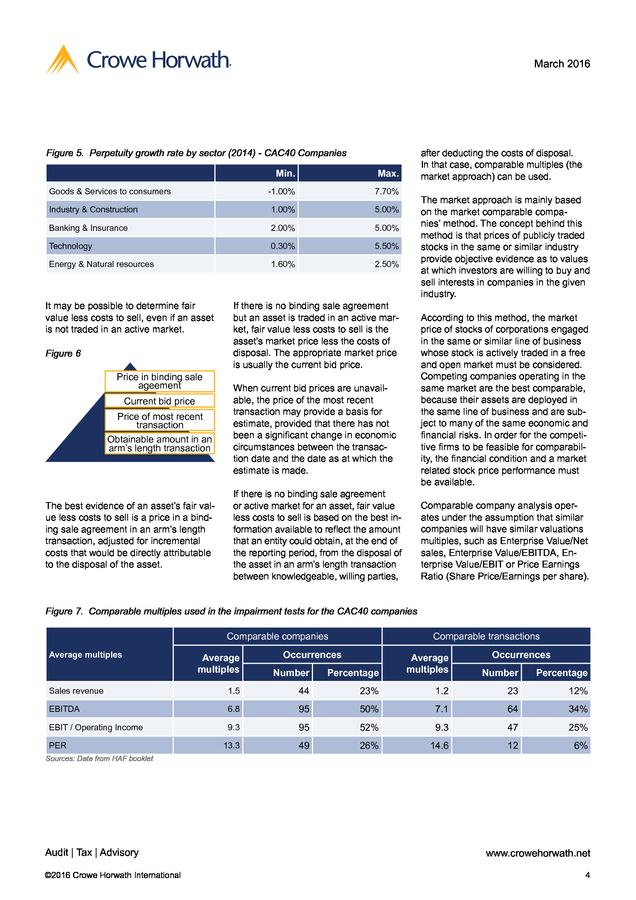
The sum of the discounted cash flows and the discounted terminal value provides an indication of the invested capital value of the business. The discount rate used within the DCF method is the rate of return required to compensate an investor for undertaking investment in a company. It corresponds to the weighted average of cost of equity and cost of debt, com- Audit | Tax | Advisory ©2016 Crowe Horwath International Where: Ke = cost of equity capital Rf = risk-free rate of return Rp = common stock risk premium B = beta (industry average) Rs = specific risk premium Determining the cost of equity remains challenging especially when the com- pany to be valued has a specific risk due to its size, its stock illiquidity, its market location or, its field of activity, among others factors. Figure 4 presents an overview of the discount rates used for different sectors over the CAC40 companies for the December 31, 2014 reporting. Figure 5 presents an overview of the perpetuity growth rates used by sector over the CAC40 companies for the December 31, 2014 reporting. The high discrepancies noticed in the discount rates and perpetuity growth rates retained in the impairment tests are due to the variety of factors of the economic environment in which the tested CGUs operate. Indeed, some CGUs operate in high inflation environment where interest rates and inflation rates are high, which implies higher discount rates and higher nominal growth rates in perpetuity. b) Fair Value Less Costs to Sell Fair value less costs to sell is the amount obtainable from the sale of an asset or cash-generating unit in an arm’s length transaction between knowledgeable, willing parties, less the costs of disposal. Figure 3.
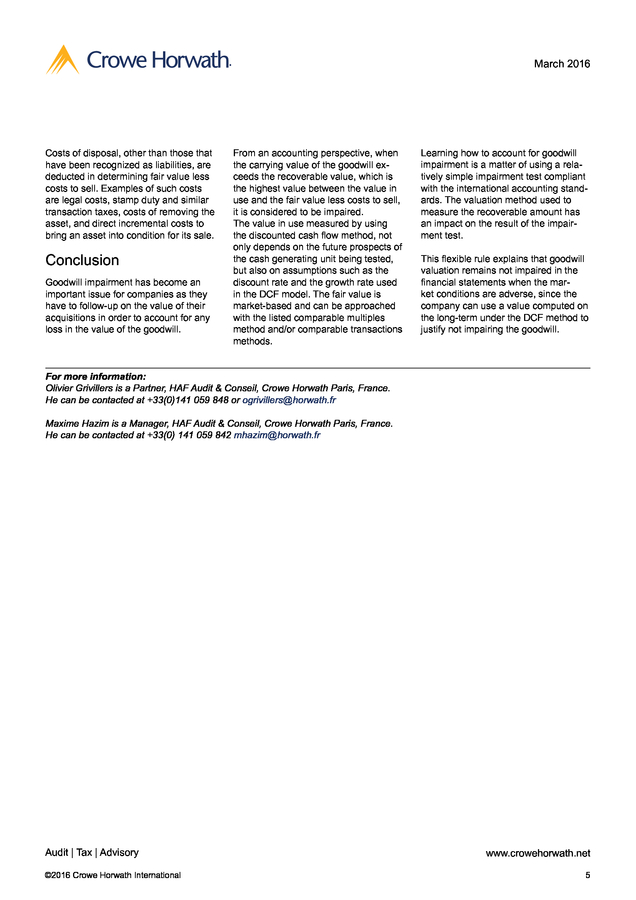
Free cash flows are defined as follows: Free Cash Flow = Earnings Before Interest and Taxes (EBIT) - Taxes + Depreciation and Amortization - Capital Expenditure -/+ Change in Working Capital] Figure 4. Discount rate (WACC) by sector (2014) - CAC40 Companies Min. Max. Goods & Services to consumers 5.9% 20.3% Industry & Construction 5.2% 20.6% Banking & Insurance 6.0% 16.9% Technology 6.5% 17.0% Energy & Natural resources 4.9% 15.0% Sources: CAC40 companies’ annual reports 2014 www.crowehorwath.net 3 . March 2016 ® Figure 5. Perpetuity growth rate by sector (2014) - CAC40 Companies Min. Max. -1.00% 7.70% Industry & Construction 1.00% 5.00% Banking & Insurance 2.00% 5.00% Technology 0.30% 5.50% Energy & Natural resources 1.60% after deducting the costs of disposal. In that case, comparable multiples (the market approach) can be used. 2.50% Goods & Services to consumers It may be possible to determine fair value less costs to sell, even if an asset is not traded in an active market. Figure 6 Price in binding sale ageement Current bid price Price of most recent transaction Obtainable amount in an arm’s length transaction The best evidence of an asset’s fair value less costs to sell is a price in a binding sale agreement in an arm’s length transaction, adjusted for incremental costs that would be directly attributable to the disposal of the asset. The market approach is mainly based on the market comparable companies’ method. The concept behind this method is that prices of publicly traded stocks in the same or similar industry provide objective evidence as to values at which investors are willing to buy and sell interests in companies in the given industry. If there is no binding sale agreement but an asset is traded in an active market, fair value less costs to sell is the asset’s market price less the costs of disposal. The appropriate market price is usually the current bid price. According to this method, the market price of stocks of corporations engaged in the same or similar line of business whose stock is actively traded in a free and open market must be considered. Competing companies operating in the same market are the best comparable, because their assets are deployed in the same line of business and are subject to many of the same economic and financial risks.
In order for the competitive firms to be feasible for comparability, the financial condition and a market related stock price performance must be available. When current bid prices are unavailable, the price of the most recent transaction may provide a basis for estimate, provided that there has not been a significant change in economic circumstances between the transaction date and the date as at which the estimate is made. If there is no binding sale agreement or active market for an asset, fair value less costs to sell is based on the best information available to reflect the amount that an entity could obtain, at the end of the reporting period, from the disposal of the asset in an arm’s length transaction between knowledgeable, willing parties, Comparable company analysis operates under the assumption that similar companies will have similar valuations multiples, such as Enterprise Value/Net sales, Enterprise Value/EBITDA, Enterprise Value/EBIT or Price Earnings Ratio (Share Price/Earnings per share). Figure 7. Comparable multiples used in the impairment tests for the CAC40 companies Comparable companies Average multiples Occurrences Average multiples Number Sales revenue 1.5 EBITDA EBIT / Operating Income PER Comparable transactions Occurrences Percentage Average multiples Number Percentage 44 23% 1.2 23 12% 6.8 95 50% 7.1 64 34% 9.3 95 52% 9.3 47 25% 13.3 49 26% 14.6 12 6% Sources: Data from HAF booklet Audit | Tax | Advisory ©2016 Crowe Horwath International www.crowehorwath.net 4 . March 2016 ® Costs of disposal, other than those that have been recognized as liabilities, are deducted in determining fair value less costs to sell. Examples of such costs are legal costs, stamp duty and similar transaction taxes, costs of removing the asset, and direct incremental costs to bring an asset into condition for its sale. Conclusion Goodwill impairment has become an important issue for companies as they have to follow-up on the value of their acquisitions in order to account for any loss in the value of the goodwill. From an accounting perspective, when the carrying value of the goodwill exceeds the recoverable value, which is the highest value between the value in use and the fair value less costs to sell, it is considered to be impaired. The value in use measured by using the discounted cash flow method, not only depends on the future prospects of the cash generating unit being tested, but also on assumptions such as the discount rate and the growth rate used in the DCF model. The fair value is market-based and can be approached with the listed comparable multiples method and/or comparable transactions methods. Learning how to account for goodwill impairment is a matter of using a relatively simple impairment test compliant with the international accounting standards. The valuation method used to measure the recoverable amount has an impact on the result of the impairment test. This flexible rule explains that goodwill valuation remains not impaired in the financial statements when the market conditions are adverse, since the company can use a value computed on the long-term under the DCF method to justify not impairing the goodwill. For more information: Olivier Grivillers is a Partner, HAF Audit & Conseil, Crowe Horwath Paris, France. He can be contacted at +33(0)141 059 848 or ogrivillers@horwath.fr Maxime Hazim is a Manager, HAF Audit & Conseil, Crowe Horwath Paris, France. He can be contacted at +33(0) 141 059 842 mhazim@horwath.fr Audit | Tax | Advisory ©2016 Crowe Horwath International www.crowehorwath.net 5 .
March 2016 ® Ease of Doing Business in India By Nikhil Morsawala, Mumbai The government’s efforts, among other things, focus on implementing reforms relating to starting a business, tax payments and reporting, resolving insolvency, enforcing contracts, and trading across borders. domestic market and the export market; this adds to the GDP and the foreign exchange wealth of the nation. “India copes with stress in the way that its roads cope with the traffic: constant chaos, surprisingly few casualties.” British journalist Bruce Anderson, Independent (London), 09.03.2009 Attracting investment means that the environment for investment must be friendly. “When we talk of a “look East” policy, we must also talk about “link West” policy. Both need to work simultaneously.” Growth of business in India requires concerted action on several fronts – infrastructure, capital markets, trade facilitation and skills. In reality, India must also deal with its regulatory and bureaucratic challenges, in terms of becoming an easier place to do business. A disproportionately high regulatory burden is borne by businesses in India today. Prime Minister of India, Narendra Modi, 2015 A wide range of forecasts indicate that, by 2020, India will be home to 1.35 billion people, of whom 906 million will be of working age. These 906 million will need jobs to sustain India’s growth and populace, and these jobs can only be provided by significant and longterm growth of the manufacturing and service sectors in India. Initiatives for ease of doing business The challenge ahead, therefore, is to create jobs to employ India’s rapidly growing youth base, and the key means of doing so is to increase private investment in India.
Today’s investment equals tomorrow’s jobs, and so the government of India has embarked on the ambitious ‘Make in India’ initiative. Make in India not only creates these jobs, but also serves a larger economic purpose – added manufacturing output for the large India has embarked on an ambitious agenda to improve its ‘Ease of Doing Business’ rank to 50 out of 189 countries by 2017 (it is rated at 130 in 2016, based on factors assessed for 2014 and 2015); however, this effort will only address a small subset of the regulatory burden on investors. Doing Business reforms will only address central regulations; the rest of the country must also improve simultaneously to convert reforms into results. Figure 1.
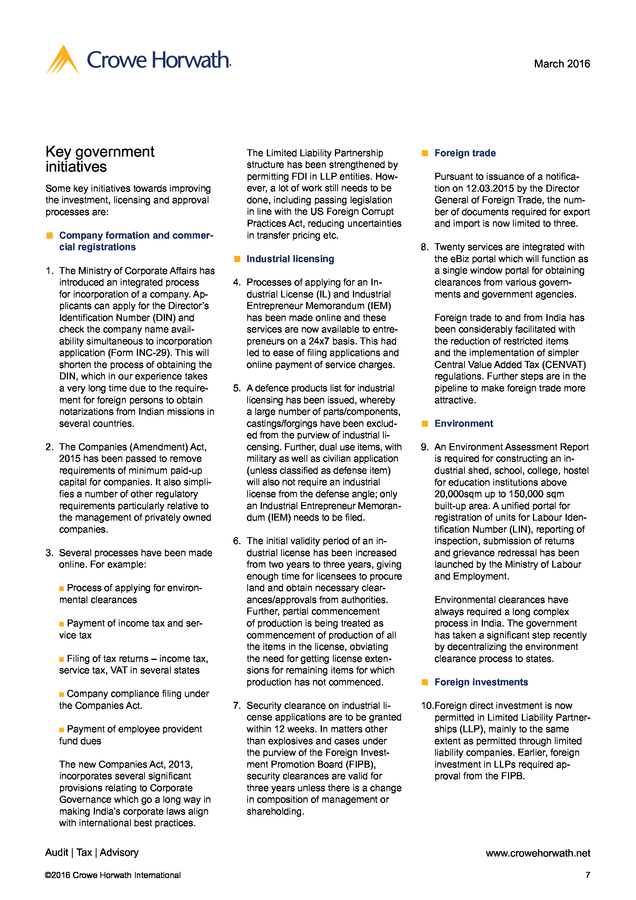
Rankings on Doing Business topics (Scale: Rank 189 center, Rank 1 outer edge) Starting a business (73.59) Dealing with construction permits (183) Enforcing contracts (178) Trading across borders (133) Paying taxes (157) India’s ranking has improved from 142 to 130 out of 189 countries between 2014 and 2015, reflecting government’s efforts and the changes that it has brought about to hasten the reform process and reduce the onerous regulatory processes of doing business in India. Figure 2. Distance to frontier scores on Doing Business topics - India (Scale: Score 0 center, Score 100 outer edge) Starting a business (155) Resolving insolvency (136) While efforts towards improving India’s ranking in the Doing Business Report cover some of the regulatory issues pertaining to state governments, much more is required to be done at state governments’ level to achieve the Prime Minister’s vision of making India an easy place to do business. A majority of the regulatory burden imposed on business is due to the plethora of laws, rules, regulations and procedures enforced by the states.
This gives rise to a wide number of registrations, licenses and no objection certificates (NOCs) that businesses must obtain and file compliance reports on. Getting electricity (70) Protecting minority investors (8) Getting credit (42) Protecting minority investors (8) Resolving insolvency (32.41) Enforcing contracts (32.41) Trading across borders (56.45) Paying taxes (56.14) Dealing with construction permits (32.47) Getting electricity (74.56) Registering property (50.29) Getting credit (65) Protecting minority investors (73.33) Source: World Bank 2016, Doing Business 2016: Measuring Regulatory Quality and Efficiency Note: The rankings are benchmarked to June 2015 and based on the average of each economy’s distance to frontier (DTF) scores for the 10 topics included in this year’s aggregate ranking. The distance to frontier score benchmarks economies with respect to regulatory practice, showing the absolute distance to the best performance in each Doing Business indicator. An economy’s distance to frontier score is indicated on a scale from 0 to 100, where 0 represents the worst performance and 100 the frontier.
For the economies for which the data cover 2 cities, scores are a population-weighted average for the 2 cities. Audit | Tax | Advisory ©2016 Crowe Horwath International www.crowehorwath.net 6 . March 2016 ® Key government initiatives Some key initiatives towards improving the investment, licensing and approval processes are: â– Company formation and commercial registrations 1. The Ministry of Corporate Affairs has introduced an integrated process for incorporation of a company. Applicants can apply for the Director’s Identification Number (DIN) and check the company name availability simultaneous to incorporation application (Form INC-29). This will shorten the process of obtaining the DIN, which in our experience takes a very long time due to the requirement for foreign persons to obtain notarizations from Indian missions in several countries. 2. The Companies (Amendment) Act, 2015 has been passed to remove requirements of minimum paid-up capital for companies. It also simplifies a number of other regulatory requirements particularly relative to the management of privately owned companies. 3. Several processes have been made online.
For example: â– Process of applying for environmental clearances â– Payment of income tax and service tax â– Filing of tax returns – income tax, service tax, VAT in several states â– Company compliance filing under the Companies Act. â– Payment of employee provident fund dues The new Companies Act, 2013, incorporates several significant provisions relating to Corporate Governance which go a long way in making India’s corporate laws align with international best practices. Audit | Tax | Advisory ©2016 Crowe Horwath International The Limited Liability Partnership structure has been strengthened by permitting FDI in LLP entities. However, a lot of work still needs to be done, including passing legislation in line with the US Foreign Corrupt Practices Act, reducing uncertainties in transfer pricing etc. â– Industrial licensing 4. Processes of applying for an Industrial License (IL) and Industrial Entrepreneur Memorandum (IEM) has been made online and these services are now available to entrepreneurs on a 24x7 basis. This had led to ease of filing applications and online payment of service charges. 5. A defence products list for industrial licensing has been issued, whereby a large number of parts/components, castings/forgings have been excluded from the purview of industrial licensing.
Further, dual use items, with military as well as civilian application (unless classified as defense item) will also not require an industrial license from the defense angle; only an Industrial Entrepreneur Memorandum (IEM) needs to be filed. 6. The initial validity period of an industrial license has been increased from two years to three years, giving enough time for licensees to procure land and obtain necessary clearances/approvals from authorities. Further, partial commencement of production is being treated as commencement of production of all the items in the license, obviating the need for getting license extensions for remaining items for which production has not commenced. 7. Security clearance on industrial license applications are to be granted within 12 weeks. In matters other than explosives and cases under the purview of the Foreign Investment Promotion Board (FIPB), security clearances are valid for three years unless there is a change in composition of management or shareholding. â– Foreign trade Pursuant to issuance of a notification on 12.03.2015 by the Director General of Foreign Trade, the number of documents required for export and import is now limited to three. 8. Twenty services are integrated with the eBiz portal which will function as a single window portal for obtaining clearances from various governments and government agencies. Foreign trade to and from India has been considerably facilitated with the reduction of restricted items and the implementation of simpler Central Value Added Tax (CENVAT) regulations. Further steps are in the pipeline to make foreign trade more attractive. â– Environment 9. An Environment Assessment Report is required for constructing an industrial shed, school, college, hostel for education institutions above 20,000sqm up to 150,000 sqm built-up area.
A unified portal for registration of units for Labour Identification Number (LIN), reporting of inspection, submission of returns and grievance redressal has been launched by the Ministry of Labour and Employment. Environmental clearances have always required a long complex process in India. The government has taken a significant step recently by decentralizing the environment clearance process to states. â– Foreign investments 10. oreign direct investment is now F permitted in Limited Liability Partnerships (LLP), mainly to the same extent as permitted through limited liability companies. Earlier, foreign investment in LLPs required approval from the FIPB. www.crowehorwath.net 7 .
March 2016 ® undertaken without the approval of the head of the department; and (e) system of self-certification should be introduced for all non-risk, nonhazardous businesses. 11. An Investor Facilitation Cell has been created on the government portal to guide, assist and handhold investors during the entire lifecycle of the business. 12. A checklist with specific timelines has been developed for processing all applications filed by foreign investors in cases relating to retail and export oriented units (EOUs) foreign investments. India has been the beneficiary of significant foreign investments. The government has announced ambitious infrastructure development plans which cannot be implemented without external investments. The government has therefore taken quite a few confidence building measures, including giving an assurance that tax regulations will henceforth not be amended retrospectively. â– Compliances 13. Central and state government ministries and departments have been requested to simplify and rationalize the regulatory environment by taking the following measures on priority: a) All returns should be filed online through a unified form; b) A checklist of required compliances should be placed on the department’s web portal; c) All registers required to be maintained by the business should be replaced with a single electronic register; d) No inspection should be States have started acting on these requests though at varied paces. Maharashtra state has, for example, reduced approvals and licenses required for setting up hotels by about two-thirds of what was earlier needed. Initiatives in the pipeline 1. Implementation of the Goods and Service Tax statute: India currently has state level VAT regulations and a central service tax regulation. Litigations abound across India as to which blended offerings attract either or both of these taxes. The government has introduced legislation in the parliament to implement a uniform Goods and Services Tax and to abolish the existing dual legislation. 2. The implementation of a comprehensive Bankruptcy Law.
Indian banks have been struggling with a disproportionately large amount of bad loans over the last couple of decades. The government is contemplating a legislation that will help identify potential bad loans at an early stage, which will allow stressed companies to construct turnaround strategies. 3. India is yet to make any significant headway in overhauling its labor laws to align them to global practices. While several draft legislations have been discussed, there is yet to emerge a political consensus on this socially sensitive issue, which is extremely necessary to ease the entry and exit of foreign businesses in India.
With the backdrop of being a socialist democratic republic, India’s labor laws have always been perceived to be labor friendly; while this in itself is commendable, it needs to be balanced with business owners having the flexibility to rightsize their business organizations. Conclusion While Ease of Doing Business initiatives are still a work in progress, both central and state governments have taken significant steps to reduce regulatory hurdles in setting up and running businesses in India. With the objective of moving India to rank 50 in the Ease of Doing Business Index, the country is putting its best foot forward to welcome overseas investors in its quest to achieve GDP growth rates of over 8 per cent. For more information: Nikhil Morsawala is Director – International Business Division, Crowe Horwath Advisory Services, India. He can be reached at +91 9820294504 or nikhil.morsawala@crowehorwath.in Audit | Tax | Advisory ©2016 Crowe Horwath International www.crowehorwath.net 8 . March 2016 ® M&A update 2015 Canada By Moses Bendayan, Montréal Fueled by macroeconomic factors conducive to a burgeoning private equity (PE) environment, Canadian transaction values in the first half 2015 have reached unprecedented highs, totaling C$11.4 billion as of June 30, 20151. Monetary policy in North America has been highly accommodative exhibited by record periods of low and stable interest rates coupled with sustained quantitative easing. While rates remained low, the Canadian dollar waned to a record 10-year low, which has proven to be appealing to foreign led transactions. A nearly 30% cheaper Canadian dollar will certainly not drive transactions of itself; however, it does stand as a contributing factor encouraging cross-border deal flow. Additionally, the Bank of Canada has hinted at pursuing steeper contractionary monetary policy measures in the event of sustained broad economic weakness, such as negative overnight rates.
These factors, alongside a weak real estate market fueled by record household debt-to-income levels, will put additional pressure on an already deteriorating dollar. Canada’s newly elected federal Liberal party’s insistence on deficit spending rather than aiming for a balanced budget, is, in the short run, an expansionary factor that will most likely lead to stimulating the broad economy, and, in turn, result in better performing potential platform investments. Consequently, PE companies are becoming more active in their search for succession-driven divestitures, the primary driver in the mid-market, where baby boomers look first to liquidate their positions.2 M&A activity: deal size and deal volume With cash reserves growing in the past few years, equities continuing their strong run, sustained lower borrowing costs and lower forecasted economic growth rates, the environment for corporate combinations could never have been any better. The figures for 2015 support this observation. Deals being done are focused on the equity range of between US$5 mn and US$20 mn, with senior or subordinated debt of up to US$100 mn. In the first three quarters of 2015, Canada exhibited growth in activity (260 deals versus 228 in 2014), yet volume simmered to C$16.3 bn compared to 2014’s first three quarters of C$19.4 bn.3 At the end of June, six-large cap transactions sized C$500 mn or greater captured 63% of all disclosed disburse- ments, whereas deals sized between C$100 mn and C$500 mn took the second largest share at 22%.
Deals sized less than C$100 mn accounted for the balance.4 This year’s figures follow suit with the trends occurring over the past five years (2009-2014). The steepest decline in activity has been concentrated at the lowest end of the market (value under C$5 mn) where there has been a 64% decline in the number of transactions, or an annualized decline of 18% per year. At the high end of the market (value over C$250 mn), overall transaction activity has been strong, increasing by 47%, or an annualized growth of 8% per year.
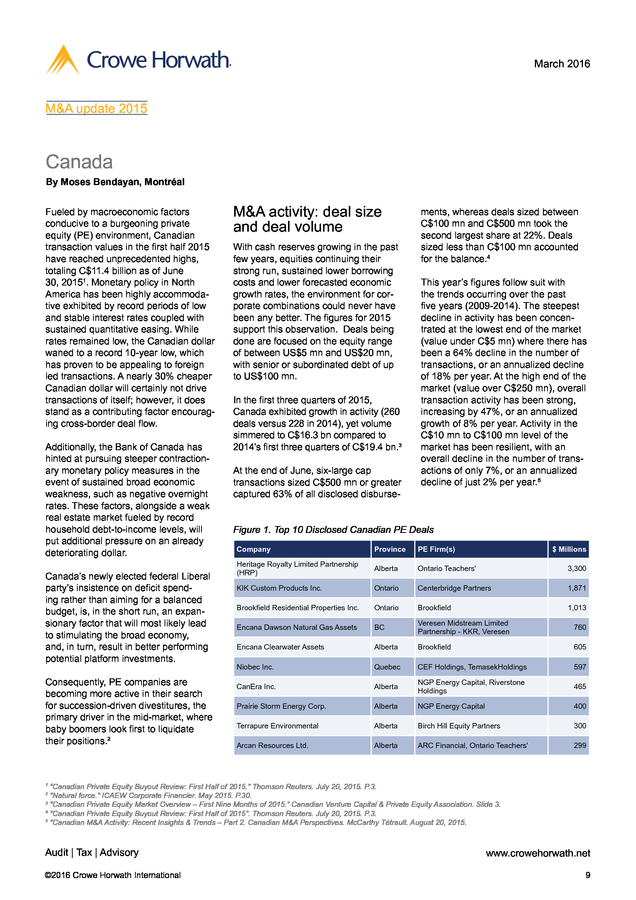
Activity in the C$10 mn to C$100 mn level of the market has been resilient, with an overall decline in the number of transactions of only 7%, or an annualized decline of just 2% per year.5 Figure 1. Top 10 Disclosed Canadian PE Deals Company Province PE Firm(s) Heritage Royalty Limited Partnership (HRP) $ Millions Alberta Ontario Teachers' 3,300 KIK Custom Products Inc. Ontario Centerbridge Partners 1,871 Brookfield Residential Properties Inc. Ontario Brookfield 1,013 Encana Dawson Natural Gas Assets BC Veresen Midstream Limited Partnership - KKR, Veresen 760 Encana Clearwater Assets Alberta Brookfield 605 Niobec Inc. Quebec CEF Holdings, TemasekHoldings 597 CanEra Inc. Alberta NGP Energy Capital, Riverstone Holdings 465 Prairie Storm Energy Corp. Alberta NGP Energy Capital 400 Terrapure Environmental Alberta Birch Hill Equity Partners 300 Arcan Resources Ltd. Alberta ARC Financial, Ontario Teachers' 299 “Canadian Private Equity Buyout Review: First Half of 2015.” Thomson Reuters. July 20, 2015.
P.3. “Natural force.” ICAEW Corporate Financier. May 2015. P.30. 3 “Canadian Private Equity Market Overview – First Nine Months of 2015.” Canadian Venture Capital & Private Equity Association.
Slide 3. 4 “Canadian Private Equity Buyout Review: First Half of 2015”. Thomson Reuters. July 20, 2015.
P.3. 5 “Canadian M&A Activity: Recent Insights & Trends – Part 2. Canadian M&A Perspectives. McCarthy Tétrault.
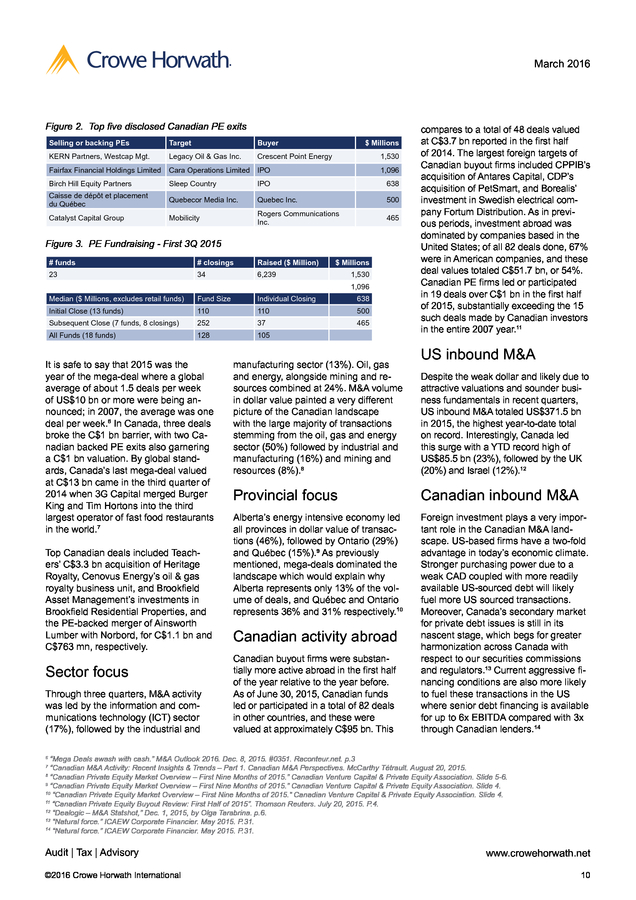
August 20, 2015. 1 2 Audit | Tax | Advisory ©2016 Crowe Horwath International www.crowehorwath.net 9 . March 2016 ® Figure 2. Top five disclosed Canadian PE exits Selling or backing PEs Target Buyer $ Millions KERN Partners, Westcap Mgt. Legacy Oil & Gas Inc. Crescent Point Energy Fairfax Financial Holdings Limited Cara Operations Limited IPO Birch Hill Equity Partners Sleep Country IPO 638 Caisse de dépôt et placement du Québec Quebecor Media Inc. Quebec Inc. 500 Catalyst Capital Group Mobilicity Rogers Communications Inc. 465 1,530 1,096 Figure 3. PE Fundraising - First 3Q 2015 # funds # closings Raised ($ Million) 23 34 6,239 $ Millions Median ($ Millions, excludes retail funds) Fund Size Individual Closing 638 Initial Close (13 funds) 110 110 500 Subsequent Close (7 funds, 8 closings) 252 37 465 All Funds (18 funds) 128 105 1,530 1,096 It is safe to say that 2015 was the year of the mega-deal where a global average of about 1.5 deals per week of US$10 bn or more were being announced; in 2007, the average was one deal per week.6 In Canada, three deals broke the C$1 bn barrier, with two Canadian backed PE exits also garnering a C$1 bn valuation. By global standards, Canada’s last mega-deal valued at C$13 bn came in the third quarter of 2014 when 3G Capital merged Burger King and Tim Hortons into the third largest operator of fast food restaurants in the world.7 Top Canadian deals included Teachers’ C$3.3 bn acquisition of Heritage Royalty, Cenovus Energy’s oil & gas royalty business unit, and Brookfield Asset Management’s investments in Brookfield Residential Properties, and the PE-backed merger of Ainsworth Lumber with Norbord, for C$1.1 bn and C$763 mn, respectively. Sector focus Through three quarters, M&A activity was led by the information and communications technology (ICT) sector (17%), followed by the industrial and manufacturing sector (13%).
Oil, gas and energy, alongside mining and resources combined at 24%. M&A volume in dollar value painted a very different picture of the Canadian landscape with the large majority of transactions stemming from the oil, gas and energy sector (50%) followed by industrial and manufacturing (16%) and mining and resources (8%).8 compares to a total of 48 deals valued at C$3.7 bn reported in the first half of 2014. The largest foreign targets of Canadian buyout firms included CPPIB’s acquisition of Antares Capital, CDP’s acquisition of PetSmart, and Borealis’ investment in Swedish electrical company Fortum Distribution.
As in previous periods, investment abroad was dominated by companies based in the United States; of all 82 deals done, 67% were in American companies, and these deal values totaled C$51.7 bn, or 54%. Canadian PE firms led or participated in 19 deals over C$1 bn in the first half of 2015, substantially exceeding the 15 such deals made by Canadian investors in the entire 2007 year.11 US inbound M&A Despite the weak dollar and likely due to attractive valuations and sounder business fundamentals in recent quarters, US inbound M&A totaled US$371.5 bn in 2015, the highest year-to-date total on record. Interestingly, Canada led this surge with a YTD record high of US$85.5 bn (23%), followed by the UK (20%) and Israel (12%).12 Provincial focus Canadian inbound M&A Alberta’s energy intensive economy led all provinces in dollar value of transactions (46%), followed by Ontario (29%) and Québec (15%).9 As previously mentioned, mega-deals dominated the landscape which would explain why Alberta represents only 13% of the volume of deals, and Québec and Ontario represents 36% and 31% respectively.10 Foreign investment plays a very important role in the Canadian M&A landscape. US-based firms have a two-fold advantage in today’s economic climate. Stronger purchasing power due to a weak CAD coupled with more readily available US-sourced debt will likely fuel more US sourced transactions. Moreover, Canada’s secondary market for private debt issues is still in its nascent stage, which begs for greater harmonization across Canada with respect to our securities commissions and regulators.13 Current aggressive financing conditions are also more likely to fuel these transactions in the US where senior debt financing is available for up to 6x EBITDA compared with 3x through Canadian lenders.14 Canadian activity abroad Canadian buyout firms were substantially more active abroad in the first half of the year relative to the year before. As of June 30, 2015, Canadian funds led or participated in a total of 82 deals in other countries, and these were valued at approximately C$95 bn.
This “Mega Deals awash with cash.” M&A Outlook 2016. Dec. 8, 2015.
#0351. Raconteur.net. p.3 “Canadian M&A Activity: Recent Insights & Trends – Part 1.
Canadian M&A Perspectives. McCarthy Tétrault. August 20, 2015. “Canadian Private Equity Market Overview – First Nine Months of 2015.” Canadian Venture Capital & Private Equity Association.
Slide 5-6. 9 “Canadian Private Equity Market Overview – First Nine Months of 2015.” Canadian Venture Capital & Private Equity Association. Slide 4. 10 “Canadian Private Equity Market Overview – First Nine Months of 2015.” Canadian Venture Capital & Private Equity Association. Slide 4. 11 “Canadian Private Equity Buyout Review: First Half of 2015”.
Thomson Reuters. July 20, 2015. P.4. 12 “Dealogic – M&A Statshot,” Dec.
1, 2015, by Olga Tarabrina. p.6. 13 “Natural force.” ICAEW Corporate Financier. May 2015.
P.31. 14 “Natural force.” ICAEW Corporate Financier. May 2015. P.31. 6 7 8 Audit | Tax | Advisory ©2016 Crowe Horwath International www.crowehorwath.net 10 .
March 2016 ® Moderately weakened fundraising climate A fundamentally important trend in the last few years is the fact that money has been flowing out of, rather than into, PE. Since 2013, the amount distributed to investors has exceeded capital calls and has reached record levels as fund managers have taken advantage of favorable market conditions to exit many positions. This marks the third consecutive year in a row.15 Canadian dry powder in terms of funds raised in 2015 is on pace for C$8.3 bn16 which is C$3.68 bn below the funds raised in 2014.17 Given the current market conditions and strapped with a healthy supply of funds to invest, PE firms are much less interested in financial engineering and much more interested in finding growing companies to provide smart capital to by supporting management and providing highly sought after expertise.18 Similarly, a few years ago, 80% of the market was PE-backed: now that number is closer to 45%, which is a big drop.19 Focusing just on the first half of 2015, Canadian buyout-PE fundraising has declined to C$4.4 bn, a level comparable to 2011 (C$3.8 bn) and down 70% from 2014. 20 Outlook for 2016 Looking forward, with the dollar maintaining its weak purchasing power and oil prices trending downwards, the Canadian M&A market will most likely experience another stellar year considering fiscal and monetary stimulus leaning in its favor along with a healthy supply of dry powder to go along with. Given Alberta’s economic reliance on the oil, gas and mining sectors and an unlikely oil recovery in the short run, we foresee consolidations in these industries due to the relative difficulty of realizing returns on invested capital greater than the cost of capital. In terms of activity, Québec and Ontario should be poised for a strong 2016 given their strong manufacturing and construction industries and their highly diversified economies. Likewise, the demand for smart capital will be essential to be deployed to rapidly growing firms in healthier sectors of the economy, paving the way for prudent uses of committed capital. “Mega Deals awash with cash.” M&A Outlook 2016.
Dec. 8, 2015. #0351.
Raconteur.net. p.7 C$6.239 billion for 3 quarters = C$2.08 billion per quarter. “Canadian Private Equity Market Overview - 2014.” Canadian Venture Capital & Private Equity Association.
Slide 13. 17 “Canadian Private Equity Market Overview - 2014.” Canadian Venture Capital & Private Equity Association. Slide 9. 18 “Mega Deals awash with cash.” M&A Outlook 2016. Dec.
8, 2015. #0351. Raconteur.net.
p.7 19 “Mid- Market: North American M&A 2016 Outlook.” Firmex. December 2015, p.3. 20 “Canadian Private Equity Buyout Review: First Half of 2015”. Thomson Reuters.
July 20, 2015. P.17. 15 16 For more information: Moses Bendayan is a CFA, Senior VP and Partner at Crowe BGK Corporate Finance Inc., Montréal, Canada. He can be reached at 514 231 1577 or M.Bendayan@crowebgk.com Regional GCA Leadership China Antony Lam antony.lam@horwathcapital.com.cn Vijay Thacker vijay.thacker@crowehorwath.in Indian Subcontinent / Middle East Southeast Asia East Asia Latin America USA / Canada Mok Yuen Lok yuenlok.mok@crowehorwath.net Central and Eastern Europe Igor Mesenský igor.mesensky@tpa-horwath.cz Francisco D’Orto Neto francisco.dorto@crowehorwath.com.br Oceania Andrew Fressl andrew.fressl@crowehorwath.com.au Alfred Cheong alfred.cheong@crowehorwath.com.sg Marc Shaffer marc.shaffer@crowehorwath.com Western Europe Peter Varley peter.varley@crowecw.co.uk Crowe Horwath International is a leading international network of separate and independent accounting and consulting firms that may be licensed to use “Crowe Horwath” or “Horwath” in connection with the provision of accounting, auditing, tax, consulting or other professional services to their clients. Crowe Horwath International itself is a nonpracticing entity and does not provide professional services in its own right.
Neither Crowe Horwath International nor any member is liable or responsible for the professional services performed by any other member. Audit | Tax | Advisory ©2016 Crowe Horwath International www.crowehorwath.net 11 .
If there is a topic you would like us to cover in future issues of the GCA newsletter, don’t hesitate to contact Peter Varley, Chairman of GCA, at peter.varley@crowecw.co.uk. Alternatively, please contact your local GCA team member to discuss your ideas. Audit | Tax | Advisory ©2016 Crowe Horwath International Welcome 1 Goodwill Impairment Tests under IAS 36: Valuation Methodology 2 Ease of Doing Business in India 6 M&A Update 2015: Canada 9 www.crowehorwath.net 1 . March 2016 ® Goodwill Impairment Tests Under IAS 36: Valuation Methodology By Olivier Grivillers and Maxime Hazim, Paris Several studies have shown that goodwill represents an important part of total assets of listed companies. In 2014, companies listed on the French index CAC40 displayed more than €490 billion of intangible assets (of which €300 billion was by way of goodwill) i.e. roughly 59% of equity. Goodwill can be defined as the result of the difference between the purchase price of a company and its net equity amount. As a consequence, goodwill only results from external growth, i.e. the acquisition of another company, which means that companies growing organically do not record any goodwill in their accounts. The weight of goodwill depends on the company policy. A high level of goodwill is synonymous with external growth and acquisitions.
Goodwill impairment reflects a poor acquisition since it points up to a market value inferior to its acquisition value. It is then important to know the methodology followed to review the goodwill value and indirectly follow-up on the value of the underlying acquired business. International accounting standards (IAS 36 - Impairment of Assets) force companies to review goodwill value over time. Indeed, goodwill can be impaired but cannot be subject to revaluation. The European Securities and Markets Authority (ESMA) provided in a report dated January 7, 2013 an overview of accounting practices related to impairment testing of goodwill and other intangible assets.
The report mentions that a fall in market capitalization below the book value of equity is an indication that impairment may have occurred. Although a decrease in market capitalization may not lead directly to impairment (relevant factors impacting market capitalization might include investor uncertainty, risk aversion and low liquidity, among others), the increased equity/ Audit | Tax | Advisory ©2016 Crowe Horwath International Figure 1. Price to Book Ratios by sector (2014) - CAC40 companies Number of firms Price to Book ratio 8 2.36 18 2.06 Banking & Insurance 5 0.81 Technology 5 1.84 Energy & Natural resources 4 1.07 Goods & Services to consumers Industry & Construction Sources: Mergermarket Group, Bloomberg market capitalization ratio and relatively limited impairment losses can call into question whether the level of impairment reflects the effects of the economic slowdown appropriately. Indeed, as of December 31, 2014, 23% of the CAC 40 companies showed market capitalization below equity. Figure 1 shows the average price-tobook ratio calculated for the CAC40 companies based on 2014 book values and market capitalization. An asset is considered to be subject to impairment when its carrying value is higher that its recoverable value.
According to IFRS, an asset’s recoverable value is the higher between the asset’s valuein-use (the amount to be recovered through use of the asset) and its the fair value less costs-to-sell (the amount to be recovered through sale of the asset). To perform the impairment test, it is necessary to consider the methodology to carry out the follow up of goodwill value in companies’ accounts. Measuring recoverable amount The recoverable amount is defined as the higher of an asset or cash-generating unit’s (CGU) (a) fair value less costs to sell and (b) its value in use. It is not always necessary to determine both values, i.e. an asset’s fair value less costs to sell and its value in use. If either of these amounts exceeds the asset’s carrying amount, the asset is not impaired and it is not necessary to estimate the other amount. The recoverable amount is determined for an individual asset. If the asset does not generate cash inflows that are largely independent of those from other assets or groups of assets, the recoverable amount is determined for the cash-generating unit to which the asset belongs.
The cash generating units tested must be consistent with the operating segments used within the framework of IFRS 8. a) Value in use Value in use is the present value of the future cash flows expected to be derived from an asset or cash-generating unit. The techniques used to estimate future cash flows and interest rates will vary depending on the circumstances surrounding the asset in question. The calculation of the value in use is usually performed under the discounted cash (DCF) flow method, which consists of discounting the expected future cash flows at a discount rate corresponding to the weighted average cost of capital (WACC). www.crowehorwath.net 2 . March 2016 ® Regarding the valuation methodology used for impairment tests in order to determine the recoverable amount, around 82% of the French Index CAC 40 companies used the value in use (using the DCF method) alone and 18% determined both measures – the value in use and the fair value. monly termed as WACC. According to IAS36, the calculation of WACC should be performed independently from the financial structure of the company. Hence, some estimates such as the beta and the gearing level should be retained at the company’s industrial sector level. Figure 2. Valuation methods used for impairment test for the CAC40 Companies in 2014 WACC = (Ke * %E) + (Kd * %D * (1-T)) DCF & Comparables Multiples 15% DCF & Others 3% Where: Ke = cost of equity capital %E proportion of equity capital to = total capital (industry average) Kd = cost of debt capital %D = proportion of debt capital to total capital (industry average) T = income tax rate Cost of equity is determined with the help of the Capital Asset Pricing Model (CAPM) which is defined as: Ke = Rf + (Rp x B) + Rs DCF Only 82% The discounted cash flow method has been utilized for 100% of the cases for the impairment test performed on the CAC40 companies for December 31, 2014. Under the DCF method, value is determined by performing a prospective financial analysis of the subject CGU to estimate future available cash-flows, which yield a value that is available to the invested capital holders. These cash flows are discounted to present value at the WACC. If the cash flow stream is to continue beyond the projection period, an estimate of the terminal value or residual value of the CGU is developed.
The sum of the discounted cash flows and the discounted terminal value provides an indication of the invested capital value of the business. The discount rate used within the DCF method is the rate of return required to compensate an investor for undertaking investment in a company. It corresponds to the weighted average of cost of equity and cost of debt, com- Audit | Tax | Advisory ©2016 Crowe Horwath International Where: Ke = cost of equity capital Rf = risk-free rate of return Rp = common stock risk premium B = beta (industry average) Rs = specific risk premium Determining the cost of equity remains challenging especially when the com- pany to be valued has a specific risk due to its size, its stock illiquidity, its market location or, its field of activity, among others factors. Figure 4 presents an overview of the discount rates used for different sectors over the CAC40 companies for the December 31, 2014 reporting. Figure 5 presents an overview of the perpetuity growth rates used by sector over the CAC40 companies for the December 31, 2014 reporting. The high discrepancies noticed in the discount rates and perpetuity growth rates retained in the impairment tests are due to the variety of factors of the economic environment in which the tested CGUs operate. Indeed, some CGUs operate in high inflation environment where interest rates and inflation rates are high, which implies higher discount rates and higher nominal growth rates in perpetuity. b) Fair Value Less Costs to Sell Fair value less costs to sell is the amount obtainable from the sale of an asset or cash-generating unit in an arm’s length transaction between knowledgeable, willing parties, less the costs of disposal. Figure 3.
Free cash flows are defined as follows: Free Cash Flow = Earnings Before Interest and Taxes (EBIT) - Taxes + Depreciation and Amortization - Capital Expenditure -/+ Change in Working Capital] Figure 4. Discount rate (WACC) by sector (2014) - CAC40 Companies Min. Max. Goods & Services to consumers 5.9% 20.3% Industry & Construction 5.2% 20.6% Banking & Insurance 6.0% 16.9% Technology 6.5% 17.0% Energy & Natural resources 4.9% 15.0% Sources: CAC40 companies’ annual reports 2014 www.crowehorwath.net 3 . March 2016 ® Figure 5. Perpetuity growth rate by sector (2014) - CAC40 Companies Min. Max. -1.00% 7.70% Industry & Construction 1.00% 5.00% Banking & Insurance 2.00% 5.00% Technology 0.30% 5.50% Energy & Natural resources 1.60% after deducting the costs of disposal. In that case, comparable multiples (the market approach) can be used. 2.50% Goods & Services to consumers It may be possible to determine fair value less costs to sell, even if an asset is not traded in an active market. Figure 6 Price in binding sale ageement Current bid price Price of most recent transaction Obtainable amount in an arm’s length transaction The best evidence of an asset’s fair value less costs to sell is a price in a binding sale agreement in an arm’s length transaction, adjusted for incremental costs that would be directly attributable to the disposal of the asset. The market approach is mainly based on the market comparable companies’ method. The concept behind this method is that prices of publicly traded stocks in the same or similar industry provide objective evidence as to values at which investors are willing to buy and sell interests in companies in the given industry. If there is no binding sale agreement but an asset is traded in an active market, fair value less costs to sell is the asset’s market price less the costs of disposal. The appropriate market price is usually the current bid price. According to this method, the market price of stocks of corporations engaged in the same or similar line of business whose stock is actively traded in a free and open market must be considered. Competing companies operating in the same market are the best comparable, because their assets are deployed in the same line of business and are subject to many of the same economic and financial risks.
In order for the competitive firms to be feasible for comparability, the financial condition and a market related stock price performance must be available. When current bid prices are unavailable, the price of the most recent transaction may provide a basis for estimate, provided that there has not been a significant change in economic circumstances between the transaction date and the date as at which the estimate is made. If there is no binding sale agreement or active market for an asset, fair value less costs to sell is based on the best information available to reflect the amount that an entity could obtain, at the end of the reporting period, from the disposal of the asset in an arm’s length transaction between knowledgeable, willing parties, Comparable company analysis operates under the assumption that similar companies will have similar valuations multiples, such as Enterprise Value/Net sales, Enterprise Value/EBITDA, Enterprise Value/EBIT or Price Earnings Ratio (Share Price/Earnings per share). Figure 7. Comparable multiples used in the impairment tests for the CAC40 companies Comparable companies Average multiples Occurrences Average multiples Number Sales revenue 1.5 EBITDA EBIT / Operating Income PER Comparable transactions Occurrences Percentage Average multiples Number Percentage 44 23% 1.2 23 12% 6.8 95 50% 7.1 64 34% 9.3 95 52% 9.3 47 25% 13.3 49 26% 14.6 12 6% Sources: Data from HAF booklet Audit | Tax | Advisory ©2016 Crowe Horwath International www.crowehorwath.net 4 . March 2016 ® Costs of disposal, other than those that have been recognized as liabilities, are deducted in determining fair value less costs to sell. Examples of such costs are legal costs, stamp duty and similar transaction taxes, costs of removing the asset, and direct incremental costs to bring an asset into condition for its sale. Conclusion Goodwill impairment has become an important issue for companies as they have to follow-up on the value of their acquisitions in order to account for any loss in the value of the goodwill. From an accounting perspective, when the carrying value of the goodwill exceeds the recoverable value, which is the highest value between the value in use and the fair value less costs to sell, it is considered to be impaired. The value in use measured by using the discounted cash flow method, not only depends on the future prospects of the cash generating unit being tested, but also on assumptions such as the discount rate and the growth rate used in the DCF model. The fair value is market-based and can be approached with the listed comparable multiples method and/or comparable transactions methods. Learning how to account for goodwill impairment is a matter of using a relatively simple impairment test compliant with the international accounting standards. The valuation method used to measure the recoverable amount has an impact on the result of the impairment test. This flexible rule explains that goodwill valuation remains not impaired in the financial statements when the market conditions are adverse, since the company can use a value computed on the long-term under the DCF method to justify not impairing the goodwill. For more information: Olivier Grivillers is a Partner, HAF Audit & Conseil, Crowe Horwath Paris, France. He can be contacted at +33(0)141 059 848 or ogrivillers@horwath.fr Maxime Hazim is a Manager, HAF Audit & Conseil, Crowe Horwath Paris, France. He can be contacted at +33(0) 141 059 842 mhazim@horwath.fr Audit | Tax | Advisory ©2016 Crowe Horwath International www.crowehorwath.net 5 .
March 2016 ® Ease of Doing Business in India By Nikhil Morsawala, Mumbai The government’s efforts, among other things, focus on implementing reforms relating to starting a business, tax payments and reporting, resolving insolvency, enforcing contracts, and trading across borders. domestic market and the export market; this adds to the GDP and the foreign exchange wealth of the nation. “India copes with stress in the way that its roads cope with the traffic: constant chaos, surprisingly few casualties.” British journalist Bruce Anderson, Independent (London), 09.03.2009 Attracting investment means that the environment for investment must be friendly. “When we talk of a “look East” policy, we must also talk about “link West” policy. Both need to work simultaneously.” Growth of business in India requires concerted action on several fronts – infrastructure, capital markets, trade facilitation and skills. In reality, India must also deal with its regulatory and bureaucratic challenges, in terms of becoming an easier place to do business. A disproportionately high regulatory burden is borne by businesses in India today. Prime Minister of India, Narendra Modi, 2015 A wide range of forecasts indicate that, by 2020, India will be home to 1.35 billion people, of whom 906 million will be of working age. These 906 million will need jobs to sustain India’s growth and populace, and these jobs can only be provided by significant and longterm growth of the manufacturing and service sectors in India. Initiatives for ease of doing business The challenge ahead, therefore, is to create jobs to employ India’s rapidly growing youth base, and the key means of doing so is to increase private investment in India.
Today’s investment equals tomorrow’s jobs, and so the government of India has embarked on the ambitious ‘Make in India’ initiative. Make in India not only creates these jobs, but also serves a larger economic purpose – added manufacturing output for the large India has embarked on an ambitious agenda to improve its ‘Ease of Doing Business’ rank to 50 out of 189 countries by 2017 (it is rated at 130 in 2016, based on factors assessed for 2014 and 2015); however, this effort will only address a small subset of the regulatory burden on investors. Doing Business reforms will only address central regulations; the rest of the country must also improve simultaneously to convert reforms into results. Figure 1.
Rankings on Doing Business topics (Scale: Rank 189 center, Rank 1 outer edge) Starting a business (73.59) Dealing with construction permits (183) Enforcing contracts (178) Trading across borders (133) Paying taxes (157) India’s ranking has improved from 142 to 130 out of 189 countries between 2014 and 2015, reflecting government’s efforts and the changes that it has brought about to hasten the reform process and reduce the onerous regulatory processes of doing business in India. Figure 2. Distance to frontier scores on Doing Business topics - India (Scale: Score 0 center, Score 100 outer edge) Starting a business (155) Resolving insolvency (136) While efforts towards improving India’s ranking in the Doing Business Report cover some of the regulatory issues pertaining to state governments, much more is required to be done at state governments’ level to achieve the Prime Minister’s vision of making India an easy place to do business. A majority of the regulatory burden imposed on business is due to the plethora of laws, rules, regulations and procedures enforced by the states.
This gives rise to a wide number of registrations, licenses and no objection certificates (NOCs) that businesses must obtain and file compliance reports on. Getting electricity (70) Protecting minority investors (8) Getting credit (42) Protecting minority investors (8) Resolving insolvency (32.41) Enforcing contracts (32.41) Trading across borders (56.45) Paying taxes (56.14) Dealing with construction permits (32.47) Getting electricity (74.56) Registering property (50.29) Getting credit (65) Protecting minority investors (73.33) Source: World Bank 2016, Doing Business 2016: Measuring Regulatory Quality and Efficiency Note: The rankings are benchmarked to June 2015 and based on the average of each economy’s distance to frontier (DTF) scores for the 10 topics included in this year’s aggregate ranking. The distance to frontier score benchmarks economies with respect to regulatory practice, showing the absolute distance to the best performance in each Doing Business indicator. An economy’s distance to frontier score is indicated on a scale from 0 to 100, where 0 represents the worst performance and 100 the frontier.
For the economies for which the data cover 2 cities, scores are a population-weighted average for the 2 cities. Audit | Tax | Advisory ©2016 Crowe Horwath International www.crowehorwath.net 6 . March 2016 ® Key government initiatives Some key initiatives towards improving the investment, licensing and approval processes are: â– Company formation and commercial registrations 1. The Ministry of Corporate Affairs has introduced an integrated process for incorporation of a company. Applicants can apply for the Director’s Identification Number (DIN) and check the company name availability simultaneous to incorporation application (Form INC-29). This will shorten the process of obtaining the DIN, which in our experience takes a very long time due to the requirement for foreign persons to obtain notarizations from Indian missions in several countries. 2. The Companies (Amendment) Act, 2015 has been passed to remove requirements of minimum paid-up capital for companies. It also simplifies a number of other regulatory requirements particularly relative to the management of privately owned companies. 3. Several processes have been made online.
For example: â– Process of applying for environmental clearances â– Payment of income tax and service tax â– Filing of tax returns – income tax, service tax, VAT in several states â– Company compliance filing under the Companies Act. â– Payment of employee provident fund dues The new Companies Act, 2013, incorporates several significant provisions relating to Corporate Governance which go a long way in making India’s corporate laws align with international best practices. Audit | Tax | Advisory ©2016 Crowe Horwath International The Limited Liability Partnership structure has been strengthened by permitting FDI in LLP entities. However, a lot of work still needs to be done, including passing legislation in line with the US Foreign Corrupt Practices Act, reducing uncertainties in transfer pricing etc. â– Industrial licensing 4. Processes of applying for an Industrial License (IL) and Industrial Entrepreneur Memorandum (IEM) has been made online and these services are now available to entrepreneurs on a 24x7 basis. This had led to ease of filing applications and online payment of service charges. 5. A defence products list for industrial licensing has been issued, whereby a large number of parts/components, castings/forgings have been excluded from the purview of industrial licensing.
Further, dual use items, with military as well as civilian application (unless classified as defense item) will also not require an industrial license from the defense angle; only an Industrial Entrepreneur Memorandum (IEM) needs to be filed. 6. The initial validity period of an industrial license has been increased from two years to three years, giving enough time for licensees to procure land and obtain necessary clearances/approvals from authorities. Further, partial commencement of production is being treated as commencement of production of all the items in the license, obviating the need for getting license extensions for remaining items for which production has not commenced. 7. Security clearance on industrial license applications are to be granted within 12 weeks. In matters other than explosives and cases under the purview of the Foreign Investment Promotion Board (FIPB), security clearances are valid for three years unless there is a change in composition of management or shareholding. â– Foreign trade Pursuant to issuance of a notification on 12.03.2015 by the Director General of Foreign Trade, the number of documents required for export and import is now limited to three. 8. Twenty services are integrated with the eBiz portal which will function as a single window portal for obtaining clearances from various governments and government agencies. Foreign trade to and from India has been considerably facilitated with the reduction of restricted items and the implementation of simpler Central Value Added Tax (CENVAT) regulations. Further steps are in the pipeline to make foreign trade more attractive. â– Environment 9. An Environment Assessment Report is required for constructing an industrial shed, school, college, hostel for education institutions above 20,000sqm up to 150,000 sqm built-up area.
A unified portal for registration of units for Labour Identification Number (LIN), reporting of inspection, submission of returns and grievance redressal has been launched by the Ministry of Labour and Employment. Environmental clearances have always required a long complex process in India. The government has taken a significant step recently by decentralizing the environment clearance process to states. â– Foreign investments 10. oreign direct investment is now F permitted in Limited Liability Partnerships (LLP), mainly to the same extent as permitted through limited liability companies. Earlier, foreign investment in LLPs required approval from the FIPB. www.crowehorwath.net 7 .
March 2016 ® undertaken without the approval of the head of the department; and (e) system of self-certification should be introduced for all non-risk, nonhazardous businesses. 11. An Investor Facilitation Cell has been created on the government portal to guide, assist and handhold investors during the entire lifecycle of the business. 12. A checklist with specific timelines has been developed for processing all applications filed by foreign investors in cases relating to retail and export oriented units (EOUs) foreign investments. India has been the beneficiary of significant foreign investments. The government has announced ambitious infrastructure development plans which cannot be implemented without external investments. The government has therefore taken quite a few confidence building measures, including giving an assurance that tax regulations will henceforth not be amended retrospectively. â– Compliances 13. Central and state government ministries and departments have been requested to simplify and rationalize the regulatory environment by taking the following measures on priority: a) All returns should be filed online through a unified form; b) A checklist of required compliances should be placed on the department’s web portal; c) All registers required to be maintained by the business should be replaced with a single electronic register; d) No inspection should be States have started acting on these requests though at varied paces. Maharashtra state has, for example, reduced approvals and licenses required for setting up hotels by about two-thirds of what was earlier needed. Initiatives in the pipeline 1. Implementation of the Goods and Service Tax statute: India currently has state level VAT regulations and a central service tax regulation. Litigations abound across India as to which blended offerings attract either or both of these taxes. The government has introduced legislation in the parliament to implement a uniform Goods and Services Tax and to abolish the existing dual legislation. 2. The implementation of a comprehensive Bankruptcy Law.
Indian banks have been struggling with a disproportionately large amount of bad loans over the last couple of decades. The government is contemplating a legislation that will help identify potential bad loans at an early stage, which will allow stressed companies to construct turnaround strategies. 3. India is yet to make any significant headway in overhauling its labor laws to align them to global practices. While several draft legislations have been discussed, there is yet to emerge a political consensus on this socially sensitive issue, which is extremely necessary to ease the entry and exit of foreign businesses in India.
With the backdrop of being a socialist democratic republic, India’s labor laws have always been perceived to be labor friendly; while this in itself is commendable, it needs to be balanced with business owners having the flexibility to rightsize their business organizations. Conclusion While Ease of Doing Business initiatives are still a work in progress, both central and state governments have taken significant steps to reduce regulatory hurdles in setting up and running businesses in India. With the objective of moving India to rank 50 in the Ease of Doing Business Index, the country is putting its best foot forward to welcome overseas investors in its quest to achieve GDP growth rates of over 8 per cent. For more information: Nikhil Morsawala is Director – International Business Division, Crowe Horwath Advisory Services, India. He can be reached at +91 9820294504 or nikhil.morsawala@crowehorwath.in Audit | Tax | Advisory ©2016 Crowe Horwath International www.crowehorwath.net 8 . March 2016 ® M&A update 2015 Canada By Moses Bendayan, Montréal Fueled by macroeconomic factors conducive to a burgeoning private equity (PE) environment, Canadian transaction values in the first half 2015 have reached unprecedented highs, totaling C$11.4 billion as of June 30, 20151. Monetary policy in North America has been highly accommodative exhibited by record periods of low and stable interest rates coupled with sustained quantitative easing. While rates remained low, the Canadian dollar waned to a record 10-year low, which has proven to be appealing to foreign led transactions. A nearly 30% cheaper Canadian dollar will certainly not drive transactions of itself; however, it does stand as a contributing factor encouraging cross-border deal flow. Additionally, the Bank of Canada has hinted at pursuing steeper contractionary monetary policy measures in the event of sustained broad economic weakness, such as negative overnight rates.
These factors, alongside a weak real estate market fueled by record household debt-to-income levels, will put additional pressure on an already deteriorating dollar. Canada’s newly elected federal Liberal party’s insistence on deficit spending rather than aiming for a balanced budget, is, in the short run, an expansionary factor that will most likely lead to stimulating the broad economy, and, in turn, result in better performing potential platform investments. Consequently, PE companies are becoming more active in their search for succession-driven divestitures, the primary driver in the mid-market, where baby boomers look first to liquidate their positions.2 M&A activity: deal size and deal volume With cash reserves growing in the past few years, equities continuing their strong run, sustained lower borrowing costs and lower forecasted economic growth rates, the environment for corporate combinations could never have been any better. The figures for 2015 support this observation. Deals being done are focused on the equity range of between US$5 mn and US$20 mn, with senior or subordinated debt of up to US$100 mn. In the first three quarters of 2015, Canada exhibited growth in activity (260 deals versus 228 in 2014), yet volume simmered to C$16.3 bn compared to 2014’s first three quarters of C$19.4 bn.3 At the end of June, six-large cap transactions sized C$500 mn or greater captured 63% of all disclosed disburse- ments, whereas deals sized between C$100 mn and C$500 mn took the second largest share at 22%.
Deals sized less than C$100 mn accounted for the balance.4 This year’s figures follow suit with the trends occurring over the past five years (2009-2014). The steepest decline in activity has been concentrated at the lowest end of the market (value under C$5 mn) where there has been a 64% decline in the number of transactions, or an annualized decline of 18% per year. At the high end of the market (value over C$250 mn), overall transaction activity has been strong, increasing by 47%, or an annualized growth of 8% per year.
Activity in the C$10 mn to C$100 mn level of the market has been resilient, with an overall decline in the number of transactions of only 7%, or an annualized decline of just 2% per year.5 Figure 1. Top 10 Disclosed Canadian PE Deals Company Province PE Firm(s) Heritage Royalty Limited Partnership (HRP) $ Millions Alberta Ontario Teachers' 3,300 KIK Custom Products Inc. Ontario Centerbridge Partners 1,871 Brookfield Residential Properties Inc. Ontario Brookfield 1,013 Encana Dawson Natural Gas Assets BC Veresen Midstream Limited Partnership - KKR, Veresen 760 Encana Clearwater Assets Alberta Brookfield 605 Niobec Inc. Quebec CEF Holdings, TemasekHoldings 597 CanEra Inc. Alberta NGP Energy Capital, Riverstone Holdings 465 Prairie Storm Energy Corp. Alberta NGP Energy Capital 400 Terrapure Environmental Alberta Birch Hill Equity Partners 300 Arcan Resources Ltd. Alberta ARC Financial, Ontario Teachers' 299 “Canadian Private Equity Buyout Review: First Half of 2015.” Thomson Reuters. July 20, 2015.
P.3. “Natural force.” ICAEW Corporate Financier. May 2015. P.30. 3 “Canadian Private Equity Market Overview – First Nine Months of 2015.” Canadian Venture Capital & Private Equity Association.
Slide 3. 4 “Canadian Private Equity Buyout Review: First Half of 2015”. Thomson Reuters. July 20, 2015.
P.3. 5 “Canadian M&A Activity: Recent Insights & Trends – Part 2. Canadian M&A Perspectives. McCarthy Tétrault.
August 20, 2015. 1 2 Audit | Tax | Advisory ©2016 Crowe Horwath International www.crowehorwath.net 9 . March 2016 ® Figure 2. Top five disclosed Canadian PE exits Selling or backing PEs Target Buyer $ Millions KERN Partners, Westcap Mgt. Legacy Oil & Gas Inc. Crescent Point Energy Fairfax Financial Holdings Limited Cara Operations Limited IPO Birch Hill Equity Partners Sleep Country IPO 638 Caisse de dépôt et placement du Québec Quebecor Media Inc. Quebec Inc. 500 Catalyst Capital Group Mobilicity Rogers Communications Inc. 465 1,530 1,096 Figure 3. PE Fundraising - First 3Q 2015 # funds # closings Raised ($ Million) 23 34 6,239 $ Millions Median ($ Millions, excludes retail funds) Fund Size Individual Closing 638 Initial Close (13 funds) 110 110 500 Subsequent Close (7 funds, 8 closings) 252 37 465 All Funds (18 funds) 128 105 1,530 1,096 It is safe to say that 2015 was the year of the mega-deal where a global average of about 1.5 deals per week of US$10 bn or more were being announced; in 2007, the average was one deal per week.6 In Canada, three deals broke the C$1 bn barrier, with two Canadian backed PE exits also garnering a C$1 bn valuation. By global standards, Canada’s last mega-deal valued at C$13 bn came in the third quarter of 2014 when 3G Capital merged Burger King and Tim Hortons into the third largest operator of fast food restaurants in the world.7 Top Canadian deals included Teachers’ C$3.3 bn acquisition of Heritage Royalty, Cenovus Energy’s oil & gas royalty business unit, and Brookfield Asset Management’s investments in Brookfield Residential Properties, and the PE-backed merger of Ainsworth Lumber with Norbord, for C$1.1 bn and C$763 mn, respectively. Sector focus Through three quarters, M&A activity was led by the information and communications technology (ICT) sector (17%), followed by the industrial and manufacturing sector (13%).
Oil, gas and energy, alongside mining and resources combined at 24%. M&A volume in dollar value painted a very different picture of the Canadian landscape with the large majority of transactions stemming from the oil, gas and energy sector (50%) followed by industrial and manufacturing (16%) and mining and resources (8%).8 compares to a total of 48 deals valued at C$3.7 bn reported in the first half of 2014. The largest foreign targets of Canadian buyout firms included CPPIB’s acquisition of Antares Capital, CDP’s acquisition of PetSmart, and Borealis’ investment in Swedish electrical company Fortum Distribution.
As in previous periods, investment abroad was dominated by companies based in the United States; of all 82 deals done, 67% were in American companies, and these deal values totaled C$51.7 bn, or 54%. Canadian PE firms led or participated in 19 deals over C$1 bn in the first half of 2015, substantially exceeding the 15 such deals made by Canadian investors in the entire 2007 year.11 US inbound M&A Despite the weak dollar and likely due to attractive valuations and sounder business fundamentals in recent quarters, US inbound M&A totaled US$371.5 bn in 2015, the highest year-to-date total on record. Interestingly, Canada led this surge with a YTD record high of US$85.5 bn (23%), followed by the UK (20%) and Israel (12%).12 Provincial focus Canadian inbound M&A Alberta’s energy intensive economy led all provinces in dollar value of transactions (46%), followed by Ontario (29%) and Québec (15%).9 As previously mentioned, mega-deals dominated the landscape which would explain why Alberta represents only 13% of the volume of deals, and Québec and Ontario represents 36% and 31% respectively.10 Foreign investment plays a very important role in the Canadian M&A landscape. US-based firms have a two-fold advantage in today’s economic climate. Stronger purchasing power due to a weak CAD coupled with more readily available US-sourced debt will likely fuel more US sourced transactions. Moreover, Canada’s secondary market for private debt issues is still in its nascent stage, which begs for greater harmonization across Canada with respect to our securities commissions and regulators.13 Current aggressive financing conditions are also more likely to fuel these transactions in the US where senior debt financing is available for up to 6x EBITDA compared with 3x through Canadian lenders.14 Canadian activity abroad Canadian buyout firms were substantially more active abroad in the first half of the year relative to the year before. As of June 30, 2015, Canadian funds led or participated in a total of 82 deals in other countries, and these were valued at approximately C$95 bn.
This “Mega Deals awash with cash.” M&A Outlook 2016. Dec. 8, 2015.
#0351. Raconteur.net. p.3 “Canadian M&A Activity: Recent Insights & Trends – Part 1.
Canadian M&A Perspectives. McCarthy Tétrault. August 20, 2015. “Canadian Private Equity Market Overview – First Nine Months of 2015.” Canadian Venture Capital & Private Equity Association.
Slide 5-6. 9 “Canadian Private Equity Market Overview – First Nine Months of 2015.” Canadian Venture Capital & Private Equity Association. Slide 4. 10 “Canadian Private Equity Market Overview – First Nine Months of 2015.” Canadian Venture Capital & Private Equity Association. Slide 4. 11 “Canadian Private Equity Buyout Review: First Half of 2015”.
Thomson Reuters. July 20, 2015. P.4. 12 “Dealogic – M&A Statshot,” Dec.
1, 2015, by Olga Tarabrina. p.6. 13 “Natural force.” ICAEW Corporate Financier. May 2015.
P.31. 14 “Natural force.” ICAEW Corporate Financier. May 2015. P.31. 6 7 8 Audit | Tax | Advisory ©2016 Crowe Horwath International www.crowehorwath.net 10 .
March 2016 ® Moderately weakened fundraising climate A fundamentally important trend in the last few years is the fact that money has been flowing out of, rather than into, PE. Since 2013, the amount distributed to investors has exceeded capital calls and has reached record levels as fund managers have taken advantage of favorable market conditions to exit many positions. This marks the third consecutive year in a row.15 Canadian dry powder in terms of funds raised in 2015 is on pace for C$8.3 bn16 which is C$3.68 bn below the funds raised in 2014.17 Given the current market conditions and strapped with a healthy supply of funds to invest, PE firms are much less interested in financial engineering and much more interested in finding growing companies to provide smart capital to by supporting management and providing highly sought after expertise.18 Similarly, a few years ago, 80% of the market was PE-backed: now that number is closer to 45%, which is a big drop.19 Focusing just on the first half of 2015, Canadian buyout-PE fundraising has declined to C$4.4 bn, a level comparable to 2011 (C$3.8 bn) and down 70% from 2014. 20 Outlook for 2016 Looking forward, with the dollar maintaining its weak purchasing power and oil prices trending downwards, the Canadian M&A market will most likely experience another stellar year considering fiscal and monetary stimulus leaning in its favor along with a healthy supply of dry powder to go along with. Given Alberta’s economic reliance on the oil, gas and mining sectors and an unlikely oil recovery in the short run, we foresee consolidations in these industries due to the relative difficulty of realizing returns on invested capital greater than the cost of capital. In terms of activity, Québec and Ontario should be poised for a strong 2016 given their strong manufacturing and construction industries and their highly diversified economies. Likewise, the demand for smart capital will be essential to be deployed to rapidly growing firms in healthier sectors of the economy, paving the way for prudent uses of committed capital. “Mega Deals awash with cash.” M&A Outlook 2016.
Dec. 8, 2015. #0351.
Raconteur.net. p.7 C$6.239 billion for 3 quarters = C$2.08 billion per quarter. “Canadian Private Equity Market Overview - 2014.” Canadian Venture Capital & Private Equity Association.
Slide 13. 17 “Canadian Private Equity Market Overview - 2014.” Canadian Venture Capital & Private Equity Association. Slide 9. 18 “Mega Deals awash with cash.” M&A Outlook 2016. Dec.
8, 2015. #0351. Raconteur.net.
p.7 19 “Mid- Market: North American M&A 2016 Outlook.” Firmex. December 2015, p.3. 20 “Canadian Private Equity Buyout Review: First Half of 2015”. Thomson Reuters.
July 20, 2015. P.17. 15 16 For more information: Moses Bendayan is a CFA, Senior VP and Partner at Crowe BGK Corporate Finance Inc., Montréal, Canada. He can be reached at 514 231 1577 or M.Bendayan@crowebgk.com Regional GCA Leadership China Antony Lam antony.lam@horwathcapital.com.cn Vijay Thacker vijay.thacker@crowehorwath.in Indian Subcontinent / Middle East Southeast Asia East Asia Latin America USA / Canada Mok Yuen Lok yuenlok.mok@crowehorwath.net Central and Eastern Europe Igor Mesenský igor.mesensky@tpa-horwath.cz Francisco D’Orto Neto francisco.dorto@crowehorwath.com.br Oceania Andrew Fressl andrew.fressl@crowehorwath.com.au Alfred Cheong alfred.cheong@crowehorwath.com.sg Marc Shaffer marc.shaffer@crowehorwath.com Western Europe Peter Varley peter.varley@crowecw.co.uk Crowe Horwath International is a leading international network of separate and independent accounting and consulting firms that may be licensed to use “Crowe Horwath” or “Horwath” in connection with the provision of accounting, auditing, tax, consulting or other professional services to their clients. Crowe Horwath International itself is a nonpracticing entity and does not provide professional services in its own right.
Neither Crowe Horwath International nor any member is liable or responsible for the professional services performed by any other member. Audit | Tax | Advisory ©2016 Crowe Horwath International www.crowehorwath.net 11 .


