


Description
Invest well.
Manage well.
Live well.™
QUARTERLY MARKET OVERVIEW
Q3 2015
CONVERGENTWEALTH.COM
12505 Park Potomac Avenue, Suite 400, Potomac, MD 20854
|
T 301.770.6300
F 888.444.6347
. OVERVIEW OF GLOBAL MARKETS
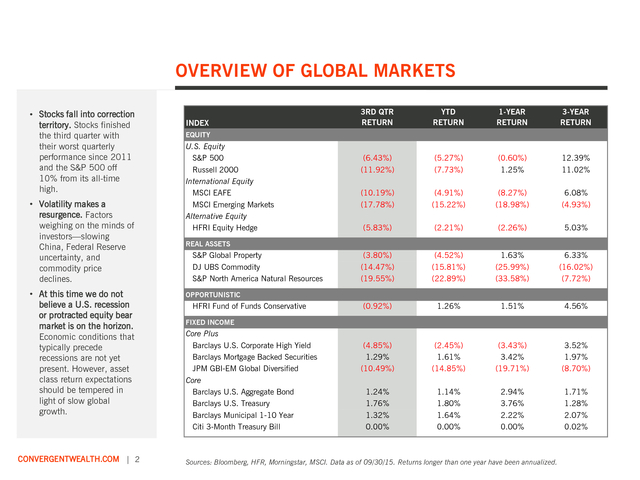
• Stocks fall into correction
territory. Stocks finished
the third quarter with
their worst quarterly
performance since 2011
and the S&P 500 off
10% from its all-time
high.
• Volatility makes a
resurgence. Factors
weighing on the minds of
investors—slowing
China, Federal Reserve
uncertainty, and
commodity price
declines.
• At this time we do not
believe a U.S. recession
or protracted equity bear
market is on the horizon.
Economic conditions that
typically precede
recessions are not yet
present.
However, asset class return expectations should be tempered in light of slow global growth. CONVERGENTWEALTH.COM | 2 INDEX 3RD QTR RETURN YTD RETURN 1-YEAR RETURN 3-YEAR RETURN (6.43%) (11.92%) (5.27%) (7.73%) (0.60%) 1.25% 12.39% 11.02% (10.19%) (17.78%) (4.91%) (15.22%) (8.27%) (18.98%) 6.08% (4.93%) (5.83%) (2.21%) (2.26%) 5.03% (3.80%) (14.47%) (19.55%) (4.52%) (15.81%) (22.89%) 1.63% (25.99%) (33.58%) 6.33% (16.02%) (7.72%) (0.92%) 1.26% 1.51% 4.56% (4.85%) 1.29% (10.49%) (2.45%) 1.61% (14.85%) (3.43%) 3.42% (19.71%) 3.52% 1.97% (8.70%) 1.24% 1.76% 1.32% 0.00% 1.14% 1.80% 1.64% 0.00% 2.94% 3.76% 2.22% 0.00% 1.71% 1.28% 2.07% 0.02% EQUITY U.S. Equity S&P 500 Russell 2000 International Equity MSCI EAFE MSCI Emerging Markets Alternative Equity HFRI Equity Hedge REAL ASSETS S&P Global Property DJ UBS Commodity S&P North America Natural Resources OPPORTUNISTIC HFRI Fund of Funds Conservative FIXED INCOME Core Plus Barclays U.S. Corporate High Yield Barclays Mortgage Backed Securities JPM GBI-EM Global Diversified Core Barclays U.S.
Aggregate Bond Barclays U.S. Treasury Barclays Municipal 1-10 Year Citi 3-Month Treasury Bill Sources: Bloomberg, HFR, Morningstar, MSCI. Data as of 09/30/15.
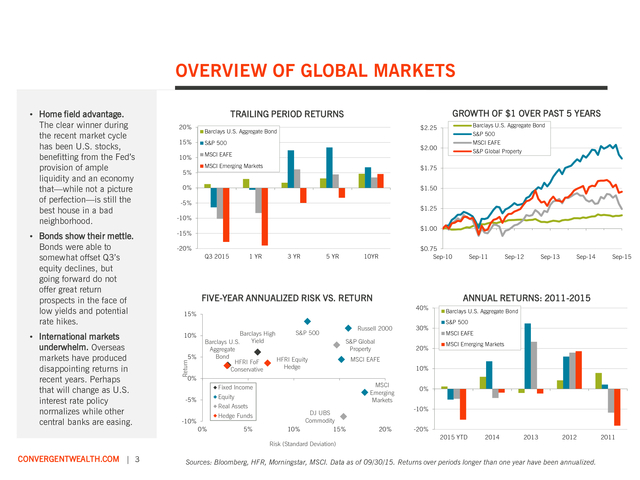
Returns longer than one year have been annualized. . OVERVIEW OF GLOBAL MARKETS • Bonds show their mettle. Bonds were able to somewhat offset Q3’s equity declines, but going forward do not offer great return prospects in the face of low yields and potential rate hikes. • International markets underwhelm. Overseas markets have produced disappointing returns in recent years. Perhaps that will change as U.S. interest rate policy normalizes while other central banks are easing. 20% 15% S&P 500 10% MSCI EAFE 5% Barclays U.S. Aggregate Bond S&P 500 MSCI EAFE S&P Global Property $2.25 Barclays U.S.
Aggregate Bond $2.00 MSCI Emerging Markets $1.75 0% $1.50 -5% $1.25 -10% $1.00 -15% -20% Q3 2015 1 YR 3 YR 5 YR $0.75 Sep-10 10YR FIVE-YEAR ANNUALIZED RISK VS. RETURN 15% 10% 5% S&P 500 Barclays High Yield Barclays U.S. Aggregate Bond HFRI Equity HFRI FoF Hedge Conservative Russell 2000 S&P Global Property 0% Equity -5% Real Assets Hedge Funds -10% 0% 5% DJ UBS Commodity 10% 15% 30% 20% Sep-12 Sep-13 Sep-14 Sep-15 Barclays U.S. Aggregate Bond S&P 500 MSCI EAFE MSCI Emerging Markets MSCI EAFE 10% MSCI Emerging Markets Fixed Income Sep-11 ANNUAL RETURNS: 2011-2015 40% Risk (Standard Deviation) CONVERGENTWEALTH.COM | 3 GROWTH OF $1 OVER PAST 5 YEARS TRAILING PERIOD RETURNS Return • Home field advantage. The clear winner during the recent market cycle has been U.S.
stocks, benefitting from the Fed’s provision of ample liquidity and an economy that—while not a picture of perfection—is still the best house in a bad neighborhood. 0% -10% 20% -20% 2015 YTD 2014 2013 2012 Sources: Bloomberg, HFR, Morningstar, MSCI. Data as of 09/30/15. Returns over periods longer than one year have been annualized. 2011 .
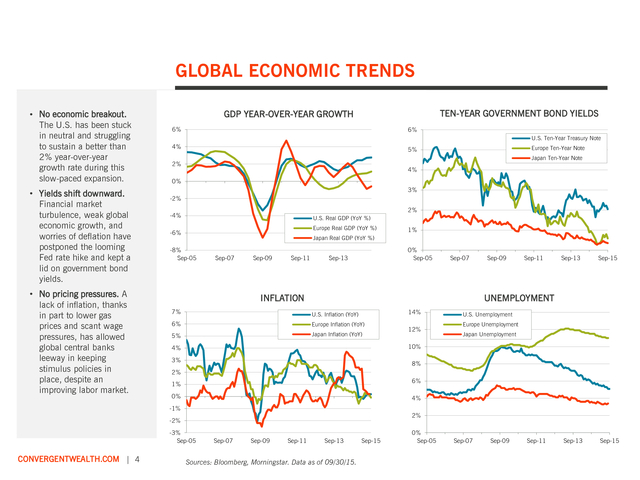
GLOBAL ECONOMIC TRENDS • No economic breakout. The U.S. has been stuck in neutral and struggling to sustain a better than 2% year-over-year growth rate during this slow-paced expansion. • Yields shift downward. Financial market turbulence, weak global economic growth, and worries of deflation have postponed the looming Fed rate hike and kept a lid on government bond yields. • No pricing pressures. A lack of inflation, thanks in part to lower gas prices and scant wage pressures, has allowed global central banks leeway in keeping stimulus policies in place, despite an improving labor market. TEN-YEAR GOVERNMENT BOND YIELDS GDP YEAR-OVER-YEAR GROWTH 6% 6% U.S. Ten-Year Treasury Note 4% Japan Ten-Year Note 2% 4% 0% 3% -2% 2% -4% U.S.
Real GDP (YoY %) Europe Real GDP (YoY %) -6% 1% Japan Real GDP (YoY %) -8% Sep-05 Sep-07 Sep-09 Sep-11 0% Sep-05 Sep-13 Sep-07 INFLATION Sep-09 Sep-11 Sep-13 Sep-15 UNEMPLOYMENT 7% U.S. Inflation (YoY) 6% Europe Inflation (YoY) 5% Japan Inflation (YoY) 14% 12% U.S. Unemployment Europe Unemployment Japan Unemployment 10% 4% 3% 8% 2% 6% 1% 0% 4% -1% 2% -2% -3% Sep-05 CONVERGENTWEALTH.COM | 4 Europe Ten-Year Note 5% Sep-07 Sep-09 Sep-11 Sep-13 Sources: Bloomberg, Morningstar.
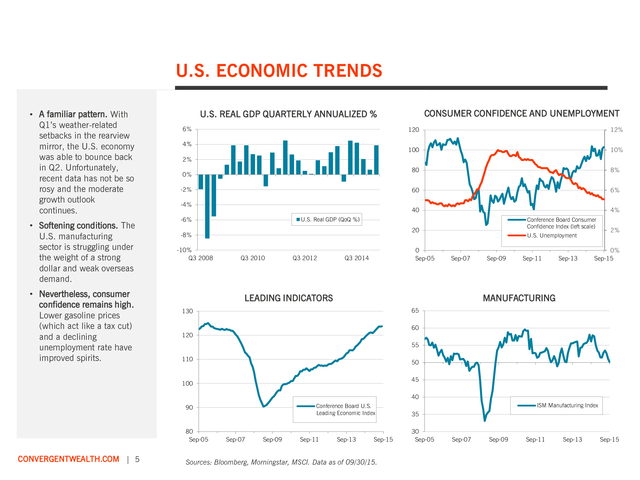
Data as of 09/30/15. Sep-15 0% Sep-05 Sep-07 Sep-09 Sep-11 Sep-13 Sep-15 . U.S. ECONOMIC TRENDS • A familiar pattern. With Q1’s weather-related setbacks in the rearview mirror, the U.S. economy was able to bounce back in Q2.
Unfortunately, recent data has not be so rosy and the moderate growth outlook continues. • Softening conditions. The U.S. manufacturing sector is struggling under the weight of a strong dollar and weak overseas demand. • Nevertheless, consumer confidence remains high. Lower gasoline prices (which act like a tax cut) and a declining unemployment rate have improved spirits. CONSUMER CONFIDENCE AND UNEMPLOYMENT U.S.
REAL GDP QUARTERLY ANNUALIZED % 6% 120 100 4% 12% 10% 2% 80 -2% -4% 6% 40 4% U.S. Real GDP (QoQ %) -6% Conference Board Consumer Confidence Index (left scale) 20 -8% -10% Q3 2008 8% 60 0% Q3 2010 Q3 2012 0 Sep-05 Q3 2014 U.S. Unemployment Sep-07 LEADING INDICATORS Sep-09 Sep-11 Sep-13 2% 0% Sep-15 MANUFACTURING 65 130 60 120 55 110 50 45 100 40 Conference Board U.S. Leading Economic Index 90 80 Sep-05 CONVERGENTWEALTH.COM | 5 Sep-07 Sep-09 Sep-11 Sep-13 Sep-15 Sources: Bloomberg, Morningstar, MSCI.
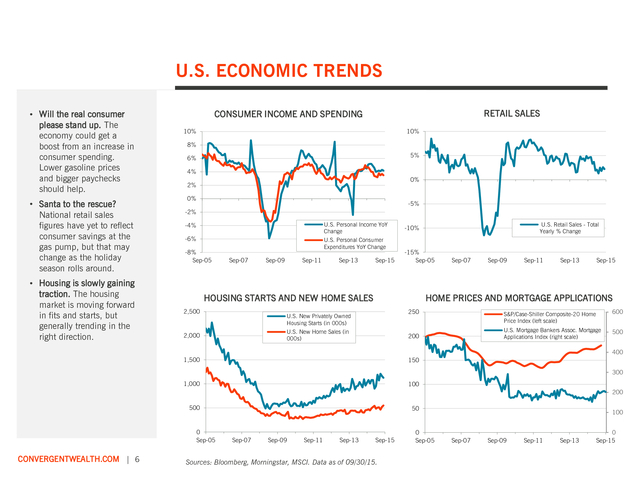
Data as of 09/30/15. ISM Manufacturing Index 35 30 Sep-05 Sep-07 Sep-09 Sep-11 Sep-13 Sep-15 . U.S. ECONOMIC TRENDS • Will the real consumer please stand up. The economy could get a boost from an increase in consumer spending. Lower gasoline prices and bigger paychecks should help. • Santa to the rescue? National retail sales figures have yet to reflect consumer savings at the gas pump, but that may change as the holiday season rolls around. • Housing is slowly gaining traction. The housing market is moving forward in fits and starts, but generally trending in the right direction. RETAIL SALES CONSUMER INCOME AND SPENDING 10% 10% 8% 5% 6% 4% 0% 2% 0% -5% -2% -4% U.S.
Personal Income YoY Change -6% U.S. Personal Consumer Expenditures YoY Change -8% Sep-05 Sep-07 Sep-09 Sep-11 Sep-13 Sep-15 -15% Sep-05 HOUSING STARTS AND NEW HOME SALES 2,500 Sep-07 Sep-09 Sep-11 Sep-13 Sep-15 HOME PRICES AND MORTGAGE APPLICATIONS 250 U.S. New Privately Owned Housing Starts (in 000s) U.S.
New Home Sales (in 000s) 2,000 U.S. Retail Sales - Total Yearly % Change -10% S&P/Case-Shiller Composite-20 Home Price Index (left scale) U.S. Mortgage Bankers Assoc.
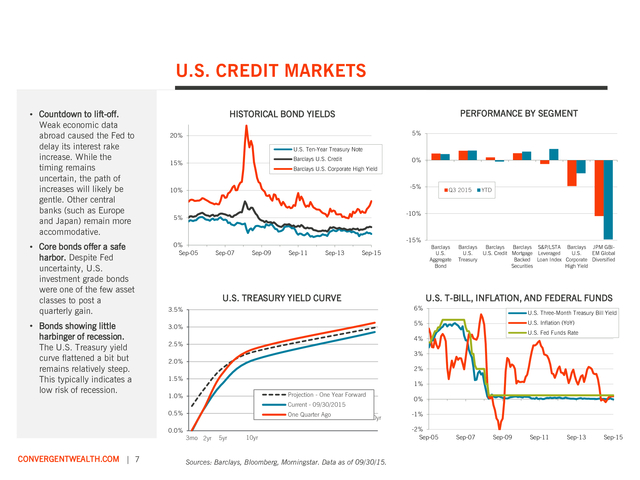
Mortgage Applications Index (right scale) 200 600 500 400 1,500 150 1,000 100 300 200 500 0 Sep-05 CONVERGENTWEALTH.COM | 6 50 Sep-07 Sep-09 Sep-11 Sep-13 Sep-15 Sources: Bloomberg, Morningstar, MSCI. Data as of 09/30/15. 0 Sep-05 100 Sep-07 Sep-09 Sep-11 Sep-13 0 Sep-15 . U.S. CREDIT MARKETS • Countdown to lift-off. Weak economic data abroad caused the Fed to delay its interest rake increase. While the timing remains uncertain, the path of increases will likely be gentle. Other central banks (such as Europe and Japan) remain more accommodative. • Core bonds offer a safe harbor.
Despite Fed uncertainty, U.S. investment grade bonds were one of the few asset classes to post a quarterly gain. • Bonds showing little harbinger of recession. The U.S. Treasury yield curve flattened a bit but remains relatively steep. This typically indicates a low risk of recession. PERFORMANCE BY SEGMENT HISTORICAL BOND YIELDS 5% 20% U.S. Ten-Year Treasury Note Barclays U.S.
Credit 15% 0% Barclays U.S. Corporate High Yield -5% 10% YTD -10% 5% 0% Sep-05 -15% Sep-07 Sep-09 Sep-11 Sep-13 Sep-15 U.S. TREASURY YIELD CURVE Barclays U.S. Aggregate Bond Barclays U.S. Treasury Barclays Barclays S&P/LSTA Barclays JPM GBIU.S.
Credit Mortgage Leveraged U.S. EM Global Backed Loan Index Corporate Diversified Securities High Yield U.S. T-BILL, INFLATION, AND FEDERAL FUNDS 6% 3.5% U.S. Three-Month Treasury Bill Yield U.S.
Inflation (YoY) 5% 3.0% U.S. Fed Funds Rate 4% 2.5% 3% 2.0% 2% 1.5% 1% Projection - One Year Forward 1.0% 0% Current - 09/30/2015 0.5% 0.0% CONVERGENTWEALTH.COM | 7 Q3 2015 One Quarter Ago 3mo 2yr 5yr 30yr 10yr Sources: Barclays, Bloomberg, Morningstar. Data as of 09/30/15. -1% -2% Sep-05 Sep-07 Sep-09 Sep-11 Sep-13 Sep-15 .
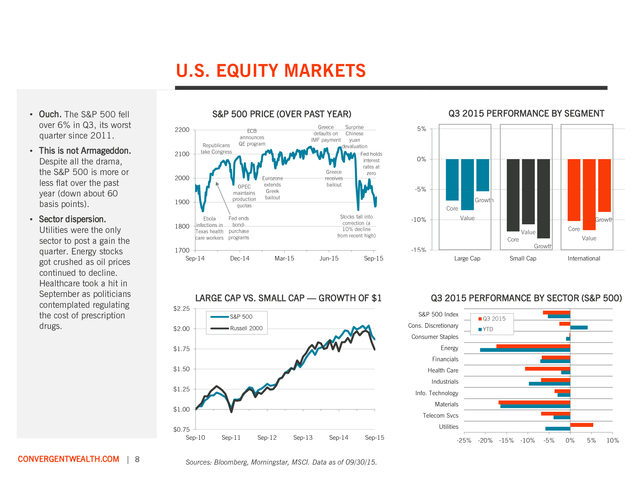
U.S. EQUITY MARKETS • Ouch. The S&P 500 fell over 6% in Q3, its worst quarter since 2011. • This is not Armageddon. Despite all the drama, the S&P 500 is more or less flat over the past year (down about 60 basis points). • Sector dispersion. Utilities were the only sector to post a gain the quarter. Energy stocks got crushed as oil prices continued to decline. Healthcare took a hit in September as politicians contemplated regulating the cost of prescription drugs. Q3 2015 PERFORMANCE BY SEGMENT S&P 500 PRICE (OVER PAST YEAR) 2200 2100 Republicans take Congress 2000 OPEC maintains production quotas 1900 1800 Greece Surprise defaults on Chinese IMF payment yuan devaluation Fed holds interest rates at Greece zero receives bailout ECB announces QE program Eurozone extends Greek bailout -5% Growth Stocks fall into correction (a 10% decline from recent high) Value -10% Growth Core -15% Dec-14 Mar-15 Jun-15 Sep-15 LARGE CAP VS.
SMALL CAP — GROWTH OF $1 $2.25 Large Cap Cons. Discretionary Russell 2000 Core Value Value Growth Small Cap International Q3 2015 PERFORMANCE BY SECTOR (S&P 500) S&P 500 Index S&P 500 $2.00 0% Core Fed ends Ebola bondinfections in Texas health purchase care workers programs 1700 Sep-14 5% Q3 2015 YTD Consumer Staples Energy $1.75 Financials $1.50 Health Care Industrials $1.25 Info. Technology Materials $1.00 $0.75 Sep-10 CONVERGENTWEALTH.COM | 8 Telecom Svcs Utilities Sep-11 Sep-12 Sep-13 Sep-14 Sep-15 Sources: Bloomberg, Morningstar, MSCI.
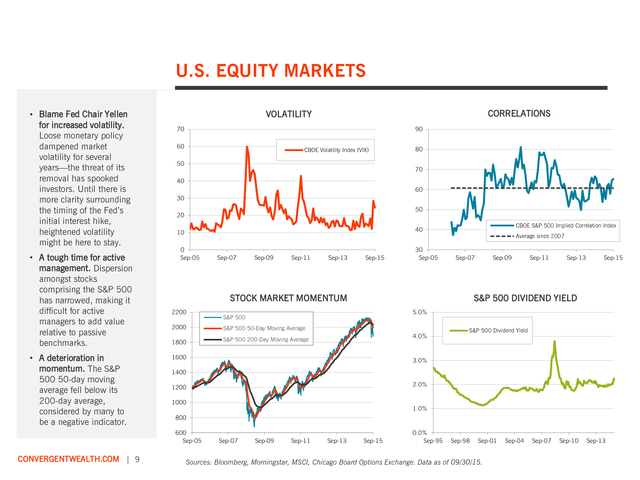
Data as of 09/30/15. -25% -20% -15% -10% -5% 0% 5% 10% . U.S. EQUITY MARKETS • Blame Fed Chair Yellen for increased volatility. Loose monetary policy dampened market volatility for several years—the threat of its removal has spooked investors. Until there is more clarity surrounding the timing of the Fed’s initial interest hike, heightened volatility might be here to stay. • A tough time for active management. Dispersion amongst stocks comprising the S&P 500 has narrowed, making it difficult for active managers to add value relative to passive benchmarks. • A deterioration in momentum.
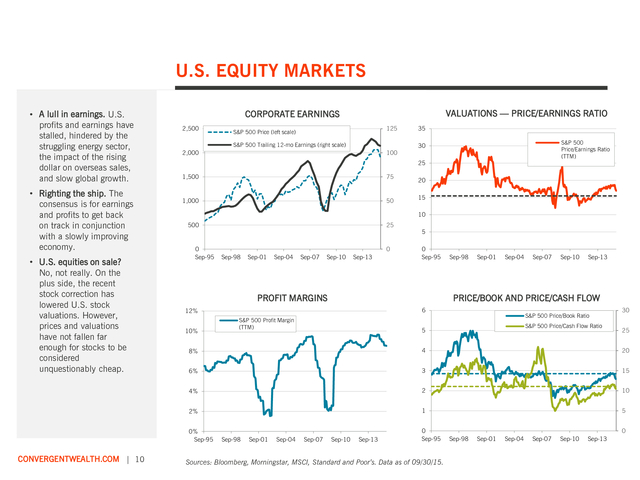
The S&P 500 50-day moving average fell below its 200-day average, considered by many to be a negative indicator. 70 90 60 CBOE Volatility Index (VIX) 50 80 70 40 60 30 50 20 CBOE S&P 500 Implied Correlation Index 40 10 0 Sep-05 Sep-07 Sep-09 Sep-11 Sep-13 Sep-15 30 Sep-05 Average since 2007 Sep-07 STOCK MARKET MOMENTUM 2200 Sep-09 Sep-11 Sep-13 Sep-15 S&P 500 DIVIDEND YIELD 5.0% S&P 500 2000 S&P 500 50-Day Moving Average 1800 S&P 500 200-Day Moving Average 4.0% 1600 S&P 500 Dividend Yield 3.0% 1400 2.0% 1200 1000 1.0% 800 600 Sep-05 CONVERGENTWEALTH.COM | 9 CORRELATIONS VOLATILITY Sep-07 Sep-09 Sep-11 Sep-13 Sep-15 0.0% Sep-95 Sep-98 Sep-01 Sources: Bloomberg, Morningstar, MSCI, Chicago Board Options Exchange. Data as of 09/30/15. Sep-04 Sep-07 Sep-10 Sep-13 . U.S. EQUITY MARKETS • A lull in earnings. U.S. profits and earnings have stalled, hindered by the struggling energy sector, the impact of the rising dollar on overseas sales, and slow global growth. • Righting the ship. The consensus is for earnings and profits to get back on track in conjunction with a slowly improving economy. • U.S.
equities on sale? No, not really. On the plus side, the recent stock correction has lowered U.S. stock valuations.
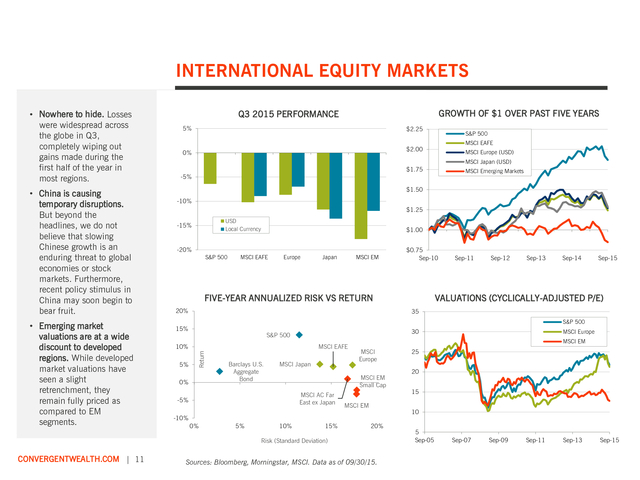
However, prices and valuations have not fallen far enough for stocks to be considered unquestionably cheap. VALUATIONS — PRICE/EARNINGS RATIO CORPORATE EARNINGS 2,500 125 S&P 500 Price (left scale) S&P 500 Trailing 12-mo Earnings (right scale) 2,000 100 35 S&P 500 Price/Earnings Ratio (TTM) 30 25 1,500 75 1,000 50 500 25 20 15 10 0 Sep-95 0 Sep-98 Sep-01 Sep-04 Sep-07 Sep-10 Sep-13 5 0 Sep-95 PROFIT MARGINS Sep-01 Sep-04 Sep-07 Sep-10 Sep-13 PRICE/BOOK AND PRICE/CASH FLOW 6 12% 10% Sep-98 S&P 500 Profit Margin (TTM) S&P 500 Price/Book Ratio S&P 500 Price/Cash Flow Ratio 5 30 25 8% 4 20 6% 3 15 4% 2 10 2% 1 5 0% Sep-95 CONVERGENTWEALTH.COM | 10 Sep-98 Sep-01 Sep-04 Sep-07 Sep-10 Sep-13 0 Sep-95 Sources: Bloomberg, Morningstar, MSCI, Standard and Poor’s. Data as of 09/30/15. 0 Sep-98 Sep-01 Sep-04 Sep-07 Sep-10 Sep-13 . INTERNATIONAL EQUITY MARKETS • China is causing temporary disruptions. But beyond the headlines, we do not believe that slowing Chinese growth is an enduring threat to global economies or stock markets. Furthermore, recent policy stimulus in China may soon begin to bear fruit. • Emerging market valuations are at a wide discount to developed regions. While developed market valuations have seen a slight retrenchment, they remain fully priced as compared to EM segments. GROWTH OF $1 OVER PAST FIVE YEARS Q3 2015 PERFORMANCE 5% $2.25 MSCI EAFE MSCI Europe (USD) MSCI Japan (USD) $1.75 MSCI Emerging Markets -5% $1.50 -10% $1.25 USD Local Currency -15% $1.00 -20% S&P 500 MSCI EAFE Europe Japan MSCI EM $0.75 Sep-10 FIVE-YEAR ANNUALIZED RISK VS RETURN 20% Sep-12 Sep-13 Sep-14 Sep-15 VALUATIONS (CYCLICALLY-ADJUSTED P/E) S&P 500 15% 30 S&P 500 10% 5% Sep-11 35 MSCI EAFE 0% Barclays U.S. Aggregate Bond MSCI Japan MSCI EM Small Cap MSCI AC Far East ex Japan -5% MSCI EM 5% 10% 15% 25 20 15 10 -10% 0% MSCI Europe MSCI EM MSCI Europe 20% Risk (Standard Deviation) CONVERGENTWEALTH.COM | 11 S&P 500 $2.00 0% Return • Nowhere to hide. Losses were widespread across the globe in Q3, completely wiping out gains made during the first half of the year in most regions. Sources: Bloomberg, Morningstar, MSCI.
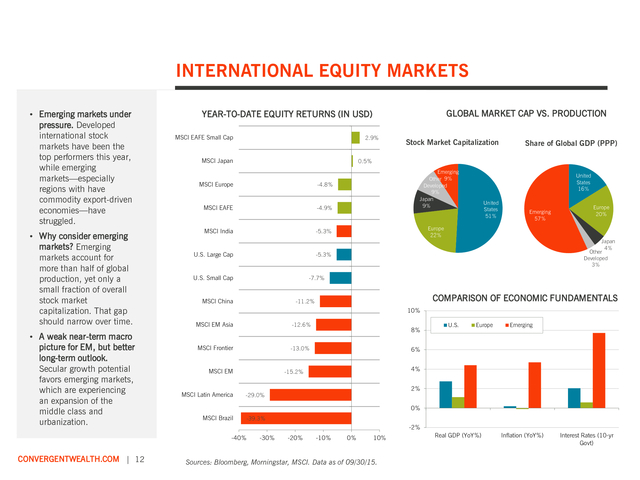
Data as of 09/30/15. 5 Sep-05 Sep-07 Sep-09 Sep-11 Sep-13 Sep-15 . INTERNATIONAL EQUITY MARKETS • Emerging markets under pressure. Developed international stock markets have been the top performers this year, while emerging markets—especially regions with have commodity export-driven economies—have struggled. • Why consider emerging markets? Emerging markets account for more than half of global production, yet only a small fraction of overall stock market capitalization. That gap should narrow over time. • A weak near-term macro picture for EM, but better long-term outlook. Secular growth potential favors emerging markets, which are experiencing an expansion of the middle class and urbanization. MSCI EAFE Small Cap 2.9% MSCI Japan Stock Market Capitalization Share of Global GDP (PPP) 0.5% MSCI Europe MSCI EAFE -4.9% MSCI India Emerging Other 9% Developed 9% Japan 9% -4.8% -5.3% U.S. Large Cap United States 16% United States 51% Emerging 57% Europe 22% U.S.
Small Cap Europe 20% Japan 4% Other Developed 3% -5.3% -7.7% MSCI China COMPARISON OF ECONOMIC FUNDAMENTALS -11.2% 10% MSCI EM Asia -12.6% MSCI Frontier -13.0% MSCI EM 8% MSCI Latin America Europe Emerging 4% 2% -29.0% MSCI Brazil U.S. 6% -15.2% -39.3% 0% -2% -40% CONVERGENTWEALTH.COM | 12 GLOBAL MARKET CAP VS. PRODUCTION YEAR-TO-DATE EQUITY RETURNS (IN USD) -30% -20% -10% 0% 10% Sources: Bloomberg, Morningstar, MSCI. Data as of 09/30/15. Real GDP (YoY%) Inflation (YoY%) Interest Rates (10-yr Govt) .
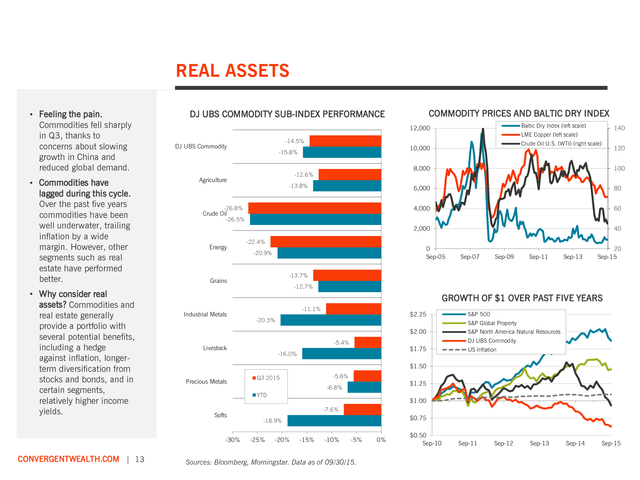
REAL ASSETS • Feeling the pain. Commodities fell sharply in Q3, thanks to concerns about slowing growth in China and reduced global demand. • Commodities have lagged during this cycle. Over the past five years commodities have been well underwater, trailing inflation by a wide margin. However, other segments such as real estate have performed better. • Why consider real assets? Commodities and real estate generally provide a portfolio with several potential benefits, including a hedge against inflation, longerterm diversification from stocks and bonds, and in certain segments, relatively higher income yields. Baltic Dry Index (left scale) 12,000 -14.5% DJ UBS Commodity 140 LME Copper (left scale) Crude Oil U.S. (WTI) (right scale) 10,000 -15.8% 120 8,000 60 2,000 -26.8% Crude Oil 80 4,000 -13.8% 100 6,000 -12.6% Agriculture 40 -26.5% Energy -22.4% 0 Sep-05 -20.9% Sep-07 Sep-09 Sep-11 Sep-13 20 Sep-15 -13.7% Grains -12.7% GROWTH OF $1 OVER PAST FIVE YEARS Industrial Metals -11.1% $2.25 -20.3% S&P North America Natural Resources DJ UBS Commodity -5.4% Livestock S&P 500 S&P Global Property $2.00 $1.75 -16.0% US Inflation $1.50 Precious Metals -5.6% Q3 2015 $1.25 -6.8% YTD Softs -30% CONVERGENTWEALTH.COM | 13 COMMODITY PRICES AND BALTIC DRY INDEX DJ UBS COMMODITY SUB-INDEX PERFORMANCE $1.00 -7.6% $0.75 -18.9% -25% -20% -15% -10% -5% Sources: Bloomberg, Morningstar. Data as of 09/30/15. 0% $0.50 Sep-10 Sep-11 Sep-12 Sep-13 Sep-14 Sep-15 .
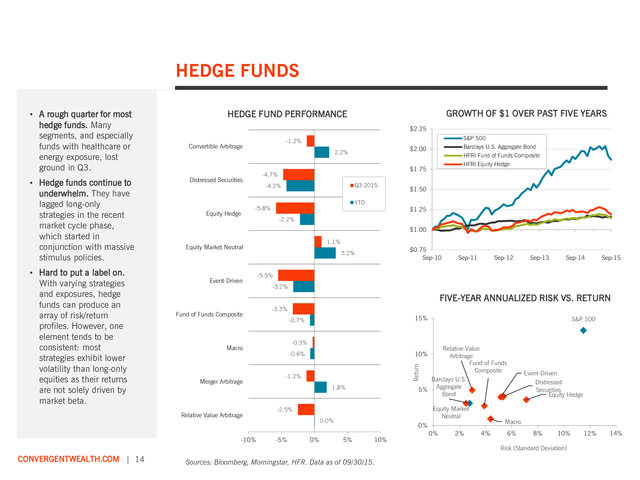
HEDGE FUNDS • Hedge funds continue to underwhelm. They have lagged long-only strategies in the recent market cycle phase, which started in conjunction with massive stimulus policies. • Hard to put a label on. With varying strategies and exposures, hedge funds can produce an array of risk/return profiles. However, one element tends to be consistent: most strategies exhibit lower volatility than long-only equities as their returns are not solely driven by market beta. GROWTH OF $1 OVER PAST FIVE YEARS HEDGE FUND PERFORMANCE $2.25 S&P 500 -1.2% Convertible Arbitrage 2.2% Q3 2015 -4.2% YTD -5.8% Equity Hedge HFRI Fund of Funds Composite HFRI Equity Hedge $1.75 -4.7% Distressed Securities Barclays U.S. Aggregate Bond $2.00 $1.50 $1.25 -2.2% $1.00 1.1% Equity Market Neutral Event-Driven $0.75 Sep-10 3.2% Sep-11 Sep-12 Sep-13 Sep-14 -3.2% FIVE-YEAR ANNUALIZED RISK VS.
RETURN Fund of Funds Composite -3.3% Merger Arbitrage -10% 15% -0.7% -0.3% Macro Relative Value Arbitrage Relative Value Arbitrage Fund of Funds Composite Barclays U.S. 5% Aggregate Bond 10% -0.6% -1.2% 1.8% Equity Market Neutral -2.5% 0.0% -5% S&P 500 0% Macro 0% 5% 10% 0% 2% Event-Driven Distressed Securities Equity Hedge 4% 6% 8% 10% Risk (Standard Deviation) CONVERGENTWEALTH.COM | 14 Sep-15 -5.5% Return • A rough quarter for most hedge funds. Many segments, and especially funds with healthcare or energy exposure, lost ground in Q3. Sources: Bloomberg, Morningstar, HFR. Data as of 09/30/15. 12% 14% .
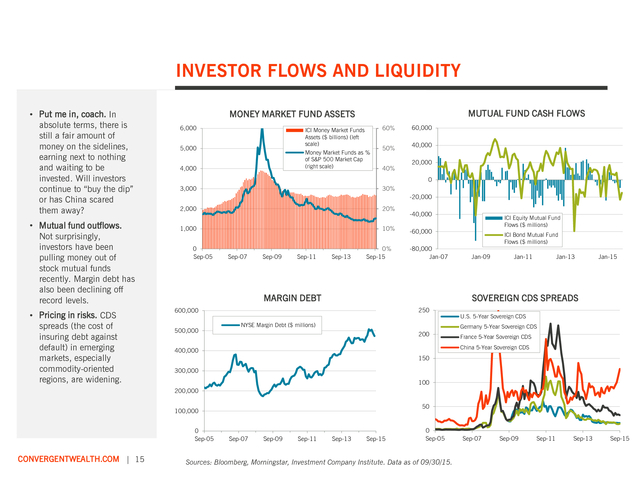
INVESTOR FLOWS AND LIQUIDITY • Put me in, coach. In absolute terms, there is still a fair amount of money on the sidelines, earning next to nothing and waiting to be invested. Will investors continue to “buy the dip” or has China scared them away? • Mutual fund outflows. Not surprisingly, investors have been pulling money out of stock mutual funds recently. Margin debt has also been declining off record levels. • Pricing in risks.
CDS spreads (the cost of insuring debt against default) in emerging markets, especially commodity-oriented regions, are widening. MUTUAL FUND CASH FLOWS MONEY MARKET FUND ASSETS 6,000 ICI Money Market Funds Assets ($ billions) (left scale) Money Market Funds as % of S&P 500 Market Cap (right scale) 5,000 4,000 60% 50% 40% 60,000 40,000 20,000 0 3,000 30% 2,000 20% 1,000 10% -20,000 0 Sep-05 Sep-07 Sep-09 Sep-11 Sep-13 0% Sep-15 -40,000 -60,000 -80,000 Jan-07 MARGIN DEBT ICI Bond Mutual Fund Flows ($ millions) Jan-09 Jan-11 Jan-13 Jan-15 SOVEREIGN CDS SPREADS 250 600,000 500,000 ICI Equity Mutual Fund Flows ($ millions) NYSE Margin Debt ($ millions) U.S. 5-Year Sovereign CDS Germany 5-Year Sovereign CDS 200 France 5-Year Sovereign CDS China 5-Year Sovereign CDS 400,000 150 300,000 100 200,000 50 100,000 0 Sep-05 CONVERGENTWEALTH.COM | 15 Sep-07 Sep-09 Sep-11 Sep-13 Sep-15 0 Sep-05 Sources: Bloomberg, Morningstar, Investment Company Institute. Data as of 09/30/15. Sep-07 Sep-09 Sep-11 Sep-13 Sep-15 .
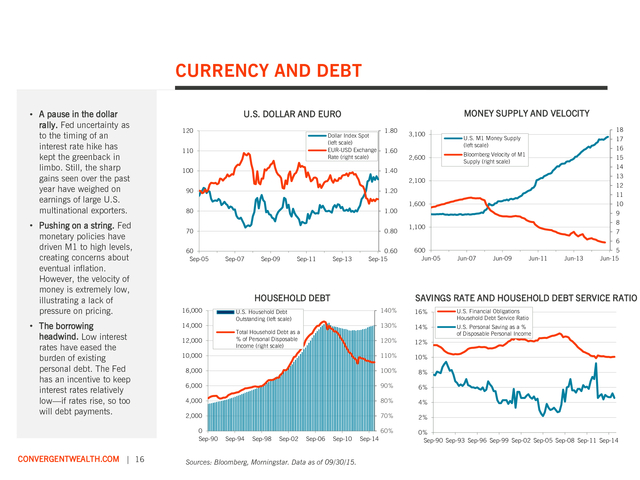
CURRENCY AND DEBT • A pause in the dollar rally. Fed uncertainty as to the timing of an interest rate hike has kept the greenback in limbo. Still, the sharp gains seen over the past year have weighed on earnings of large U.S. multinational exporters. • Pushing on a string. Fed monetary policies have driven M1 to high levels, creating concerns about eventual inflation. However, the velocity of money is extremely low, illustrating a lack of pressure on pricing. • The borrowing headwind.
Low interest rates have eased the burden of existing personal debt. The Fed has an incentive to keep interest rates relatively low—if rates rise, so too will debt payments. 120 Dollar Index Spot (left scale) EUR-USD Exchange Rate (right scale) 110 1.80 1.60 100 90 1.00 70 0.80 2,600 18 17 U.S. M1 Money Supply (left scale) 16 15 Bloomberg Velocity of M1 Supply (right scale) 1.20 80 3,100 1.40 2,100 60 Sep-05 Sep-07 Sep-09 Sep-11 Sep-13 0.60 Sep-15 HOUSEHOLD DEBT 16,000 1,600 1,100 600 Jun-05 Jun-07 Jun-09 Jun-11 Jun-13 14 13 12 11 10 9 8 7 6 5 Jun-15 SAVINGS RATE AND HOUSEHOLD DEBT SERVICE RATIO 140% 16% U.S.
Financial Obligations Household Debt Service Ratio 130% 14% 120% U.S. Personal Saving as a % of Disposable Personal Income 12% 10,000 110% 10% 8,000 100% 8% 6,000 90% 6% 4,000 80% 4% 2,000 70% 2% 60% 0% Sep-90 Sep-93 Sep-96 Sep-99 Sep-02 Sep-05 Sep-08 Sep-11 Sep-14 14,000 12,000 0 Sep-90 CONVERGENTWEALTH.COM | 16 MONEY SUPPLY AND VELOCITY U.S. DOLLAR AND EURO U.S.
Household Debt Outstanding (left scale) Total Household Debt as a % of Personal Disposable Income (right scale) Sep-94 Sep-98 Sep-02 Sep-06 Sep-10 Sources: Bloomberg, Morningstar. Data as of 09/30/15. Sep-14 . DISCLOSURE The information contained in this summary is for informational purposes only and contains confidential and proprietary information that is subject to change without notice. Any opinions expressed are current only as of the time made and are subject to change without notice. This report may include estimates, projections or other forward looking statements, however, due to numerous factors, actual events may differ substantially from those presented. The graphs and tables making up this report have been based on unaudited, thirdparty data and performance information provided to us by one or more commercial databases.
While we believe this information to be reliable, Convergent bears no responsibility whatsoever for any errors or omissions. Additionally, please be aware that past performance is not a guide to the future performance of any manager or strategy, and that the performance results displayed herein may have been adversely or favorably impacted by events and economic conditions that will not prevail in the future. Therefore, caution must be used in inferring that these results are indicative of the future performance of any strategy.
Index results assume the re-investment of all dividends and interest. Moreover, the information provided is not intended to be, and should not be construed as, investment, legal or tax advice. Nothing contained herein should be construed as a recommendation or advice to purchase or sell any security, investment, or portfolio allocation.
Any investment advice provided by Convergent is client specific based on each clients' risk tolerance and investment objectives. Please consult your Convergent Advisor directly for investment advice related to your specific investment portfolio. Non-deposit investment products are not FDIC insured, are not deposits or other obligations of City National Bank, are not guaranteed by City National Bank and involve investment risks, including the possible loss of principal. CONVERGENTWEALTH.COM | 17 .
However, asset class return expectations should be tempered in light of slow global growth. CONVERGENTWEALTH.COM | 2 INDEX 3RD QTR RETURN YTD RETURN 1-YEAR RETURN 3-YEAR RETURN (6.43%) (11.92%) (5.27%) (7.73%) (0.60%) 1.25% 12.39% 11.02% (10.19%) (17.78%) (4.91%) (15.22%) (8.27%) (18.98%) 6.08% (4.93%) (5.83%) (2.21%) (2.26%) 5.03% (3.80%) (14.47%) (19.55%) (4.52%) (15.81%) (22.89%) 1.63% (25.99%) (33.58%) 6.33% (16.02%) (7.72%) (0.92%) 1.26% 1.51% 4.56% (4.85%) 1.29% (10.49%) (2.45%) 1.61% (14.85%) (3.43%) 3.42% (19.71%) 3.52% 1.97% (8.70%) 1.24% 1.76% 1.32% 0.00% 1.14% 1.80% 1.64% 0.00% 2.94% 3.76% 2.22% 0.00% 1.71% 1.28% 2.07% 0.02% EQUITY U.S. Equity S&P 500 Russell 2000 International Equity MSCI EAFE MSCI Emerging Markets Alternative Equity HFRI Equity Hedge REAL ASSETS S&P Global Property DJ UBS Commodity S&P North America Natural Resources OPPORTUNISTIC HFRI Fund of Funds Conservative FIXED INCOME Core Plus Barclays U.S. Corporate High Yield Barclays Mortgage Backed Securities JPM GBI-EM Global Diversified Core Barclays U.S.
Aggregate Bond Barclays U.S. Treasury Barclays Municipal 1-10 Year Citi 3-Month Treasury Bill Sources: Bloomberg, HFR, Morningstar, MSCI. Data as of 09/30/15.
Returns longer than one year have been annualized. . OVERVIEW OF GLOBAL MARKETS • Bonds show their mettle. Bonds were able to somewhat offset Q3’s equity declines, but going forward do not offer great return prospects in the face of low yields and potential rate hikes. • International markets underwhelm. Overseas markets have produced disappointing returns in recent years. Perhaps that will change as U.S. interest rate policy normalizes while other central banks are easing. 20% 15% S&P 500 10% MSCI EAFE 5% Barclays U.S. Aggregate Bond S&P 500 MSCI EAFE S&P Global Property $2.25 Barclays U.S.
Aggregate Bond $2.00 MSCI Emerging Markets $1.75 0% $1.50 -5% $1.25 -10% $1.00 -15% -20% Q3 2015 1 YR 3 YR 5 YR $0.75 Sep-10 10YR FIVE-YEAR ANNUALIZED RISK VS. RETURN 15% 10% 5% S&P 500 Barclays High Yield Barclays U.S. Aggregate Bond HFRI Equity HFRI FoF Hedge Conservative Russell 2000 S&P Global Property 0% Equity -5% Real Assets Hedge Funds -10% 0% 5% DJ UBS Commodity 10% 15% 30% 20% Sep-12 Sep-13 Sep-14 Sep-15 Barclays U.S. Aggregate Bond S&P 500 MSCI EAFE MSCI Emerging Markets MSCI EAFE 10% MSCI Emerging Markets Fixed Income Sep-11 ANNUAL RETURNS: 2011-2015 40% Risk (Standard Deviation) CONVERGENTWEALTH.COM | 3 GROWTH OF $1 OVER PAST 5 YEARS TRAILING PERIOD RETURNS Return • Home field advantage. The clear winner during the recent market cycle has been U.S.
stocks, benefitting from the Fed’s provision of ample liquidity and an economy that—while not a picture of perfection—is still the best house in a bad neighborhood. 0% -10% 20% -20% 2015 YTD 2014 2013 2012 Sources: Bloomberg, HFR, Morningstar, MSCI. Data as of 09/30/15. Returns over periods longer than one year have been annualized. 2011 .
GLOBAL ECONOMIC TRENDS • No economic breakout. The U.S. has been stuck in neutral and struggling to sustain a better than 2% year-over-year growth rate during this slow-paced expansion. • Yields shift downward. Financial market turbulence, weak global economic growth, and worries of deflation have postponed the looming Fed rate hike and kept a lid on government bond yields. • No pricing pressures. A lack of inflation, thanks in part to lower gas prices and scant wage pressures, has allowed global central banks leeway in keeping stimulus policies in place, despite an improving labor market. TEN-YEAR GOVERNMENT BOND YIELDS GDP YEAR-OVER-YEAR GROWTH 6% 6% U.S. Ten-Year Treasury Note 4% Japan Ten-Year Note 2% 4% 0% 3% -2% 2% -4% U.S.
Real GDP (YoY %) Europe Real GDP (YoY %) -6% 1% Japan Real GDP (YoY %) -8% Sep-05 Sep-07 Sep-09 Sep-11 0% Sep-05 Sep-13 Sep-07 INFLATION Sep-09 Sep-11 Sep-13 Sep-15 UNEMPLOYMENT 7% U.S. Inflation (YoY) 6% Europe Inflation (YoY) 5% Japan Inflation (YoY) 14% 12% U.S. Unemployment Europe Unemployment Japan Unemployment 10% 4% 3% 8% 2% 6% 1% 0% 4% -1% 2% -2% -3% Sep-05 CONVERGENTWEALTH.COM | 4 Europe Ten-Year Note 5% Sep-07 Sep-09 Sep-11 Sep-13 Sources: Bloomberg, Morningstar.
Data as of 09/30/15. Sep-15 0% Sep-05 Sep-07 Sep-09 Sep-11 Sep-13 Sep-15 . U.S. ECONOMIC TRENDS • A familiar pattern. With Q1’s weather-related setbacks in the rearview mirror, the U.S. economy was able to bounce back in Q2.
Unfortunately, recent data has not be so rosy and the moderate growth outlook continues. • Softening conditions. The U.S. manufacturing sector is struggling under the weight of a strong dollar and weak overseas demand. • Nevertheless, consumer confidence remains high. Lower gasoline prices (which act like a tax cut) and a declining unemployment rate have improved spirits. CONSUMER CONFIDENCE AND UNEMPLOYMENT U.S.
REAL GDP QUARTERLY ANNUALIZED % 6% 120 100 4% 12% 10% 2% 80 -2% -4% 6% 40 4% U.S. Real GDP (QoQ %) -6% Conference Board Consumer Confidence Index (left scale) 20 -8% -10% Q3 2008 8% 60 0% Q3 2010 Q3 2012 0 Sep-05 Q3 2014 U.S. Unemployment Sep-07 LEADING INDICATORS Sep-09 Sep-11 Sep-13 2% 0% Sep-15 MANUFACTURING 65 130 60 120 55 110 50 45 100 40 Conference Board U.S. Leading Economic Index 90 80 Sep-05 CONVERGENTWEALTH.COM | 5 Sep-07 Sep-09 Sep-11 Sep-13 Sep-15 Sources: Bloomberg, Morningstar, MSCI.
Data as of 09/30/15. ISM Manufacturing Index 35 30 Sep-05 Sep-07 Sep-09 Sep-11 Sep-13 Sep-15 . U.S. ECONOMIC TRENDS • Will the real consumer please stand up. The economy could get a boost from an increase in consumer spending. Lower gasoline prices and bigger paychecks should help. • Santa to the rescue? National retail sales figures have yet to reflect consumer savings at the gas pump, but that may change as the holiday season rolls around. • Housing is slowly gaining traction. The housing market is moving forward in fits and starts, but generally trending in the right direction. RETAIL SALES CONSUMER INCOME AND SPENDING 10% 10% 8% 5% 6% 4% 0% 2% 0% -5% -2% -4% U.S.
Personal Income YoY Change -6% U.S. Personal Consumer Expenditures YoY Change -8% Sep-05 Sep-07 Sep-09 Sep-11 Sep-13 Sep-15 -15% Sep-05 HOUSING STARTS AND NEW HOME SALES 2,500 Sep-07 Sep-09 Sep-11 Sep-13 Sep-15 HOME PRICES AND MORTGAGE APPLICATIONS 250 U.S. New Privately Owned Housing Starts (in 000s) U.S.
New Home Sales (in 000s) 2,000 U.S. Retail Sales - Total Yearly % Change -10% S&P/Case-Shiller Composite-20 Home Price Index (left scale) U.S. Mortgage Bankers Assoc.
Mortgage Applications Index (right scale) 200 600 500 400 1,500 150 1,000 100 300 200 500 0 Sep-05 CONVERGENTWEALTH.COM | 6 50 Sep-07 Sep-09 Sep-11 Sep-13 Sep-15 Sources: Bloomberg, Morningstar, MSCI. Data as of 09/30/15. 0 Sep-05 100 Sep-07 Sep-09 Sep-11 Sep-13 0 Sep-15 . U.S. CREDIT MARKETS • Countdown to lift-off. Weak economic data abroad caused the Fed to delay its interest rake increase. While the timing remains uncertain, the path of increases will likely be gentle. Other central banks (such as Europe and Japan) remain more accommodative. • Core bonds offer a safe harbor.
Despite Fed uncertainty, U.S. investment grade bonds were one of the few asset classes to post a quarterly gain. • Bonds showing little harbinger of recession. The U.S. Treasury yield curve flattened a bit but remains relatively steep. This typically indicates a low risk of recession. PERFORMANCE BY SEGMENT HISTORICAL BOND YIELDS 5% 20% U.S. Ten-Year Treasury Note Barclays U.S.
Credit 15% 0% Barclays U.S. Corporate High Yield -5% 10% YTD -10% 5% 0% Sep-05 -15% Sep-07 Sep-09 Sep-11 Sep-13 Sep-15 U.S. TREASURY YIELD CURVE Barclays U.S. Aggregate Bond Barclays U.S. Treasury Barclays Barclays S&P/LSTA Barclays JPM GBIU.S.
Credit Mortgage Leveraged U.S. EM Global Backed Loan Index Corporate Diversified Securities High Yield U.S. T-BILL, INFLATION, AND FEDERAL FUNDS 6% 3.5% U.S. Three-Month Treasury Bill Yield U.S.
Inflation (YoY) 5% 3.0% U.S. Fed Funds Rate 4% 2.5% 3% 2.0% 2% 1.5% 1% Projection - One Year Forward 1.0% 0% Current - 09/30/2015 0.5% 0.0% CONVERGENTWEALTH.COM | 7 Q3 2015 One Quarter Ago 3mo 2yr 5yr 30yr 10yr Sources: Barclays, Bloomberg, Morningstar. Data as of 09/30/15. -1% -2% Sep-05 Sep-07 Sep-09 Sep-11 Sep-13 Sep-15 .
U.S. EQUITY MARKETS • Ouch. The S&P 500 fell over 6% in Q3, its worst quarter since 2011. • This is not Armageddon. Despite all the drama, the S&P 500 is more or less flat over the past year (down about 60 basis points). • Sector dispersion. Utilities were the only sector to post a gain the quarter. Energy stocks got crushed as oil prices continued to decline. Healthcare took a hit in September as politicians contemplated regulating the cost of prescription drugs. Q3 2015 PERFORMANCE BY SEGMENT S&P 500 PRICE (OVER PAST YEAR) 2200 2100 Republicans take Congress 2000 OPEC maintains production quotas 1900 1800 Greece Surprise defaults on Chinese IMF payment yuan devaluation Fed holds interest rates at Greece zero receives bailout ECB announces QE program Eurozone extends Greek bailout -5% Growth Stocks fall into correction (a 10% decline from recent high) Value -10% Growth Core -15% Dec-14 Mar-15 Jun-15 Sep-15 LARGE CAP VS.
SMALL CAP — GROWTH OF $1 $2.25 Large Cap Cons. Discretionary Russell 2000 Core Value Value Growth Small Cap International Q3 2015 PERFORMANCE BY SECTOR (S&P 500) S&P 500 Index S&P 500 $2.00 0% Core Fed ends Ebola bondinfections in Texas health purchase care workers programs 1700 Sep-14 5% Q3 2015 YTD Consumer Staples Energy $1.75 Financials $1.50 Health Care Industrials $1.25 Info. Technology Materials $1.00 $0.75 Sep-10 CONVERGENTWEALTH.COM | 8 Telecom Svcs Utilities Sep-11 Sep-12 Sep-13 Sep-14 Sep-15 Sources: Bloomberg, Morningstar, MSCI.
Data as of 09/30/15. -25% -20% -15% -10% -5% 0% 5% 10% . U.S. EQUITY MARKETS • Blame Fed Chair Yellen for increased volatility. Loose monetary policy dampened market volatility for several years—the threat of its removal has spooked investors. Until there is more clarity surrounding the timing of the Fed’s initial interest hike, heightened volatility might be here to stay. • A tough time for active management. Dispersion amongst stocks comprising the S&P 500 has narrowed, making it difficult for active managers to add value relative to passive benchmarks. • A deterioration in momentum.
The S&P 500 50-day moving average fell below its 200-day average, considered by many to be a negative indicator. 70 90 60 CBOE Volatility Index (VIX) 50 80 70 40 60 30 50 20 CBOE S&P 500 Implied Correlation Index 40 10 0 Sep-05 Sep-07 Sep-09 Sep-11 Sep-13 Sep-15 30 Sep-05 Average since 2007 Sep-07 STOCK MARKET MOMENTUM 2200 Sep-09 Sep-11 Sep-13 Sep-15 S&P 500 DIVIDEND YIELD 5.0% S&P 500 2000 S&P 500 50-Day Moving Average 1800 S&P 500 200-Day Moving Average 4.0% 1600 S&P 500 Dividend Yield 3.0% 1400 2.0% 1200 1000 1.0% 800 600 Sep-05 CONVERGENTWEALTH.COM | 9 CORRELATIONS VOLATILITY Sep-07 Sep-09 Sep-11 Sep-13 Sep-15 0.0% Sep-95 Sep-98 Sep-01 Sources: Bloomberg, Morningstar, MSCI, Chicago Board Options Exchange. Data as of 09/30/15. Sep-04 Sep-07 Sep-10 Sep-13 . U.S. EQUITY MARKETS • A lull in earnings. U.S. profits and earnings have stalled, hindered by the struggling energy sector, the impact of the rising dollar on overseas sales, and slow global growth. • Righting the ship. The consensus is for earnings and profits to get back on track in conjunction with a slowly improving economy. • U.S.
equities on sale? No, not really. On the plus side, the recent stock correction has lowered U.S. stock valuations.
However, prices and valuations have not fallen far enough for stocks to be considered unquestionably cheap. VALUATIONS — PRICE/EARNINGS RATIO CORPORATE EARNINGS 2,500 125 S&P 500 Price (left scale) S&P 500 Trailing 12-mo Earnings (right scale) 2,000 100 35 S&P 500 Price/Earnings Ratio (TTM) 30 25 1,500 75 1,000 50 500 25 20 15 10 0 Sep-95 0 Sep-98 Sep-01 Sep-04 Sep-07 Sep-10 Sep-13 5 0 Sep-95 PROFIT MARGINS Sep-01 Sep-04 Sep-07 Sep-10 Sep-13 PRICE/BOOK AND PRICE/CASH FLOW 6 12% 10% Sep-98 S&P 500 Profit Margin (TTM) S&P 500 Price/Book Ratio S&P 500 Price/Cash Flow Ratio 5 30 25 8% 4 20 6% 3 15 4% 2 10 2% 1 5 0% Sep-95 CONVERGENTWEALTH.COM | 10 Sep-98 Sep-01 Sep-04 Sep-07 Sep-10 Sep-13 0 Sep-95 Sources: Bloomberg, Morningstar, MSCI, Standard and Poor’s. Data as of 09/30/15. 0 Sep-98 Sep-01 Sep-04 Sep-07 Sep-10 Sep-13 . INTERNATIONAL EQUITY MARKETS • China is causing temporary disruptions. But beyond the headlines, we do not believe that slowing Chinese growth is an enduring threat to global economies or stock markets. Furthermore, recent policy stimulus in China may soon begin to bear fruit. • Emerging market valuations are at a wide discount to developed regions. While developed market valuations have seen a slight retrenchment, they remain fully priced as compared to EM segments. GROWTH OF $1 OVER PAST FIVE YEARS Q3 2015 PERFORMANCE 5% $2.25 MSCI EAFE MSCI Europe (USD) MSCI Japan (USD) $1.75 MSCI Emerging Markets -5% $1.50 -10% $1.25 USD Local Currency -15% $1.00 -20% S&P 500 MSCI EAFE Europe Japan MSCI EM $0.75 Sep-10 FIVE-YEAR ANNUALIZED RISK VS RETURN 20% Sep-12 Sep-13 Sep-14 Sep-15 VALUATIONS (CYCLICALLY-ADJUSTED P/E) S&P 500 15% 30 S&P 500 10% 5% Sep-11 35 MSCI EAFE 0% Barclays U.S. Aggregate Bond MSCI Japan MSCI EM Small Cap MSCI AC Far East ex Japan -5% MSCI EM 5% 10% 15% 25 20 15 10 -10% 0% MSCI Europe MSCI EM MSCI Europe 20% Risk (Standard Deviation) CONVERGENTWEALTH.COM | 11 S&P 500 $2.00 0% Return • Nowhere to hide. Losses were widespread across the globe in Q3, completely wiping out gains made during the first half of the year in most regions. Sources: Bloomberg, Morningstar, MSCI.
Data as of 09/30/15. 5 Sep-05 Sep-07 Sep-09 Sep-11 Sep-13 Sep-15 . INTERNATIONAL EQUITY MARKETS • Emerging markets under pressure. Developed international stock markets have been the top performers this year, while emerging markets—especially regions with have commodity export-driven economies—have struggled. • Why consider emerging markets? Emerging markets account for more than half of global production, yet only a small fraction of overall stock market capitalization. That gap should narrow over time. • A weak near-term macro picture for EM, but better long-term outlook. Secular growth potential favors emerging markets, which are experiencing an expansion of the middle class and urbanization. MSCI EAFE Small Cap 2.9% MSCI Japan Stock Market Capitalization Share of Global GDP (PPP) 0.5% MSCI Europe MSCI EAFE -4.9% MSCI India Emerging Other 9% Developed 9% Japan 9% -4.8% -5.3% U.S. Large Cap United States 16% United States 51% Emerging 57% Europe 22% U.S.
Small Cap Europe 20% Japan 4% Other Developed 3% -5.3% -7.7% MSCI China COMPARISON OF ECONOMIC FUNDAMENTALS -11.2% 10% MSCI EM Asia -12.6% MSCI Frontier -13.0% MSCI EM 8% MSCI Latin America Europe Emerging 4% 2% -29.0% MSCI Brazil U.S. 6% -15.2% -39.3% 0% -2% -40% CONVERGENTWEALTH.COM | 12 GLOBAL MARKET CAP VS. PRODUCTION YEAR-TO-DATE EQUITY RETURNS (IN USD) -30% -20% -10% 0% 10% Sources: Bloomberg, Morningstar, MSCI. Data as of 09/30/15. Real GDP (YoY%) Inflation (YoY%) Interest Rates (10-yr Govt) .
REAL ASSETS • Feeling the pain. Commodities fell sharply in Q3, thanks to concerns about slowing growth in China and reduced global demand. • Commodities have lagged during this cycle. Over the past five years commodities have been well underwater, trailing inflation by a wide margin. However, other segments such as real estate have performed better. • Why consider real assets? Commodities and real estate generally provide a portfolio with several potential benefits, including a hedge against inflation, longerterm diversification from stocks and bonds, and in certain segments, relatively higher income yields. Baltic Dry Index (left scale) 12,000 -14.5% DJ UBS Commodity 140 LME Copper (left scale) Crude Oil U.S. (WTI) (right scale) 10,000 -15.8% 120 8,000 60 2,000 -26.8% Crude Oil 80 4,000 -13.8% 100 6,000 -12.6% Agriculture 40 -26.5% Energy -22.4% 0 Sep-05 -20.9% Sep-07 Sep-09 Sep-11 Sep-13 20 Sep-15 -13.7% Grains -12.7% GROWTH OF $1 OVER PAST FIVE YEARS Industrial Metals -11.1% $2.25 -20.3% S&P North America Natural Resources DJ UBS Commodity -5.4% Livestock S&P 500 S&P Global Property $2.00 $1.75 -16.0% US Inflation $1.50 Precious Metals -5.6% Q3 2015 $1.25 -6.8% YTD Softs -30% CONVERGENTWEALTH.COM | 13 COMMODITY PRICES AND BALTIC DRY INDEX DJ UBS COMMODITY SUB-INDEX PERFORMANCE $1.00 -7.6% $0.75 -18.9% -25% -20% -15% -10% -5% Sources: Bloomberg, Morningstar. Data as of 09/30/15. 0% $0.50 Sep-10 Sep-11 Sep-12 Sep-13 Sep-14 Sep-15 .
HEDGE FUNDS • Hedge funds continue to underwhelm. They have lagged long-only strategies in the recent market cycle phase, which started in conjunction with massive stimulus policies. • Hard to put a label on. With varying strategies and exposures, hedge funds can produce an array of risk/return profiles. However, one element tends to be consistent: most strategies exhibit lower volatility than long-only equities as their returns are not solely driven by market beta. GROWTH OF $1 OVER PAST FIVE YEARS HEDGE FUND PERFORMANCE $2.25 S&P 500 -1.2% Convertible Arbitrage 2.2% Q3 2015 -4.2% YTD -5.8% Equity Hedge HFRI Fund of Funds Composite HFRI Equity Hedge $1.75 -4.7% Distressed Securities Barclays U.S. Aggregate Bond $2.00 $1.50 $1.25 -2.2% $1.00 1.1% Equity Market Neutral Event-Driven $0.75 Sep-10 3.2% Sep-11 Sep-12 Sep-13 Sep-14 -3.2% FIVE-YEAR ANNUALIZED RISK VS.
RETURN Fund of Funds Composite -3.3% Merger Arbitrage -10% 15% -0.7% -0.3% Macro Relative Value Arbitrage Relative Value Arbitrage Fund of Funds Composite Barclays U.S. 5% Aggregate Bond 10% -0.6% -1.2% 1.8% Equity Market Neutral -2.5% 0.0% -5% S&P 500 0% Macro 0% 5% 10% 0% 2% Event-Driven Distressed Securities Equity Hedge 4% 6% 8% 10% Risk (Standard Deviation) CONVERGENTWEALTH.COM | 14 Sep-15 -5.5% Return • A rough quarter for most hedge funds. Many segments, and especially funds with healthcare or energy exposure, lost ground in Q3. Sources: Bloomberg, Morningstar, HFR. Data as of 09/30/15. 12% 14% .
INVESTOR FLOWS AND LIQUIDITY • Put me in, coach. In absolute terms, there is still a fair amount of money on the sidelines, earning next to nothing and waiting to be invested. Will investors continue to “buy the dip” or has China scared them away? • Mutual fund outflows. Not surprisingly, investors have been pulling money out of stock mutual funds recently. Margin debt has also been declining off record levels. • Pricing in risks.
CDS spreads (the cost of insuring debt against default) in emerging markets, especially commodity-oriented regions, are widening. MUTUAL FUND CASH FLOWS MONEY MARKET FUND ASSETS 6,000 ICI Money Market Funds Assets ($ billions) (left scale) Money Market Funds as % of S&P 500 Market Cap (right scale) 5,000 4,000 60% 50% 40% 60,000 40,000 20,000 0 3,000 30% 2,000 20% 1,000 10% -20,000 0 Sep-05 Sep-07 Sep-09 Sep-11 Sep-13 0% Sep-15 -40,000 -60,000 -80,000 Jan-07 MARGIN DEBT ICI Bond Mutual Fund Flows ($ millions) Jan-09 Jan-11 Jan-13 Jan-15 SOVEREIGN CDS SPREADS 250 600,000 500,000 ICI Equity Mutual Fund Flows ($ millions) NYSE Margin Debt ($ millions) U.S. 5-Year Sovereign CDS Germany 5-Year Sovereign CDS 200 France 5-Year Sovereign CDS China 5-Year Sovereign CDS 400,000 150 300,000 100 200,000 50 100,000 0 Sep-05 CONVERGENTWEALTH.COM | 15 Sep-07 Sep-09 Sep-11 Sep-13 Sep-15 0 Sep-05 Sources: Bloomberg, Morningstar, Investment Company Institute. Data as of 09/30/15. Sep-07 Sep-09 Sep-11 Sep-13 Sep-15 .
CURRENCY AND DEBT • A pause in the dollar rally. Fed uncertainty as to the timing of an interest rate hike has kept the greenback in limbo. Still, the sharp gains seen over the past year have weighed on earnings of large U.S. multinational exporters. • Pushing on a string. Fed monetary policies have driven M1 to high levels, creating concerns about eventual inflation. However, the velocity of money is extremely low, illustrating a lack of pressure on pricing. • The borrowing headwind.
Low interest rates have eased the burden of existing personal debt. The Fed has an incentive to keep interest rates relatively low—if rates rise, so too will debt payments. 120 Dollar Index Spot (left scale) EUR-USD Exchange Rate (right scale) 110 1.80 1.60 100 90 1.00 70 0.80 2,600 18 17 U.S. M1 Money Supply (left scale) 16 15 Bloomberg Velocity of M1 Supply (right scale) 1.20 80 3,100 1.40 2,100 60 Sep-05 Sep-07 Sep-09 Sep-11 Sep-13 0.60 Sep-15 HOUSEHOLD DEBT 16,000 1,600 1,100 600 Jun-05 Jun-07 Jun-09 Jun-11 Jun-13 14 13 12 11 10 9 8 7 6 5 Jun-15 SAVINGS RATE AND HOUSEHOLD DEBT SERVICE RATIO 140% 16% U.S.
Financial Obligations Household Debt Service Ratio 130% 14% 120% U.S. Personal Saving as a % of Disposable Personal Income 12% 10,000 110% 10% 8,000 100% 8% 6,000 90% 6% 4,000 80% 4% 2,000 70% 2% 60% 0% Sep-90 Sep-93 Sep-96 Sep-99 Sep-02 Sep-05 Sep-08 Sep-11 Sep-14 14,000 12,000 0 Sep-90 CONVERGENTWEALTH.COM | 16 MONEY SUPPLY AND VELOCITY U.S. DOLLAR AND EURO U.S.
Household Debt Outstanding (left scale) Total Household Debt as a % of Personal Disposable Income (right scale) Sep-94 Sep-98 Sep-02 Sep-06 Sep-10 Sources: Bloomberg, Morningstar. Data as of 09/30/15. Sep-14 . DISCLOSURE The information contained in this summary is for informational purposes only and contains confidential and proprietary information that is subject to change without notice. Any opinions expressed are current only as of the time made and are subject to change without notice. This report may include estimates, projections or other forward looking statements, however, due to numerous factors, actual events may differ substantially from those presented. The graphs and tables making up this report have been based on unaudited, thirdparty data and performance information provided to us by one or more commercial databases.
While we believe this information to be reliable, Convergent bears no responsibility whatsoever for any errors or omissions. Additionally, please be aware that past performance is not a guide to the future performance of any manager or strategy, and that the performance results displayed herein may have been adversely or favorably impacted by events and economic conditions that will not prevail in the future. Therefore, caution must be used in inferring that these results are indicative of the future performance of any strategy.
Index results assume the re-investment of all dividends and interest. Moreover, the information provided is not intended to be, and should not be construed as, investment, legal or tax advice. Nothing contained herein should be construed as a recommendation or advice to purchase or sell any security, investment, or portfolio allocation.
Any investment advice provided by Convergent is client specific based on each clients' risk tolerance and investment objectives. Please consult your Convergent Advisor directly for investment advice related to your specific investment portfolio. Non-deposit investment products are not FDIC insured, are not deposits or other obligations of City National Bank, are not guaranteed by City National Bank and involve investment risks, including the possible loss of principal. CONVERGENTWEALTH.COM | 17 .


