


Description
QUARTERLY MARKET OVERVIEW
Q4 2015
12505 Park Potomac Avenue, Suite 400, Potomac, MD 20854 | T 301.770.6300 F 888.444.6347
CONVERGENTWEALTH.COM
. OVERVIEW OF GLOBAL MARKETS
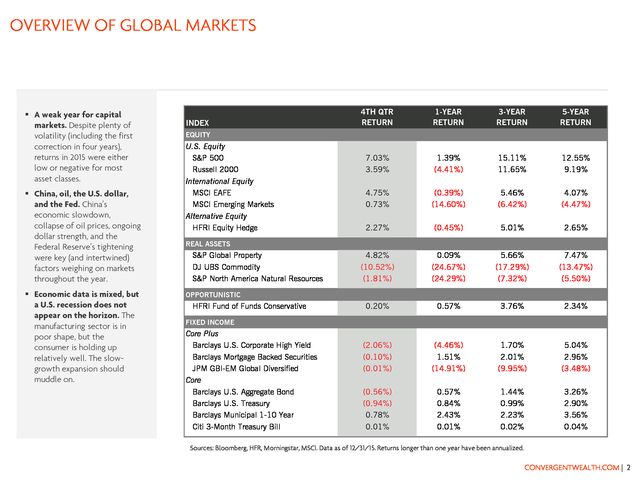
 A weak year for capital
markets. Despite plenty of
volatility (including the first
correction in four years),
returns in 2015 were either
low or negative for most
asset classes.
 China, oil, the U.S. dollar,
and the Fed. China’s
economic slowdown,
collapse of oil prices, ongoing
dollar strength, and the
Federal Reserve’s tightening
were key (and intertwined)
factors weighing on markets
throughout the year.
 Economic data is mixed, but
a U.S.
recession does not appear on the horizon. The manufacturing sector is in poor shape, but the consumer is holding up relatively well. The slowgrowth expansion should muddle on. INDEX 4TH QTR RETURN 1-YEAR RETURN 3-YEAR RETURN 5-YEAR RETURN 7.03% 3.59% 1.39% (4.41%) 15.11% 11.65% 12.55% 9.19% 4.75% 0.73% (0.39%) (14.60%) 5.46% (6.42%) 4.07% (4.47%) 2.27% (0.45%) 5.01% 2.65% 4.82% (10.52%) (1.81%) 0.09% (24.67%) (24.29%) 5.66% (17.29%) (7.32%) 7.47% (13.47%) (5.50%) 0.20% 0.57% 3.76% 2.34% (2.06%) (0.10%) (0.01%) (4.46%) 1.51% (14.91%) 1.70% 2.01% (9.95%) 5.04% 2.96% (3.48%) (0.56%) (0.94%) 0.78% 0.01% 0.57% 0.84% 2.43% 0.01% 1.44% 0.99% 2.23% 0.02% 3.26% 2.90% 3.56% 0.04% EQUITY U.S.
Equity S&P 500 Russell 2000 International Equity MSCI EAFE MSCI Emerging Markets Alternative Equity HFRI Equity Hedge REAL ASSETS S&P Global Property DJ UBS Commodity S&P North America Natural Resources OPPORTUNISTIC HFRI Fund of Funds Conservative FIXED INCOME Core Plus Barclays U.S. Corporate High Yield Barclays Mortgage Backed Securities JPM GBI-EM Global Diversified Core Barclays U.S. Aggregate Bond Barclays U.S.
Treasury Barclays Municipal 1-10 Year Citi 3-Month Treasury Bill Sources: Bloomberg, HFR, Morningstar, MSCI. Data as of 12/31/15. Returns longer than one year have been annualized. CONVERGENTWEALTH.COM | 2 .
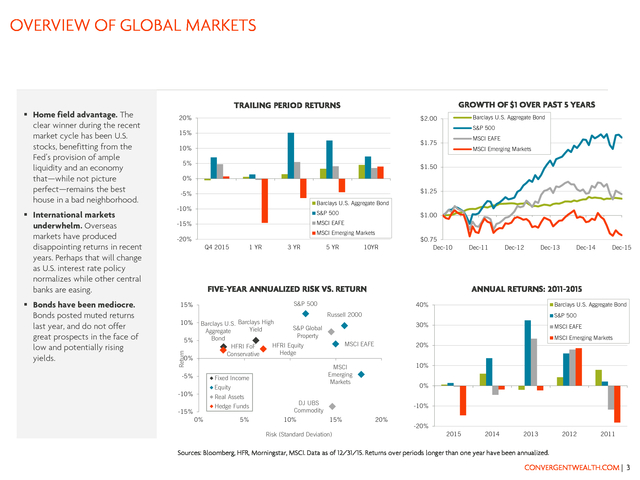
OVERVIEW OF GLOBAL MARKETS  International markets underwhelm. Overseas markets have produced disappointing returns in recent years. Perhaps that will change as U.S. interest rate policy normalizes while other central banks are easing.  Bonds have been mediocre. Bonds posted muted returns last year, and do not offer great prospects in the face of low and potentially rising yields. GROWTH OF $1 OVER PAST 5 YEARS TRAILING PERIOD RETURNS 20% Barclays U.S.
Aggregate Bond $2.00 S&P 500 15% MSCI EAFE $1.75 10% 5% MSCI Emerging Markets $1.50 0% $1.25 -5% Barclays U.S. Aggregate Bond -10% S&P 500 $1.00 MSCI EAFE -15% MSCI Emerging Markets -20% Q4 2015 1 YR 3 YR 5 YR 10YR $0.75 Dec-10 FIVE-YEAR ANNUALIZED RISK VS. RETURN 10% 5% 0% Barclays U.S.
Barclays High S&P Global Yield Aggregate Property Bond HFRI Equity HFRI FoF Hedge Conservative -5% Equity -10% Real Assets Hedge Funds -15% 0% 5% Dec-14 Dec-15 40% Barclays U.S. Aggregate Bond 30% MSCI EAFE S&P 500 MSCI Emerging Markets MSCI EAFE 20% 10% 0% DJ UBS Commodity 10% Dec-13 Dec-12 Russell 2000 MSCI Emerging Markets Fixed Income Dec-11 ANNUAL RETURNS: 2011-2015 S&P 500 15% Return  Home field advantage. The clear winner during the recent market cycle has been U.S. stocks, benefitting from the Fed’s provision of ample liquidity and an economy that—while not picture perfect—remains the best house in a bad neighborhood. -10% 15% Risk (Standard Deviation) 20% -20% 2015 2014 2013 2012 2011 Sources: Bloomberg, HFR, Morningstar, MSCI.
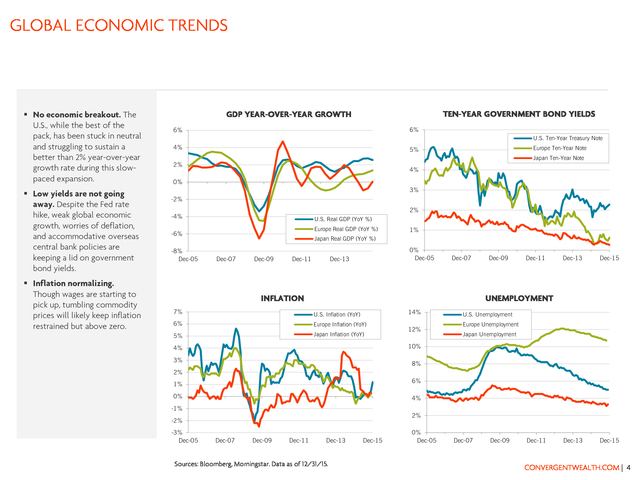
Data as of 12/31/15. Returns over periods longer than one year have been annualized. CONVERGENTWEALTH.COM | 3 . GLOBAL ECONOMIC TRENDS  No economic breakout. The U.S., while the best of the pack, has been stuck in neutral and struggling to sustain a better than 2% year-over-year growth rate during this slowpaced expansion.  Low yields are not going away. Despite the Fed rate hike, weak global economic growth, worries of deflation, and accommodative overseas central bank policies are keeping a lid on government bond yields.  Inflation normalizing. Though wages are starting to pick up, tumbling commodity prices will likely keep inflation restrained but above zero. TEN-YEAR GOVERNMENT BOND YIELDS GDP YEAR-OVER-YEAR GROWTH 6% 6% 4% 5% U.S. Ten-Year Treasury Note Europe Ten-Year Note Japan Ten-Year Note 2% 4% 0% 3% -2% 2% -4% U.S.
Real GDP (YoY %) Europe Real GDP (YoY %) -6% -8% Dec-05 1% Japan Real GDP (YoY %) Dec-07 Dec-09 Dec-11 0% Dec-05 Dec-13 Dec-07 INFLATION Dec-09 Dec-11 Dec-13 Dec-15 Dec-13 Dec-15 UNEMPLOYMENT 7% U.S. Inflation (YoY) 6% Europe Inflation (YoY) 5% Japan Inflation (YoY) 14% 12% U.S. Unemployment Europe Unemployment Japan Unemployment 10% 4% 3% 8% 2% 6% 1% 0% 4% -1% 2% -2% -3% Dec-05 Dec-07 Dec-09 Dec-11 Dec-13 Sources: Bloomberg, Morningstar.
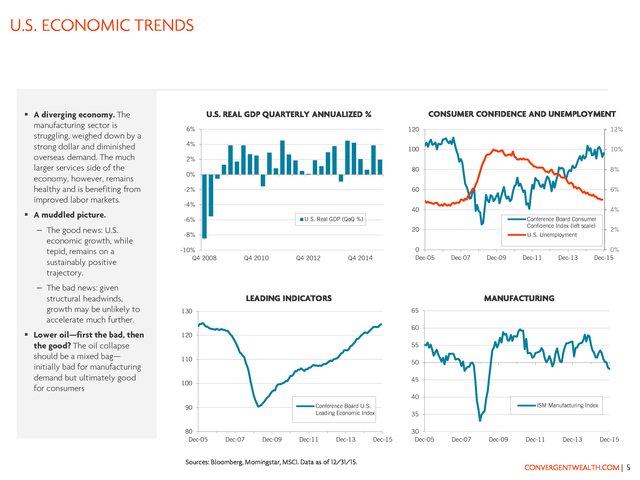
Data as of 12/31/15. Dec-15 0% Dec-05 Dec-07 Dec-09 Dec-11 CONVERGENTWEALTH.COM | 4 . U.S. ECONOMIC TRENDS  A diverging economy. The manufacturing sector is struggling, weighed down by a strong dollar and diminished overseas demand. The much larger services side of the economy, however, remains healthy and is benefiting from improved labor markets.  A muddled picture. – The good news: U.S. economic growth, while tepid, remains on a sustainably positive trajectory. – The bad news: given structural headwinds, growth may be unlikely to accelerate much further.  Lower oil—first the bad, then the good? The oil collapse should be a mixed bag— initially bad for manufacturing demand but ultimately good for consumers CONSUMER CONFIDENCE AND UNEMPLOYMENT U.S.
REAL GDP QUARTERLY ANNUALIZED % 6% 120 100 4% 12% 10% 2% 80 -2% -4% 6% 40 4% Conference Board Consumer Confidence Index (left scale) U.S. Real GDP (QoQ %) -6% 20 -8% -10% Q4 2008 8% 60 0% Q4 2010 Q4 2012 0 Dec-05 Q4 2014 U.S. Unemployment Dec-07 LEADING INDICATORS Dec-09 Dec-11 Dec-13 2% 0% Dec-15 MANUFACTURING 65 130 60 120 55 110 50 45 100 40 Conference Board U.S. Leading Economic Index 90 80 Dec-05 Dec-07 Dec-09 Dec-11 Dec-13 Sources: Bloomberg, Morningstar, MSCI.
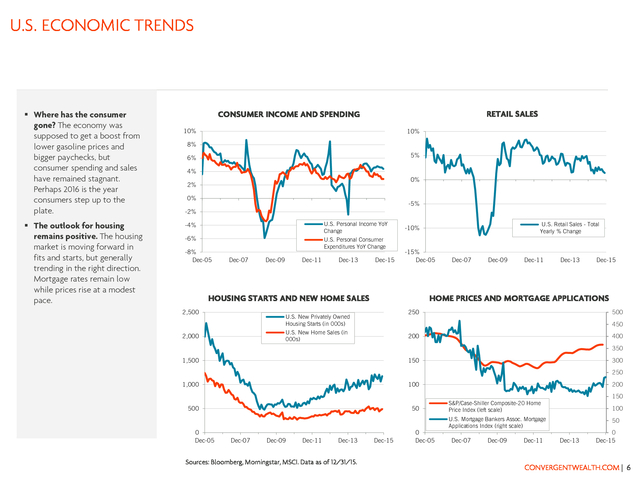
Data as of 12/31/15. Dec-15 ISM Manufacturing Index 35 30 Dec-05 Dec-07 Dec-09 Dec-11 Dec-13 Dec-15 CONVERGENTWEALTH.COM | 5 . U.S. ECONOMIC TRENDS  Where has the consumer gone? The economy was supposed to get a boost from lower gasoline prices and bigger paychecks, but consumer spending and sales have remained stagnant. Perhaps 2016 is the year consumers step up to the plate.  The outlook for housing remains positive. The housing market is moving forward in fits and starts, but generally trending in the right direction. Mortgage rates remain low while prices rise at a modest pace. RETAIL SALES CONSUMER INCOME AND SPENDING 10% 10% 8% 5% 6% 4% 0% 2% 0% -5% -2% -4% U.S. Personal Income YoY Change -6% U.S.
Personal Consumer Expenditures YoY Change -8% Dec-05 Dec-07 Dec-09 Dec-11 Dec-13 Dec-15 -15% Dec-05 HOUSING STARTS AND NEW HOME SALES 2,500 Dec-07 Dec-09 Dec-11 Dec-13 Dec-15 HOME PRICES AND MORTGAGE APPLICATIONS 250 U.S. New Privately Owned Housing Starts (in 000s) 500 450 U.S. New Home Sales (in 000s) 2,000 U.S.
Retail Sales - Total Yearly % Change -10% 200 400 350 1,500 150 1,000 100 500 50 300 250 0 Dec-05 Dec-07 Dec-09 Dec-11 Dec-13 Sources: Bloomberg, Morningstar, MSCI. Data as of 12/31/15. Dec-15 0 Dec-05 200 150 S&P/Case-Shiller Composite-20 Home Price Index (left scale) 100 U.S. Mortgage Bankers Assoc.
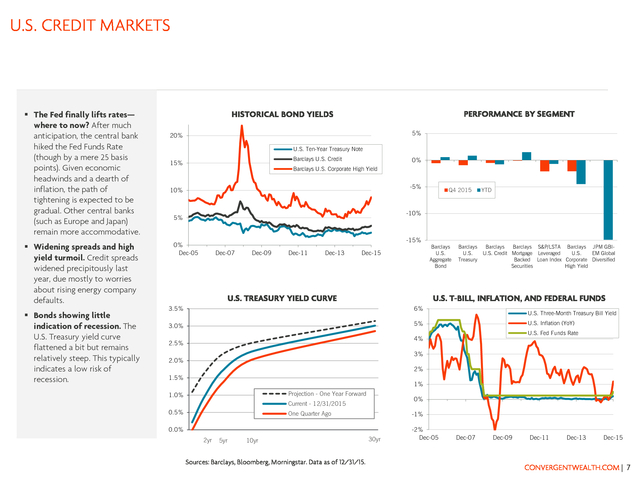
Mortgage Applications Index (right scale) Dec-07 Dec-09 Dec-11 50 Dec-13 0 Dec-15 CONVERGENTWEALTH.COM | 6 . U.S. CREDIT MARKETS  The Fed finally lifts rates— where to now? After much anticipation, the central bank hiked the Fed Funds Rate (though by a mere 25 basis points). Given economic headwinds and a dearth of inflation, the path of tightening is expected to be gradual. Other central banks (such as Europe and Japan) remain more accommodative.  Widening spreads and high yield turmoil.
Credit spreads widened precipitously last year, due mostly to worries about rising energy company defaults.  Bonds showing little indication of recession. The U.S. Treasury yield curve flattened a bit but remains relatively steep.
This typically indicates a low risk of recession. PERFORMANCE BY SEGMENT HISTORICAL BOND YIELDS 5% 20% U.S. Ten-Year Treasury Note Barclays U.S. Credit 15% 0% Barclays U.S.
Corporate High Yield -5% 10% Q4 2015 YTD -10% 5% -15% 0% Dec-05 Dec-07 Dec-09 Dec-11 Dec-13 Barclays U.S. Aggregate Bond Dec-15 U.S. TREASURY YIELD CURVE Barclays U.S. Treasury Barclays Barclays S&P/LSTA Barclays JPM GBIU.S. Credit Mortgage Leveraged U.S. EM Global Backed Loan Index Corporate Diversified Securities High Yield U.S.
T-BILL, INFLATION, AND FEDERAL FUNDS 3.5% 6% 3.0% 5% U.S. Three-Month Treasury Bill Yield U.S. Inflation (YoY) U.S.
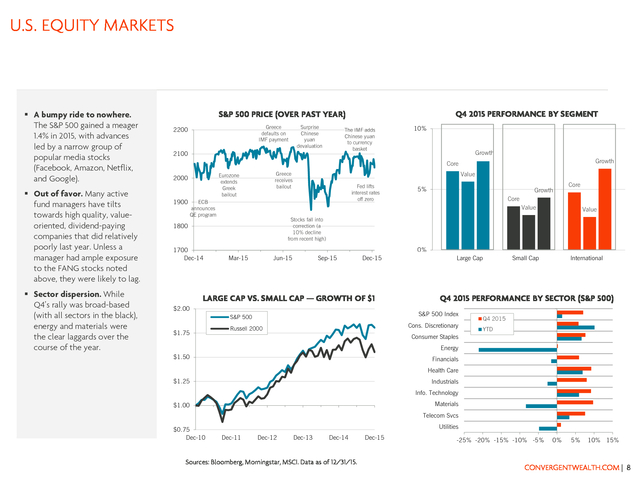
Fed Funds Rate 4% 2.5% 3% 2.0% 2% 1.5% 1% Projection - One Year Forward 1.0% 0% Current - 12/31/2015 0.5% One Quarter Ago -1% 0.0% 2yr 5yr 10yr Sources: Barclays, Bloomberg, Morningstar. Data as of 12/31/15. 30yr -2% Dec-05 Dec-07 Dec-09 Dec-11 Dec-13 Dec-15 CONVERGENTWEALTH.COM | 7 . U.S. EQUITY MARKETS  A bumpy ride to nowhere. The S&P 500 gained a meager 1.4% in 2015, with advances led by a narrow group of popular media stocks (Facebook, Amazon, Netflix, and Google).  Out of favor. Many active fund managers have tilts towards high quality, valueoriented, dividend-paying companies that did relatively poorly last year. Unless a manager had ample exposure to the FANG stocks noted above, they were likely to lag.  Sector dispersion.
While Q4’s rally was broad-based (with all sectors in the black), energy and materials were the clear laggards over the course of the year. Q4 2015 PERFORMANCE BY SEGMENT S&P 500 PRICE (OVER PAST YEAR) Greece defaults on IMF payment 2200 Surprise Chinese yuan devaluation The IMF adds Chinese yuan to currency basket 2100 10% Growth Growth Core 1900 ECB announces QE program Fed lifts interest rates off zero Growth Core Core Value Stocks fall into correction (a 10% decline from recent high) 0% Mar-15 Jun-15 Sep-15 Dec-15 LARGE CAP VS. SMALL CAP — GROWTH OF $1 $2.00 Large Cap Cons. Discretionary Russell 2000 Small Cap International Q4 2015 PERFORMANCE BY SECTOR (S&P 500) S&P 500 Index S&P 500 $1.75 5% Value 1800 1700 Dec-14 Value Greece receives bailout Eurozone extends Greek bailout 2000 Q4 2015 YTD Consumer Staples Energy $1.50 Financials Health Care $1.25 Industrials Info.
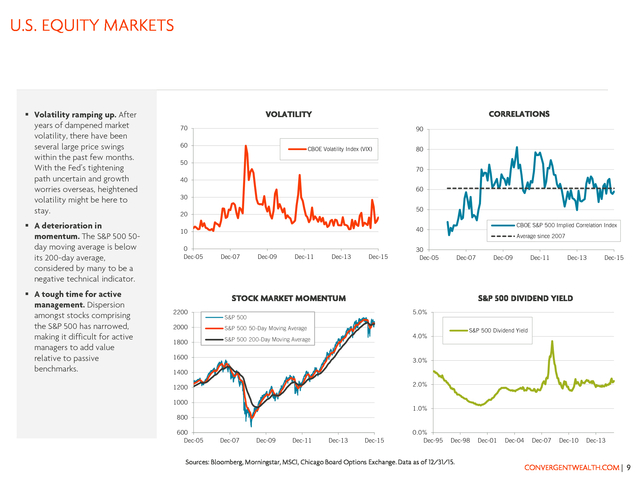
Technology Materials $1.00 Telecom Svcs $0.75 Dec-10 Utilities Dec-11 Dec-12 Dec-13 Dec-14 Sources: Bloomberg, Morningstar, MSCI. Data as of 12/31/15. Dec-15 -25% -20% -15% -10% -5% 0% 5% 10% 15% CONVERGENTWEALTH.COM | 8 . U.S. EQUITY MARKETS  Volatility ramping up. After years of dampened market volatility, there have been several large price swings within the past few months. With the Fed’s tightening path uncertain and growth worries overseas, heightened volatility might be here to stay.  A deterioration in momentum. The S&P 500 50day moving average is below its 200-day average, considered by many to be a negative technical indicator.  A tough time for active management.
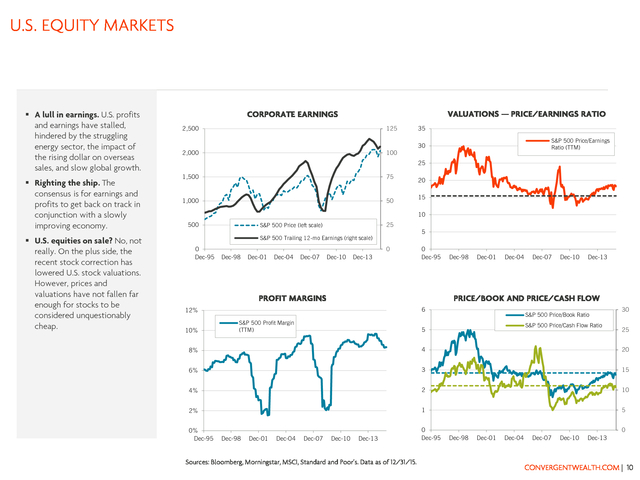
Dispersion amongst stocks comprising the S&P 500 has narrowed, making it difficult for active managers to add value relative to passive benchmarks. CORRELATIONS VOLATILITY 70 90 60 CBOE Volatility Index (VIX) 50 80 70 40 60 30 50 20 0 Dec-05 CBOE S&P 500 Implied Correlation Index 40 10 Dec-07 Dec-09 Dec-11 Dec-13 Dec-15 Average since 2007 30 Dec-05 Dec-07 STOCK MARKET MOMENTUM 2200 Dec-09 Dec-11 Dec-13 Dec-15 S&P 500 DIVIDEND YIELD 5.0% S&P 500 2000 S&P 500 50-Day Moving Average 1800 S&P 500 200-Day Moving Average S&P 500 Dividend Yield 4.0% 1600 3.0% 1400 2.0% 1200 1000 1.0% 800 600 Dec-05 Dec-07 Dec-09 Dec-11 Dec-13 Dec-15 0.0% Dec-95 Dec-98 Sources: Bloomberg, Morningstar, MSCI, Chicago Board Options Exchange. Data as of 12/31/15. Dec-01 Dec-04 Dec-07 Dec-10 Dec-13 CONVERGENTWEALTH.COM | 9 . U.S. EQUITY MARKETS  A lull in earnings. U.S. profits and earnings have stalled, hindered by the struggling energy sector, the impact of the rising dollar on overseas sales, and slow global growth.  Righting the ship.
The consensus is for earnings and profits to get back on track in conjunction with a slowly improving economy.  U.S. equities on sale? No, not really. On the plus side, the recent stock correction has lowered U.S.
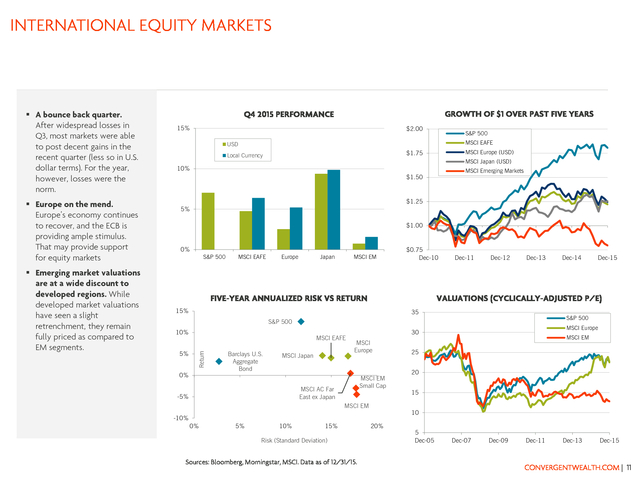
stock valuations. However, prices and valuations have not fallen far enough for stocks to be considered unquestionably cheap. VALUATIONS — PRICE/EARNINGS RATIO CORPORATE EARNINGS 2,500 125 2,000 100 35 S&P 500 Price/Earnings Ratio (TTM) 30 25 1,500 75 1,000 50 20 15 10 500 25 S&P 500 Price (left scale) S&P 500 Trailing 12-mo Earnings (right scale) 0 Dec-95 0 Dec-98 Dec-01 Dec-04 Dec-07 Dec-10 Dec-13 5 0 Dec-95 PROFIT MARGINS Dec-01 Dec-04 Dec-07 Dec-10 Dec-13 PRICE/BOOK AND PRICE/CASH FLOW 6 12% 10% Dec-98 S&P 500 Profit Margin (TTM) S&P 500 Price/Book Ratio S&P 500 Price/Cash Flow Ratio 5 30 25 8% 4 20 6% 3 15 4% 2 10 2% 1 5 0% Dec-95 Dec-98 Dec-01 Dec-04 Dec-07 Dec-10 Dec-13 Sources: Bloomberg, Morningstar, MSCI, Standard and Poor’s. Data as of 12/31/15. 0 Dec-95 0 Dec-98 Dec-01 Dec-04 Dec-07 Dec-10 Dec-13 CONVERGENTWEALTH.COM | 10 . INTERNATIONAL EQUITY MARKETS  Europe on the mend. Europe’s economy continues to recover, and the ECB is providing ample stimulus. That may provide support for equity markets  Emerging market valuations are at a wide discount to developed regions. While developed market valuations have seen a slight retrenchment, they remain fully priced as compared to EM segments. GROWTH OF $1 OVER PAST FIVE YEARS Q4 2015 PERFORMANCE 15% $2.00 S&P 500 MSCI EAFE USD MSCI Europe (USD) $1.75 Local Currency MSCI Japan (USD) 10% MSCI Emerging Markets $1.50 $1.25 5% $1.00 0% S&P 500 MSCI EAFE Europe Japan MSCI EM $0.75 Dec-10 FIVE-YEAR ANNUALIZED RISK VS RETURN Dec-11 Dec-12 Dec-13 35 5% MSCI EAFE 0% Barclays U.S. Aggregate Bond MSCI Japan MSCI Europe MSCI EM Small Cap MSCI EM 5% 10% 15% Risk (Standard Deviation) Sources: Bloomberg, Morningstar, MSCI. Data as of 12/31/15. MSCI EM 25 20 15 10 -10% 0% MSCI Europe 30 MSCI AC Far East ex Japan -5% Dec-15 S&P 500 S&P 500 10% Dec-14 VALUATIONS (CYCLICALLY-ADJUSTED P/E) 15% Return  A bounce back quarter. After widespread losses in Q3, most markets were able to post decent gains in the recent quarter (less so in U.S. dollar terms). For the year, however, losses were the norm. 20% 5 Dec-05 Dec-07 Dec-09 Dec-11 Dec-13 Dec-15 CONVERGENTWEALTH.COM | 11 .
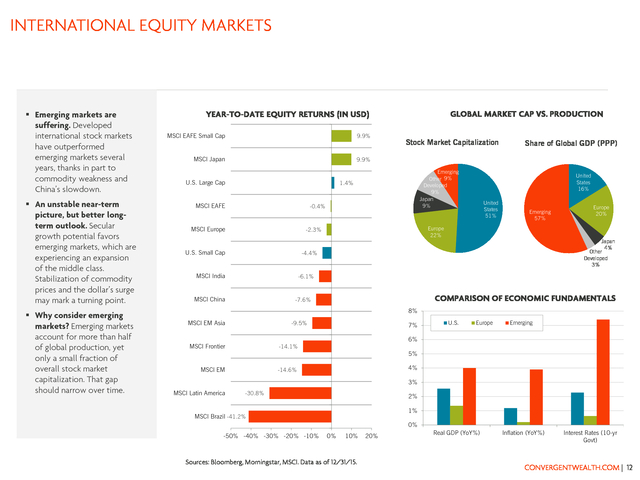
INTERNATIONAL EQUITY MARKETS  Emerging markets are suffering. Developed international stock markets have outperformed emerging markets several years, thanks in part to commodity weakness and China’s slowdown.  An unstable near-term picture, but better longterm outlook. Secular growth potential favors emerging markets, which are experiencing an expansion of the middle class. Stabilization of commodity prices and the dollar’s surge may mark a turning point.  Why consider emerging markets? Emerging markets account for more than half of global production, yet only a small fraction of overall stock market capitalization. That gap should narrow over time. GLOBAL MARKET CAP VS.
PRODUCTION YEAR-TO-DATE EQUITY RETURNS (IN USD) MSCI EAFE Small Cap 9.9% MSCI Japan 9.9% U.S. Large Cap Stock Market Capitalization Emerging Other 9% Developed 9% Japan 9% 1.4% MSCI EAFE -0.4% MSCI Europe United States 16% United States 51% Emerging 57% Europe 22% -2.3% U.S. Small Cap Share of Global GDP (PPP) Japan 4% Other Developed 3% -4.4% MSCI India Europe 20% -6.1% MSCI China COMPARISON OF ECONOMIC FUNDAMENTALS -7.6% 8% MSCI EM Asia -9.5% MSCI Frontier 7% U.S. Europe Emerging 6% -14.1% 5% MSCI EM 4% -14.6% 3% MSCI Latin America -30.8% 2% 1% MSCI Brazil -41.2% 0% -50% -40% -30% -20% -10% 0% 10% Sources: Bloomberg, Morningstar, MSCI.
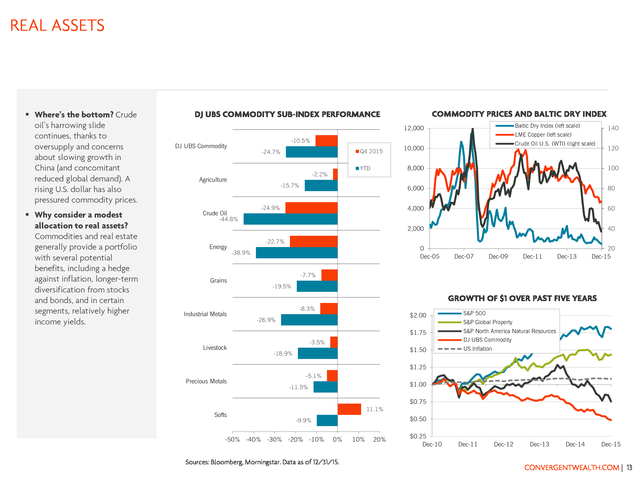
Data as of 12/31/15. 20% Real GDP (YoY%) Inflation (YoY%) Interest Rates (10-yr Govt) CONVERGENTWEALTH.COM | 12 . REAL ASSETS  Where’s the bottom? Crude oil’s harrowing slide continues, thanks to oversupply and concerns about slowing growth in China (and concomitant reduced global demand). A rising U.S. dollar has also pressured commodity prices.  Why consider a modest allocation to real assets? Commodities and real estate generally provide a portfolio with several potential benefits, including a hedge against inflation, longer-term diversification from stocks and bonds, and in certain segments, relatively higher income yields. COMMODITY PRICES AND BALTIC DRY INDEX DJ UBS COMMODITY SUB-INDEX PERFORMANCE Baltic Dry Index (left scale) 12,000 -10.5% DJ UBS Commodity Q4 2015 -24.7% 140 LME Copper (left scale) Crude Oil U.S. (WTI) (right scale) 10,000 120 6,000 -24.9% Crude Oil 80 4,000 -15.7% 100 60 2,000 Agriculture 8,000 YTD -2.2% 40 -44.8% Energy Grains -22.7% 0 Dec-05 -38.9% Dec-07 Dec-09 Dec-11 Dec-13 20 Dec-15 -7.7% -19.5% GROWTH OF $1 OVER PAST FIVE YEARS -8.3% Livestock $2.00 -26.9% S&P 500 $1.75 Industrial Metals S&P North America Natural Resources S&P Global Property DJ UBS Commodity -3.5% $1.50 -18.9% US Inflation $1.25 Precious Metals -5.1% $1.00 -11.5% $0.75 Softs 11.1% $0.50 -9.9% -50% -40% -30% -20% -10% 0% Sources: Bloomberg, Morningstar.
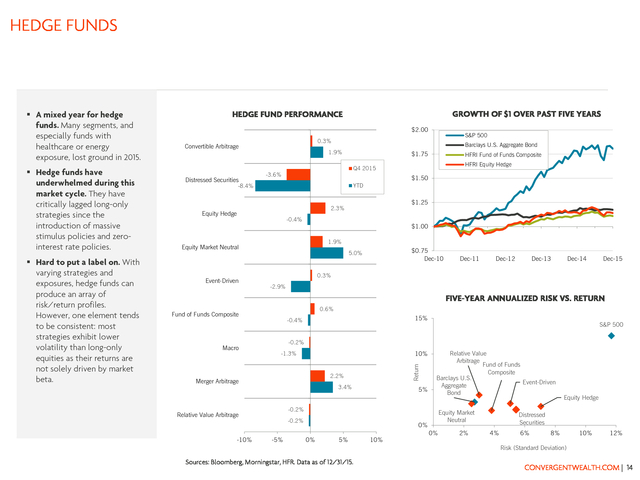
Data as of 12/31/15. 10% 20% $0.25 Dec-10 Dec-11 Dec-12 Dec-13 Dec-14 Dec-15 CONVERGENTWEALTH.COM | 13 . HEDGE FUNDS  Hedge funds have underwhelmed during this market cycle. They have critically lagged long-only strategies since the introduction of massive stimulus policies and zerointerest rate policies.  Hard to put a label on. With varying strategies and exposures, hedge funds can produce an array of risk/return profiles. However, one element tends to be consistent: most strategies exhibit lower volatility than long-only equities as their returns are not solely driven by market beta. GROWTH OF $1 OVER PAST FIVE YEARS HEDGE FUND PERFORMANCE $2.00 Convertible Arbitrage Distressed Securities Barclays U.S. Aggregate Bond 1.9% $1.75 HFRI Fund of Funds Composite HFRI Equity Hedge Q4 2015 -3.6% $1.50 YTD -8.4% $1.25 2.3% Equity Hedge -0.4% $1.00 1.9% Equity Market Neutral Event-Driven S&P 500 0.3% $0.75 Dec-10 5.0% Dec-11 Dec-12 Dec-13 Dec-14 Dec-15 0.3% -2.9% FIVE-YEAR ANNUALIZED RISK VS.
RETURN 0.6% Fund of Funds Composite Macro 15% -0.4% 10% -1.3% 2.2% Merger Arbitrage 3.4% 5% Relative Value Arbitrage Fund of Funds Composite Barclays U.S. Event-Driven Aggregate Bond -0.2% Relative Value Arbitrage -10% S&P 500 -0.2% Return  A mixed year for hedge funds. Many segments, and especially funds with healthcare or energy exposure, lost ground in 2015. -0.2% -5% Equity Market Neutral 0% 0% 5% 10% 0% 2% Equity Hedge Distressed Securities 4% 6% 8% 10% 12% Risk (Standard Deviation) Sources: Bloomberg, Morningstar, HFR. Data as of 12/31/15. CONVERGENTWEALTH.COM | 14 .
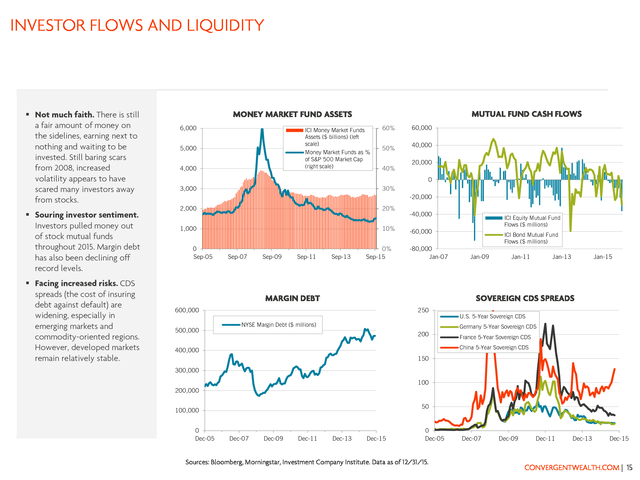
INVESTOR FLOWS AND LIQUIDITY  Not much faith. There is still a fair amount of money on the sidelines, earning next to nothing and waiting to be invested. Still baring scars from 2008, increased volatility appears to have scared many investors away from stocks.  Souring investor sentiment. Investors pulled money out of stock mutual funds throughout 2015. Margin debt has also been declining off record levels.  Facing increased risks.
CDS spreads (the cost of insuring debt against default) are widening, especially in emerging markets and commodity-oriented regions. However, developed markets remain relatively stable. MUTUAL FUND CASH FLOWS MONEY MARKET FUND ASSETS 6,000 ICI Money Market Funds Assets ($ billions) (left scale) Money Market Funds as % of S&P 500 Market Cap (right scale) 5,000 4,000 60% 50% 40% 60,000 40,000 20,000 0 3,000 30% -20,000 2,000 20% 1,000 10% 0 Sep-05 Sep-07 Sep-09 Sep-11 Sep-13 0% Sep-15 -40,000 -60,000 -80,000 Jan-07 MARGIN DEBT ICI Bond Mutual Fund Flows ($ millions) Jan-09 Jan-11 Jan-13 Jan-15 SOVEREIGN CDS SPREADS 600,000 500,000 ICI Equity Mutual Fund Flows ($ millions) 250 NYSE Margin Debt ($ millions) U.S. 5-Year Sovereign CDS Germany 5-Year Sovereign CDS 200 France 5-Year Sovereign CDS China 5-Year Sovereign CDS 400,000 150 300,000 100 200,000 50 100,000 0 Dec-05 Dec-07 Dec-09 Dec-11 Dec-13 Dec-15 0 Dec-05 Sources: Bloomberg, Morningstar, Investment Company Institute. Data as of 12/31/15. Dec-07 Dec-09 Dec-11 Dec-13 Dec-15 CONVERGENTWEALTH.COM | 15 .
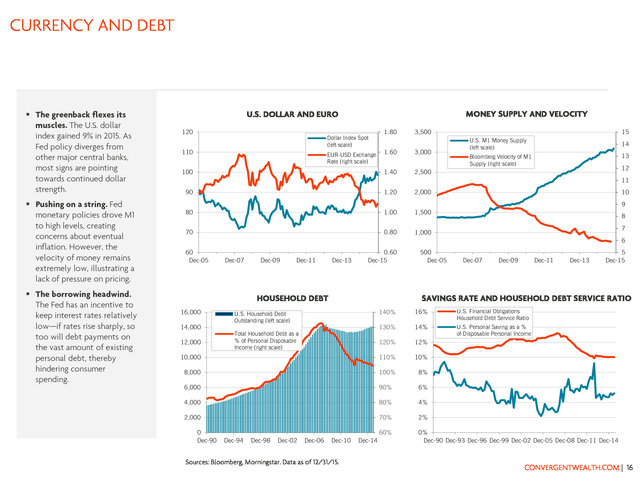
CURRENCY AND DEBT  The greenback flexes its muscles. The U.S. dollar index gained 9% in 2015. As Fed policy diverges from other major central banks, most signs are pointing towards continued dollar strength.  Pushing on a string.
Fed monetary policies drove M1 to high levels, creating concerns about eventual inflation. However, the velocity of money remains extremely low, illustrating a lack of pressure on pricing.  The borrowing headwind. The Fed has an incentive to keep interest rates relatively low—if rates rise sharply, so too will debt payments on the vast amount of existing personal debt, thereby hindering consumer spending. MONEY SUPPLY AND VELOCITY U.S. DOLLAR AND EURO 120 Dollar Index Spot (left scale) 110 1.80 3,500 1.60 3,000 100 1.40 1.20 2,000 80 1.00 1,500 70 0.80 14 2,500 90 15 U.S.
M1 Money Supply (left scale) 1,000 EUR-USD Exchange Rate (right scale) 13 Bloomberg Velocity of M1 Supply (right scale) 12 11 10 9 8 7 6 60 Dec-05 Dec-07 Dec-09 Dec-11 Dec-13 0.60 Dec-15 HOUSEHOLD DEBT 500 Dec-05 Dec-07 Dec-09 Dec-11 Dec-13 5 Dec-15 SAVINGS RATE AND HOUSEHOLD DEBT SERVICE RATIO 140% 16% U.S. Financial Obligations Household Debt Service Ratio 130% 14% U.S. Personal Saving as a % of Disposable Personal Income 120% 12% 10,000 110% 10% 8,000 100% 8% 6,000 90% 6% 4,000 80% 4% 2,000 70% 2% 60% 0% Dec-90 Dec-93 Dec-96 Dec-99 Dec-02 Dec-05 Dec-08 Dec-11 Dec-14 16,000 14,000 12,000 0 Dec-90 U.S.
Household Debt Outstanding (left scale) Total Household Debt as a % of Personal Disposable Income (right scale) Dec-94 Dec-98 Dec-02 Dec-06 Dec-10 Sources: Bloomberg, Morningstar. Data as of 12/31/15. Dec-14 CONVERGENTWEALTH.COM | 16 . DISCLOSURE The information contained in this summary is for informational purposes only and contains confidential and proprietary information that is subject to change without notice. Any opinions expressed are current only as of the time made and are subject to change without notice. This report may include estimates, projections or other forward looking statements, however, due to numerous factors, actual events may differ substantially from those presented. The graphs and tables making up this report have been based on unaudited, third-party data and performance information provided to us by one or more commercial databases.
While we believe this information to be reliable, Convergent bears no responsibility whatsoever for any errors or omissions. Additionally, please be aware that past performance is not a guide to the future performance of any manager or strategy, and that the performance results displayed herein may have been adversely or favorably impacted by events and economic conditions that will not prevail in the future. Therefore, caution must be used in inferring that these results are indicative of the future performance of any strategy.
Index results assume the re-investment of all dividends and interest. Moreover, the information provided is not intended to be, and should not be construed as, investment, legal or tax advice. Nothing contained herein should be construed as a recommendation or advice to purchase or sell any security, investment, or portfolio allocation.
Any investment advice provided by Convergent is client specific based on each clients' risk tolerance and investment objectives. Please consult your Convergent Advisor directly for investment advice related to your specific investment portfolio. Non-deposit investment products are not FDIC insured, are not deposits or other obligations of City National Bank, are not guaranteed by City National Bank and involve investment risks, including the possible loss of principal. CONVERGENTWEALTH.COM | 17 .
recession does not appear on the horizon. The manufacturing sector is in poor shape, but the consumer is holding up relatively well. The slowgrowth expansion should muddle on. INDEX 4TH QTR RETURN 1-YEAR RETURN 3-YEAR RETURN 5-YEAR RETURN 7.03% 3.59% 1.39% (4.41%) 15.11% 11.65% 12.55% 9.19% 4.75% 0.73% (0.39%) (14.60%) 5.46% (6.42%) 4.07% (4.47%) 2.27% (0.45%) 5.01% 2.65% 4.82% (10.52%) (1.81%) 0.09% (24.67%) (24.29%) 5.66% (17.29%) (7.32%) 7.47% (13.47%) (5.50%) 0.20% 0.57% 3.76% 2.34% (2.06%) (0.10%) (0.01%) (4.46%) 1.51% (14.91%) 1.70% 2.01% (9.95%) 5.04% 2.96% (3.48%) (0.56%) (0.94%) 0.78% 0.01% 0.57% 0.84% 2.43% 0.01% 1.44% 0.99% 2.23% 0.02% 3.26% 2.90% 3.56% 0.04% EQUITY U.S.
Equity S&P 500 Russell 2000 International Equity MSCI EAFE MSCI Emerging Markets Alternative Equity HFRI Equity Hedge REAL ASSETS S&P Global Property DJ UBS Commodity S&P North America Natural Resources OPPORTUNISTIC HFRI Fund of Funds Conservative FIXED INCOME Core Plus Barclays U.S. Corporate High Yield Barclays Mortgage Backed Securities JPM GBI-EM Global Diversified Core Barclays U.S. Aggregate Bond Barclays U.S.
Treasury Barclays Municipal 1-10 Year Citi 3-Month Treasury Bill Sources: Bloomberg, HFR, Morningstar, MSCI. Data as of 12/31/15. Returns longer than one year have been annualized. CONVERGENTWEALTH.COM | 2 .
OVERVIEW OF GLOBAL MARKETS  International markets underwhelm. Overseas markets have produced disappointing returns in recent years. Perhaps that will change as U.S. interest rate policy normalizes while other central banks are easing.  Bonds have been mediocre. Bonds posted muted returns last year, and do not offer great prospects in the face of low and potentially rising yields. GROWTH OF $1 OVER PAST 5 YEARS TRAILING PERIOD RETURNS 20% Barclays U.S.
Aggregate Bond $2.00 S&P 500 15% MSCI EAFE $1.75 10% 5% MSCI Emerging Markets $1.50 0% $1.25 -5% Barclays U.S. Aggregate Bond -10% S&P 500 $1.00 MSCI EAFE -15% MSCI Emerging Markets -20% Q4 2015 1 YR 3 YR 5 YR 10YR $0.75 Dec-10 FIVE-YEAR ANNUALIZED RISK VS. RETURN 10% 5% 0% Barclays U.S.
Barclays High S&P Global Yield Aggregate Property Bond HFRI Equity HFRI FoF Hedge Conservative -5% Equity -10% Real Assets Hedge Funds -15% 0% 5% Dec-14 Dec-15 40% Barclays U.S. Aggregate Bond 30% MSCI EAFE S&P 500 MSCI Emerging Markets MSCI EAFE 20% 10% 0% DJ UBS Commodity 10% Dec-13 Dec-12 Russell 2000 MSCI Emerging Markets Fixed Income Dec-11 ANNUAL RETURNS: 2011-2015 S&P 500 15% Return  Home field advantage. The clear winner during the recent market cycle has been U.S. stocks, benefitting from the Fed’s provision of ample liquidity and an economy that—while not picture perfect—remains the best house in a bad neighborhood. -10% 15% Risk (Standard Deviation) 20% -20% 2015 2014 2013 2012 2011 Sources: Bloomberg, HFR, Morningstar, MSCI.
Data as of 12/31/15. Returns over periods longer than one year have been annualized. CONVERGENTWEALTH.COM | 3 . GLOBAL ECONOMIC TRENDS  No economic breakout. The U.S., while the best of the pack, has been stuck in neutral and struggling to sustain a better than 2% year-over-year growth rate during this slowpaced expansion.  Low yields are not going away. Despite the Fed rate hike, weak global economic growth, worries of deflation, and accommodative overseas central bank policies are keeping a lid on government bond yields.  Inflation normalizing. Though wages are starting to pick up, tumbling commodity prices will likely keep inflation restrained but above zero. TEN-YEAR GOVERNMENT BOND YIELDS GDP YEAR-OVER-YEAR GROWTH 6% 6% 4% 5% U.S. Ten-Year Treasury Note Europe Ten-Year Note Japan Ten-Year Note 2% 4% 0% 3% -2% 2% -4% U.S.
Real GDP (YoY %) Europe Real GDP (YoY %) -6% -8% Dec-05 1% Japan Real GDP (YoY %) Dec-07 Dec-09 Dec-11 0% Dec-05 Dec-13 Dec-07 INFLATION Dec-09 Dec-11 Dec-13 Dec-15 Dec-13 Dec-15 UNEMPLOYMENT 7% U.S. Inflation (YoY) 6% Europe Inflation (YoY) 5% Japan Inflation (YoY) 14% 12% U.S. Unemployment Europe Unemployment Japan Unemployment 10% 4% 3% 8% 2% 6% 1% 0% 4% -1% 2% -2% -3% Dec-05 Dec-07 Dec-09 Dec-11 Dec-13 Sources: Bloomberg, Morningstar.
Data as of 12/31/15. Dec-15 0% Dec-05 Dec-07 Dec-09 Dec-11 CONVERGENTWEALTH.COM | 4 . U.S. ECONOMIC TRENDS  A diverging economy. The manufacturing sector is struggling, weighed down by a strong dollar and diminished overseas demand. The much larger services side of the economy, however, remains healthy and is benefiting from improved labor markets.  A muddled picture. – The good news: U.S. economic growth, while tepid, remains on a sustainably positive trajectory. – The bad news: given structural headwinds, growth may be unlikely to accelerate much further.  Lower oil—first the bad, then the good? The oil collapse should be a mixed bag— initially bad for manufacturing demand but ultimately good for consumers CONSUMER CONFIDENCE AND UNEMPLOYMENT U.S.
REAL GDP QUARTERLY ANNUALIZED % 6% 120 100 4% 12% 10% 2% 80 -2% -4% 6% 40 4% Conference Board Consumer Confidence Index (left scale) U.S. Real GDP (QoQ %) -6% 20 -8% -10% Q4 2008 8% 60 0% Q4 2010 Q4 2012 0 Dec-05 Q4 2014 U.S. Unemployment Dec-07 LEADING INDICATORS Dec-09 Dec-11 Dec-13 2% 0% Dec-15 MANUFACTURING 65 130 60 120 55 110 50 45 100 40 Conference Board U.S. Leading Economic Index 90 80 Dec-05 Dec-07 Dec-09 Dec-11 Dec-13 Sources: Bloomberg, Morningstar, MSCI.
Data as of 12/31/15. Dec-15 ISM Manufacturing Index 35 30 Dec-05 Dec-07 Dec-09 Dec-11 Dec-13 Dec-15 CONVERGENTWEALTH.COM | 5 . U.S. ECONOMIC TRENDS  Where has the consumer gone? The economy was supposed to get a boost from lower gasoline prices and bigger paychecks, but consumer spending and sales have remained stagnant. Perhaps 2016 is the year consumers step up to the plate.  The outlook for housing remains positive. The housing market is moving forward in fits and starts, but generally trending in the right direction. Mortgage rates remain low while prices rise at a modest pace. RETAIL SALES CONSUMER INCOME AND SPENDING 10% 10% 8% 5% 6% 4% 0% 2% 0% -5% -2% -4% U.S. Personal Income YoY Change -6% U.S.
Personal Consumer Expenditures YoY Change -8% Dec-05 Dec-07 Dec-09 Dec-11 Dec-13 Dec-15 -15% Dec-05 HOUSING STARTS AND NEW HOME SALES 2,500 Dec-07 Dec-09 Dec-11 Dec-13 Dec-15 HOME PRICES AND MORTGAGE APPLICATIONS 250 U.S. New Privately Owned Housing Starts (in 000s) 500 450 U.S. New Home Sales (in 000s) 2,000 U.S.
Retail Sales - Total Yearly % Change -10% 200 400 350 1,500 150 1,000 100 500 50 300 250 0 Dec-05 Dec-07 Dec-09 Dec-11 Dec-13 Sources: Bloomberg, Morningstar, MSCI. Data as of 12/31/15. Dec-15 0 Dec-05 200 150 S&P/Case-Shiller Composite-20 Home Price Index (left scale) 100 U.S. Mortgage Bankers Assoc.
Mortgage Applications Index (right scale) Dec-07 Dec-09 Dec-11 50 Dec-13 0 Dec-15 CONVERGENTWEALTH.COM | 6 . U.S. CREDIT MARKETS  The Fed finally lifts rates— where to now? After much anticipation, the central bank hiked the Fed Funds Rate (though by a mere 25 basis points). Given economic headwinds and a dearth of inflation, the path of tightening is expected to be gradual. Other central banks (such as Europe and Japan) remain more accommodative.  Widening spreads and high yield turmoil.
Credit spreads widened precipitously last year, due mostly to worries about rising energy company defaults.  Bonds showing little indication of recession. The U.S. Treasury yield curve flattened a bit but remains relatively steep.
This typically indicates a low risk of recession. PERFORMANCE BY SEGMENT HISTORICAL BOND YIELDS 5% 20% U.S. Ten-Year Treasury Note Barclays U.S. Credit 15% 0% Barclays U.S.
Corporate High Yield -5% 10% Q4 2015 YTD -10% 5% -15% 0% Dec-05 Dec-07 Dec-09 Dec-11 Dec-13 Barclays U.S. Aggregate Bond Dec-15 U.S. TREASURY YIELD CURVE Barclays U.S. Treasury Barclays Barclays S&P/LSTA Barclays JPM GBIU.S. Credit Mortgage Leveraged U.S. EM Global Backed Loan Index Corporate Diversified Securities High Yield U.S.
T-BILL, INFLATION, AND FEDERAL FUNDS 3.5% 6% 3.0% 5% U.S. Three-Month Treasury Bill Yield U.S. Inflation (YoY) U.S.
Fed Funds Rate 4% 2.5% 3% 2.0% 2% 1.5% 1% Projection - One Year Forward 1.0% 0% Current - 12/31/2015 0.5% One Quarter Ago -1% 0.0% 2yr 5yr 10yr Sources: Barclays, Bloomberg, Morningstar. Data as of 12/31/15. 30yr -2% Dec-05 Dec-07 Dec-09 Dec-11 Dec-13 Dec-15 CONVERGENTWEALTH.COM | 7 . U.S. EQUITY MARKETS  A bumpy ride to nowhere. The S&P 500 gained a meager 1.4% in 2015, with advances led by a narrow group of popular media stocks (Facebook, Amazon, Netflix, and Google).  Out of favor. Many active fund managers have tilts towards high quality, valueoriented, dividend-paying companies that did relatively poorly last year. Unless a manager had ample exposure to the FANG stocks noted above, they were likely to lag.  Sector dispersion.
While Q4’s rally was broad-based (with all sectors in the black), energy and materials were the clear laggards over the course of the year. Q4 2015 PERFORMANCE BY SEGMENT S&P 500 PRICE (OVER PAST YEAR) Greece defaults on IMF payment 2200 Surprise Chinese yuan devaluation The IMF adds Chinese yuan to currency basket 2100 10% Growth Growth Core 1900 ECB announces QE program Fed lifts interest rates off zero Growth Core Core Value Stocks fall into correction (a 10% decline from recent high) 0% Mar-15 Jun-15 Sep-15 Dec-15 LARGE CAP VS. SMALL CAP — GROWTH OF $1 $2.00 Large Cap Cons. Discretionary Russell 2000 Small Cap International Q4 2015 PERFORMANCE BY SECTOR (S&P 500) S&P 500 Index S&P 500 $1.75 5% Value 1800 1700 Dec-14 Value Greece receives bailout Eurozone extends Greek bailout 2000 Q4 2015 YTD Consumer Staples Energy $1.50 Financials Health Care $1.25 Industrials Info.
Technology Materials $1.00 Telecom Svcs $0.75 Dec-10 Utilities Dec-11 Dec-12 Dec-13 Dec-14 Sources: Bloomberg, Morningstar, MSCI. Data as of 12/31/15. Dec-15 -25% -20% -15% -10% -5% 0% 5% 10% 15% CONVERGENTWEALTH.COM | 8 . U.S. EQUITY MARKETS  Volatility ramping up. After years of dampened market volatility, there have been several large price swings within the past few months. With the Fed’s tightening path uncertain and growth worries overseas, heightened volatility might be here to stay.  A deterioration in momentum. The S&P 500 50day moving average is below its 200-day average, considered by many to be a negative technical indicator.  A tough time for active management.
Dispersion amongst stocks comprising the S&P 500 has narrowed, making it difficult for active managers to add value relative to passive benchmarks. CORRELATIONS VOLATILITY 70 90 60 CBOE Volatility Index (VIX) 50 80 70 40 60 30 50 20 0 Dec-05 CBOE S&P 500 Implied Correlation Index 40 10 Dec-07 Dec-09 Dec-11 Dec-13 Dec-15 Average since 2007 30 Dec-05 Dec-07 STOCK MARKET MOMENTUM 2200 Dec-09 Dec-11 Dec-13 Dec-15 S&P 500 DIVIDEND YIELD 5.0% S&P 500 2000 S&P 500 50-Day Moving Average 1800 S&P 500 200-Day Moving Average S&P 500 Dividend Yield 4.0% 1600 3.0% 1400 2.0% 1200 1000 1.0% 800 600 Dec-05 Dec-07 Dec-09 Dec-11 Dec-13 Dec-15 0.0% Dec-95 Dec-98 Sources: Bloomberg, Morningstar, MSCI, Chicago Board Options Exchange. Data as of 12/31/15. Dec-01 Dec-04 Dec-07 Dec-10 Dec-13 CONVERGENTWEALTH.COM | 9 . U.S. EQUITY MARKETS  A lull in earnings. U.S. profits and earnings have stalled, hindered by the struggling energy sector, the impact of the rising dollar on overseas sales, and slow global growth.  Righting the ship.
The consensus is for earnings and profits to get back on track in conjunction with a slowly improving economy.  U.S. equities on sale? No, not really. On the plus side, the recent stock correction has lowered U.S.
stock valuations. However, prices and valuations have not fallen far enough for stocks to be considered unquestionably cheap. VALUATIONS — PRICE/EARNINGS RATIO CORPORATE EARNINGS 2,500 125 2,000 100 35 S&P 500 Price/Earnings Ratio (TTM) 30 25 1,500 75 1,000 50 20 15 10 500 25 S&P 500 Price (left scale) S&P 500 Trailing 12-mo Earnings (right scale) 0 Dec-95 0 Dec-98 Dec-01 Dec-04 Dec-07 Dec-10 Dec-13 5 0 Dec-95 PROFIT MARGINS Dec-01 Dec-04 Dec-07 Dec-10 Dec-13 PRICE/BOOK AND PRICE/CASH FLOW 6 12% 10% Dec-98 S&P 500 Profit Margin (TTM) S&P 500 Price/Book Ratio S&P 500 Price/Cash Flow Ratio 5 30 25 8% 4 20 6% 3 15 4% 2 10 2% 1 5 0% Dec-95 Dec-98 Dec-01 Dec-04 Dec-07 Dec-10 Dec-13 Sources: Bloomberg, Morningstar, MSCI, Standard and Poor’s. Data as of 12/31/15. 0 Dec-95 0 Dec-98 Dec-01 Dec-04 Dec-07 Dec-10 Dec-13 CONVERGENTWEALTH.COM | 10 . INTERNATIONAL EQUITY MARKETS  Europe on the mend. Europe’s economy continues to recover, and the ECB is providing ample stimulus. That may provide support for equity markets  Emerging market valuations are at a wide discount to developed regions. While developed market valuations have seen a slight retrenchment, they remain fully priced as compared to EM segments. GROWTH OF $1 OVER PAST FIVE YEARS Q4 2015 PERFORMANCE 15% $2.00 S&P 500 MSCI EAFE USD MSCI Europe (USD) $1.75 Local Currency MSCI Japan (USD) 10% MSCI Emerging Markets $1.50 $1.25 5% $1.00 0% S&P 500 MSCI EAFE Europe Japan MSCI EM $0.75 Dec-10 FIVE-YEAR ANNUALIZED RISK VS RETURN Dec-11 Dec-12 Dec-13 35 5% MSCI EAFE 0% Barclays U.S. Aggregate Bond MSCI Japan MSCI Europe MSCI EM Small Cap MSCI EM 5% 10% 15% Risk (Standard Deviation) Sources: Bloomberg, Morningstar, MSCI. Data as of 12/31/15. MSCI EM 25 20 15 10 -10% 0% MSCI Europe 30 MSCI AC Far East ex Japan -5% Dec-15 S&P 500 S&P 500 10% Dec-14 VALUATIONS (CYCLICALLY-ADJUSTED P/E) 15% Return  A bounce back quarter. After widespread losses in Q3, most markets were able to post decent gains in the recent quarter (less so in U.S. dollar terms). For the year, however, losses were the norm. 20% 5 Dec-05 Dec-07 Dec-09 Dec-11 Dec-13 Dec-15 CONVERGENTWEALTH.COM | 11 .
INTERNATIONAL EQUITY MARKETS  Emerging markets are suffering. Developed international stock markets have outperformed emerging markets several years, thanks in part to commodity weakness and China’s slowdown.  An unstable near-term picture, but better longterm outlook. Secular growth potential favors emerging markets, which are experiencing an expansion of the middle class. Stabilization of commodity prices and the dollar’s surge may mark a turning point.  Why consider emerging markets? Emerging markets account for more than half of global production, yet only a small fraction of overall stock market capitalization. That gap should narrow over time. GLOBAL MARKET CAP VS.
PRODUCTION YEAR-TO-DATE EQUITY RETURNS (IN USD) MSCI EAFE Small Cap 9.9% MSCI Japan 9.9% U.S. Large Cap Stock Market Capitalization Emerging Other 9% Developed 9% Japan 9% 1.4% MSCI EAFE -0.4% MSCI Europe United States 16% United States 51% Emerging 57% Europe 22% -2.3% U.S. Small Cap Share of Global GDP (PPP) Japan 4% Other Developed 3% -4.4% MSCI India Europe 20% -6.1% MSCI China COMPARISON OF ECONOMIC FUNDAMENTALS -7.6% 8% MSCI EM Asia -9.5% MSCI Frontier 7% U.S. Europe Emerging 6% -14.1% 5% MSCI EM 4% -14.6% 3% MSCI Latin America -30.8% 2% 1% MSCI Brazil -41.2% 0% -50% -40% -30% -20% -10% 0% 10% Sources: Bloomberg, Morningstar, MSCI.
Data as of 12/31/15. 20% Real GDP (YoY%) Inflation (YoY%) Interest Rates (10-yr Govt) CONVERGENTWEALTH.COM | 12 . REAL ASSETS  Where’s the bottom? Crude oil’s harrowing slide continues, thanks to oversupply and concerns about slowing growth in China (and concomitant reduced global demand). A rising U.S. dollar has also pressured commodity prices.  Why consider a modest allocation to real assets? Commodities and real estate generally provide a portfolio with several potential benefits, including a hedge against inflation, longer-term diversification from stocks and bonds, and in certain segments, relatively higher income yields. COMMODITY PRICES AND BALTIC DRY INDEX DJ UBS COMMODITY SUB-INDEX PERFORMANCE Baltic Dry Index (left scale) 12,000 -10.5% DJ UBS Commodity Q4 2015 -24.7% 140 LME Copper (left scale) Crude Oil U.S. (WTI) (right scale) 10,000 120 6,000 -24.9% Crude Oil 80 4,000 -15.7% 100 60 2,000 Agriculture 8,000 YTD -2.2% 40 -44.8% Energy Grains -22.7% 0 Dec-05 -38.9% Dec-07 Dec-09 Dec-11 Dec-13 20 Dec-15 -7.7% -19.5% GROWTH OF $1 OVER PAST FIVE YEARS -8.3% Livestock $2.00 -26.9% S&P 500 $1.75 Industrial Metals S&P North America Natural Resources S&P Global Property DJ UBS Commodity -3.5% $1.50 -18.9% US Inflation $1.25 Precious Metals -5.1% $1.00 -11.5% $0.75 Softs 11.1% $0.50 -9.9% -50% -40% -30% -20% -10% 0% Sources: Bloomberg, Morningstar.
Data as of 12/31/15. 10% 20% $0.25 Dec-10 Dec-11 Dec-12 Dec-13 Dec-14 Dec-15 CONVERGENTWEALTH.COM | 13 . HEDGE FUNDS  Hedge funds have underwhelmed during this market cycle. They have critically lagged long-only strategies since the introduction of massive stimulus policies and zerointerest rate policies.  Hard to put a label on. With varying strategies and exposures, hedge funds can produce an array of risk/return profiles. However, one element tends to be consistent: most strategies exhibit lower volatility than long-only equities as their returns are not solely driven by market beta. GROWTH OF $1 OVER PAST FIVE YEARS HEDGE FUND PERFORMANCE $2.00 Convertible Arbitrage Distressed Securities Barclays U.S. Aggregate Bond 1.9% $1.75 HFRI Fund of Funds Composite HFRI Equity Hedge Q4 2015 -3.6% $1.50 YTD -8.4% $1.25 2.3% Equity Hedge -0.4% $1.00 1.9% Equity Market Neutral Event-Driven S&P 500 0.3% $0.75 Dec-10 5.0% Dec-11 Dec-12 Dec-13 Dec-14 Dec-15 0.3% -2.9% FIVE-YEAR ANNUALIZED RISK VS.
RETURN 0.6% Fund of Funds Composite Macro 15% -0.4% 10% -1.3% 2.2% Merger Arbitrage 3.4% 5% Relative Value Arbitrage Fund of Funds Composite Barclays U.S. Event-Driven Aggregate Bond -0.2% Relative Value Arbitrage -10% S&P 500 -0.2% Return  A mixed year for hedge funds. Many segments, and especially funds with healthcare or energy exposure, lost ground in 2015. -0.2% -5% Equity Market Neutral 0% 0% 5% 10% 0% 2% Equity Hedge Distressed Securities 4% 6% 8% 10% 12% Risk (Standard Deviation) Sources: Bloomberg, Morningstar, HFR. Data as of 12/31/15. CONVERGENTWEALTH.COM | 14 .
INVESTOR FLOWS AND LIQUIDITY  Not much faith. There is still a fair amount of money on the sidelines, earning next to nothing and waiting to be invested. Still baring scars from 2008, increased volatility appears to have scared many investors away from stocks.  Souring investor sentiment. Investors pulled money out of stock mutual funds throughout 2015. Margin debt has also been declining off record levels.  Facing increased risks.
CDS spreads (the cost of insuring debt against default) are widening, especially in emerging markets and commodity-oriented regions. However, developed markets remain relatively stable. MUTUAL FUND CASH FLOWS MONEY MARKET FUND ASSETS 6,000 ICI Money Market Funds Assets ($ billions) (left scale) Money Market Funds as % of S&P 500 Market Cap (right scale) 5,000 4,000 60% 50% 40% 60,000 40,000 20,000 0 3,000 30% -20,000 2,000 20% 1,000 10% 0 Sep-05 Sep-07 Sep-09 Sep-11 Sep-13 0% Sep-15 -40,000 -60,000 -80,000 Jan-07 MARGIN DEBT ICI Bond Mutual Fund Flows ($ millions) Jan-09 Jan-11 Jan-13 Jan-15 SOVEREIGN CDS SPREADS 600,000 500,000 ICI Equity Mutual Fund Flows ($ millions) 250 NYSE Margin Debt ($ millions) U.S. 5-Year Sovereign CDS Germany 5-Year Sovereign CDS 200 France 5-Year Sovereign CDS China 5-Year Sovereign CDS 400,000 150 300,000 100 200,000 50 100,000 0 Dec-05 Dec-07 Dec-09 Dec-11 Dec-13 Dec-15 0 Dec-05 Sources: Bloomberg, Morningstar, Investment Company Institute. Data as of 12/31/15. Dec-07 Dec-09 Dec-11 Dec-13 Dec-15 CONVERGENTWEALTH.COM | 15 .
CURRENCY AND DEBT  The greenback flexes its muscles. The U.S. dollar index gained 9% in 2015. As Fed policy diverges from other major central banks, most signs are pointing towards continued dollar strength.  Pushing on a string.
Fed monetary policies drove M1 to high levels, creating concerns about eventual inflation. However, the velocity of money remains extremely low, illustrating a lack of pressure on pricing.  The borrowing headwind. The Fed has an incentive to keep interest rates relatively low—if rates rise sharply, so too will debt payments on the vast amount of existing personal debt, thereby hindering consumer spending. MONEY SUPPLY AND VELOCITY U.S. DOLLAR AND EURO 120 Dollar Index Spot (left scale) 110 1.80 3,500 1.60 3,000 100 1.40 1.20 2,000 80 1.00 1,500 70 0.80 14 2,500 90 15 U.S.
M1 Money Supply (left scale) 1,000 EUR-USD Exchange Rate (right scale) 13 Bloomberg Velocity of M1 Supply (right scale) 12 11 10 9 8 7 6 60 Dec-05 Dec-07 Dec-09 Dec-11 Dec-13 0.60 Dec-15 HOUSEHOLD DEBT 500 Dec-05 Dec-07 Dec-09 Dec-11 Dec-13 5 Dec-15 SAVINGS RATE AND HOUSEHOLD DEBT SERVICE RATIO 140% 16% U.S. Financial Obligations Household Debt Service Ratio 130% 14% U.S. Personal Saving as a % of Disposable Personal Income 120% 12% 10,000 110% 10% 8,000 100% 8% 6,000 90% 6% 4,000 80% 4% 2,000 70% 2% 60% 0% Dec-90 Dec-93 Dec-96 Dec-99 Dec-02 Dec-05 Dec-08 Dec-11 Dec-14 16,000 14,000 12,000 0 Dec-90 U.S.
Household Debt Outstanding (left scale) Total Household Debt as a % of Personal Disposable Income (right scale) Dec-94 Dec-98 Dec-02 Dec-06 Dec-10 Sources: Bloomberg, Morningstar. Data as of 12/31/15. Dec-14 CONVERGENTWEALTH.COM | 16 . DISCLOSURE The information contained in this summary is for informational purposes only and contains confidential and proprietary information that is subject to change without notice. Any opinions expressed are current only as of the time made and are subject to change without notice. This report may include estimates, projections or other forward looking statements, however, due to numerous factors, actual events may differ substantially from those presented. The graphs and tables making up this report have been based on unaudited, third-party data and performance information provided to us by one or more commercial databases.
While we believe this information to be reliable, Convergent bears no responsibility whatsoever for any errors or omissions. Additionally, please be aware that past performance is not a guide to the future performance of any manager or strategy, and that the performance results displayed herein may have been adversely or favorably impacted by events and economic conditions that will not prevail in the future. Therefore, caution must be used in inferring that these results are indicative of the future performance of any strategy.
Index results assume the re-investment of all dividends and interest. Moreover, the information provided is not intended to be, and should not be construed as, investment, legal or tax advice. Nothing contained herein should be construed as a recommendation or advice to purchase or sell any security, investment, or portfolio allocation.
Any investment advice provided by Convergent is client specific based on each clients' risk tolerance and investment objectives. Please consult your Convergent Advisor directly for investment advice related to your specific investment portfolio. Non-deposit investment products are not FDIC insured, are not deposits or other obligations of City National Bank, are not guaranteed by City National Bank and involve investment risks, including the possible loss of principal. CONVERGENTWEALTH.COM | 17 .


