


Description
MARKET FLASH REPORT
March 2016
KEY TAKEAWAYS
•
Stocks lost a smidgen of ground in February, stabilizing after January's steep declines. Still, the S&P 500 posted its
third down month in a row, the first time that has happened since 2011. Oil prices finally steadied after several
problematic months , but investors remained cautious especially as Chinese markets remain extremely volatile.
•
Despite insistence from the Federal Reserve that rate hikes are still in play for later this year (as the labor market
keeps chugging along and inflation shows signs of life), bond yields continued to move lower. The yield of the
benchmark ten-year Treasury note finished the month at 1.7%, well below its 2.3% level at the end of 2015.
Astoundingly, the note is once again testing generationally low yields and there has even been talk of negative
rates, making finding income a challenge for many investors.
•
While the unusual race for U.S.
Presidential nominations has taken center stage, there is also drama overseas with the possibility for British secession from the European Union (a “Brexit”). That has raised questions about the region’s economic stability and has complicated the outlook for Euro-area monetary policy. While the odds are still low, a U.K.
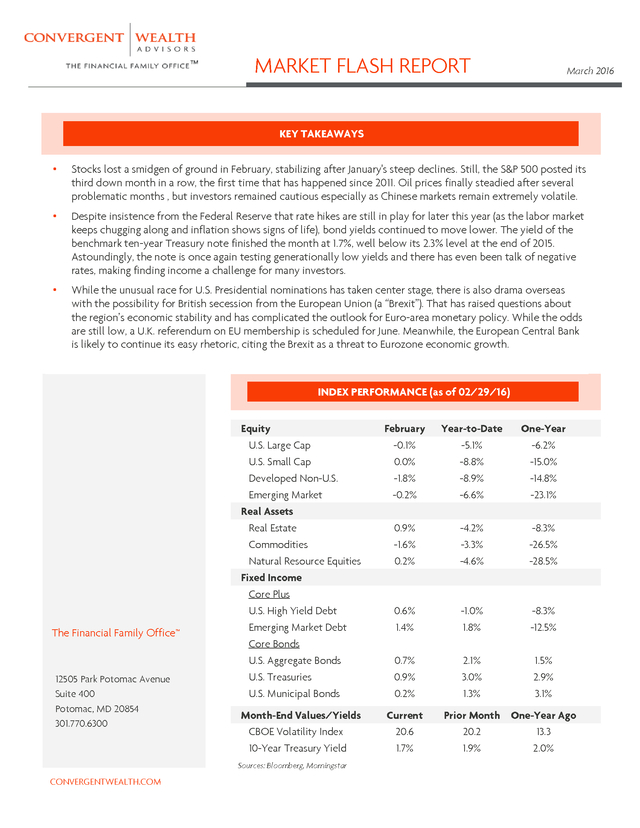
referendum on EU membership is scheduled for June. Meanwhile, the European Central Bank is likely to continue its easy rhetoric, citing the Brexit as a threat to Eurozone economic growth. INDEX PERFORMANCE (as of 02/29/16) Equity February Year-to-Date One-Year U.S. Large Cap -0.1% -5.1% -6.2% U.S.
Small Cap 0.0% -8.8% -15.0% Developed Non-U.S. -1.8% -8.9% -14.8% Emerging Market -0.2% -6.6% -23.1% Real Estate 0.9% -4.2% -8.3% Commodities -1.6% -3.3% -26.5% Natural Resource Equities 0.2% -4.6% -28.5% U.S. High Yield Debt 0.6% -1.0% -8.3% Emerging Market Debt 1.4% 1.8% -12.5% U.S. Aggregate Bonds 0.7% 2.1% 1.5% U.S.
Treasuries 0.9% 3.0% 2.9% U.S. Municipal Bonds 0.2% 1.3% 3.1% Real Assets Fixed Income Core Plus The Financial Family Office™ 12505 Park Potomac Avenue Suite 400 Potomac, MD 20854 301.770.6300 Core Bonds Month-End Values/Yields Current Prior Month One-Year Ago CBOE Volatility Index 20.6 20.2 13.3 10-Year Treasury Yield 1.7% 1.9% 2.0% Sources: Bloomberg, Morningstar CONVERGENTWEALTH.COM . DISCLOSURE Past Performance Is No Guarantee Of Future Performance. Any opinions expressed are current only as of the time made and are subject to change without notice. This report may include estimates, projections or other forward looking statements, however, due to numerous factors, actual events may differ substantially from those presented. The graphs and tables making up this report have been based on unaudited, third-party data and performance information provided to us by one or more commercial databases.
Additionally, please be aware that past performance is not a guide to the future performance of any manager or strategy, and that the performance results and historical information provided displayed herein may have been adversely or favorably impacted by events and economic conditions that will not prevail in the future. Therefore, caution must be used in inferring that these results are indicative of the future performance of any strategy, index, fund, manager or group of managers. All performance numbers shown herein are net of actual fees and expenses and include the reinvestment of dividends and other income, as reported by the manager and/or by the commercial databases involved.
While we believe this information to be reliable, Convergent Wealth Advisors bears no responsibility whatsoever for any errors or omissions. Index benchmarks contained in this report are provided so that performance can be compared with the performance of well-known and widely recognized indices. The volatility of these indices may be materially different from that of the fund. You cannot invest directly in an index.
Index results assume the reinvestment of all dividends and interest. Moreover, the information provided is not intended to be, and should not be construed as, investment, legal or tax advice. Nothing contained herein should be construed as a recommendation or advice to purchase or sell any security, investment, or portfolio allocation.
Any investment advice provided by Convergent is client specific based on each clients' risk tolerance and investment objectives. This presentation is not meant as a general guide to investing, or as a source of any specific investment recommendations, and makes no implied or express recommendations concerning the manner in which any client's accounts should or would be handled, as appropriate investment decisions depend upon the client's specific investment objectives. U.S. Large Cap Equity is represented by the S&P 500 Index, with dividends reinvested.
U.S. Small Cap Equity is represented by the Russell 2000 Index. Developed Non-U.S. Equity is represented by the MSCI EAFE Index.
Emerging Market Equity is represented by the MSCI EM Index. Real Estate is represented by the S&P Global Property Index. Commodities are represented by the DJ UBS Commodity Index.
Natural Resource Equities are represented by the S&P North American Natural Resources Index. U.S. High Yield Debt is represented by the Barclays U.S.
Corporate High Yield Index. Emerging Market Debt is represented by the JPM GMI-EM Global Diversified Index. U.S. Aggregate Bonds is represented by the Barclays U.S.
Aggregate Bond Index. U.S. Treasuries is represented by the Barclays U.S.
Treasury Index. U.S. Municipal Bonds is represented by the Barclays Municipal 1-10yr Index. Non-deposit investment products are not FDIC insured, are not deposits or other obligations of Convergent Wealth Advisors, are not guaranteed by Convergent Wealth Advisors and involve investment risks, including the possible loss of principal. 2 | CONVERGENTWEALTH.COM .
Presidential nominations has taken center stage, there is also drama overseas with the possibility for British secession from the European Union (a “Brexit”). That has raised questions about the region’s economic stability and has complicated the outlook for Euro-area monetary policy. While the odds are still low, a U.K.
referendum on EU membership is scheduled for June. Meanwhile, the European Central Bank is likely to continue its easy rhetoric, citing the Brexit as a threat to Eurozone economic growth. INDEX PERFORMANCE (as of 02/29/16) Equity February Year-to-Date One-Year U.S. Large Cap -0.1% -5.1% -6.2% U.S.
Small Cap 0.0% -8.8% -15.0% Developed Non-U.S. -1.8% -8.9% -14.8% Emerging Market -0.2% -6.6% -23.1% Real Estate 0.9% -4.2% -8.3% Commodities -1.6% -3.3% -26.5% Natural Resource Equities 0.2% -4.6% -28.5% U.S. High Yield Debt 0.6% -1.0% -8.3% Emerging Market Debt 1.4% 1.8% -12.5% U.S. Aggregate Bonds 0.7% 2.1% 1.5% U.S.
Treasuries 0.9% 3.0% 2.9% U.S. Municipal Bonds 0.2% 1.3% 3.1% Real Assets Fixed Income Core Plus The Financial Family Office™ 12505 Park Potomac Avenue Suite 400 Potomac, MD 20854 301.770.6300 Core Bonds Month-End Values/Yields Current Prior Month One-Year Ago CBOE Volatility Index 20.6 20.2 13.3 10-Year Treasury Yield 1.7% 1.9% 2.0% Sources: Bloomberg, Morningstar CONVERGENTWEALTH.COM . DISCLOSURE Past Performance Is No Guarantee Of Future Performance. Any opinions expressed are current only as of the time made and are subject to change without notice. This report may include estimates, projections or other forward looking statements, however, due to numerous factors, actual events may differ substantially from those presented. The graphs and tables making up this report have been based on unaudited, third-party data and performance information provided to us by one or more commercial databases.
Additionally, please be aware that past performance is not a guide to the future performance of any manager or strategy, and that the performance results and historical information provided displayed herein may have been adversely or favorably impacted by events and economic conditions that will not prevail in the future. Therefore, caution must be used in inferring that these results are indicative of the future performance of any strategy, index, fund, manager or group of managers. All performance numbers shown herein are net of actual fees and expenses and include the reinvestment of dividends and other income, as reported by the manager and/or by the commercial databases involved.
While we believe this information to be reliable, Convergent Wealth Advisors bears no responsibility whatsoever for any errors or omissions. Index benchmarks contained in this report are provided so that performance can be compared with the performance of well-known and widely recognized indices. The volatility of these indices may be materially different from that of the fund. You cannot invest directly in an index.
Index results assume the reinvestment of all dividends and interest. Moreover, the information provided is not intended to be, and should not be construed as, investment, legal or tax advice. Nothing contained herein should be construed as a recommendation or advice to purchase or sell any security, investment, or portfolio allocation.
Any investment advice provided by Convergent is client specific based on each clients' risk tolerance and investment objectives. This presentation is not meant as a general guide to investing, or as a source of any specific investment recommendations, and makes no implied or express recommendations concerning the manner in which any client's accounts should or would be handled, as appropriate investment decisions depend upon the client's specific investment objectives. U.S. Large Cap Equity is represented by the S&P 500 Index, with dividends reinvested.
U.S. Small Cap Equity is represented by the Russell 2000 Index. Developed Non-U.S. Equity is represented by the MSCI EAFE Index.
Emerging Market Equity is represented by the MSCI EM Index. Real Estate is represented by the S&P Global Property Index. Commodities are represented by the DJ UBS Commodity Index.
Natural Resource Equities are represented by the S&P North American Natural Resources Index. U.S. High Yield Debt is represented by the Barclays U.S.
Corporate High Yield Index. Emerging Market Debt is represented by the JPM GMI-EM Global Diversified Index. U.S. Aggregate Bonds is represented by the Barclays U.S.
Aggregate Bond Index. U.S. Treasuries is represented by the Barclays U.S.
Treasury Index. U.S. Municipal Bonds is represented by the Barclays Municipal 1-10yr Index. Non-deposit investment products are not FDIC insured, are not deposits or other obligations of Convergent Wealth Advisors, are not guaranteed by Convergent Wealth Advisors and involve investment risks, including the possible loss of principal. 2 | CONVERGENTWEALTH.COM .


