


Description
MARKET FLASH REPORT
January 2016
KEY TAKEAWAYS
•
Bah Humbug! There was no Santa Claus rally this year, as equities lost a bit of ground in December. Overall, 2015
turned out to be rather disappointing, with the S&P 500 ending virtually unchanged (up 1.4% including dividends) in
notching its worst yearly performance since 2008. Tranquility on the surface masked volatile undercurrents, including
a gut-wrenching correction (the first 10% decline in four years), a Chinese meltdown, and an oil price collapse.
•
The short summary of 2015 is that developed stock markets were resilient in the face of slow global growth even as
emerging markets and oil prices tumbled. Bond yields remained low (despite some blips in the high yield market and
worries about Fed hikes) while the strong U.S.
dollar hampered domestic corporate earnings and manufacturing. • The Federal Reserve finally made its much anticipated move, and markets simply shrugged in response. It appears Chair Janet Yellen succeeded in making the 25 basis point hike as minimally disruptive as possible. Investors are focused on what happens next, and for now guidance points to a gradual tightening cycle with the central bank continuing to reinvest its balance sheet.
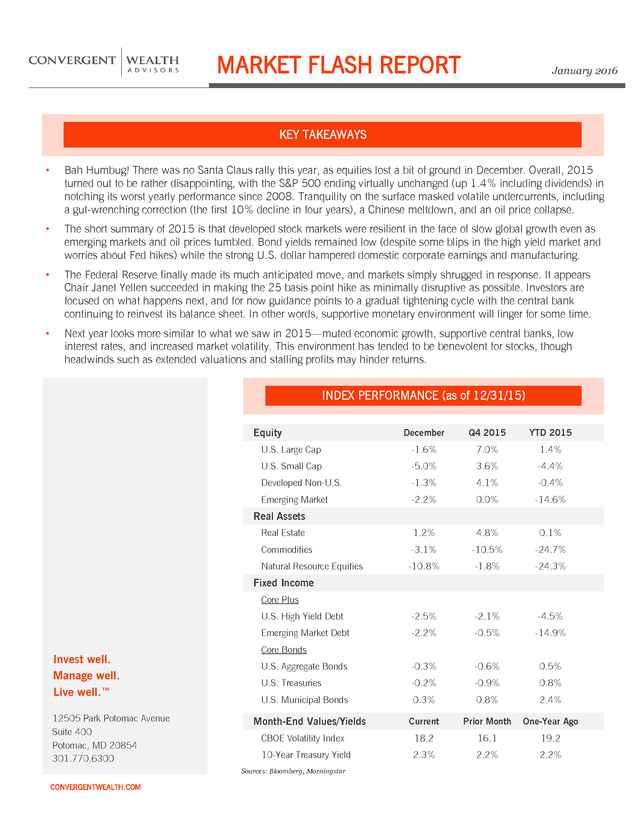
In other words, supportive monetary environment will linger for some time. • Next year looks more similar to what we saw in 2015—muted economic growth, supportive central banks, low interest rates, and increased market volatility. This environment has tended to be benevolent for stocks, though headwinds such as extended valuations and stalling profits may hinder returns. INDEX PERFORMANCE (as of 12/31/15) Equity December Q4 2015 YTD 2015 U.S. Large Cap -1.6% 7.0% 1.4% U.S.
Small Cap -5.0% 3.6% -4.4% Developed Non-U.S. -1.3% 4.1% -0.4% Emerging Market -2.2% 0.0% -14.6% Real Estate 1.2% 4.8% 0.1% Commodities -3.1% -10.5% -24.7% Natural Resource Equities -10.8% -1.8% -24.3% U.S. High Yield Debt -2.5% -2.1% -4.5% Emerging Market Debt -2.2% -0.5% -14.9% U.S. Aggregate Bonds -0.3% -0.6% 0.5% U.S.
Treasuries -0.2% -0.9% 0.8% U.S. Municipal Bonds 0.3% 0.8% 2.4% Current Prior Month One-Year Ago CBOE Volatility Index 18.2 16.1 19.2 10-Year Treasury Yield 2.3% 2.2% 2.2% Real Assets Fixed Income Core Plus Invest well. Manage well. Live well.™ 12505 Park Potomac Avenue Suite 400 Potomac, MD 20854 301.770.6300 Core Bonds Month-End Values/Yields Sources: Bloomberg, Morningstar CONVERGENTWEALTH.COM . DISCLOSURE Past Performance Is No Guarantee Of Future Performance. Any opinions expressed are current only as of the time made and are subject to change without notice. This report may include estimates, projections or other forward looking statements, however, due to numerous factors, actual events may differ substantially from those presented. The graphs and tables making up this report have been based on unaudited, third-party data and performance information provided to us by one or more commercial databases.
Additionally, please be aware that past performance is not a guide to the future performance of any manager or strategy, and that the performance results and historical information provided displayed herein may have been adversely or favorably impacted by events and economic conditions that will not prevail in the future. Therefore, caution must be used in inferring that these results are indicative of the future performance of any strategy, index, fund, manager or group of managers. All performance numbers shown herein are net of actual fees and expenses and include the reinvestment of dividends and other income, as reported by the manager and/or by the commercial databases involved.
While we believe this information to be reliable, Convergent Wealth Advisors bears no responsibility whatsoever for any errors or omissions. Index benchmarks contained in this report are provided so that performance can be compared with the performance of well-known and widely recognized indices. The volatility of these indices may be materially different from that of the fund.
You cannot invest directly in an index. Index results assume the re-investment of all dividends and interest. Moreover, the information provided is not intended to be, and should not be construed as, investment, legal or tax advice.
Nothing contained herein should be construed as a recommendation or advice to purchase or sell any security, investment, or portfolio allocation. Any investment advice provided by Convergent is client specific based on each clients' risk tolerance and investment objectives. This presentation is not meant as a general guide to investing, or as a source of any specific investment recommendations, and makes no implied or express recommendations concerning the manner in which any client's accounts should or would be handled, as appropriate investment decisions depend upon the client's specific investment objectives. U.S.
Large Cap Equity is represented by the S&P 500 Index, with dividends reinvested. U.S. Small Cap Equity is represented by the Russell 2000 Index. Developed Non-U.S.
Equity is represented by the MSCI EAFE Index. Emerging Market Equity is represented by the MSCI EM Index. Real Estate is represented by the S&P Global Property Index. Commodities are represented by the DJ UBS Commodity Index.
Natural Resource Equities are represented by the S&P North American Natural Resources Index. U.S. High Yield Debt is represented by the Barclays U.S. Corporate High Yield Index.
Emerging Market Debt is represented by the JPM GMI-EM Global Diversified Index. U.S. Aggregate Bonds is represented by the Barclays U.S.
Aggregate Bond Index. U.S. Treasuries is represented by the Barclays U.S.
Treasury Index. U.S. Municipal Bonds is represented by the Barclays Municipal 1-10yr Index. Non-deposit investment products are not FDIC insured, are not deposits or other obligations of Convergent Wealth Advisors, are not guaranteed by Convergent Wealth Advisors and involve investment risks, including the possible loss of principal. 2| CONVERGENTWEALTH.COM .
dollar hampered domestic corporate earnings and manufacturing. • The Federal Reserve finally made its much anticipated move, and markets simply shrugged in response. It appears Chair Janet Yellen succeeded in making the 25 basis point hike as minimally disruptive as possible. Investors are focused on what happens next, and for now guidance points to a gradual tightening cycle with the central bank continuing to reinvest its balance sheet.
In other words, supportive monetary environment will linger for some time. • Next year looks more similar to what we saw in 2015—muted economic growth, supportive central banks, low interest rates, and increased market volatility. This environment has tended to be benevolent for stocks, though headwinds such as extended valuations and stalling profits may hinder returns. INDEX PERFORMANCE (as of 12/31/15) Equity December Q4 2015 YTD 2015 U.S. Large Cap -1.6% 7.0% 1.4% U.S.
Small Cap -5.0% 3.6% -4.4% Developed Non-U.S. -1.3% 4.1% -0.4% Emerging Market -2.2% 0.0% -14.6% Real Estate 1.2% 4.8% 0.1% Commodities -3.1% -10.5% -24.7% Natural Resource Equities -10.8% -1.8% -24.3% U.S. High Yield Debt -2.5% -2.1% -4.5% Emerging Market Debt -2.2% -0.5% -14.9% U.S. Aggregate Bonds -0.3% -0.6% 0.5% U.S.
Treasuries -0.2% -0.9% 0.8% U.S. Municipal Bonds 0.3% 0.8% 2.4% Current Prior Month One-Year Ago CBOE Volatility Index 18.2 16.1 19.2 10-Year Treasury Yield 2.3% 2.2% 2.2% Real Assets Fixed Income Core Plus Invest well. Manage well. Live well.™ 12505 Park Potomac Avenue Suite 400 Potomac, MD 20854 301.770.6300 Core Bonds Month-End Values/Yields Sources: Bloomberg, Morningstar CONVERGENTWEALTH.COM . DISCLOSURE Past Performance Is No Guarantee Of Future Performance. Any opinions expressed are current only as of the time made and are subject to change without notice. This report may include estimates, projections or other forward looking statements, however, due to numerous factors, actual events may differ substantially from those presented. The graphs and tables making up this report have been based on unaudited, third-party data and performance information provided to us by one or more commercial databases.
Additionally, please be aware that past performance is not a guide to the future performance of any manager or strategy, and that the performance results and historical information provided displayed herein may have been adversely or favorably impacted by events and economic conditions that will not prevail in the future. Therefore, caution must be used in inferring that these results are indicative of the future performance of any strategy, index, fund, manager or group of managers. All performance numbers shown herein are net of actual fees and expenses and include the reinvestment of dividends and other income, as reported by the manager and/or by the commercial databases involved.
While we believe this information to be reliable, Convergent Wealth Advisors bears no responsibility whatsoever for any errors or omissions. Index benchmarks contained in this report are provided so that performance can be compared with the performance of well-known and widely recognized indices. The volatility of these indices may be materially different from that of the fund.
You cannot invest directly in an index. Index results assume the re-investment of all dividends and interest. Moreover, the information provided is not intended to be, and should not be construed as, investment, legal or tax advice.
Nothing contained herein should be construed as a recommendation or advice to purchase or sell any security, investment, or portfolio allocation. Any investment advice provided by Convergent is client specific based on each clients' risk tolerance and investment objectives. This presentation is not meant as a general guide to investing, or as a source of any specific investment recommendations, and makes no implied or express recommendations concerning the manner in which any client's accounts should or would be handled, as appropriate investment decisions depend upon the client's specific investment objectives. U.S.
Large Cap Equity is represented by the S&P 500 Index, with dividends reinvested. U.S. Small Cap Equity is represented by the Russell 2000 Index. Developed Non-U.S.
Equity is represented by the MSCI EAFE Index. Emerging Market Equity is represented by the MSCI EM Index. Real Estate is represented by the S&P Global Property Index. Commodities are represented by the DJ UBS Commodity Index.
Natural Resource Equities are represented by the S&P North American Natural Resources Index. U.S. High Yield Debt is represented by the Barclays U.S. Corporate High Yield Index.
Emerging Market Debt is represented by the JPM GMI-EM Global Diversified Index. U.S. Aggregate Bonds is represented by the Barclays U.S.
Aggregate Bond Index. U.S. Treasuries is represented by the Barclays U.S.
Treasury Index. U.S. Municipal Bonds is represented by the Barclays Municipal 1-10yr Index. Non-deposit investment products are not FDIC insured, are not deposits or other obligations of Convergent Wealth Advisors, are not guaranteed by Convergent Wealth Advisors and involve investment risks, including the possible loss of principal. 2| CONVERGENTWEALTH.COM .


