


Description
Middle Market Equity
Capital Report
In Q3, Volatility Exerts Downward
Pressure on IPO Activity
October 2015
A CohnReznick LLP Report
1
Middle Market Equity Capital Report ― October 2015
. TABLE OF CONTENTS
Preface ..................................................................................................................................... 1
Highlights .................................................................................................................................. 2
Q3 IPO Activity ........................................................................................................................ 3
Middle Market Insights .......................................................................................................
4 Middle Market Industry Insights ......................................................................................... 6 Middle Market Snapshot .................................................................................................... 7 Middle Market Follow-on Activity......................................................................................
8 Which Banks Made the Middle Market List? .................................................................... 9 Summary and Forecast .................................................................................................... 10 About CohnReznick’s Public Companies Group ..........................................................
11 2 Middle Market Equity Capital Report ― July 2015 . PREFACE Compared to 2014, IPO activity in 2015 has been lagging and Q3 was no exception. Market volatility triggered by international news from Greece and China for example, and from uncertainty on domestic interest rate policies, may have kept some investors on the sidelines. Further contributing to the decreased number of IPOs is the continued availability of private capital. Private equity and strategic investors Dom Esposito Alex Castelli offer prospective acquisitions an attractive combination of financial and intellectual “ capital and without the costs or regulatory and reporting requirements associated with life as a public company. WE THINK BUSINESSES, THAT BELIEVE THE IPO TO BE THE MOST APPROPRIATE FORM OF CAPITAL, SHOULD CONTINUE TO EXPLORE IT AS AN OPTION AND PREPARE ACCORDINGLY. Despite the lag in the number of IPOs, we We think businesses, that believe the IPO to be the most appropriate form of capital, should continue to explore it as an option and prepare accordingly. Once ready, a company can access the public markets when the timing makes most sense. Today, global markets appear to be volatile. And volatility erodes confidence. Public equity capital transactions prefer a greater degree of stability.
Therefore, if current market conditions persist, we are likely to continue to see fewer IPOs when compared to last year’s record breaking levels. We hope you ï¬nd the contents of our Q3 Middle Market Equity Capital Report to be interesting and insightful. believe that high quality deals will continue to rise to the top and, when they do, they will be recognized and rewarded by investors. In Q3 2015, average proceeds raised per middle market IPO increased to $182 million from $125 million in the prior year. Market uncertainty may have eroded some investor and issuer confidence for the short term, but there seems to be continued interest Dom Esposito Alex Castelli CPA, Partner, CohnReznick’s National Liquidity and Capital Formation Advisory Group CPA, Partner, CohnReznick’s National Liquidity and Capital Formation Advisory Group when the right company prices an IPO. And for those companies, the IPO continues to be a viable source of capital. A CohnReznick Report 1 .
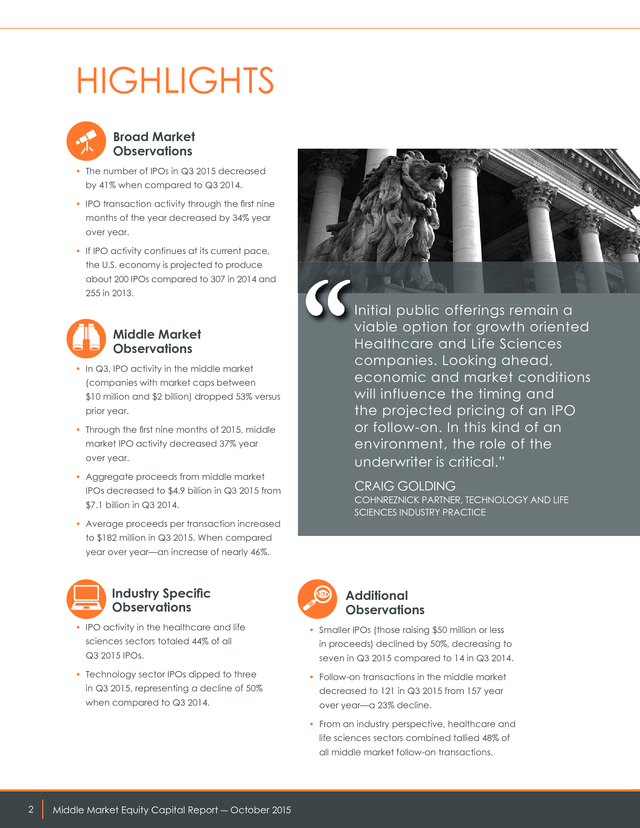
HIGHLIGHTS Broad Market Observations • The number of IPOs in Q3 2015 decreased by 41% when compared to Q3 2014. • IPO transaction activity through the first nine months of the year decreased by 34% year over year. • If IPO activity continues at its current pace, the U.S. economy is projected to produce about 200 IPOs compared to 307 in 2014 and 255 in 2013. Middle Market Observations • In Q3, IPO activity in the middle market (companies with market caps between $10 million and $2 billion) dropped 53% versus prior year. • Through the first nine months of 2015, middle market IPO activity decreased 37% year over year. • Aggregate proceeds from middle market IPOs decreased to $4.9 billion in Q3 2015 from “ $7.1 billion in Q3 2014. • Average proceeds per transaction increased Initial public offerings remain a viable option for growth oriented Healthcare and Life Sciences companies. Looking ahead, economic and market conditions will influence the timing and the projected pricing of an IPO or follow-on. In this kind of an environment, the role of the underwriter is critical.” CRAIG GOLDING COHNREZNICK PARTNER, TECHNOLOGY AND LIFE SCIENCES INDUSTRY PRACTICE to $182 million in Q3 2015.
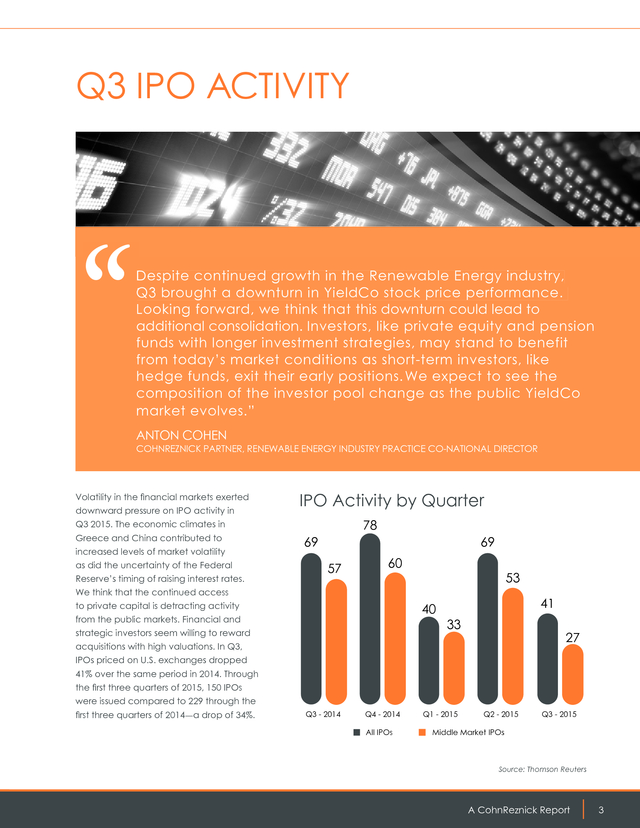
When compared year over year—an increase of nearly 46%. Industry Speciï¬c Observations • IPO activity in the healthcare and life sciences sectors totaled 44% of all Q3 2015 IPOs. • Technology sector IPOs dipped to three in Q3 2015, representing a decline of 50% when compared to Q3 2014. Additional Observations • Smaller IPOs (those raising $50 million or less in proceeds) declined by 50%, decreasing to seven in Q3 2015 compared to 14 in Q3 2014. • Follow-on transactions in the middle market decreased to 121 in Q3 2015 from 157 year over year—a 23% decline. • From an industry perspective, healthcare and life sciences sectors combined tallied 48% of all middle market follow-on transactions. 2 Middle Market Equity Capital Report ― October 2015 . Q3 IPO ACTIVITY “ Despite continued growth in the Renewable Energy industry, Q3 brought a downturn in YieldCo stock price performance. Looking forward, we think that this downturn could lead to additional consolidation. Investors, like private equity and pension funds with longer investment strategies, may stand to benefit from today’s market conditions as short-term investors, like hedge funds, exit their early positions. We expect to see the composition of the investor pool change as the public YieldCo market evolves.” ANTON COHEN COHNREZNICK PARTNER, RENEWABLE ENERGY INDUSTRY PRACTICE CO-NATIONAL DIRECTOR Volatility in the financial markets exerted downward pressure on IPO activity in IPO Activity by Quarter 78 Q3 2015. The economic climates in Greece and China contributed to increased levels of market volatility as did the uncertainty of the Federal Reserve’s timing of raising interest rates. 69 57 69 60 53 We think that the continued access to private capital is detracting activity 40 from the public markets.
Financial and strategic investors seem willing to reward 41 33 27 acquisitions with high valuations. In Q3, IPOs priced on U.S. exchanges dropped 41% over the same period in 2014.
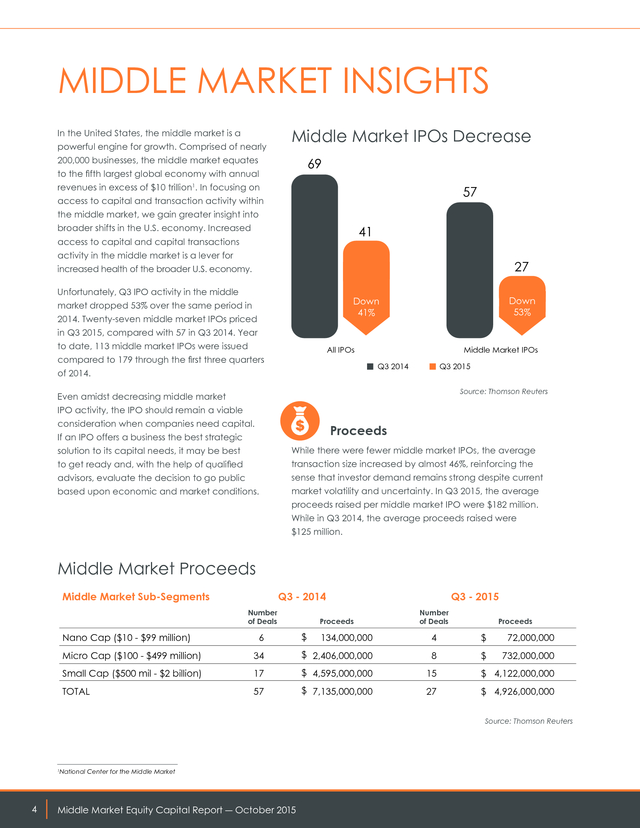
Through the first three quarters of 2015, 150 IPOs were issued compared to 229 through the first three quarters of 2014—a drop of 34%. Q3 - 2014 Q4 - 2014 All IPOs Q1 - 2015 Q2 - 2015 Q3 - 2015 Middle Market IPOs Source: Thomson Reuters A CohnReznick Report 3 . MIDDLE MARKET INSIGHTS In the United States, the middle market is a powerful engine for growth. Comprised of nearly Middle Market IPOs Decrease 200,000 businesses, the middle market equates 69 to the fifth largest global economy with annual revenues in excess of $10 trillion1. In focusing on 57 access to capital and transaction activity within the middle market, we gain greater insight into broader shifts in the U.S. economy.
Increased 41 access to capital and capital transactions activity in the middle market is a lever for 27 increased health of the broader U.S. economy. Unfortunately, Q3 IPO activity in the middle Down 53% Down 41% market dropped 53% over the same period in 2014. Twenty-seven middle market IPOs priced in Q3 2015, compared with 57 in Q3 2014.
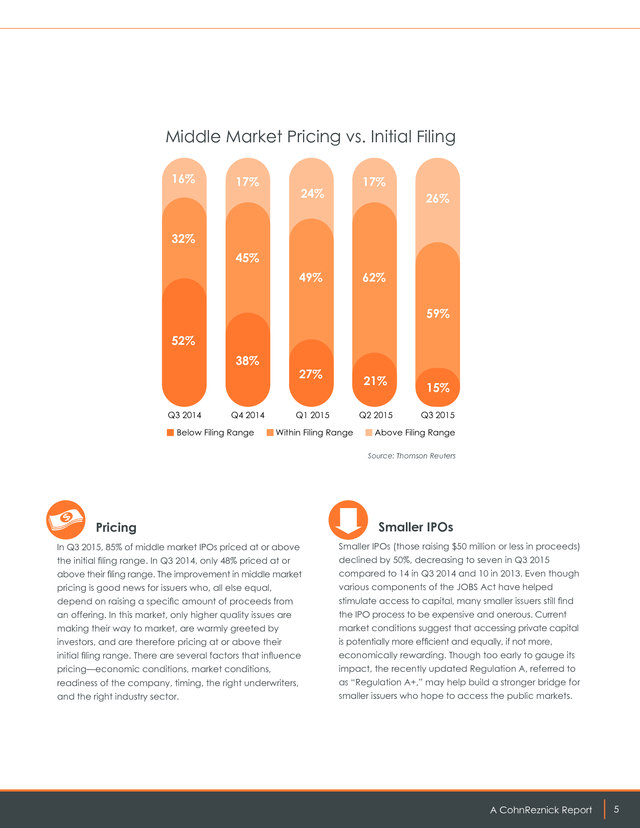
Year to date, 113 middle market IPOs were issued Middle Market IPOs All IPOs compared to 179 through the first three quarters Q3 2014 of 2014. Q3 2015 Source: Thomson Reuters Even amidst decreasing middle market IPO activity, the IPO should remain a viable consideration when companies need capital. Proceeds If an IPO offers a business the best strategic solution to its capital needs, it may be best While there were fewer middle market IPOs, the average to get ready and, with the help of qualified transaction size increased by almost 46%, reinforcing the advisors, evaluate the decision to go public sense that investor demand remains strong despite current based upon economic and market conditions. market volatility and uncertainty. In Q3 2015, the average proceeds raised per middle market IPO were $182 million. While in Q3 2014, the average proceeds raised were $125 million. Middle Market Proceeds Middle Market Sub-Segments Q3 - 2014 Number of Deals Nano Cap ($10 - $99 million) 6 Proceeds $ Q3 - 2015 Number of Deals Proceeds 134,000,000 4 $ 72,000,000 $ 732,000,000 Micro Cap ($100 - $499 million) 34 $ 2,406,000,000 8 Small Cap ($500 mil - $2 billion) 17 $ 4,595,000,000 15 $ 4,122,000,000 TOTAL 57 $ 7,135,000,000 27 $ 4,926,000,000 Source: Thomson Reuters 1 4 National Center for the Middle Market Middle Market Equity Capital Report ― October 2015 . Middle Market Pricing vs. Initial Filing 16% 17% 17% 24% 26% 32% 45% 49% 62% 59% 52% 38% Q3 2014 27% Q4 2014 Below Filing Range 21% Q1 2015 Q2 2015 Within Filing Range 15% Q3 2015 Above Filing Range Source: Thomson Reuters Pricing Smaller IPOs In Q3 2015, 85% of middle market IPOs priced at or above Smaller IPOs (those raising $50 million or less in proceeds) the initial filing range. In Q3 2014, only 48% priced at or declined by 50%, decreasing to seven in Q3 2015 above their filing range. The improvement in middle market compared to 14 in Q3 2014 and 10 in 2013.
Even though pricing is good news for issuers who, all else equal, various components of the JOBS Act have helped depend on raising a specific amount of proceeds from stimulate access to capital, many smaller issuers still find an offering. In this market, only higher quality issues are the IPO process to be expensive and onerous. Current making their way to market, are warmly greeted by market conditions suggest that accessing private capital investors, and are therefore pricing at or above their is potentially more efficient and equally, if not more, initial filing range.
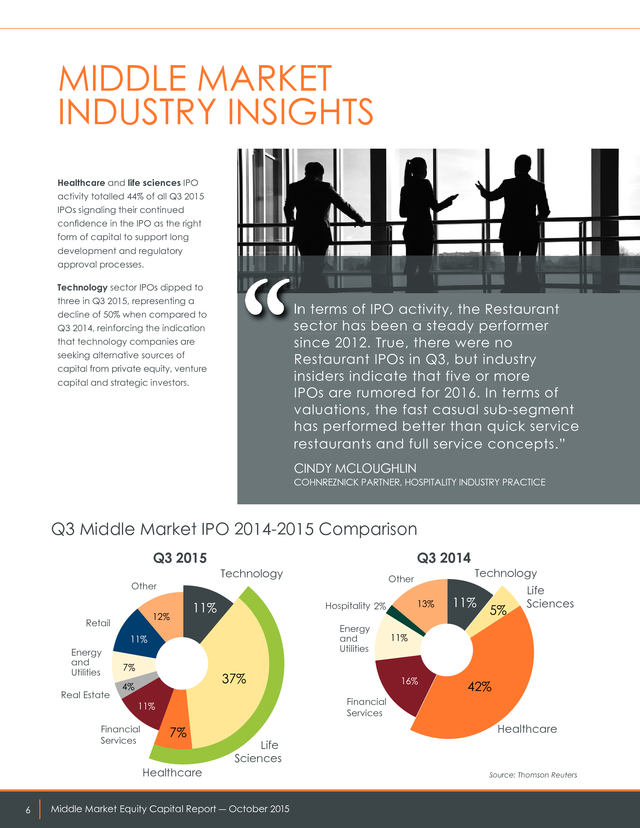
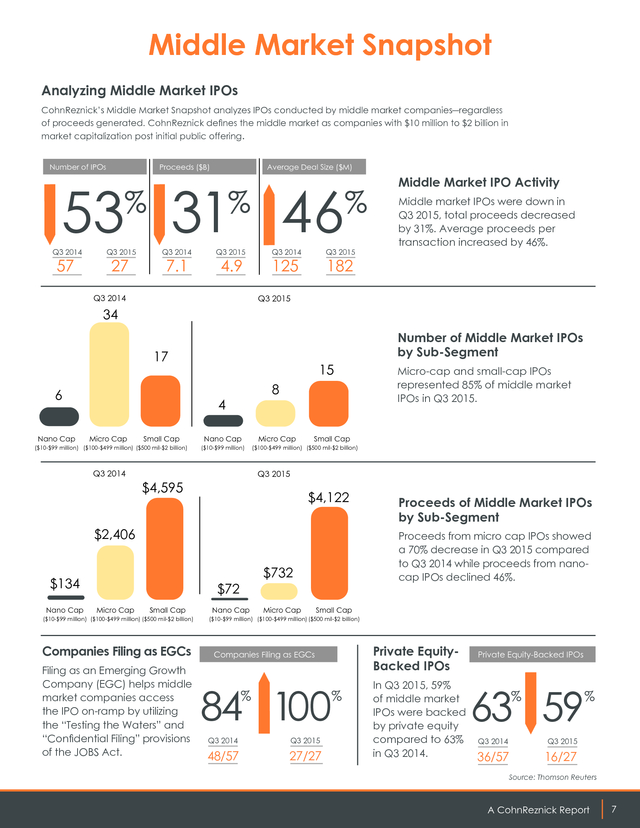
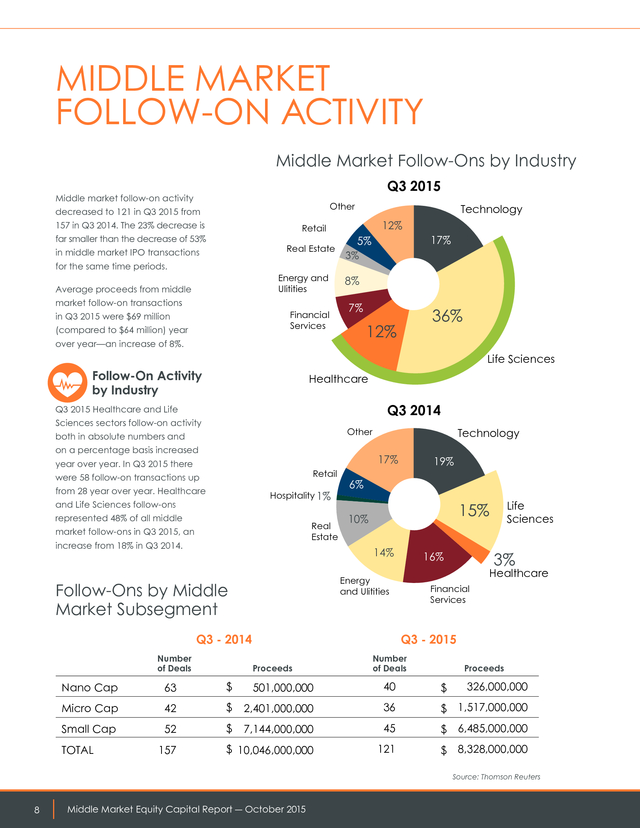
There are several factors that influence economically rewarding. Though too early to gauge its pricing—economic conditions, market conditions, impact, the recently updated Regulation A, referred to readiness of the company, timing, the right underwriters, as “Regulation A+,” may help build a stronger bridge for and the right industry sector. smaller issuers who hope to access the public markets. A CohnReznick Report 5 . MIDDLE MARKET INDUSTRY INSIGHTS Healthcare and life sciences IPO activity totalled 44% of all Q3 2015 IPOs signaling their continued confidence in the IPO as the right form of capital to support long development and regulatory approval processes. Technology sector IPOs dipped to three in Q3 2015, representing a decline of 50% when compared to Q3 2014, reinforcing the indication that technology companies are seeking alternative sources of capital from private equity, venture capital and strategic investors. “ In terms of IPO activity, the Restaurant sector has been a steady performer since 2012. True, there were no Restaurant IPOs in Q3, but industry insiders indicate that five or more IPOs are rumored for 2016. In terms of valuations, the fast casual sub-segment has performed better than quick service restaurants and full service concepts.” CINDY MCLOUGHLIN COHNREZNICK PARTNER, HOSPITALITY INDUSTRY PRACTICE Q3 Middle Market IPO 2014-2015 Comparison Q3 2015 Other 12% Retail Technology 11% Real Estate 7% Energy and Utilities 37% 4% 13% Technology 11% 5% Life Sciences 11% 16% 42% Financial Services 11% Financial Services 7% Healthcare 62 Other Hospitality 2% 11% Energy and Utilities Q3 2014 Healthcare Life Sciences Middle Market Equity Capital Report ― October 2015 Source: Thomson Reuters . Middle Market Snapshot Analyzing Middle Market IPOs CohnReznick’s Middle Market Snapshot analyzes IPOs conducted by middle market companies―regardless of proceeds generated. CohnReznick defines the middle market as companies with $10 million to $2 billion in market capitalization post initial public offering. Number of IPOs Proceeds ($B) Average Deal Size ($M) 53 31 46 % Q3 2014 57 Q3 2015 27 % Q3 2014 7.1 Q3 2015 4.9 Q3 2014 Q3 2014 % Q3 2015 125 Middle Market IPO Activity Middle market IPOs were down in Q3 2015, total proceeds decreased by 31%. Average proceeds per transaction increased by 46%. 182 Q3 2015 34 17 6 Nano Cap 15 8 4 Micro Cap Small Cap ($10-$99 million) ($100-$499 million) ($500 mil-$2 billion) Q3 2014 Nano Cap ($10-$99 million) Micro Cap Small Cap ($100-$499 million) ($500 mil-$2 billion) $4,122 $2,406 Nano Cap Micro Cap Small Cap Companies Filing as EGCs Filing as an Emerging Growth Company (EGC) helps middle market companies access the IPO on-ramp by utilizing the “Testing the Waters” and “Confidential Filing” provisions of the JOBS Act. Nano Cap Micro Cap Proceeds of Middle Market IPOs by Sub-Segment Proceeds from micro cap IPOs showed a 70% decrease in Q3 2015 compared to Q3 2014 while proceeds from nanocap IPOs declined 46%. $732 $72 ($10-$99 million) ($100-$499 million) ($500 mil-$2 billion) Micro-cap and small-cap IPOs represented 85% of middle market IPOs in Q3 2015. Q3 2015 $4,595 $134 Number of Middle Market IPOs by Sub-Segment Small Cap ($10-$99 million) ($100-$499 million) ($500 mil-$2 billion) Private EquityBacked IPOs Companies Filing as EGCs 84 100 % % Q3 2014 Q3 2015 48/57 27/27 In Q3 2015, 59% of middle market IPOs were backed by private equity compared to 63% in Q3 2014. Private Equity-Backed IPOs 63 59 % Q3 2014 Q3 2015 36/57 % 16/27 Source: Thomson Reuters A CohnReznick Report 7 . MIDDLE MARKET FOLLOW-ON ACTIVITY Middle Market Follow-Ons by Industry Q3 2015 Middle market follow-on activity Other decreased to 121 in Q3 2015 from 157 in Q3 2014. The 23% decrease is Retail far smaller than the decrease of 53% Real Estate in middle market IPO transactions for the same time periods. Energy and Ulitities Average proceeds from middle market follow-on transactions Financial Services in Q3 2015 were $69 million (compared to $64 million) year Technology 12% 5% 17% 3% 8% 7% 36% 12% over year—an increase of 8%. Life Sciences Follow-On Activity by Industry Healthcare Q3 2014 Q3 2015 Healthcare and Life Sciences sectors follow-on activity Technology Other both in absolute numbers and on a percentage basis increased 17% year over year. In Q3 2015 there Retail were 58 follow-on transactions up from 28 year over year. Healthcare Hospitality 1% and Life Sciences follow-ons represented 48% of all middle Real Estate market follow-ons in Q3 2015, an increase from 18% in Q3 2014. 19% 6% 10% 14% Q3 - 2014 Number of Deals 3% 16% Healthcare Energy and Ulitities Follow-Ons by Middle Market Subsegment Life Sciences 15% Financial Services Q3 - 2015 Proceeds Number of Deals Proceeds Nano Cap 63 $ 501,000,000 40 $ Micro Cap 42 $ 2,401,000,000 36 $ 1,517,000,000 Small Cap 52 $ 7,144,000,000 45 $ 6,485,000,000 $ 10,046,000,000 121 $ 8,328,000,000 TOTAL 157 326,000,000 Source: Thomson Reuters 4 8 Middle Market Equity Capital Report ― October 2015 .
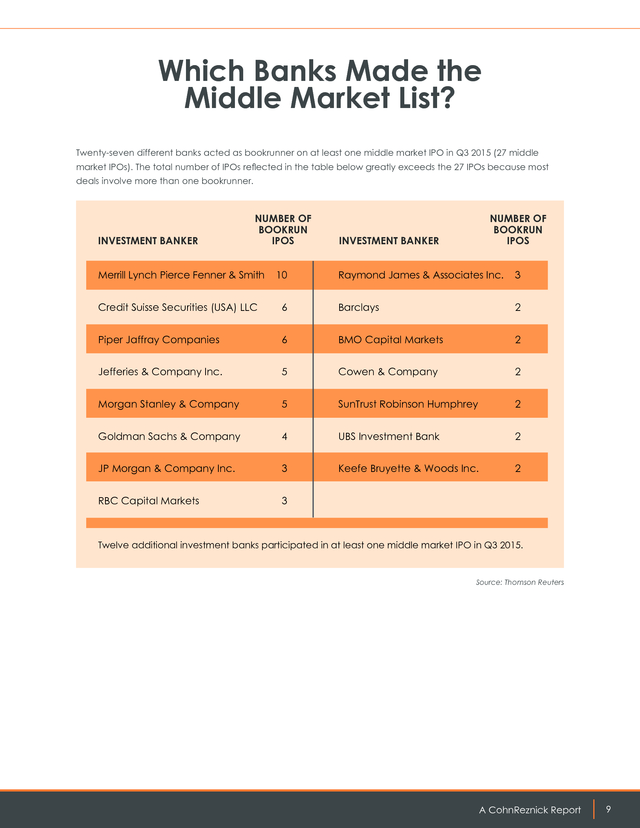
Which Banks Made the Middle Market List? Twenty-seven different banks acted as bookrunner on at least one middle market IPO in Q3 2015 (27 middle market IPOs). The total number of IPOs reflected in the table below greatly exceeds the 27 IPOs because most deals involve more than one bookrunner. INVESTMENT BANKER NUMBER OF BOOKRUN IPOS Merrill Lynch Pierce Fenner & Smith 10 NUMBER OF BOOKRUN IPOS INVESTMENT BANKER Raymond James & Associates Inc. 3 Credit Suisse Securities (USA) LLC 6 Barclays 2 Piper Jaffray Companies 6 BMO Capital Markets 2 Jefferies & Company Inc. 5 Cowen & Company 2 Morgan Stanley & Company 5 SunTrust Robinson Humphrey 2 Goldman Sachs & Company 4 UBS Investment Bank 2 JP Morgan & Company Inc. 3 Keefe Bruyette & Woods Inc. 2 RBC Capital Markets 3 Twelve additional investment banks participated in at least one middle market IPO in Q3 2015. Source: Thomson Reuters A CohnReznick Report 59 . SUMMARY AND FORECAST If economic and market conditions remain volatile, we are likely to continue to see a decreasing number of IPOs. Only those companies with the best case for becoming a public entity will be brought to market. With fewer companies pricing IPOs, and with continued interest from investors, the principles of supply and demand would suggest that valuations and proceeds raised will remain lofty. The continued availability of capital and competition for investments in the private market may draw even more companies away from the IPO as a source of capital. As we look forward, we see strengthening economic fundamentals continuing in the U.S.
economy, and unless new global concerns arise, markets should stabilize. Market stabilization decreases volatility, increases confidence, and provides solid ground for increased IPO activity. In the near term, the U.S. economy will navigate its way through a probable interest rate hike, potential turmoil relative to the spending plan to fund the federal government, which expires in December, “ and a presidential election in 2016.
All of which are likely to make the end of 2015 and 2016 a very interesting time indeed. Strategic investors continue to have access to significant amounts of capital and in many cases can leverage greater value from an acquisition. As such, they are in a better position to justify higher valuations and pay higher purchase prices. Even private equity and venture capital investors are finding it challenging to compete for deals.
We think that middle market Technology companies that once considered the IPO as the source for the highest valuations are finding equal if not greater valuations in the private market. That’s one of the major reasons for the fall-off in Technology sector IPOs.” ALEX CASTELLI COHNREZNICK PARTNER, TECHNOLOGY AND LIFE SCIENCES INDUSTRY PRACTICE LEADER 10 Middle Market Equity Capital Report ― October 2015 . About CohnReznick’s Public Companies Group Utilizing comprehensive resources and deep industry expertise, the professionals of CohnReznick’s Public Companies Group understand the goals of both middle market companies and investors to deliver timely and appropriate solutions and services. We understand the challenges and opportunities of the capital markets and possess the forward thinking technical skills and experience necessary to address the needs of clients, investment bankers, investment advisors, attorneys, lenders, investors, managements, audit committees, and the U.S. Securities and Exchange Commission and other regulatory authorities. • • • • • • • • • • • • • • • Alex Castelli, CPA, Partner, Technology and Life Sciences Industry National Practice Leader Anton Cohen, CPA, Partner, Renewable Energy Industry Practice Co-National Director Dom Esposito, CPA, Partner George Gallinger, Principal, CohnReznick Advisory Group − Governance, Risk, and Compliance National Director Craig Golding, CPA, Partner, Technology and Life Sciences Industry Practice Tim Kemper, CPA, Partner, Renewable Energy Industry Practice Co-National Director David Kessler, CPA, Partner, Commercial Real Estate Industry Practice National Director Adam Kleeman, CPA, Partner, Commercial Real Estate Industry Practice Gary Levy, CPA, Partner, Hospitality Industry Practice Leader Cindy McLoughlin, CPA, Partner, Hospitality Industry Practice Steven Schenkel, CPA, Partner, Chief Risk Officer Richard Schurig, CPA, Partner, Retail and Consumer Products Industry Practice Leader Mark Spelker, CPA, Partner, National Director of SEC Services Jeremy Swan, Principal, CohnReznick Advisory Stephen Wyss, CPA, Partner, Retail and Consumer Products Industry Practice CohnReznick Advantage for Capital Markets Industry Insights, Optimized Solutions • Partners immersed in supporting public companies and capital markets transactions who understand your business drivers. • Support from industry specialists to offer comprehensive industry-specific solutions and insights. • Engagement teams utilize the Firm’s broad resources to provide innovative solutions and breakthrough ideas. Transformative Advice • Timely, relevant views about critical economic, business, legislative, tax, and global news and emerging trends in the capital markets. • Thought leadership reports, alerts, conferences, and events delivered in the context of what these issues mean to public companies, companies considering a public filing, the capital markets, and your business. Responsive Culture • Our partners are empowered and entrepreneurial decision makers. • They draw on our depth of knowledge and expertise to provide faster, smarter, more efficient service. Capital Markets Dexterity • Preparation, valuation, structuring, and facilitation of capital markets transactions, and introductions to capital sources. • Assistance with acquisitions, dispositions, liquidity events, and other capital-raising needs. Proactive, Resourceful Service • A true partner-led service model ensures direct access and active partner management. • Accountability and expectations are developed to meet your needs and documented in the CohnReznick Client Service Plan. National and Global Reach • With offices in 30 cities, we seamlessly and cost-efficiently serve clients on a regional, national, and international basis. • Companies with international interests in 100+ countries are served through our membership in Nexia International, a global network of independent accountancy, tax, and business advisors. A CohnReznick Report 11 . 1212 Avenue of the Americas New York, NY 10036 212-297-0400 www.cohnreznick.com CohnReznick is an independent member of Nexia International CohnReznick LLP © 2015 Any advice contained in this communication, including attachments and enclosures, is not intended as a thorough, in-depth analysis of specific issues. Nor is it sufficient to avoid tax-related penalties. This has been prepared for information purposes and general guidance only and does not constitute professional advice. You should not act upon the information contained in this publication without obtaining specific professional advice. No representation or warranty (express or implied) is made as to the accuracy or completeness of the information contained in this publication, and CohnReznick LLP, its members, employees and agents accept no liability, and disclaim all responsibility, for the consequences of you or anyone else acting, or refraining to act, in reliance on the information contained in this publication or for any decision based on it. 17 A CohnReznick Report 8 .
4 Middle Market Industry Insights ......................................................................................... 6 Middle Market Snapshot .................................................................................................... 7 Middle Market Follow-on Activity......................................................................................
8 Which Banks Made the Middle Market List? .................................................................... 9 Summary and Forecast .................................................................................................... 10 About CohnReznick’s Public Companies Group ..........................................................
11 2 Middle Market Equity Capital Report ― July 2015 . PREFACE Compared to 2014, IPO activity in 2015 has been lagging and Q3 was no exception. Market volatility triggered by international news from Greece and China for example, and from uncertainty on domestic interest rate policies, may have kept some investors on the sidelines. Further contributing to the decreased number of IPOs is the continued availability of private capital. Private equity and strategic investors Dom Esposito Alex Castelli offer prospective acquisitions an attractive combination of financial and intellectual “ capital and without the costs or regulatory and reporting requirements associated with life as a public company. WE THINK BUSINESSES, THAT BELIEVE THE IPO TO BE THE MOST APPROPRIATE FORM OF CAPITAL, SHOULD CONTINUE TO EXPLORE IT AS AN OPTION AND PREPARE ACCORDINGLY. Despite the lag in the number of IPOs, we We think businesses, that believe the IPO to be the most appropriate form of capital, should continue to explore it as an option and prepare accordingly. Once ready, a company can access the public markets when the timing makes most sense. Today, global markets appear to be volatile. And volatility erodes confidence. Public equity capital transactions prefer a greater degree of stability.
Therefore, if current market conditions persist, we are likely to continue to see fewer IPOs when compared to last year’s record breaking levels. We hope you ï¬nd the contents of our Q3 Middle Market Equity Capital Report to be interesting and insightful. believe that high quality deals will continue to rise to the top and, when they do, they will be recognized and rewarded by investors. In Q3 2015, average proceeds raised per middle market IPO increased to $182 million from $125 million in the prior year. Market uncertainty may have eroded some investor and issuer confidence for the short term, but there seems to be continued interest Dom Esposito Alex Castelli CPA, Partner, CohnReznick’s National Liquidity and Capital Formation Advisory Group CPA, Partner, CohnReznick’s National Liquidity and Capital Formation Advisory Group when the right company prices an IPO. And for those companies, the IPO continues to be a viable source of capital. A CohnReznick Report 1 .
HIGHLIGHTS Broad Market Observations • The number of IPOs in Q3 2015 decreased by 41% when compared to Q3 2014. • IPO transaction activity through the first nine months of the year decreased by 34% year over year. • If IPO activity continues at its current pace, the U.S. economy is projected to produce about 200 IPOs compared to 307 in 2014 and 255 in 2013. Middle Market Observations • In Q3, IPO activity in the middle market (companies with market caps between $10 million and $2 billion) dropped 53% versus prior year. • Through the first nine months of 2015, middle market IPO activity decreased 37% year over year. • Aggregate proceeds from middle market IPOs decreased to $4.9 billion in Q3 2015 from “ $7.1 billion in Q3 2014. • Average proceeds per transaction increased Initial public offerings remain a viable option for growth oriented Healthcare and Life Sciences companies. Looking ahead, economic and market conditions will influence the timing and the projected pricing of an IPO or follow-on. In this kind of an environment, the role of the underwriter is critical.” CRAIG GOLDING COHNREZNICK PARTNER, TECHNOLOGY AND LIFE SCIENCES INDUSTRY PRACTICE to $182 million in Q3 2015.
When compared year over year—an increase of nearly 46%. Industry Speciï¬c Observations • IPO activity in the healthcare and life sciences sectors totaled 44% of all Q3 2015 IPOs. • Technology sector IPOs dipped to three in Q3 2015, representing a decline of 50% when compared to Q3 2014. Additional Observations • Smaller IPOs (those raising $50 million or less in proceeds) declined by 50%, decreasing to seven in Q3 2015 compared to 14 in Q3 2014. • Follow-on transactions in the middle market decreased to 121 in Q3 2015 from 157 year over year—a 23% decline. • From an industry perspective, healthcare and life sciences sectors combined tallied 48% of all middle market follow-on transactions. 2 Middle Market Equity Capital Report ― October 2015 . Q3 IPO ACTIVITY “ Despite continued growth in the Renewable Energy industry, Q3 brought a downturn in YieldCo stock price performance. Looking forward, we think that this downturn could lead to additional consolidation. Investors, like private equity and pension funds with longer investment strategies, may stand to benefit from today’s market conditions as short-term investors, like hedge funds, exit their early positions. We expect to see the composition of the investor pool change as the public YieldCo market evolves.” ANTON COHEN COHNREZNICK PARTNER, RENEWABLE ENERGY INDUSTRY PRACTICE CO-NATIONAL DIRECTOR Volatility in the financial markets exerted downward pressure on IPO activity in IPO Activity by Quarter 78 Q3 2015. The economic climates in Greece and China contributed to increased levels of market volatility as did the uncertainty of the Federal Reserve’s timing of raising interest rates. 69 57 69 60 53 We think that the continued access to private capital is detracting activity 40 from the public markets.
Financial and strategic investors seem willing to reward 41 33 27 acquisitions with high valuations. In Q3, IPOs priced on U.S. exchanges dropped 41% over the same period in 2014.
Through the first three quarters of 2015, 150 IPOs were issued compared to 229 through the first three quarters of 2014—a drop of 34%. Q3 - 2014 Q4 - 2014 All IPOs Q1 - 2015 Q2 - 2015 Q3 - 2015 Middle Market IPOs Source: Thomson Reuters A CohnReznick Report 3 . MIDDLE MARKET INSIGHTS In the United States, the middle market is a powerful engine for growth. Comprised of nearly Middle Market IPOs Decrease 200,000 businesses, the middle market equates 69 to the fifth largest global economy with annual revenues in excess of $10 trillion1. In focusing on 57 access to capital and transaction activity within the middle market, we gain greater insight into broader shifts in the U.S. economy.
Increased 41 access to capital and capital transactions activity in the middle market is a lever for 27 increased health of the broader U.S. economy. Unfortunately, Q3 IPO activity in the middle Down 53% Down 41% market dropped 53% over the same period in 2014. Twenty-seven middle market IPOs priced in Q3 2015, compared with 57 in Q3 2014.
Year to date, 113 middle market IPOs were issued Middle Market IPOs All IPOs compared to 179 through the first three quarters Q3 2014 of 2014. Q3 2015 Source: Thomson Reuters Even amidst decreasing middle market IPO activity, the IPO should remain a viable consideration when companies need capital. Proceeds If an IPO offers a business the best strategic solution to its capital needs, it may be best While there were fewer middle market IPOs, the average to get ready and, with the help of qualified transaction size increased by almost 46%, reinforcing the advisors, evaluate the decision to go public sense that investor demand remains strong despite current based upon economic and market conditions. market volatility and uncertainty. In Q3 2015, the average proceeds raised per middle market IPO were $182 million. While in Q3 2014, the average proceeds raised were $125 million. Middle Market Proceeds Middle Market Sub-Segments Q3 - 2014 Number of Deals Nano Cap ($10 - $99 million) 6 Proceeds $ Q3 - 2015 Number of Deals Proceeds 134,000,000 4 $ 72,000,000 $ 732,000,000 Micro Cap ($100 - $499 million) 34 $ 2,406,000,000 8 Small Cap ($500 mil - $2 billion) 17 $ 4,595,000,000 15 $ 4,122,000,000 TOTAL 57 $ 7,135,000,000 27 $ 4,926,000,000 Source: Thomson Reuters 1 4 National Center for the Middle Market Middle Market Equity Capital Report ― October 2015 . Middle Market Pricing vs. Initial Filing 16% 17% 17% 24% 26% 32% 45% 49% 62% 59% 52% 38% Q3 2014 27% Q4 2014 Below Filing Range 21% Q1 2015 Q2 2015 Within Filing Range 15% Q3 2015 Above Filing Range Source: Thomson Reuters Pricing Smaller IPOs In Q3 2015, 85% of middle market IPOs priced at or above Smaller IPOs (those raising $50 million or less in proceeds) the initial filing range. In Q3 2014, only 48% priced at or declined by 50%, decreasing to seven in Q3 2015 above their filing range. The improvement in middle market compared to 14 in Q3 2014 and 10 in 2013.
Even though pricing is good news for issuers who, all else equal, various components of the JOBS Act have helped depend on raising a specific amount of proceeds from stimulate access to capital, many smaller issuers still find an offering. In this market, only higher quality issues are the IPO process to be expensive and onerous. Current making their way to market, are warmly greeted by market conditions suggest that accessing private capital investors, and are therefore pricing at or above their is potentially more efficient and equally, if not more, initial filing range.
There are several factors that influence economically rewarding. Though too early to gauge its pricing—economic conditions, market conditions, impact, the recently updated Regulation A, referred to readiness of the company, timing, the right underwriters, as “Regulation A+,” may help build a stronger bridge for and the right industry sector. smaller issuers who hope to access the public markets. A CohnReznick Report 5 . MIDDLE MARKET INDUSTRY INSIGHTS Healthcare and life sciences IPO activity totalled 44% of all Q3 2015 IPOs signaling their continued confidence in the IPO as the right form of capital to support long development and regulatory approval processes. Technology sector IPOs dipped to three in Q3 2015, representing a decline of 50% when compared to Q3 2014, reinforcing the indication that technology companies are seeking alternative sources of capital from private equity, venture capital and strategic investors. “ In terms of IPO activity, the Restaurant sector has been a steady performer since 2012. True, there were no Restaurant IPOs in Q3, but industry insiders indicate that five or more IPOs are rumored for 2016. In terms of valuations, the fast casual sub-segment has performed better than quick service restaurants and full service concepts.” CINDY MCLOUGHLIN COHNREZNICK PARTNER, HOSPITALITY INDUSTRY PRACTICE Q3 Middle Market IPO 2014-2015 Comparison Q3 2015 Other 12% Retail Technology 11% Real Estate 7% Energy and Utilities 37% 4% 13% Technology 11% 5% Life Sciences 11% 16% 42% Financial Services 11% Financial Services 7% Healthcare 62 Other Hospitality 2% 11% Energy and Utilities Q3 2014 Healthcare Life Sciences Middle Market Equity Capital Report ― October 2015 Source: Thomson Reuters . Middle Market Snapshot Analyzing Middle Market IPOs CohnReznick’s Middle Market Snapshot analyzes IPOs conducted by middle market companies―regardless of proceeds generated. CohnReznick defines the middle market as companies with $10 million to $2 billion in market capitalization post initial public offering. Number of IPOs Proceeds ($B) Average Deal Size ($M) 53 31 46 % Q3 2014 57 Q3 2015 27 % Q3 2014 7.1 Q3 2015 4.9 Q3 2014 Q3 2014 % Q3 2015 125 Middle Market IPO Activity Middle market IPOs were down in Q3 2015, total proceeds decreased by 31%. Average proceeds per transaction increased by 46%. 182 Q3 2015 34 17 6 Nano Cap 15 8 4 Micro Cap Small Cap ($10-$99 million) ($100-$499 million) ($500 mil-$2 billion) Q3 2014 Nano Cap ($10-$99 million) Micro Cap Small Cap ($100-$499 million) ($500 mil-$2 billion) $4,122 $2,406 Nano Cap Micro Cap Small Cap Companies Filing as EGCs Filing as an Emerging Growth Company (EGC) helps middle market companies access the IPO on-ramp by utilizing the “Testing the Waters” and “Confidential Filing” provisions of the JOBS Act. Nano Cap Micro Cap Proceeds of Middle Market IPOs by Sub-Segment Proceeds from micro cap IPOs showed a 70% decrease in Q3 2015 compared to Q3 2014 while proceeds from nanocap IPOs declined 46%. $732 $72 ($10-$99 million) ($100-$499 million) ($500 mil-$2 billion) Micro-cap and small-cap IPOs represented 85% of middle market IPOs in Q3 2015. Q3 2015 $4,595 $134 Number of Middle Market IPOs by Sub-Segment Small Cap ($10-$99 million) ($100-$499 million) ($500 mil-$2 billion) Private EquityBacked IPOs Companies Filing as EGCs 84 100 % % Q3 2014 Q3 2015 48/57 27/27 In Q3 2015, 59% of middle market IPOs were backed by private equity compared to 63% in Q3 2014. Private Equity-Backed IPOs 63 59 % Q3 2014 Q3 2015 36/57 % 16/27 Source: Thomson Reuters A CohnReznick Report 7 . MIDDLE MARKET FOLLOW-ON ACTIVITY Middle Market Follow-Ons by Industry Q3 2015 Middle market follow-on activity Other decreased to 121 in Q3 2015 from 157 in Q3 2014. The 23% decrease is Retail far smaller than the decrease of 53% Real Estate in middle market IPO transactions for the same time periods. Energy and Ulitities Average proceeds from middle market follow-on transactions Financial Services in Q3 2015 were $69 million (compared to $64 million) year Technology 12% 5% 17% 3% 8% 7% 36% 12% over year—an increase of 8%. Life Sciences Follow-On Activity by Industry Healthcare Q3 2014 Q3 2015 Healthcare and Life Sciences sectors follow-on activity Technology Other both in absolute numbers and on a percentage basis increased 17% year over year. In Q3 2015 there Retail were 58 follow-on transactions up from 28 year over year. Healthcare Hospitality 1% and Life Sciences follow-ons represented 48% of all middle Real Estate market follow-ons in Q3 2015, an increase from 18% in Q3 2014. 19% 6% 10% 14% Q3 - 2014 Number of Deals 3% 16% Healthcare Energy and Ulitities Follow-Ons by Middle Market Subsegment Life Sciences 15% Financial Services Q3 - 2015 Proceeds Number of Deals Proceeds Nano Cap 63 $ 501,000,000 40 $ Micro Cap 42 $ 2,401,000,000 36 $ 1,517,000,000 Small Cap 52 $ 7,144,000,000 45 $ 6,485,000,000 $ 10,046,000,000 121 $ 8,328,000,000 TOTAL 157 326,000,000 Source: Thomson Reuters 4 8 Middle Market Equity Capital Report ― October 2015 .
Which Banks Made the Middle Market List? Twenty-seven different banks acted as bookrunner on at least one middle market IPO in Q3 2015 (27 middle market IPOs). The total number of IPOs reflected in the table below greatly exceeds the 27 IPOs because most deals involve more than one bookrunner. INVESTMENT BANKER NUMBER OF BOOKRUN IPOS Merrill Lynch Pierce Fenner & Smith 10 NUMBER OF BOOKRUN IPOS INVESTMENT BANKER Raymond James & Associates Inc. 3 Credit Suisse Securities (USA) LLC 6 Barclays 2 Piper Jaffray Companies 6 BMO Capital Markets 2 Jefferies & Company Inc. 5 Cowen & Company 2 Morgan Stanley & Company 5 SunTrust Robinson Humphrey 2 Goldman Sachs & Company 4 UBS Investment Bank 2 JP Morgan & Company Inc. 3 Keefe Bruyette & Woods Inc. 2 RBC Capital Markets 3 Twelve additional investment banks participated in at least one middle market IPO in Q3 2015. Source: Thomson Reuters A CohnReznick Report 59 . SUMMARY AND FORECAST If economic and market conditions remain volatile, we are likely to continue to see a decreasing number of IPOs. Only those companies with the best case for becoming a public entity will be brought to market. With fewer companies pricing IPOs, and with continued interest from investors, the principles of supply and demand would suggest that valuations and proceeds raised will remain lofty. The continued availability of capital and competition for investments in the private market may draw even more companies away from the IPO as a source of capital. As we look forward, we see strengthening economic fundamentals continuing in the U.S.
economy, and unless new global concerns arise, markets should stabilize. Market stabilization decreases volatility, increases confidence, and provides solid ground for increased IPO activity. In the near term, the U.S. economy will navigate its way through a probable interest rate hike, potential turmoil relative to the spending plan to fund the federal government, which expires in December, “ and a presidential election in 2016.
All of which are likely to make the end of 2015 and 2016 a very interesting time indeed. Strategic investors continue to have access to significant amounts of capital and in many cases can leverage greater value from an acquisition. As such, they are in a better position to justify higher valuations and pay higher purchase prices. Even private equity and venture capital investors are finding it challenging to compete for deals.
We think that middle market Technology companies that once considered the IPO as the source for the highest valuations are finding equal if not greater valuations in the private market. That’s one of the major reasons for the fall-off in Technology sector IPOs.” ALEX CASTELLI COHNREZNICK PARTNER, TECHNOLOGY AND LIFE SCIENCES INDUSTRY PRACTICE LEADER 10 Middle Market Equity Capital Report ― October 2015 . About CohnReznick’s Public Companies Group Utilizing comprehensive resources and deep industry expertise, the professionals of CohnReznick’s Public Companies Group understand the goals of both middle market companies and investors to deliver timely and appropriate solutions and services. We understand the challenges and opportunities of the capital markets and possess the forward thinking technical skills and experience necessary to address the needs of clients, investment bankers, investment advisors, attorneys, lenders, investors, managements, audit committees, and the U.S. Securities and Exchange Commission and other regulatory authorities. • • • • • • • • • • • • • • • Alex Castelli, CPA, Partner, Technology and Life Sciences Industry National Practice Leader Anton Cohen, CPA, Partner, Renewable Energy Industry Practice Co-National Director Dom Esposito, CPA, Partner George Gallinger, Principal, CohnReznick Advisory Group − Governance, Risk, and Compliance National Director Craig Golding, CPA, Partner, Technology and Life Sciences Industry Practice Tim Kemper, CPA, Partner, Renewable Energy Industry Practice Co-National Director David Kessler, CPA, Partner, Commercial Real Estate Industry Practice National Director Adam Kleeman, CPA, Partner, Commercial Real Estate Industry Practice Gary Levy, CPA, Partner, Hospitality Industry Practice Leader Cindy McLoughlin, CPA, Partner, Hospitality Industry Practice Steven Schenkel, CPA, Partner, Chief Risk Officer Richard Schurig, CPA, Partner, Retail and Consumer Products Industry Practice Leader Mark Spelker, CPA, Partner, National Director of SEC Services Jeremy Swan, Principal, CohnReznick Advisory Stephen Wyss, CPA, Partner, Retail and Consumer Products Industry Practice CohnReznick Advantage for Capital Markets Industry Insights, Optimized Solutions • Partners immersed in supporting public companies and capital markets transactions who understand your business drivers. • Support from industry specialists to offer comprehensive industry-specific solutions and insights. • Engagement teams utilize the Firm’s broad resources to provide innovative solutions and breakthrough ideas. Transformative Advice • Timely, relevant views about critical economic, business, legislative, tax, and global news and emerging trends in the capital markets. • Thought leadership reports, alerts, conferences, and events delivered in the context of what these issues mean to public companies, companies considering a public filing, the capital markets, and your business. Responsive Culture • Our partners are empowered and entrepreneurial decision makers. • They draw on our depth of knowledge and expertise to provide faster, smarter, more efficient service. Capital Markets Dexterity • Preparation, valuation, structuring, and facilitation of capital markets transactions, and introductions to capital sources. • Assistance with acquisitions, dispositions, liquidity events, and other capital-raising needs. Proactive, Resourceful Service • A true partner-led service model ensures direct access and active partner management. • Accountability and expectations are developed to meet your needs and documented in the CohnReznick Client Service Plan. National and Global Reach • With offices in 30 cities, we seamlessly and cost-efficiently serve clients on a regional, national, and international basis. • Companies with international interests in 100+ countries are served through our membership in Nexia International, a global network of independent accountancy, tax, and business advisors. A CohnReznick Report 11 . 1212 Avenue of the Americas New York, NY 10036 212-297-0400 www.cohnreznick.com CohnReznick is an independent member of Nexia International CohnReznick LLP © 2015 Any advice contained in this communication, including attachments and enclosures, is not intended as a thorough, in-depth analysis of specific issues. Nor is it sufficient to avoid tax-related penalties. This has been prepared for information purposes and general guidance only and does not constitute professional advice. You should not act upon the information contained in this publication without obtaining specific professional advice. No representation or warranty (express or implied) is made as to the accuracy or completeness of the information contained in this publication, and CohnReznick LLP, its members, employees and agents accept no liability, and disclaim all responsibility, for the consequences of you or anyone else acting, or refraining to act, in reliance on the information contained in this publication or for any decision based on it. 17 A CohnReznick Report 8 .


