


Description
CohnReznick 2015 Not-for-Profit Governance Survey
A CohnReznick LLP Report
JULY 2015
.
. Table of Contents
Methodology......................................................................................................1
Executive Summary............................................................................................2
Respondent Profile.............................................................................................3
Governance.......................................................................................................7
• Policies and Practices........................................................................................................8
• Risk Management.............................................................................................................10
• Boards and Committees..................................................................................................13
About CohnReznick’s Not-for-Profit and Education Industry Practice.......21
A CohnReznick Report
1
. Methodology
The 2015 CohnReznick Not-for-Profit Governance Survey was distributed via email to
not-for-profit industry professionals and board members across the United States. The
survey was conducted over eight weeks during the spring of 2015.
Based on feedback from our 2014 survey respondents, the 2015 survey was expanded
to 38 questions (27 questions were in last year’s survey). To establish trend data, many
questions included in the 2015 survey had also been asked and answered the previous year.
The majority of questions focused on the not-for-profit organization’s governance and
risk management policies. These included questions about the structure of the Board, its
various committees, and the role each plays in the organization’s governance practices.
470 not-for-profit executives responded to the 2015 CohnReznick Not-for-Profit Governance
Survey―an over 80% increase in responses compared to the 2014 survey.
Our thanks goes to everyone who participated in this survey.
We hope not-for-profits find the results useful as they continue to refine their organizations’ governance policies and discover new ways to avoid risk. 1 2 2015 CohnReznick Not-for-Profit Governance Survey . EXECUTIVE SUMMARY Governance and risk management issues are key concerns for the leaders of not-for-profit organizations. This was confirmed through the responses we received in CohnReznick’s 2015 Not-for-Profit Governance Survey. While the vast majority of survey respondents (87%) told us that they had implemented key governance initiatives, about 40% of the organizations said that they are either “somewhat” or “not confident” in their governance practices. With the proliferation of high profile security breaches occurring among well-known companies, we were not surprised that many not-for-profit organizations have doubts surrounding their governance and risk management programs. Just under one-third of survey respondents said that their organization had conducted an enterprise risk management assessment.
This could certainly be one of the more significant factors in the large percentage of respondents stating that they are either somewhat or not confident in their governance practices. Additionally, while nearly three quarters of survey respondents said that their annual board meetings include an educational component, only half said that governance was a topic discussed in board meetings. Less than 20% said that risk management was covered and 25% said that regulatory concerns were covered in board meetings. One of the issues impacting confidence in governance practices is cybersecurity.
Cybersecurity ranked among the top 10 risk issues for just under 60% of the surveyed organizations and among the top three risk issues for one in four organizations. So, in a time where cyber threats and other risk issues have become more commonplace, how should not-for-profit organizations respond? CohnReznick recommends the following best practices: 1. A committee of the board should be dedicated to overseeing risk management. Audit committees usually take on this responsibility as these committees typically include directors with risk management skills. 2. A committee of the board should be charged with monitoring IT. Whether it’s the finance, executive, or audit committee, the committee should include experienced IT professionals with clearly established objectives and monitoring responsibilities. 3. Not-for-profit organizations should consider conducting several critical assessments in conjunction with their overall governance practices.
These include: a. An assessment of the organization’s risk management and cybersecurity policies and procedures b. An assessment designed to ensure that the organization’s governance practices comply with the current laws within their state and known best governance practices c.
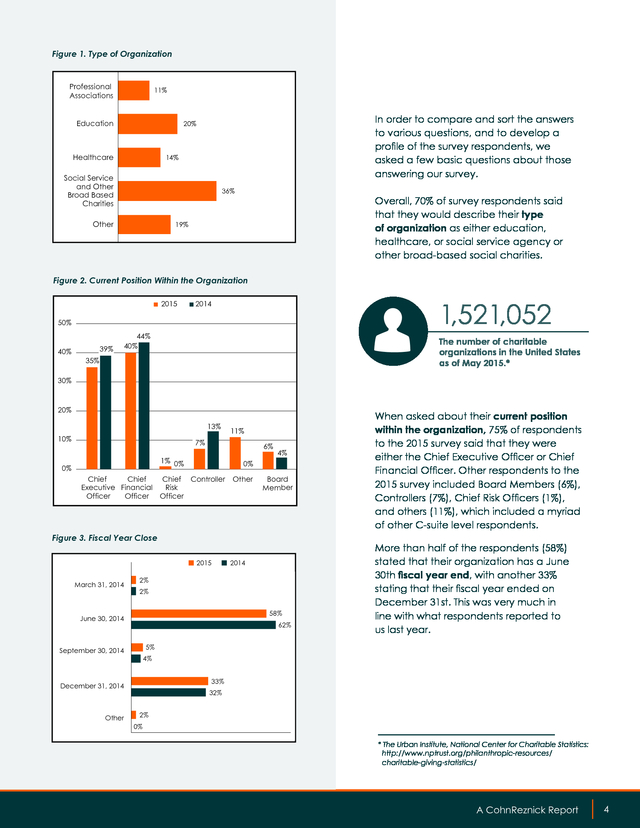
A board self-assessment at least every three years 4. Include risk management and cybersecurity topics in the educational programs presented during board meetings. This will help to ensure that management and board members are fully aware of the latest developments and apprised of potential threats to their organization. Kelly Frank, CPA, CGMA Partner Not-For-Profit and Education Industry Practice Leader kelly.frank@cohnreznick.com John Alfonso, CPA, CGMA Partner Not-For-Profit and Education Industry Practice john.alfonso@cohnreznick.com A CohnReznick Report 2 3 . RESPONDENT PROFILE 3 4 2015 CohnReznick Not-for-Profit Governance Survey . Figure 1. Type of Organization Professional Associations 11% Education In order to compare and sort the answers to various questions, and to develop a profile of the survey respondents, we asked a few basic questions about those answering our survey. 20% Healthcare 14% Social Service and Other Broad Based Charities 36% Other Overall, 70% of survey respondents said that they would describe their type of organization as either education, healthcare, or social service agency or other broad-based social charities. 19% Figure 2. Current Position Within the Organization 2015 1,521,052 2014 50% 40% 39% 44% 40% The number of charitable organizations in the United States as of May 2015.* 35% 30% 20% 13% 10% 11% 7% 6% 1% 0% 0% 4% 0% Chief Chief Chief Controller Executive Financial Risk Officer Officer Officer Other Board Member Figure 3. Fiscal Year Close 2015 March 31, 2014 2% 2% 58% June 30, 2014 62% More than half of the respondents (58%) stated that their organization has a June 30th fiscal year end, with another 33% stating that their fiscal year ended on December 31st.
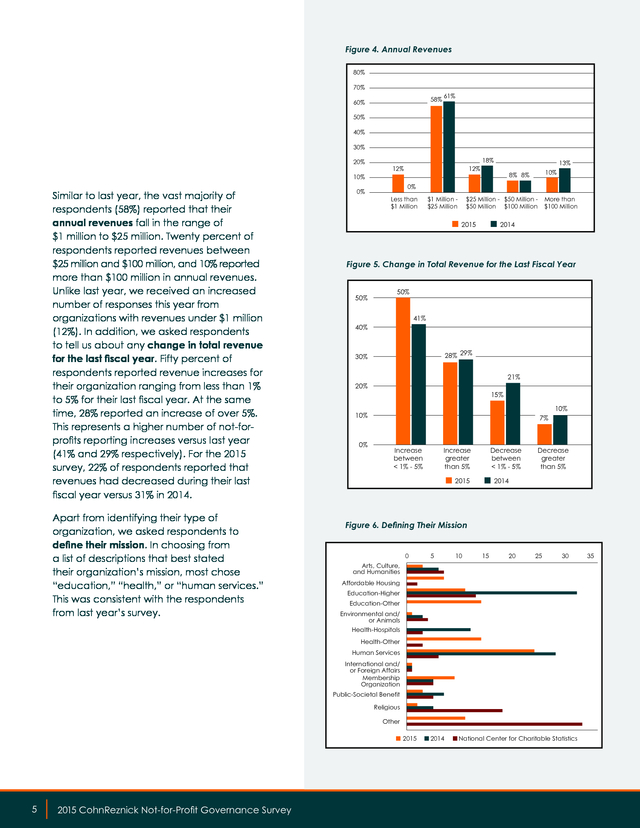
This was very much in line with what respondents reported to us last year. 5% September 30, 2014 4% 33% December 31, 2014 Other 2014 When asked about their current position within the organization, 75% of respondents to the 2015 survey said that they were either the Chief Executive Officer or Chief Financial Officer. Other respondents to the 2015 survey included Board Members (6%), Controllers (7%), Chief Risk Officers (1%), and others (11%), which included a myriad of other C-suite level respondents. 32% 2% 0% * The Urban Institute, National Center for Charitable Statistics: http://www.nptrust.org/philanthropic-resources/ charitable-giving-statistics/ A CohnReznick Report 4 5 . Figure 4. Annual Revenues 80% 70% 58% 60% 61% 50% 40% 30% 20% 10% Similar to last year, the vast majority of respondents (58%) reported that their annual revenues fall in the range of $1 million to $25 million. Twenty percent of respondents reported revenues between $25 million and $100 million, and 10% reported more than $100 million in annual revenues. Unlike last year, we received an increased number of responses this year from organizations with revenues under $1 million (12%). In addition, we asked respondents to tell us about any change in total revenue for the last fiscal year.
Fifty percent of respondents reported revenue increases for their organization ranging from less than 1% to 5% for their last fiscal year. At the same time, 28% reported an increase of over 5%. This represents a higher number of not-forprofits reporting increases versus last year (41% and 29% respectively). For the 2015 survey, 22% of respondents reported that revenues had decreased during their last fiscal year versus 31% in 2014. Apart from identifying their type of organization, we asked respondents to define their mission.
In choosing from a list of descriptions that best stated their organization’s mission, most chose “education,” “health,” or “human services.” This was consistent with the respondents from last year’s survey. 0% 12% 12% 18% 13% 10% 8% 8% 0% Less than $1 Million $1 Million $25 Million $25 Million - $50 Million $50 Million $100 Million 2015 More than $100 Million 2014 Figure 5. Change in Total Revenue for the Last Fiscal Year 50% 50% 41% 40% 28% 29% 30% 21% 20% 15% 10% 10% 0% 7% Increase between < 1% - 5% Increase greater than 5% Decrease between < 1% - 5% 2015 Decrease greater than 5% 2014 Figure 6. Defining Their Mission 0 5 10 15 20 25 30 Arts, Culture, and Humanities Affordable Housing Education-Higher Education-Other Environmental and/ or Animals Health-Hospitals Health-Other Human Services International and/ or Foreign Affairs Membership Organization Public-Societal Benefit Religious Other 2015 5 6 2015 CohnReznick Not-for-Profit Governance Survey 2014 National Center for Charitable Statistics 35 .
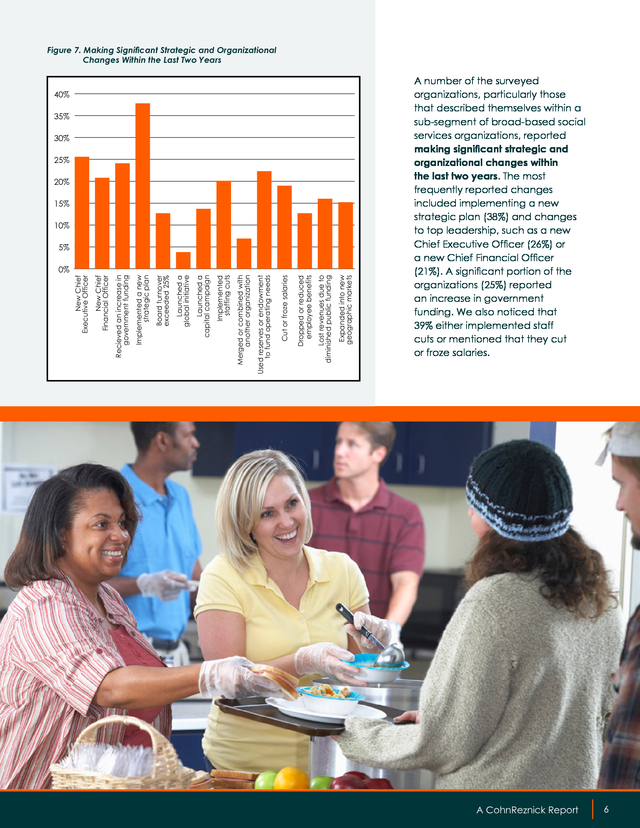
Figure 7. Making Significant Strategic and Organizational Changes Within the Last Two Years 40% 35% 30% 25% 20% 15% 10% 5% Expanded into new geographic markets Lost revenues due to diminished public funding Dropped or reduced employee benefits Cut or froze salaries Used reserves or endowment to fund operating needs Merged or combined with another organization Implemented staffing cuts Launched a capital campaign Launched a global initiative Board turnover exceeded 25% Implemented a new strategic plan Recieved an increase in government funding New Chief Financial Officer New Chief Executive Officer 0% A number of the surveyed organizations, particularly those that described themselves within a sub-segment of broad-based social services organizations, reported making significant strategic and organizational changes within the last two years. The most frequently reported changes included implementing a new strategic plan (38%) and changes to top leadership, such as a new Chief Executive Officer (26%) or a new Chief Financial Officer (21%). A significant portion of the organizations (25%) reported an increase in government funding.
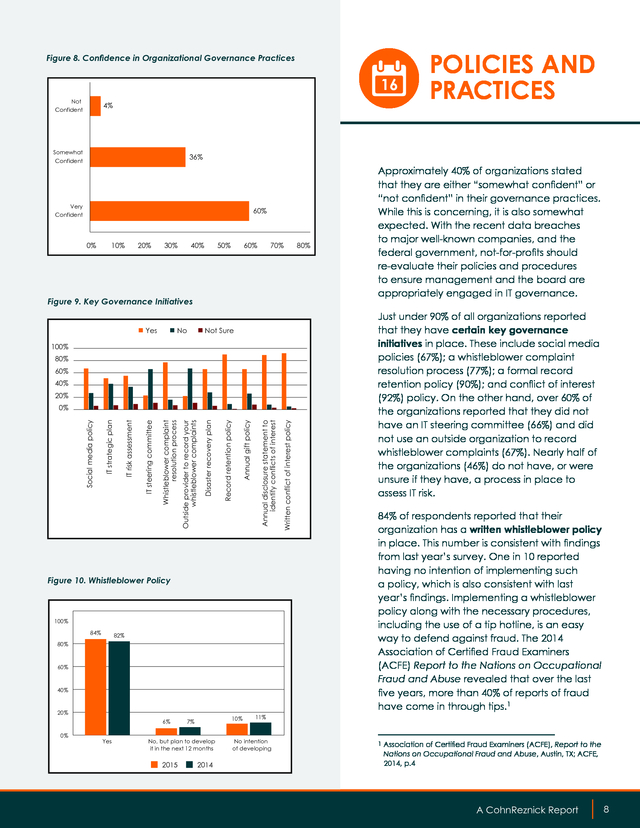
We also noticed that 39% either implemented staff cuts or mentioned that they cut or froze salaries. A CohnReznick Report 6 7 . GOVERNANCE 7 8 2015 CohnReznick Not-for-Profit Governance Survey . Figure 8. Confidence in Organizational Governance Practices 16 Not Confident 4% Somewhat Confident 36% Very Confident 60% 0% 10% 20% 30% 40% 50% 60% 70% Figure 9. Key Governance Initiatives Yes No Not Sure 100% 80% 60% 40% 20% Figure 10. Whistleblower Policy 100% 84% 82% 80% 60% 40% 20% 6% Yes 10% 7% No, but plan to develop it in the next 12 months 2015 2014 Written conflict of interest policy Annual disclosure statement to identify conflicts of interest Annual gift policy Record retention policy Disaster recovery plan Outside provider to record your whistleblower complaints Whistleblower complaint resolution process IT steering committee IT risk assessment IT strategic plan Social media policy 0% 0% POLICIES AND PRACTICES 80% Approximately 40% of organizations stated that they are either “somewhat confident” or “not confident” in their governance practices. While this is concerning, it is also somewhat expected.
With the recent data breaches to major well-known companies, and the federal government, not-for-profits should re-evaluate their policies and procedures to ensure management and the board are appropriately engaged in IT governance. Just under 90% of all organizations reported that they have certain key governance initiatives in place. These include social media policies (67%); a whistleblower complaint resolution process (77%); a formal record retention policy (90%); and conflict of interest (92%) policy. On the other hand, over 60% of the organizations reported that they did not have an IT steering committee (66%) and did not use an outside organization to record whistleblower complaints (67%).
Nearly half of the organizations (46%) do not have, or were unsure if they have, a process in place to assess IT risk. 84% of respondents reported that their organization has a written whistleblower policy in place. This number is consistent with findings from last year’s survey. One in 10 reported having no intention of implementing such a policy, which is also consistent with last year’s findings.
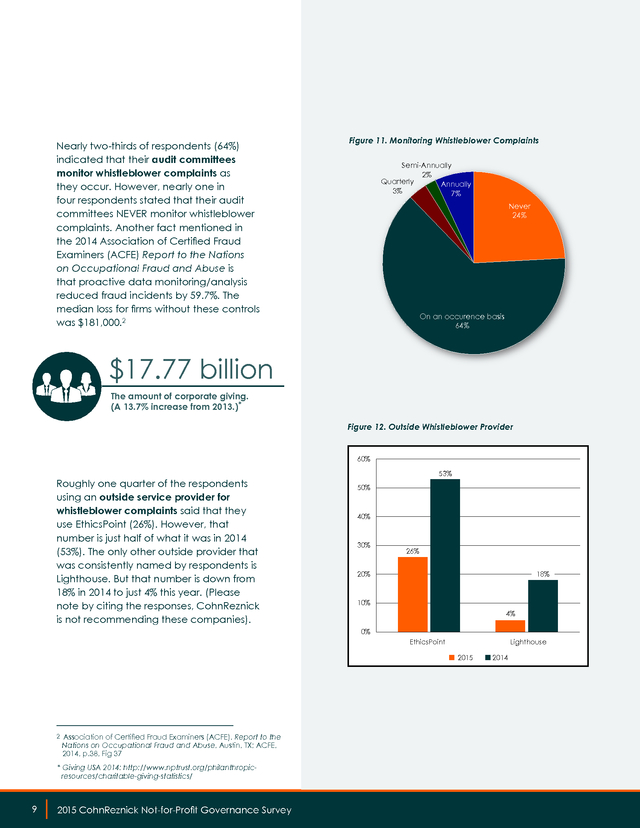
Implementing a whistleblower policy along with the necessary procedures, including the use of a tip hotline, is an easy way to defend against fraud. The 2014 Association of Certified Fraud Examiners (ACFE) Report to the Nations on Occupational Fraud and Abuse revealed that over the last five years, more than 40% of reports of fraud have come in through tips.1 11% No intention of developing 1 Association of Certified Fraud Examiners (ACFE), Report to the Nations on Occupational Fraud and Abuse, Austin, TX; ACFE, 2014, p.4 A CohnReznick Report 8 9 . Nearly two-thirds of respondents (64%) indicated that their audit committees monitor whistleblower complaints as they occur. However, nearly one in four respondents stated that their audit committees NEVER monitor whistleblower complaints. Another fact mentioned in the 2014 Association of Certified Fraud Examiners (ACFE) Report to the Nations on Occupational Fraud and Abuse is that proactive data monitoring/analysis reduced fraud incidents by 59.7%. The median loss for firms without these controls was $181,000.2 Figure 11.
Monitoring Whistleblower Complaints Semi-Annually 2% Quarterly Annually 3% 7% Never 24% On an occurence basis 64% $17.77 billion The amount of corporate giving. (A 13.7% increase from 2013.)* Figure 12. Outside Whistleblower Provider 60% Roughly one quarter of the respondents using an outside service provider for whistleblower complaints said that they use EthicsPoint (26%). However, that number is just half of what it was in 2014 (53%).
The only other outside provider that was consistently named by respondents is Lighthouse. But that number is down from 18% in 2014 to just 4% this year. (Please note by citing the responses, CohnReznick is not recommending these companies). 53% 50% 40% 30% 26% 20% 18% 10% 4% 0% Lighthouse EthicsPoint 2015 2 Association of Certified Fraud Examiners (ACFE), Report to the Nations on Occupational Fraud and Abuse, Austin, TX; ACFE, 2014, p.38, Fig 37 * Giving USA 2014: http://www.nptrust.org/philanthropicresources/charitable-giving-statistics/ 9 10 2015 CohnReznick Not-for-Profit Governance Survey 2014 .
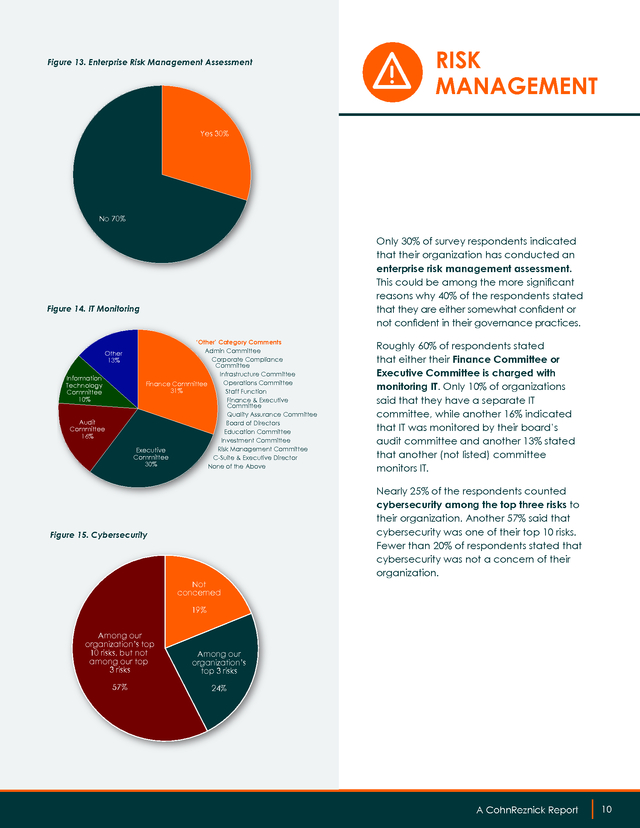
Figure 13. Enterprise Risk Management Assessment . RISK MANAGEMENT Yes 30% No 70% Only 30% of survey respondents indicated that their organization has conducted an enterprise risk management assessment. This could be among the more significant reasons why 40% of the respondents stated that they are either somewhat confident or not confident in their governance practices. Figure 14. IT Monitoring Other 13% Information Technology Committee 10% Audit Committee 16% ‘Other’ Category Comments Admin Committee Corporate Compliance Committee Infrastructure Committee Operations Committee Finance Committee 31% Staff Function Finance & Executive Committee Quality Assurance Committee Board of Directors Education Committee Investment Committee Risk Management Committee Executive Committee C-Suite & Executive Director 30% None of the Above Figure 15. Cybersecurity Not concerned Roughly 60% of respondents stated that either their Finance Committee or Executive Committee is charged with monitoring IT.
Only 10% of organizations said that they have a separate IT committee, while another 16% indicated that IT was monitored by their board’s audit committee and another 13% stated that another (not listed) committee monitors IT. Nearly 25% of the respondents counted cybersecurity among the top three risks to their organization. Another 57% said that cybersecurity was one of their top 10 risks. Fewer than 20% of respondents stated that cybersecurity was not a concern of their organization. 19% Among our organization’s top 10 risks, but not among our top 3 risks Among our organization’s top 3 risks 57% 24% A CohnReznick Report 10 11 . Figure 16. Data Security Spending Over Next 12 Months This is concerning and a bit of a contradiction as just 11% of organizations stated that they had a risk committee or an IT committee later in the survey, with most placing IT monitoring within the audit or finance committees. Also, in the following question, it seems that some organizations (29%) plan to spend more money, some as much as 100% more, than last year on their data security efforts. Just 3% said that they would be spending less. 45% expected their organization would be spending about the same on data security as it did the prior year.
So the question here is: who is really monitoring IT? Whether it’s the finance, executive, or audit committee, we believe that some committee of the board should monitor IT. That committee should include experienced IT professionals and ought to have a set of clear objectives to enable it to fulfill IT monitoring responsibilities. Do you have the right “experts” on your audit and finance committee? When those organizations planning to spend more on data security were asked to give a percentage of the expected increase, nearly half (47%) anticipate a spending increase of 1%-10% over the coming year. 13% of respondents anticipate spending would increase by up to 25%.
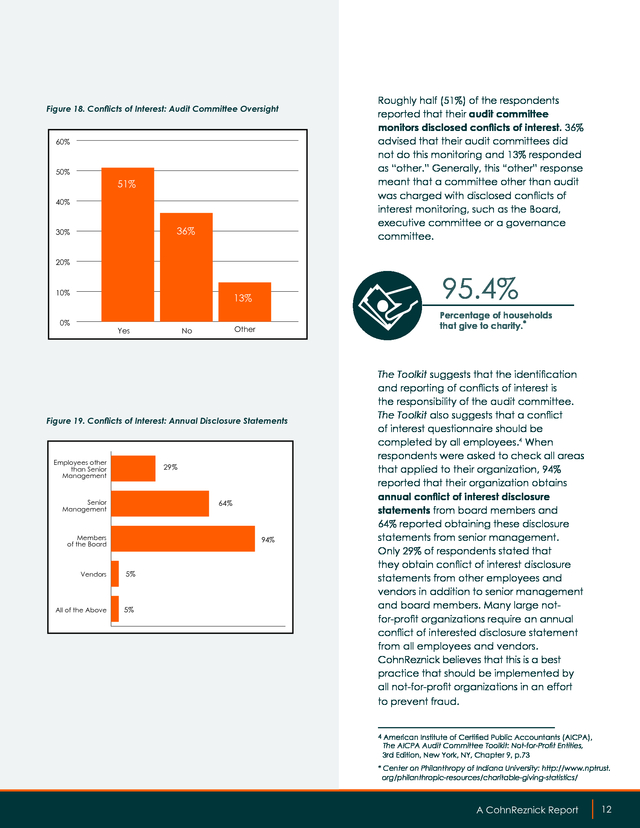
One quarter of respondents said that they were not sure of the level of spending their organization is planning to improve data security over the coming year. CohnReznick advises not-for-profits to have a committee of the board dedicated to the oversight of risk management. Furthermore, we believe audit committees usually take on this stewardship responsibility, as they typically include directors with risk management skills. Less than in the previous 12 months 3% No plans at this time 23% The same as in the previous 12 months 45% More than in the previous 12 months 29% The AICPA Audit Committee Toolkit: Not-for-Profit Entities (“Toolkit”), includes both required and best practices which suggest: • The audit committee could be responsible for the oversight and response to enterprise risk management activities. • The audit committee should periodically reassess the list of top enterprise risks. • The audit committee should determine who in management is responsible for each of these risks.3 Figure 17. Data Security Spending Anticipated Increase/Decrease Not Sure 25% Assessing Now 4% 100%+ 7% 26-50% 4% 3 American Institute of Certified Public Accountants (AICPA), The AICPA Audit Committee Toolkit: Not-for-Profit Entities, 3rd Edition, New York, NY, Chapter 1, p.6 11 12 2015 CohnReznick Not-for-Profit Governance Survey 1-5% 26% 6-10% 21% 11-25% 13% . Figure 18. Conflicts of Interest: Audit Committee Oversight 60% 50% 51% 40% 36% 30% Roughly half (51%) of the respondents reported that their audit committee monitors disclosed conflicts of interest. 36% advised that their audit committees did not do this monitoring and 13% responded as “other.” Generally, this “other” response meant that a committee other than audit was charged with disclosed conflicts of interest monitoring, such as the Board, executive committee or a governance committee. 20% 13% 0% Yes No 95.4% Other 10% Percentage of households that give to charity.* Figure 19. Conflicts of Interest: Annual Disclosure Statements Employees other than Senior Management 29% Senior Management 64% Members of the Board 94% Vendors 5% All of the Above 5% The Toolkit suggests that the identification and reporting of conflicts of interest is the responsibility of the audit committee. The Toolkit also suggests that a conflict of interest questionnaire should be completed by all employees.4 When respondents were asked to check all areas that applied to their organization, 94% reported that their organization obtains annual conflict of interest disclosure statements from board members and 64% reported obtaining these disclosure statements from senior management. Only 29% of respondents stated that they obtain conflict of interest disclosure statements from other employees and vendors in addition to senior management and board members.
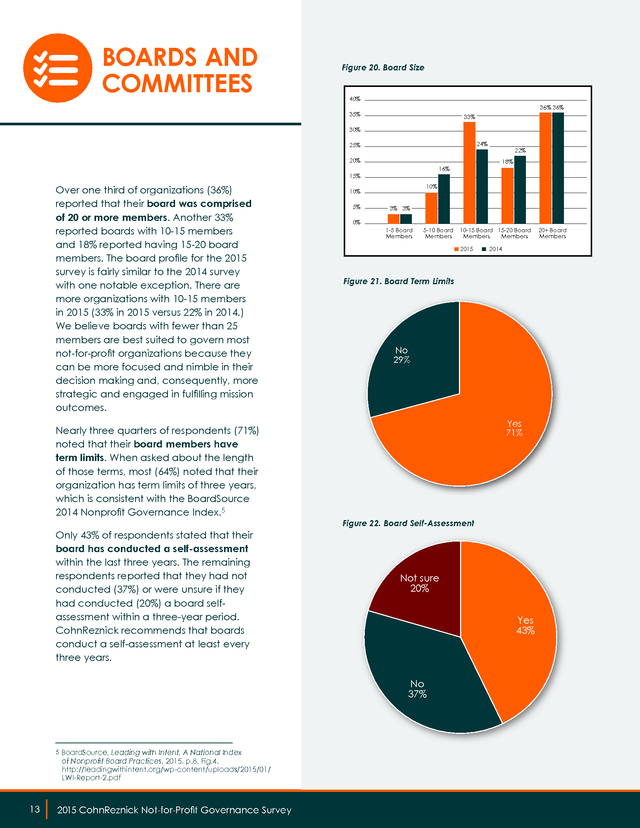
Many large notfor-profit organizations require an annual conflict of interested disclosure statement from all employees and vendors. CohnReznick believes that this is a best practice that should be implemented by all not-for-profit organizations in an effort to prevent fraud. 4 American Institute of Certified Public Accountants (AICPA), The AICPA Audit Committee Toolkit: Not-for-Profit Entities, 3rd Edition, New York, NY, Chapter 9, p.73 * Center on Philanthropy of Indiana University: http://www.nptrust. org/philanthropic-resources/charitable-giving-statistics/ A CohnReznick Report 12 13 . BOARDS AND COMMITTEES Figure 20. Board Size 40% 36% 36% 35% 33% 30% 24% 25% 20% 16% 15% Over one third of organizations (36%) reported that their board was comprised of 20 or more members. Another 33% reported boards with 10-15 members and 18% reported having 15-20 board members. The board profile for the 2015 survey is fairly similar to the 2014 survey with one notable exception.
There are more organizations with 10-15 members in 2015 (33% in 2015 versus 22% in 2014.) We believe boards with fewer than 25 members are best suited to govern most not-for-profit organizations because they can be more focused and nimble in their decision making and, consequently, more strategic and engaged in fulfilling mission outcomes. Nearly three quarters of respondents (71%) noted that their board members have term limits. When asked about the length of those terms, most (64%) noted that their organization has term limits of three years, which is consistent with the BoardSource 2014 Nonprofit Governance Index.5 Only 43% of respondents stated that their board has conducted a self-assessment within the last three years. The remaining respondents reported that they had not conducted (37%) or were unsure if they had conducted (20%) a board selfassessment within a three-year period. CohnReznick recommends that boards conduct a self-assessment at least every three years. 10% 10% 5% 3% 3% 0% 1-5 Board Members 5-10 Board Members of Nonprofit Board Practices, 2015, p.8, Fig.4, http://leadingwithintent.org/wp-content/uploads/2015/01/ LWI-Report-2.pdf 13 14 2015 CohnReznick Not-for-Profit Governance Survey 10-15 Board 15-20 Board Members Members 2015 2014 Figure 21.
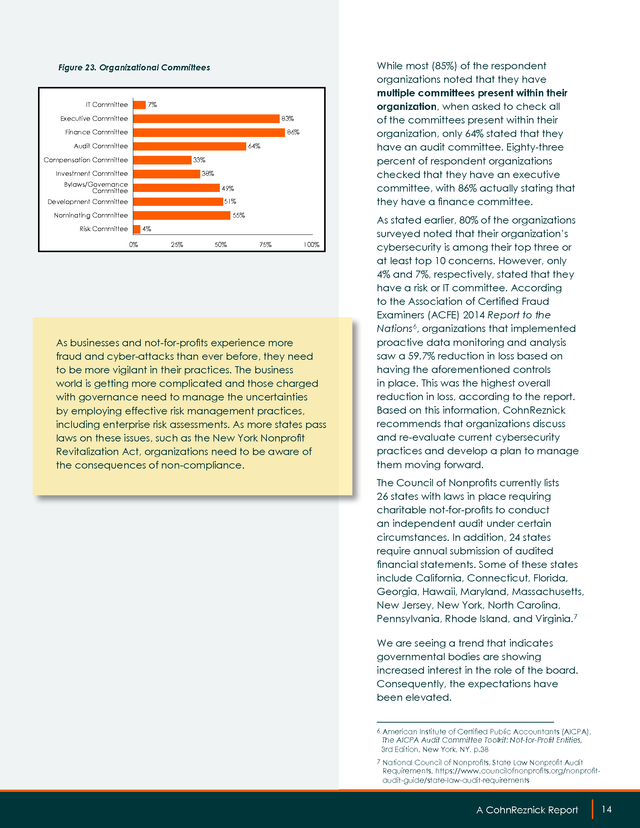
Board Term Limits No 29% Yes 71% Figure 22. Board Self-Assessment Not sure 20% Yes 43% No 37% 5 BoardSource, Leading with Intent, A National Index 22% 18% 20+ Board Members . While most (85%) of the respondent organizations noted that they have multiple committees present within their organization, when asked to check all of the committees present within their organization, only 64% stated that they have an audit committee. Eighty-three percent of respondent organizations checked that they have an executive committee, with 86% actually stating that they have a finance committee. Figure 23. Organizational Committees 7% IT Committee Executive Committee 83% 12% 11% Finance Committee Audit Committee 10% Compensation Committee 86% 64% 33% Investment Committee 38% Bylaws/Governance Committee 49% 51% Development Committee Nominating Committee 55% Risk Committee 4% 0% 25% 50% 75% 100% As businesses and not-for-profits experience more fraud and cyber-attacks than ever before, they need to be more vigilant in their practices. The business world is getting more complicated and those charged with governance need to manage the uncertainties by employing effective risk management practices, including enterprise risk assessments.
As more states pass laws on these issues, such as the New York Nonprofit Revitalization Act, organizations need to be aware of the consequences of non-compliance. As stated earlier, 80% of the organizations surveyed noted that their organization’s cybersecurity is among their top three or at least top 10 concerns. However, only 4% and 7%, respectively, stated that they have a risk or IT committee. According to the Association of Certified Fraud Examiners (ACFE) 2014 Report to the Nations6, organizations that implemented proactive data monitoring and analysis saw a 59.7% reduction in loss based on having the aforementioned controls in place.
This was the highest overall reduction in loss, according to the report. Based on this information, CohnReznick recommends that organizations discuss and re-evaluate current cybersecurity practices and develop a plan to manage them moving forward. The Council of Nonprofits currently lists 26 states with laws in place requiring charitable not-for-profits to conduct an independent audit under certain circumstances. In addition, 24 states require annual submission of audited financial statements. Some of these states include California, Connecticut, Florida, Georgia, Hawaii, Maryland, Massachusetts, New Jersey, New York, North Carolina, Pennsylvania, Rhode Island, and Virginia.7 We are seeing a trend that indicates governmental bodies are showing increased interest in the role of the board. Consequently, the expectations have been elevated. 6 American Institute of Certified Public Accountants (AICPA), The AICPA Audit Committee Toolkit: Not-for-Profit Entities, 3rd Edition, New York, NY, p.38 7 National Council of Nonprofits, State Law Nonprofit Audit Requirements, https://www.councilofnonprofits.org/nonprofitaudit-guide/state-law-audit-requirements A CohnReznick Report 14 15 .
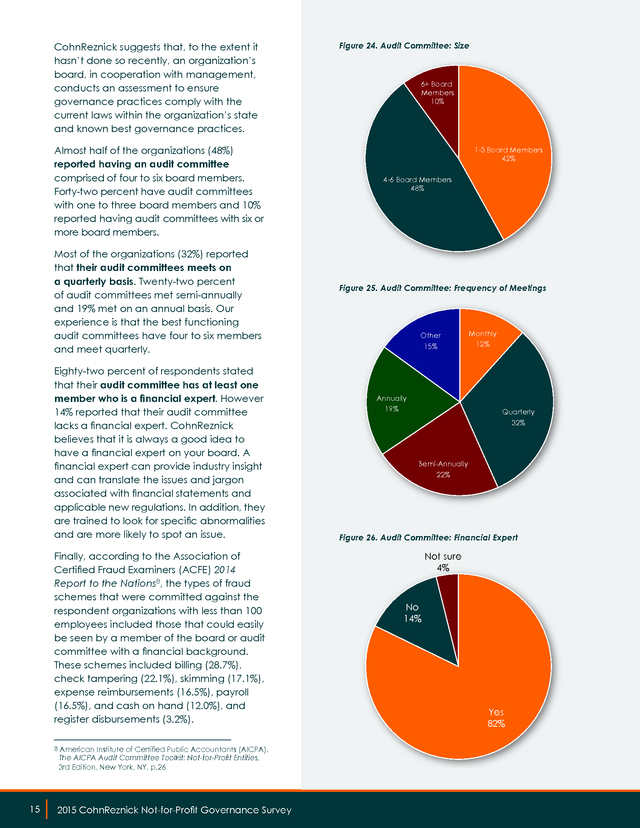
CohnReznick suggests that, to the extent it hasn’t done so recently, an organization’s board, in cooperation with management, conducts an assessment to ensure governance practices comply with the current laws within the organization’s state and known best governance practices. Almost half of the organizations (48%) reported having an audit committee comprised of four to six board members. Forty-two percent have audit committees with one to three board members and 10% reported having audit committees with six or more board members. Most of the organizations (32%) reported that their audit committees meets on a quarterly basis. Twenty-two percent of audit committees met semi-annually and 19% met on an annual basis. Our experience is that the best functioning audit committees have four to six members and meet quarterly. Eighty-two percent of respondents stated that their audit committee has at least one member who is a financial expert. However 14% reported that their audit committee lacks a financial expert.
CohnReznick believes that it is always a good idea to have a financial expert on your board. A financial expert can provide industry insight and can translate the issues and jargon associated with financial statements and applicable new regulations. In addition, they are trained to look for specific abnormalities and are more likely to spot an issue. Finally, according to the Association of Certified Fraud Examiners (ACFE) 2014 Report to the Nations8, the types of fraud schemes that were committed against the respondent organizations with less than 100 employees included those that could easily be seen by a member of the board or audit committee with a financial background. These schemes included billing (28.7%), check tampering (22.1%), skimming (17.1%), expense reimbursements (16.5%), payroll (16.5%), and cash on hand (12.0%), and register disbursements (3.2%). 8 American Institute of Certified Public Accountants (AICPA), The AICPA Audit Committee Toolkit: Not-for-Profit Entities, 3rd Edition, New York, NY, p.26 15 16 2015 CohnReznick Not-for-Profit Governance Survey Figure 24.
Audit Committee: Size 6+ Board Members 10% 1-3 Board Members 42% 4-6 Board Members 48% Figure 25. Audit Committee: Frequency of Meetings Other 15% Annually 19% Monthly 12% Quarterly 32% Semi-Annually 22% Figure 26. Audit Committee: Financial Expert Not sure 4% No 14% Yes 82% .
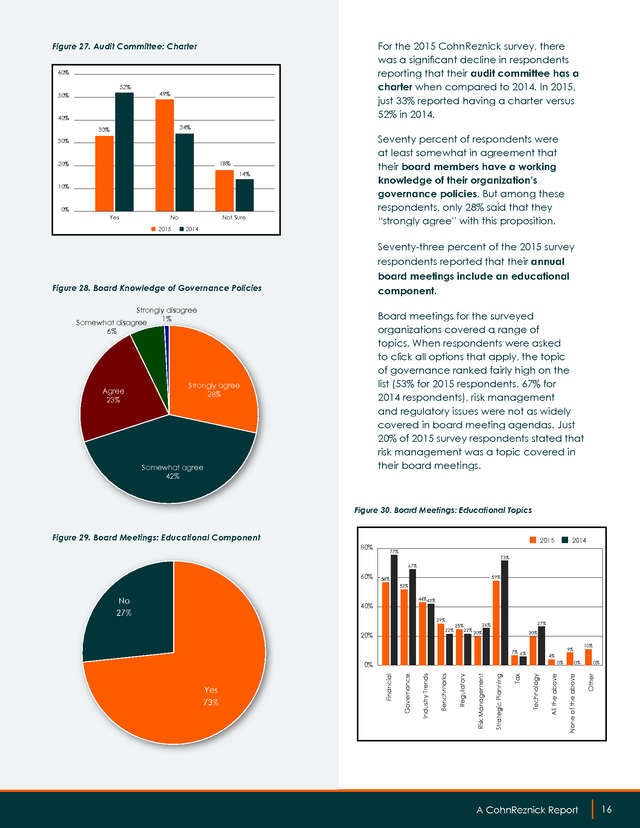
For the 2015 CohnReznick survey, there was a significant decline in respondents reporting that their audit committee has a charter when compared to 2014. In 2015, just 33% reported having a charter versus 52% in 2014. Figure 27. Audit Committee: Charter 60% 52% 49% 50% 40% 34% 33% Seventy percent of respondents were at least somewhat in agreement that their board members have a working knowledge of their organization’s governance policies. But among these respondents, only 28% said that they “strongly agree” with this proposition. 30% 18% 20% 14% 10% 0% Yes No 2015 Not Sure 2014 Seventy-three percent of the 2015 survey respondents reported that their annual board meetings include an educational component. Figure 28.
Board Knowledge of Governance Policies Strongly disagree 1% Board meetings for the surveyed organizations covered a range of topics. When respondents were asked to click all options that apply, the topic of governance ranked fairly high on the list (53% for 2015 respondents, 67% for 2014 respondents), risk management and regulatory issues were not as widely covered in board meeting agendas. Just 20% of 2015 survey respondents stated that risk management was a topic covered in their board meetings. Somewhat disagree 6% Agree 23% Strongly agree 28% Somewhat agree 42% Figure 30.
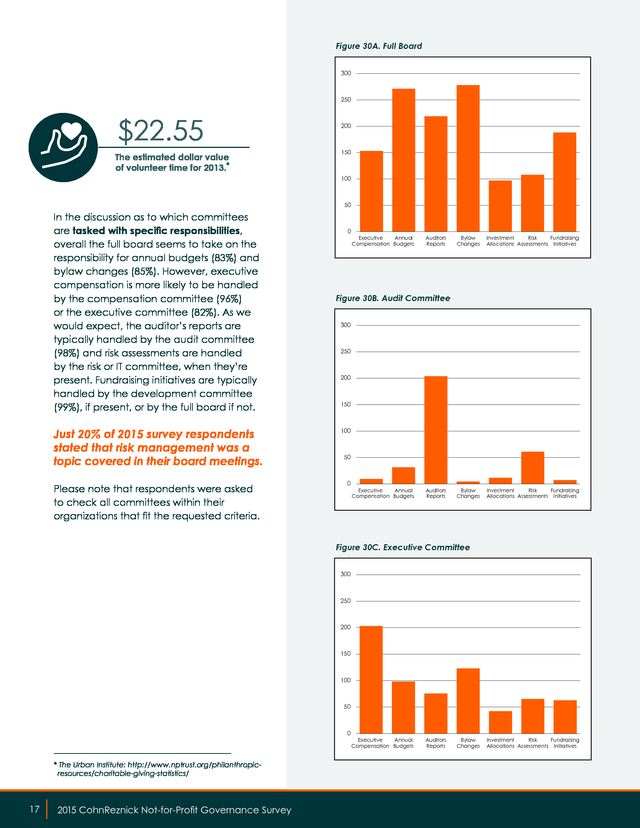
Board Meetings: Educational Topics Figure 29. Board Meetings: Educational Component 80% 2015 77% 2014 73% 67% 60% 59% 58% 53% 44%43% 22% 20% 25% 22% 27% 26% 20% 20% 4% 0% Technology Tax Strategic Planning Risk Management Regulatory Benchmarks Industry Trends Governance Financial 0% Yes 73% 10% 9% 7% 6% 0% 0% Other 29% None of the above 40% All the above No 27% www.forbes.com, Charitable Giving Grew 4.9% In 2013 As Online Donations Picked Up, 2/5/14 7 A CohnReznick Report 16 17 . Figure 30A. Full Board 300 250 $22.55 The estimated dollar value of volunteer time for 2013.* 200 150 100 50 In the discussion as to which committees are tasked with specific responsibilities, overall the full board seems to take on the responsibility for annual budgets (83%) and bylaw changes (85%). However, executive compensation is more likely to be handled by the compensation committee (96%) or the executive committee (82%). As we would expect, the auditor’s reports are typically handled by the audit committee (98%) and risk assessments are handled by the risk or IT committee, when they’re present.
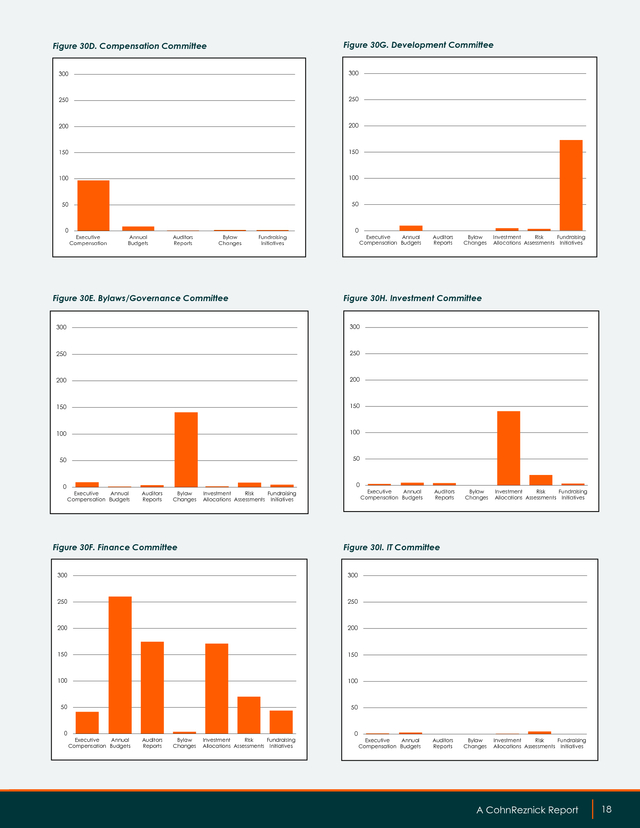
Fundraising initiatives are typically handled by the development committee (99%), if present, or by the full board if not. Just 20% of 2015 survey respondents stated that risk management was a topic covered in their board meetings. Please note that respondents were asked to check all committees within their organizations that fit the requested criteria. 0 Executive Annual Compensation Budgets Auditors Reports Bylaw Changes Investment Risk Fundraising Allocations Assessments Initiatives Bylaw Changes Investment Risk Fundraising Allocations Assessments Initiatives Figure 30B. Audit Committee 300 250 200 150 100 50 0 Executive Annual Compensation Budgets Auditors Reports Figure 30C. Executive Committee 300 250 200 150 100 50 0 * The Urban Institute: http://www.nptrust.org/philanthropicresources/charitable-giving-statistics/ 17 18 2015 CohnReznick Not-for-Profit Governance Survey Executive Annual Compensation Budgets Auditors Reports Bylaw Changes Investment Risk Fundraising Allocations Assessments Initiatives .
Figure 30G. Development Committee Figure 30D. Compensation Committee 300 300 250 250 200 200 150 150 100 100 50 50 0 Executive Compensation Annual Budgets Auditors Reports Bylaw Changes Fundraising Initiatives Figure 30E. Bylaws/Governance Committee 0 Executive Annual Compensation Budgets Auditors Reports Bylaw Changes Investment Risk Fundraising Allocations Assessments Initiatives Figure 30H.
Investment Committee 300 300 250 250 200 200 150 150 100 100 50 50 0 0 Executive Annual Compensation Budgets Auditors Reports Bylaw Changes Investment Risk Fundraising Allocations Assessments Initiatives Figure 30F. Finance Committee Executive Annual Compensation Budgets Auditors Reports Bylaw Changes Investment Risk Fundraising Allocations Assessments Initiatives Bylaw Changes Investment Risk Fundraising Allocations Assessments Initiatives Figure 30I. IT Committee 300 300 250 250 200 200 150 150 100 100 50 50 0 Executive Annual Compensation Budgets Auditors Reports Bylaw Changes Investment Risk Fundraising Allocations Assessments Initiatives 0 Executive Annual Compensation Budgets Auditors Reports A CohnReznick Report 18 19 .
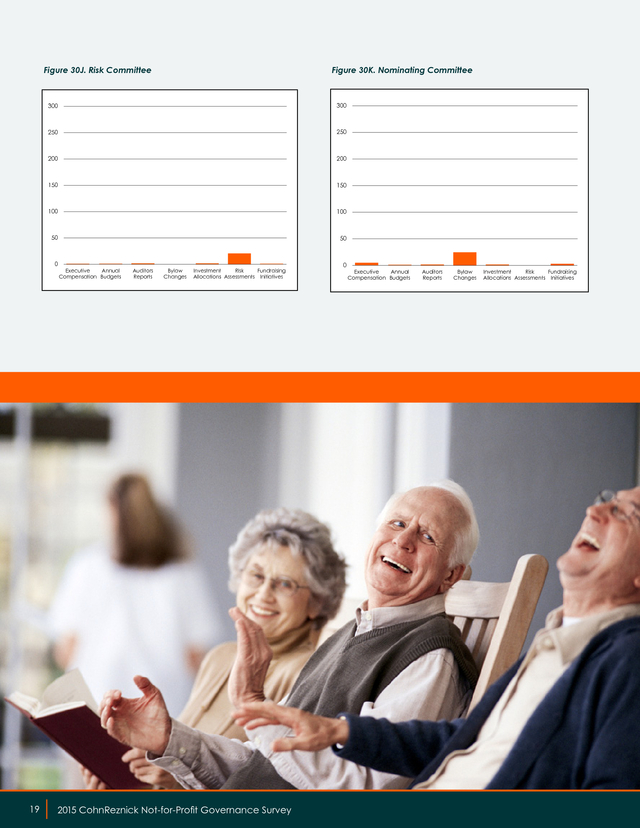
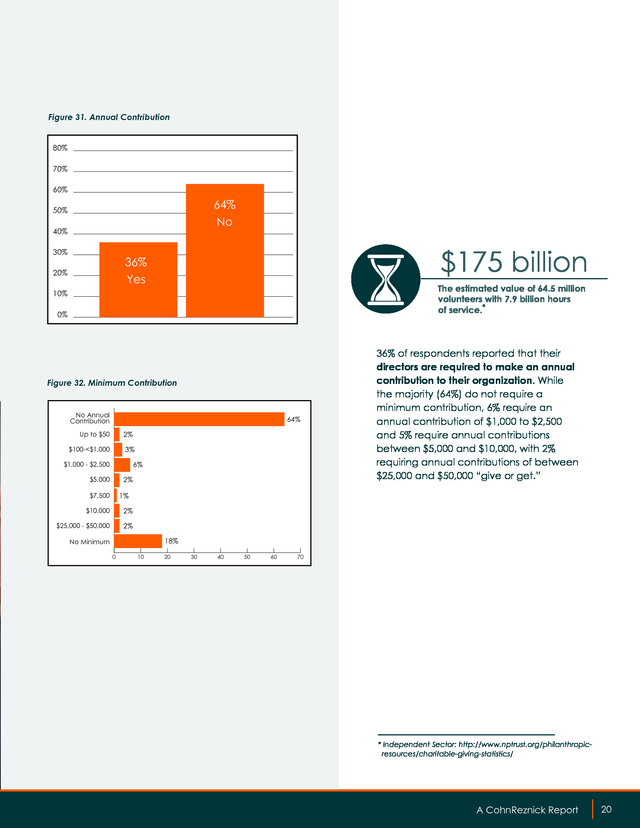
Figure 30J. Risk Committee Figure 30K. Nominating Committee 300 300 250 250 200 200 150 150 100 100 50 50 0 19 20 Executive Annual Compensation Budgets Auditors Reports Bylaw Changes Investment Risk Fundraising Allocations Assessments Initiatives 2015 CohnReznick Not-for-Profit Governance Survey 0 Executive Annual Compensation Budgets Auditors Reports Bylaw Changes Investment Risk Fundraising Allocations Assessments Initiatives . Figure 31. Annual Contribution 80% 70% 60% Yes 64% 36% No 50% 40% 30% $175 billion 36% No Yes 64% 20% The estimated value of 64.5 million volunteers with 7.9 billion hours of service.* 10% 0% Figure 32. Minimum Contribution No Annual Contribution 64% Up to $50 2% $100-<$1,000 3% 6% $1,000 - $2,500 2% $5,000 36% of respondents reported that their directors are required to make an annual contribution to their organization. While the majority (64%) do not require a minimum contribution, 6% require an annual contribution of $1,000 to $2,500 and 5% require annual contributions between $5,000 and $10,000, with 2% requiring annual contributions of between $25,000 and $50,000 “give or get.” 1% $7,500 $10,000 2% $25,000 - $50,000 2% 18% No Minimum 0 10 20 30 40 50 60 70 * Independent Sector: http://www.nptrust.org/philanthropicresources/charitable-giving-statistics/ A CohnReznick Report 20 21 .
About CohnReznick’s Not-for-Profit and Education Industry Practice CohnReznick has a dedicated Not-for-Profit and Education Industry Practice that works closely with the boards, management, and financial leaders of not-for-profit and educational organizations. Our clients include associations, foundations, independent schools, and other educational institutions, not-for-profit affordable housing developers, religious and cultural organizations, and social service and charitable agencies. In addition to providing these organizations with a comprehensive array of tax and accounting services, we also help them identify work flow inefficiencies, implement stringent governance and internal controls processes, leverage technology and IT infrastructure, and more effectively manage capital and planned giving campaigns. CohnReznick serves many of the most respected not-for-profit organizations and educational institutions in the United States. These include our own professional organization, the American Institute of Certified Public Accountants (AICPA), with nearly 400,000 member CPAs. For more information, visit www.cohnreznick.com/notforprofitandeducation. About CohnReznick CohnReznick LLP is one of the top accounting, tax, and advisory firms in the United States, combining the resources and technical expertise of a national firm with the hands-on, entrepreneurial approach that today’s dynamic business environment demands. Headquartered in New York, NY, and with offices nationwide, CohnReznick serves a large number of diverse industries and offers specialized services for middle market and Fortune 1000 companies, private equity and financial services firms, government contractors, government agencies, and not-for-profit organizations. The Firm, with origins dating back to 1919, has more than 2,700 employees including nearly 300 partners and is a member of Nexia International, a global network of independent accountancy, tax, and business advisors.
For more information, visit www.cohnreznick.com. 21 22 2015 CohnReznick Not-for-Profit Governance Survey . A CohnReznick Report 23 . 1212 Avenue of the Americas New York, NY 10036 212-297-0400 www.cohnreznick.com CohnReznick is an independent member of Nexia International CohnReznick LLP © 2015 This has been prepared for information purposes and general guidance only and does not constitute professional advice. You should not act upon the information contained in this publication without obtaining specific professional advice. No representation or warranty (express or implied) is made as to the accuracy or completeness of the information contained in this publication, and CohnReznick LLP, its members, employees and agents accept no liability, and disclaim all responsibility, for the consequences of you or anyone else acting, or refraining to act, in reliance on the information contained in this publication or for any decision based on it. 24 2015 CohnReznick Not-for-Profit Governance Survey .
We hope not-for-profits find the results useful as they continue to refine their organizations’ governance policies and discover new ways to avoid risk. 1 2 2015 CohnReznick Not-for-Profit Governance Survey . EXECUTIVE SUMMARY Governance and risk management issues are key concerns for the leaders of not-for-profit organizations. This was confirmed through the responses we received in CohnReznick’s 2015 Not-for-Profit Governance Survey. While the vast majority of survey respondents (87%) told us that they had implemented key governance initiatives, about 40% of the organizations said that they are either “somewhat” or “not confident” in their governance practices. With the proliferation of high profile security breaches occurring among well-known companies, we were not surprised that many not-for-profit organizations have doubts surrounding their governance and risk management programs. Just under one-third of survey respondents said that their organization had conducted an enterprise risk management assessment.
This could certainly be one of the more significant factors in the large percentage of respondents stating that they are either somewhat or not confident in their governance practices. Additionally, while nearly three quarters of survey respondents said that their annual board meetings include an educational component, only half said that governance was a topic discussed in board meetings. Less than 20% said that risk management was covered and 25% said that regulatory concerns were covered in board meetings. One of the issues impacting confidence in governance practices is cybersecurity.
Cybersecurity ranked among the top 10 risk issues for just under 60% of the surveyed organizations and among the top three risk issues for one in four organizations. So, in a time where cyber threats and other risk issues have become more commonplace, how should not-for-profit organizations respond? CohnReznick recommends the following best practices: 1. A committee of the board should be dedicated to overseeing risk management. Audit committees usually take on this responsibility as these committees typically include directors with risk management skills. 2. A committee of the board should be charged with monitoring IT. Whether it’s the finance, executive, or audit committee, the committee should include experienced IT professionals with clearly established objectives and monitoring responsibilities. 3. Not-for-profit organizations should consider conducting several critical assessments in conjunction with their overall governance practices.
These include: a. An assessment of the organization’s risk management and cybersecurity policies and procedures b. An assessment designed to ensure that the organization’s governance practices comply with the current laws within their state and known best governance practices c.
A board self-assessment at least every three years 4. Include risk management and cybersecurity topics in the educational programs presented during board meetings. This will help to ensure that management and board members are fully aware of the latest developments and apprised of potential threats to their organization. Kelly Frank, CPA, CGMA Partner Not-For-Profit and Education Industry Practice Leader kelly.frank@cohnreznick.com John Alfonso, CPA, CGMA Partner Not-For-Profit and Education Industry Practice john.alfonso@cohnreznick.com A CohnReznick Report 2 3 . RESPONDENT PROFILE 3 4 2015 CohnReznick Not-for-Profit Governance Survey . Figure 1. Type of Organization Professional Associations 11% Education In order to compare and sort the answers to various questions, and to develop a profile of the survey respondents, we asked a few basic questions about those answering our survey. 20% Healthcare 14% Social Service and Other Broad Based Charities 36% Other Overall, 70% of survey respondents said that they would describe their type of organization as either education, healthcare, or social service agency or other broad-based social charities. 19% Figure 2. Current Position Within the Organization 2015 1,521,052 2014 50% 40% 39% 44% 40% The number of charitable organizations in the United States as of May 2015.* 35% 30% 20% 13% 10% 11% 7% 6% 1% 0% 0% 4% 0% Chief Chief Chief Controller Executive Financial Risk Officer Officer Officer Other Board Member Figure 3. Fiscal Year Close 2015 March 31, 2014 2% 2% 58% June 30, 2014 62% More than half of the respondents (58%) stated that their organization has a June 30th fiscal year end, with another 33% stating that their fiscal year ended on December 31st.
This was very much in line with what respondents reported to us last year. 5% September 30, 2014 4% 33% December 31, 2014 Other 2014 When asked about their current position within the organization, 75% of respondents to the 2015 survey said that they were either the Chief Executive Officer or Chief Financial Officer. Other respondents to the 2015 survey included Board Members (6%), Controllers (7%), Chief Risk Officers (1%), and others (11%), which included a myriad of other C-suite level respondents. 32% 2% 0% * The Urban Institute, National Center for Charitable Statistics: http://www.nptrust.org/philanthropic-resources/ charitable-giving-statistics/ A CohnReznick Report 4 5 . Figure 4. Annual Revenues 80% 70% 58% 60% 61% 50% 40% 30% 20% 10% Similar to last year, the vast majority of respondents (58%) reported that their annual revenues fall in the range of $1 million to $25 million. Twenty percent of respondents reported revenues between $25 million and $100 million, and 10% reported more than $100 million in annual revenues. Unlike last year, we received an increased number of responses this year from organizations with revenues under $1 million (12%). In addition, we asked respondents to tell us about any change in total revenue for the last fiscal year.
Fifty percent of respondents reported revenue increases for their organization ranging from less than 1% to 5% for their last fiscal year. At the same time, 28% reported an increase of over 5%. This represents a higher number of not-forprofits reporting increases versus last year (41% and 29% respectively). For the 2015 survey, 22% of respondents reported that revenues had decreased during their last fiscal year versus 31% in 2014. Apart from identifying their type of organization, we asked respondents to define their mission.
In choosing from a list of descriptions that best stated their organization’s mission, most chose “education,” “health,” or “human services.” This was consistent with the respondents from last year’s survey. 0% 12% 12% 18% 13% 10% 8% 8% 0% Less than $1 Million $1 Million $25 Million $25 Million - $50 Million $50 Million $100 Million 2015 More than $100 Million 2014 Figure 5. Change in Total Revenue for the Last Fiscal Year 50% 50% 41% 40% 28% 29% 30% 21% 20% 15% 10% 10% 0% 7% Increase between < 1% - 5% Increase greater than 5% Decrease between < 1% - 5% 2015 Decrease greater than 5% 2014 Figure 6. Defining Their Mission 0 5 10 15 20 25 30 Arts, Culture, and Humanities Affordable Housing Education-Higher Education-Other Environmental and/ or Animals Health-Hospitals Health-Other Human Services International and/ or Foreign Affairs Membership Organization Public-Societal Benefit Religious Other 2015 5 6 2015 CohnReznick Not-for-Profit Governance Survey 2014 National Center for Charitable Statistics 35 .
Figure 7. Making Significant Strategic and Organizational Changes Within the Last Two Years 40% 35% 30% 25% 20% 15% 10% 5% Expanded into new geographic markets Lost revenues due to diminished public funding Dropped or reduced employee benefits Cut or froze salaries Used reserves or endowment to fund operating needs Merged or combined with another organization Implemented staffing cuts Launched a capital campaign Launched a global initiative Board turnover exceeded 25% Implemented a new strategic plan Recieved an increase in government funding New Chief Financial Officer New Chief Executive Officer 0% A number of the surveyed organizations, particularly those that described themselves within a sub-segment of broad-based social services organizations, reported making significant strategic and organizational changes within the last two years. The most frequently reported changes included implementing a new strategic plan (38%) and changes to top leadership, such as a new Chief Executive Officer (26%) or a new Chief Financial Officer (21%). A significant portion of the organizations (25%) reported an increase in government funding.
We also noticed that 39% either implemented staff cuts or mentioned that they cut or froze salaries. A CohnReznick Report 6 7 . GOVERNANCE 7 8 2015 CohnReznick Not-for-Profit Governance Survey . Figure 8. Confidence in Organizational Governance Practices 16 Not Confident 4% Somewhat Confident 36% Very Confident 60% 0% 10% 20% 30% 40% 50% 60% 70% Figure 9. Key Governance Initiatives Yes No Not Sure 100% 80% 60% 40% 20% Figure 10. Whistleblower Policy 100% 84% 82% 80% 60% 40% 20% 6% Yes 10% 7% No, but plan to develop it in the next 12 months 2015 2014 Written conflict of interest policy Annual disclosure statement to identify conflicts of interest Annual gift policy Record retention policy Disaster recovery plan Outside provider to record your whistleblower complaints Whistleblower complaint resolution process IT steering committee IT risk assessment IT strategic plan Social media policy 0% 0% POLICIES AND PRACTICES 80% Approximately 40% of organizations stated that they are either “somewhat confident” or “not confident” in their governance practices. While this is concerning, it is also somewhat expected.
With the recent data breaches to major well-known companies, and the federal government, not-for-profits should re-evaluate their policies and procedures to ensure management and the board are appropriately engaged in IT governance. Just under 90% of all organizations reported that they have certain key governance initiatives in place. These include social media policies (67%); a whistleblower complaint resolution process (77%); a formal record retention policy (90%); and conflict of interest (92%) policy. On the other hand, over 60% of the organizations reported that they did not have an IT steering committee (66%) and did not use an outside organization to record whistleblower complaints (67%).
Nearly half of the organizations (46%) do not have, or were unsure if they have, a process in place to assess IT risk. 84% of respondents reported that their organization has a written whistleblower policy in place. This number is consistent with findings from last year’s survey. One in 10 reported having no intention of implementing such a policy, which is also consistent with last year’s findings.
Implementing a whistleblower policy along with the necessary procedures, including the use of a tip hotline, is an easy way to defend against fraud. The 2014 Association of Certified Fraud Examiners (ACFE) Report to the Nations on Occupational Fraud and Abuse revealed that over the last five years, more than 40% of reports of fraud have come in through tips.1 11% No intention of developing 1 Association of Certified Fraud Examiners (ACFE), Report to the Nations on Occupational Fraud and Abuse, Austin, TX; ACFE, 2014, p.4 A CohnReznick Report 8 9 . Nearly two-thirds of respondents (64%) indicated that their audit committees monitor whistleblower complaints as they occur. However, nearly one in four respondents stated that their audit committees NEVER monitor whistleblower complaints. Another fact mentioned in the 2014 Association of Certified Fraud Examiners (ACFE) Report to the Nations on Occupational Fraud and Abuse is that proactive data monitoring/analysis reduced fraud incidents by 59.7%. The median loss for firms without these controls was $181,000.2 Figure 11.
Monitoring Whistleblower Complaints Semi-Annually 2% Quarterly Annually 3% 7% Never 24% On an occurence basis 64% $17.77 billion The amount of corporate giving. (A 13.7% increase from 2013.)* Figure 12. Outside Whistleblower Provider 60% Roughly one quarter of the respondents using an outside service provider for whistleblower complaints said that they use EthicsPoint (26%). However, that number is just half of what it was in 2014 (53%).
The only other outside provider that was consistently named by respondents is Lighthouse. But that number is down from 18% in 2014 to just 4% this year. (Please note by citing the responses, CohnReznick is not recommending these companies). 53% 50% 40% 30% 26% 20% 18% 10% 4% 0% Lighthouse EthicsPoint 2015 2 Association of Certified Fraud Examiners (ACFE), Report to the Nations on Occupational Fraud and Abuse, Austin, TX; ACFE, 2014, p.38, Fig 37 * Giving USA 2014: http://www.nptrust.org/philanthropicresources/charitable-giving-statistics/ 9 10 2015 CohnReznick Not-for-Profit Governance Survey 2014 .
Figure 13. Enterprise Risk Management Assessment . RISK MANAGEMENT Yes 30% No 70% Only 30% of survey respondents indicated that their organization has conducted an enterprise risk management assessment. This could be among the more significant reasons why 40% of the respondents stated that they are either somewhat confident or not confident in their governance practices. Figure 14. IT Monitoring Other 13% Information Technology Committee 10% Audit Committee 16% ‘Other’ Category Comments Admin Committee Corporate Compliance Committee Infrastructure Committee Operations Committee Finance Committee 31% Staff Function Finance & Executive Committee Quality Assurance Committee Board of Directors Education Committee Investment Committee Risk Management Committee Executive Committee C-Suite & Executive Director 30% None of the Above Figure 15. Cybersecurity Not concerned Roughly 60% of respondents stated that either their Finance Committee or Executive Committee is charged with monitoring IT.
Only 10% of organizations said that they have a separate IT committee, while another 16% indicated that IT was monitored by their board’s audit committee and another 13% stated that another (not listed) committee monitors IT. Nearly 25% of the respondents counted cybersecurity among the top three risks to their organization. Another 57% said that cybersecurity was one of their top 10 risks. Fewer than 20% of respondents stated that cybersecurity was not a concern of their organization. 19% Among our organization’s top 10 risks, but not among our top 3 risks Among our organization’s top 3 risks 57% 24% A CohnReznick Report 10 11 . Figure 16. Data Security Spending Over Next 12 Months This is concerning and a bit of a contradiction as just 11% of organizations stated that they had a risk committee or an IT committee later in the survey, with most placing IT monitoring within the audit or finance committees. Also, in the following question, it seems that some organizations (29%) plan to spend more money, some as much as 100% more, than last year on their data security efforts. Just 3% said that they would be spending less. 45% expected their organization would be spending about the same on data security as it did the prior year.
So the question here is: who is really monitoring IT? Whether it’s the finance, executive, or audit committee, we believe that some committee of the board should monitor IT. That committee should include experienced IT professionals and ought to have a set of clear objectives to enable it to fulfill IT monitoring responsibilities. Do you have the right “experts” on your audit and finance committee? When those organizations planning to spend more on data security were asked to give a percentage of the expected increase, nearly half (47%) anticipate a spending increase of 1%-10% over the coming year. 13% of respondents anticipate spending would increase by up to 25%.
One quarter of respondents said that they were not sure of the level of spending their organization is planning to improve data security over the coming year. CohnReznick advises not-for-profits to have a committee of the board dedicated to the oversight of risk management. Furthermore, we believe audit committees usually take on this stewardship responsibility, as they typically include directors with risk management skills. Less than in the previous 12 months 3% No plans at this time 23% The same as in the previous 12 months 45% More than in the previous 12 months 29% The AICPA Audit Committee Toolkit: Not-for-Profit Entities (“Toolkit”), includes both required and best practices which suggest: • The audit committee could be responsible for the oversight and response to enterprise risk management activities. • The audit committee should periodically reassess the list of top enterprise risks. • The audit committee should determine who in management is responsible for each of these risks.3 Figure 17. Data Security Spending Anticipated Increase/Decrease Not Sure 25% Assessing Now 4% 100%+ 7% 26-50% 4% 3 American Institute of Certified Public Accountants (AICPA), The AICPA Audit Committee Toolkit: Not-for-Profit Entities, 3rd Edition, New York, NY, Chapter 1, p.6 11 12 2015 CohnReznick Not-for-Profit Governance Survey 1-5% 26% 6-10% 21% 11-25% 13% . Figure 18. Conflicts of Interest: Audit Committee Oversight 60% 50% 51% 40% 36% 30% Roughly half (51%) of the respondents reported that their audit committee monitors disclosed conflicts of interest. 36% advised that their audit committees did not do this monitoring and 13% responded as “other.” Generally, this “other” response meant that a committee other than audit was charged with disclosed conflicts of interest monitoring, such as the Board, executive committee or a governance committee. 20% 13% 0% Yes No 95.4% Other 10% Percentage of households that give to charity.* Figure 19. Conflicts of Interest: Annual Disclosure Statements Employees other than Senior Management 29% Senior Management 64% Members of the Board 94% Vendors 5% All of the Above 5% The Toolkit suggests that the identification and reporting of conflicts of interest is the responsibility of the audit committee. The Toolkit also suggests that a conflict of interest questionnaire should be completed by all employees.4 When respondents were asked to check all areas that applied to their organization, 94% reported that their organization obtains annual conflict of interest disclosure statements from board members and 64% reported obtaining these disclosure statements from senior management. Only 29% of respondents stated that they obtain conflict of interest disclosure statements from other employees and vendors in addition to senior management and board members.
Many large notfor-profit organizations require an annual conflict of interested disclosure statement from all employees and vendors. CohnReznick believes that this is a best practice that should be implemented by all not-for-profit organizations in an effort to prevent fraud. 4 American Institute of Certified Public Accountants (AICPA), The AICPA Audit Committee Toolkit: Not-for-Profit Entities, 3rd Edition, New York, NY, Chapter 9, p.73 * Center on Philanthropy of Indiana University: http://www.nptrust. org/philanthropic-resources/charitable-giving-statistics/ A CohnReznick Report 12 13 . BOARDS AND COMMITTEES Figure 20. Board Size 40% 36% 36% 35% 33% 30% 24% 25% 20% 16% 15% Over one third of organizations (36%) reported that their board was comprised of 20 or more members. Another 33% reported boards with 10-15 members and 18% reported having 15-20 board members. The board profile for the 2015 survey is fairly similar to the 2014 survey with one notable exception.
There are more organizations with 10-15 members in 2015 (33% in 2015 versus 22% in 2014.) We believe boards with fewer than 25 members are best suited to govern most not-for-profit organizations because they can be more focused and nimble in their decision making and, consequently, more strategic and engaged in fulfilling mission outcomes. Nearly three quarters of respondents (71%) noted that their board members have term limits. When asked about the length of those terms, most (64%) noted that their organization has term limits of three years, which is consistent with the BoardSource 2014 Nonprofit Governance Index.5 Only 43% of respondents stated that their board has conducted a self-assessment within the last three years. The remaining respondents reported that they had not conducted (37%) or were unsure if they had conducted (20%) a board selfassessment within a three-year period. CohnReznick recommends that boards conduct a self-assessment at least every three years. 10% 10% 5% 3% 3% 0% 1-5 Board Members 5-10 Board Members of Nonprofit Board Practices, 2015, p.8, Fig.4, http://leadingwithintent.org/wp-content/uploads/2015/01/ LWI-Report-2.pdf 13 14 2015 CohnReznick Not-for-Profit Governance Survey 10-15 Board 15-20 Board Members Members 2015 2014 Figure 21.
Board Term Limits No 29% Yes 71% Figure 22. Board Self-Assessment Not sure 20% Yes 43% No 37% 5 BoardSource, Leading with Intent, A National Index 22% 18% 20+ Board Members . While most (85%) of the respondent organizations noted that they have multiple committees present within their organization, when asked to check all of the committees present within their organization, only 64% stated that they have an audit committee. Eighty-three percent of respondent organizations checked that they have an executive committee, with 86% actually stating that they have a finance committee. Figure 23. Organizational Committees 7% IT Committee Executive Committee 83% 12% 11% Finance Committee Audit Committee 10% Compensation Committee 86% 64% 33% Investment Committee 38% Bylaws/Governance Committee 49% 51% Development Committee Nominating Committee 55% Risk Committee 4% 0% 25% 50% 75% 100% As businesses and not-for-profits experience more fraud and cyber-attacks than ever before, they need to be more vigilant in their practices. The business world is getting more complicated and those charged with governance need to manage the uncertainties by employing effective risk management practices, including enterprise risk assessments.
As more states pass laws on these issues, such as the New York Nonprofit Revitalization Act, organizations need to be aware of the consequences of non-compliance. As stated earlier, 80% of the organizations surveyed noted that their organization’s cybersecurity is among their top three or at least top 10 concerns. However, only 4% and 7%, respectively, stated that they have a risk or IT committee. According to the Association of Certified Fraud Examiners (ACFE) 2014 Report to the Nations6, organizations that implemented proactive data monitoring and analysis saw a 59.7% reduction in loss based on having the aforementioned controls in place.
This was the highest overall reduction in loss, according to the report. Based on this information, CohnReznick recommends that organizations discuss and re-evaluate current cybersecurity practices and develop a plan to manage them moving forward. The Council of Nonprofits currently lists 26 states with laws in place requiring charitable not-for-profits to conduct an independent audit under certain circumstances. In addition, 24 states require annual submission of audited financial statements. Some of these states include California, Connecticut, Florida, Georgia, Hawaii, Maryland, Massachusetts, New Jersey, New York, North Carolina, Pennsylvania, Rhode Island, and Virginia.7 We are seeing a trend that indicates governmental bodies are showing increased interest in the role of the board. Consequently, the expectations have been elevated. 6 American Institute of Certified Public Accountants (AICPA), The AICPA Audit Committee Toolkit: Not-for-Profit Entities, 3rd Edition, New York, NY, p.38 7 National Council of Nonprofits, State Law Nonprofit Audit Requirements, https://www.councilofnonprofits.org/nonprofitaudit-guide/state-law-audit-requirements A CohnReznick Report 14 15 .
CohnReznick suggests that, to the extent it hasn’t done so recently, an organization’s board, in cooperation with management, conducts an assessment to ensure governance practices comply with the current laws within the organization’s state and known best governance practices. Almost half of the organizations (48%) reported having an audit committee comprised of four to six board members. Forty-two percent have audit committees with one to three board members and 10% reported having audit committees with six or more board members. Most of the organizations (32%) reported that their audit committees meets on a quarterly basis. Twenty-two percent of audit committees met semi-annually and 19% met on an annual basis. Our experience is that the best functioning audit committees have four to six members and meet quarterly. Eighty-two percent of respondents stated that their audit committee has at least one member who is a financial expert. However 14% reported that their audit committee lacks a financial expert.
CohnReznick believes that it is always a good idea to have a financial expert on your board. A financial expert can provide industry insight and can translate the issues and jargon associated with financial statements and applicable new regulations. In addition, they are trained to look for specific abnormalities and are more likely to spot an issue. Finally, according to the Association of Certified Fraud Examiners (ACFE) 2014 Report to the Nations8, the types of fraud schemes that were committed against the respondent organizations with less than 100 employees included those that could easily be seen by a member of the board or audit committee with a financial background. These schemes included billing (28.7%), check tampering (22.1%), skimming (17.1%), expense reimbursements (16.5%), payroll (16.5%), and cash on hand (12.0%), and register disbursements (3.2%). 8 American Institute of Certified Public Accountants (AICPA), The AICPA Audit Committee Toolkit: Not-for-Profit Entities, 3rd Edition, New York, NY, p.26 15 16 2015 CohnReznick Not-for-Profit Governance Survey Figure 24.
Audit Committee: Size 6+ Board Members 10% 1-3 Board Members 42% 4-6 Board Members 48% Figure 25. Audit Committee: Frequency of Meetings Other 15% Annually 19% Monthly 12% Quarterly 32% Semi-Annually 22% Figure 26. Audit Committee: Financial Expert Not sure 4% No 14% Yes 82% .
For the 2015 CohnReznick survey, there was a significant decline in respondents reporting that their audit committee has a charter when compared to 2014. In 2015, just 33% reported having a charter versus 52% in 2014. Figure 27. Audit Committee: Charter 60% 52% 49% 50% 40% 34% 33% Seventy percent of respondents were at least somewhat in agreement that their board members have a working knowledge of their organization’s governance policies. But among these respondents, only 28% said that they “strongly agree” with this proposition. 30% 18% 20% 14% 10% 0% Yes No 2015 Not Sure 2014 Seventy-three percent of the 2015 survey respondents reported that their annual board meetings include an educational component. Figure 28.
Board Knowledge of Governance Policies Strongly disagree 1% Board meetings for the surveyed organizations covered a range of topics. When respondents were asked to click all options that apply, the topic of governance ranked fairly high on the list (53% for 2015 respondents, 67% for 2014 respondents), risk management and regulatory issues were not as widely covered in board meeting agendas. Just 20% of 2015 survey respondents stated that risk management was a topic covered in their board meetings. Somewhat disagree 6% Agree 23% Strongly agree 28% Somewhat agree 42% Figure 30.
Board Meetings: Educational Topics Figure 29. Board Meetings: Educational Component 80% 2015 77% 2014 73% 67% 60% 59% 58% 53% 44%43% 22% 20% 25% 22% 27% 26% 20% 20% 4% 0% Technology Tax Strategic Planning Risk Management Regulatory Benchmarks Industry Trends Governance Financial 0% Yes 73% 10% 9% 7% 6% 0% 0% Other 29% None of the above 40% All the above No 27% www.forbes.com, Charitable Giving Grew 4.9% In 2013 As Online Donations Picked Up, 2/5/14 7 A CohnReznick Report 16 17 . Figure 30A. Full Board 300 250 $22.55 The estimated dollar value of volunteer time for 2013.* 200 150 100 50 In the discussion as to which committees are tasked with specific responsibilities, overall the full board seems to take on the responsibility for annual budgets (83%) and bylaw changes (85%). However, executive compensation is more likely to be handled by the compensation committee (96%) or the executive committee (82%). As we would expect, the auditor’s reports are typically handled by the audit committee (98%) and risk assessments are handled by the risk or IT committee, when they’re present.
Fundraising initiatives are typically handled by the development committee (99%), if present, or by the full board if not. Just 20% of 2015 survey respondents stated that risk management was a topic covered in their board meetings. Please note that respondents were asked to check all committees within their organizations that fit the requested criteria. 0 Executive Annual Compensation Budgets Auditors Reports Bylaw Changes Investment Risk Fundraising Allocations Assessments Initiatives Bylaw Changes Investment Risk Fundraising Allocations Assessments Initiatives Figure 30B. Audit Committee 300 250 200 150 100 50 0 Executive Annual Compensation Budgets Auditors Reports Figure 30C. Executive Committee 300 250 200 150 100 50 0 * The Urban Institute: http://www.nptrust.org/philanthropicresources/charitable-giving-statistics/ 17 18 2015 CohnReznick Not-for-Profit Governance Survey Executive Annual Compensation Budgets Auditors Reports Bylaw Changes Investment Risk Fundraising Allocations Assessments Initiatives .
Figure 30G. Development Committee Figure 30D. Compensation Committee 300 300 250 250 200 200 150 150 100 100 50 50 0 Executive Compensation Annual Budgets Auditors Reports Bylaw Changes Fundraising Initiatives Figure 30E. Bylaws/Governance Committee 0 Executive Annual Compensation Budgets Auditors Reports Bylaw Changes Investment Risk Fundraising Allocations Assessments Initiatives Figure 30H.
Investment Committee 300 300 250 250 200 200 150 150 100 100 50 50 0 0 Executive Annual Compensation Budgets Auditors Reports Bylaw Changes Investment Risk Fundraising Allocations Assessments Initiatives Figure 30F. Finance Committee Executive Annual Compensation Budgets Auditors Reports Bylaw Changes Investment Risk Fundraising Allocations Assessments Initiatives Bylaw Changes Investment Risk Fundraising Allocations Assessments Initiatives Figure 30I. IT Committee 300 300 250 250 200 200 150 150 100 100 50 50 0 Executive Annual Compensation Budgets Auditors Reports Bylaw Changes Investment Risk Fundraising Allocations Assessments Initiatives 0 Executive Annual Compensation Budgets Auditors Reports A CohnReznick Report 18 19 .
Figure 30J. Risk Committee Figure 30K. Nominating Committee 300 300 250 250 200 200 150 150 100 100 50 50 0 19 20 Executive Annual Compensation Budgets Auditors Reports Bylaw Changes Investment Risk Fundraising Allocations Assessments Initiatives 2015 CohnReznick Not-for-Profit Governance Survey 0 Executive Annual Compensation Budgets Auditors Reports Bylaw Changes Investment Risk Fundraising Allocations Assessments Initiatives . Figure 31. Annual Contribution 80% 70% 60% Yes 64% 36% No 50% 40% 30% $175 billion 36% No Yes 64% 20% The estimated value of 64.5 million volunteers with 7.9 billion hours of service.* 10% 0% Figure 32. Minimum Contribution No Annual Contribution 64% Up to $50 2% $100-<$1,000 3% 6% $1,000 - $2,500 2% $5,000 36% of respondents reported that their directors are required to make an annual contribution to their organization. While the majority (64%) do not require a minimum contribution, 6% require an annual contribution of $1,000 to $2,500 and 5% require annual contributions between $5,000 and $10,000, with 2% requiring annual contributions of between $25,000 and $50,000 “give or get.” 1% $7,500 $10,000 2% $25,000 - $50,000 2% 18% No Minimum 0 10 20 30 40 50 60 70 * Independent Sector: http://www.nptrust.org/philanthropicresources/charitable-giving-statistics/ A CohnReznick Report 20 21 .
About CohnReznick’s Not-for-Profit and Education Industry Practice CohnReznick has a dedicated Not-for-Profit and Education Industry Practice that works closely with the boards, management, and financial leaders of not-for-profit and educational organizations. Our clients include associations, foundations, independent schools, and other educational institutions, not-for-profit affordable housing developers, religious and cultural organizations, and social service and charitable agencies. In addition to providing these organizations with a comprehensive array of tax and accounting services, we also help them identify work flow inefficiencies, implement stringent governance and internal controls processes, leverage technology and IT infrastructure, and more effectively manage capital and planned giving campaigns. CohnReznick serves many of the most respected not-for-profit organizations and educational institutions in the United States. These include our own professional organization, the American Institute of Certified Public Accountants (AICPA), with nearly 400,000 member CPAs. For more information, visit www.cohnreznick.com/notforprofitandeducation. About CohnReznick CohnReznick LLP is one of the top accounting, tax, and advisory firms in the United States, combining the resources and technical expertise of a national firm with the hands-on, entrepreneurial approach that today’s dynamic business environment demands. Headquartered in New York, NY, and with offices nationwide, CohnReznick serves a large number of diverse industries and offers specialized services for middle market and Fortune 1000 companies, private equity and financial services firms, government contractors, government agencies, and not-for-profit organizations. The Firm, with origins dating back to 1919, has more than 2,700 employees including nearly 300 partners and is a member of Nexia International, a global network of independent accountancy, tax, and business advisors.
For more information, visit www.cohnreznick.com. 21 22 2015 CohnReznick Not-for-Profit Governance Survey . A CohnReznick Report 23 . 1212 Avenue of the Americas New York, NY 10036 212-297-0400 www.cohnreznick.com CohnReznick is an independent member of Nexia International CohnReznick LLP © 2015 This has been prepared for information purposes and general guidance only and does not constitute professional advice. You should not act upon the information contained in this publication without obtaining specific professional advice. No representation or warranty (express or implied) is made as to the accuracy or completeness of the information contained in this publication, and CohnReznick LLP, its members, employees and agents accept no liability, and disclaim all responsibility, for the consequences of you or anyone else acting, or refraining to act, in reliance on the information contained in this publication or for any decision based on it. 24 2015 CohnReznick Not-for-Profit Governance Survey .


