


Description
CLAconnect.com/seniorliving
30th Edition
Skilled Nursing
Facility Cost
Comparison
Based on 2014 data
. 30th Edition: Skilled Nursing Facility Cost Comparison
Table of Contents
TABLE OF CONTENTS...................................................................................................................................................... 2
30th Edition Retrospective............................................................................................................................................. 3
Valuable information the industry couldn’t get elsewhere................................................................................................. 3
Impact on clients and the industry......................................................................................................................................
3 The future of skilled nursing facilities................................................................................................................................. 4 Executive Summary....................................................................................................................................................... 5 Industry challenges and opportunities................................................................................................................................
5 Key ratios............................................................................................................................................................................. 5 Key trends........................................................................................................................................................................... 5 Perspective on Ratios and Costs....................................................................................................................................
7 Ratio and cost analyses....................................................................................................................................................... 7 Presentation of data............................................................................................................................................................ 7 Percentile rankings..............................................................................................................................................................
7 Uses of this publication....................................................................................................................................................... 8 Section I: Ratio Analysis................................................................................................................................................. 9 Financial statement indicators............................................................................................................................................
9 Operating indicators.......................................................................................................................................................... 19 Staffing indicators.............................................................................................................................................................. 21 Section II: Cost Analyses Tables....................................................................................................................................
25 Department Totals Per Resident Day................................................................................................................................. 25 Salary Comparison Per Resident Day................................................................................................................................ 26 Salaries Per Compensated Hour........................................................................................................................................
27 Compensated Hours Per Resident Day.............................................................................................................................. 28 Payroll Taxes and Fringe Benefits Per Resident Day.......................................................................................................... 29 Food, Utilities, Repairs, Maintenance, and General Insurance Per Resident Day.............................................................30 Housekeeping and Plant Operations Costs Per Square Foot.............................................................................................
31 Section III: About CliftonLarsonAllen........................................................................................................................... 32 History and experience..................................................................................................................................................... 32 Our dedication to health care...........................................................................................................................................
32 CLA Promise...................................................................................................................................................................... 33 A national and regional commitment to the senior living field......................................................................................... 34 Solutions for senior living providers..................................................................................................................................
35 About CLA.......................................................................................................................................................................... 35 Health care offices............................................................................................................................................................. 36 CLAconnect.com/seniorliving 2 ©2015 CliftonLarsonAllen LLP .
30th Edition: 30th Edition: Skilled Nursing Facility Cost Comparison Mike McConnell, John Racek, Deb Elsey, Gordy Vetsch, John Richter 30th Edition Retrospective Valuable information the industry couldn’t get elsewhere As we assembled our 30th edition of this report, we reflected on how the report got started and the changes we have seen over the years. In 1983, Mike McConnell was serving clients in health care when he and several colleagues realized that the information they routinely collected to file clients’ Rule 50 cost report could be valuable. In fact, long-term care clients often asked how their facilities compared to others in the industry. McConnell asked his supervisor what he thought of collecting this information in a useful format for distribution to clients, and the response was more or less, “Ok, but let’s do this after hours.” Impact on clients and the industry CLA nurtures very close relationships with clients, and the report provided a framework to discuss best practices and efficiencies — everything from food costs to staffing costs. McConnell says, “It was a tough time for our skilled nursing facility clients, and they were trying to figure out how to deal with it. The report helped position us as part of the solution.” The report’s popularity and use spread across the industry and beyond.
Investment bankers used it. Small sites used it to understand how they could compete with larger facilities. It was used as a resource politically and legislatively.
Clients used it to benchmark acquisition targets, since it offered accurate information that could provide the foundation to improve their outcomes. As CLA’s health care client base grew each year, the report included more facilities and the breadth of the information expanded from state to regional to national. McConnell and a team of several colleagues put in many late night hours compiling the information, and the response to the first Skilled Nursing Facility Cost Comparison Report in 1983 took everyone by surprise. Clients were using it right away. In meetings with the auditors, the report helped focus discussions on the data and improving performance. Suddenly, CliftonLarsonAllen stood out as a significant resource for this information. Clients valued the data because it could make them more competitive, and competitors couldn’t duplicate it. Vetsch says, “As professionals, it took our practice in a different direction, because it allowed us to be more proactive.” Principal John Racek met with one client each month because she actively used the information and rate computations in the report.
“She was a disciplined operator, and she was methodical in her attention to this information. It helped her succeed.” “We were simply aligning ourselves with where we thought the industry was going,” says McConnell. “We had information at our disposal, and we thought it could be helpful to our clients.” The report provided vital current business information that the industry couldn’t get anywhere else.
Gordy Vetsch, who worked with McConnell at the time, says, “The only other similar reports came from the Department of Human Services, and there was a two-year lag to get that data — we were the only one doing this.” CLAconnect.com/seniorliving The tool was also used by leadership, management, and boards. “If there were disagreements about staffing needs, they’d pull out the report,” says Vetsch. “It gave them credible information to base their decisions on.” 3 ©2015 CliftonLarsonAllen LLP .
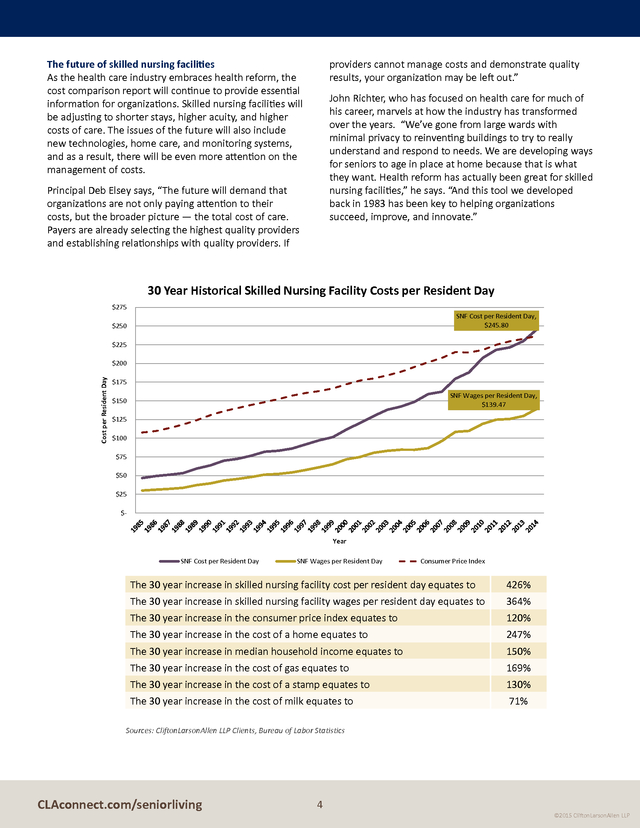
The future of skilled nursing facilities As the health care industry embraces health reform, the cost comparison report will continue to provide essential information for organizations. Skilled nursing facilities will be adjusting to shorter stays, higher acuity, and higher costs of care. The issues of the future will also include new technologies, home care, and monitoring systems, and as a result, there will be even more attention on the management of costs. providers cannot manage costs and demonstrate quality results, your organization may be left out.” John Richter, who has focused on health care for much of his career, marvels at how the industry has transformed over the years. “We’ve gone from large wards with minimal privacy to reinventing buildings to try to really understand and respond to needs.
We are developing ways for seniors to age in place at home because that is what they want. Health reform has actually been great for skilled nursing facilities,” he says. “And this tool we developed back in 1983 has been key to helping organizations succeed, improve, and innovate.” Principal Deb Elsey says, “The future will demand that organizations are not only paying attention to their costs, but the broader picture — the total cost of care. Payers are already selecting the highest quality providers and establishing relationships with quality providers.
If 30 Year Historical Skilled Nursing Facility Costs per Resident Day $275 SNF Cost per Resident Day, $245.80 $250 $225 Cost per Resident Day $200 $175 SNF Wages per Resident Day, $139.47 $150 $125 $100 $75 $50 $25 $- Year SNF Cost per Resident Day SNF Wages per Resident Day Consumer Price Index The 30 year increase in skilled nursing facility cost per resident day equates to 426% The 30 year increase in skilled nursing facility wages per resident day equates to 364% The 30 year increase in the consumer price index equates to 120% The 30 year increase in the cost of a home equates to 247% The 30 year increase in median household income equates to 150% The 30 year increase in the cost of gas equates to 169% The 30 year increase in the cost of a stamp equates to 130% The 30 year increase in the cost of milk equates to 71% Sources: CliftonLarsonAllen LLP Clients, Bureau of Labor Statistics CLAconnect.com/seniorliving 4 ©2015 CliftonLarsonAllen LLP . 30th Edition: Executive Summary Skilled Nursing Facility Cost Comparison Industry challenges and opportunities Because there are at least five key drivers of change — both the complexity and the pace of change have increased dramatically. Briefly, the drivers include: 1. Consumers are increasingly aware of their own aging and, at least in part, the implications. While it might be argued that not enough is known about tomorrow’s consumers, we do know that their choices are becoming clearer, the quality they expect has not been reduced as a result of the recession, and the housing market and pricing and fee approaches demand options and creativity. 2. The federal deficit is intensifying the focus on value, competition, access to capital, payment reform, and stewardship. More to the point, we are in an era when third party payments (from the federal or state governments) are challenged.
For providers, finding a strategic solution is essential for future success. The good news is that there are opportunities to do exactly that. 3. Health care reform is demanding that providers prove the quality that, to this point, was known to be present and is reflected in our positive reputation in the community as well as highly satisfied residents and families. The ‘value’ that is provided (the combination of quality and price) has become a critical driver.
At the same time, health care reform is facilitating the creation of innovative communities that support vulnerable people at home through entrepreneurial products and services. 4. The cultivation of human resources is becoming the most important factor in the success of a new generation of service delivery. 5. Technology is potentially the single most important phenomenon that can synergize the other driving forces to assure value for all concerned. increased from 6.2 percent in 2010 to 6.4 percent in 2014. This ratio indicates that providers continue to find ways to manage profitability despite challenges in reimbursement and declining occupancy. Days Cash-on-Hand Including Investments — As facilities continue to conserve cash, days cash-on-hand has increased from 36.2 days in 2010 to 45.7 days in 2014. The increase is modest but also appears to be from the increases in operating margins. The relatively low days cash-on-hand ratio for these facilities emphasizes the fragility of skilled nursing facilities and their dependence on continued operational performance and lack of reinvestment into the physical plant. Debt Service Coverage Ratio — This ratio has maintained a fairly consistent level over the last five years. This highlights the ability of the industry to manage operating costs given continued economic and legislative pressures. Key trends Health care reform has spurred significant market changes across the country.
While it is important to note that health care is innately local, and as a result, providers must understand the unique characteristics of the market in which they operate, there are a number of national trends to note. As of January 2015 there were 405 participants in Centers for Medicare and Medicaid Services (CMS) Medicare Accountable Care Organizations (ACOs) programs, and applications were taken in June 2015 for a new Next Generation ACO. ACOs are responsible for managing the total cost of care for a designated population.
Numerous commercial and Medicaid ACOs have evolved across the country as well. Massachusetts, Minnesota, and California are all states with a notable presence of ACOs. Other examples of payment and care This document provides a historical look at numerous ratios and trends in the industry over the last 5 to 10 years. Key ratios Occupancy — We continue to see a decline in overall occupancy.
It has decreased from 91.9 percent in 2010 to 90.4 percent in 2014. This is likely a result of shorter stays, use of alternatives such as home and community services, and changes in hospital referral patterns. Earnings Before Interest, Taxes, Depreciation, and Amortization (EBITDA) — The median EBITDA ratio has CLAconnect.com/seniorliving 5 ©2015 CliftonLarsonAllen LLP . 30th Edition: Skilled Nursing Facility Cost Comparison delivery reform include bundled or episodic payments, value-based purchasing, and medical homes. There are currently more than 6,000 providers/organizations who are either participating in Phase I — information gathering — or Phase II — risk bearing/receive bundled payment — in one or more of the four types of CMS bundled payment models. Health Care Organizations’ To-Do List • Identify efficiencies and remove waste • Embrace evidence-based medicine Preventable readmissions and chronic disease management remain important issues for post acute providers. For 2015, CMS has scheduled readmission penalties to hospitals to increase by 3 percent. CMS will begin monitoring the 30-day all-cause readmission rate for skilled nursing facilities on October 1, 2015, and 2 percent of Medicare SNF payments will be at risk for this measure beginning October 1, 2018.
All post-acute providers will also begin reporting new measures to CMS as a result of the Improving Medicare Post-Acute Care Transformation (IMPACT) Act passed in September 2014. It is expected that in future years, value-based payment will be tied to these measures as well. • Enhance clinical competencies • Measure outcomes • Manage different payment methodologies in the near- and mid-term • Select strategic partners • Determine IT needs Commercial payers are rolling out total cost of care contracts and plans for the dually eligible population in states across the country. As a result of ACOs and this commercial payer activity, it will be crucial for post acute providers to develop competencies in contracting that were not essential in prior fiscal years. • Create a culture of change that honors patient choice Nationwide, a clear shift away from volume-based reimbursement to valuebased reimbursement is underway. Nationwide, a clear shift away from volume-based reimbursement to value-based reimbursement is underway.
Both public (CMS) and private payers announced goals to move 75% or more of their payments to providers to a value-based payment model ranging from pay-for-performance to bundled payment, medical homes and shared savings, or total cost of care arrangements. Health care providers, employers, and insurers are faced with a cultural shift that will require them to address upfront investments and reduced near-term reimbursements. Patient-centered care and coordination among providers will be essential for success in this shift from volume to value. CLAconnect.com/seniorliving 6 ©2015 CliftonLarsonAllen LLP . 30th Edition: Perspective on Ratios and Costs Skilled Nursing Facility Cost Comparison Ratio and cost analyses have been computed using information primarily from audited financial statements of our senior living clients. The data has been gathered and analyzed by representatives from our health care practice. The participation in this study is voluntary. This report represents data from approximately 450 nursing facilities, including for-profit and nonprofit in stand-alone and affiliated type organizations. Ratio and cost analyses Analysis of appropriate ratio and cost data can assist in the assessment of an organization’s solvency, cost efficiency, and profitability. A critical element in the review of an organization’s financial condition is understanding the magnitude of any variance in cost structure or operations compared to similar organizations, and then taking the initiative to investigate and understand the reason for any variance.
Ultimately, understanding the cause of variances may lead to a series of operational changes that may both improve quality and create operational efficiencies. Presentation of data Section I presents various ratio analyses depicting the financial and operating condition of the nursing facilities included in their respective geographic region, including the Midwest, Northeast, and Southeast. This section is segregated into three categories: financial statement indicators, operating indicators, and staffing indicators. Included with each of these ratio analyses is a brief definition of the ratio and a brief commentary on what the results appear to indicate. Consistently and routinely monitoring key financial and operational indicators can assist management in identifying opportunities to improve operations. Some of the pros and cons of using comparative indicators are outlined below. Section II consists of cost analyses.
The cost analyses are sorted solely by geographic region. The presentation of the per diem cost comparisons, compensated hours analyses, and property cost information is based on each geographic region, and the overall database’s 10th percentile, 25th percentile, 50th percentile, 75th percentile and 90th percentile. Pros • Highlight areas of potential opportunity or challenges for an organization • Provide comparisons to similar organizations • Identify unusual operating results and trends Percentile rankings Sections I and II of the publication provide a variety of benchmarks for the financial ratios and cost analyses. Each facility’s data was ranked in ascending or descending order and then assembled into the percentile rankings. The 90th percentile represents the mean of the top 10 percent of the population, the 75th percentile represents the mean of the top 25 percent of the population, the 50th percentile represents the median of the population, the 25th percentile represents the mean of the bottom 25 percent of the population, and the 10th percentile represents the mean of the bottom 10 percent of the population. For example, in the cost analysis section, those facilities with the lowest cost base would be included in the 90th percentile as they represent the mean of the top 10 percent. Cons • Variances alone do not necessarily reflect an opportunity or a challenge • Potential for inconsistency in data collection can reduce the usefulness of comparisons • Benchmarks should be used in conjunction with other analysis of operations Ultimately, no ratio or cost comparison should be used alone to assess the financial condition of an organization. Variances from benchmarks should be investigated and reviewed in conjunction with the decision maker’s understanding of the specific organization.
Finally, users should consider that it is the process of benchmarking that creates organizational value. CLAconnect.com/seniorliving 7 ©2015 CliftonLarsonAllen LLP . 30th Edition: Skilled Nursing Facility Cost Comparison Uses of this publication The purpose of this publication is to provide financial ratio and cost comparison data for CliftonLarsonAllen’s senior living clients. In addition, it can assist decision makers in understanding and meeting their responsibilities to residents, assessing their facility operations in comparison to specific benchmarks, and promoting a better understanding of the nursing facility field to external viewers, including investors, legislators, and the general public. Overall, the ratio analyses and cost analyses published in this report should be used on an ongoing basis by decision makers within an organization to assist in strategic planning and internal budgeting and to define and track financial and operating goals. CLAconnect.com/seniorliving 8 ©2015 CliftonLarsonAllen LLP . 30th Edition: Section I: Ratio Analysis Skilled Nursing Facility Cost Comparison Financial statement indicators The financial statement ratios included in this section illustrate the financial condition of nursing facilities. Valuable insights into a facility’s financial condition and operational performance can be gained through analysis of key financial statement indicators. Current Assets Current Liabilities Current Ratio Defined: Measures the liquidity of a facility and is used to determine the degree to which current liabilities are covered by current assets or the ability of a facility to pay short-term obligations as they come due. “Current Assets” consist of a facility’s cash and other assets such as accounts receivable, prepaid expenses, and investments that can be easily converted into cash. “Current Liabilities” include accounts payable, accrued expenses, current portion of long-term debt, and other obligations payable within one year. 1.0 may represent a liquidity problem for a facility. A trend of a decreasing current ratio may provide an early signal that the facility is experiencing financial difficulties. Quartiles Totals 50% 75% 2010 1.1 2.0 3.6 2011 1.1 1.9 3.4 2012 1.0 1.8 3.4 2013 0.9 1.6 2.9 2014 The higher the current ratio, the greater the ability a facility has in meeting its short-term obligations as they come due.
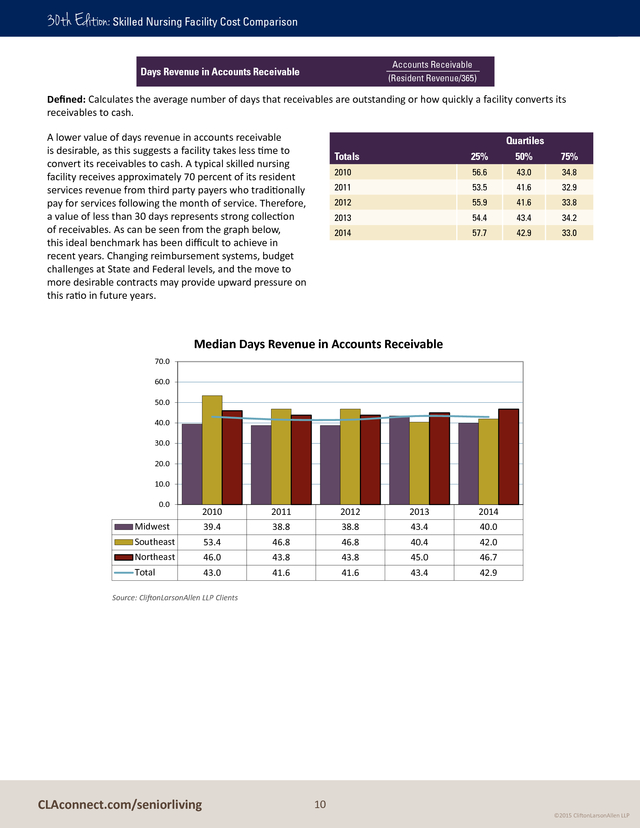
A high liquidity must be weighed against the ability of a facility to obtain higher investment earnings by investing in longer-term investments. A ratio of less than 25% 0.8 1.5 2.8 Median Current Ratio 3.0 2.5 2.0 1.5 1.0 0.5 0.0 2010 2011 2012 2013 2014 Midwest 2.0 2.0 2.0 1.5 1.8 Southeast 0.9 0.5 0.6 0.8 1.0 Northeast 2.1 2.0 1.9 1.7 1.5 Total 2.0 1.9 1.8 1.6 1.5 Source: CliftonLarsonAllen LLP Clients CLAconnect.com/seniorliving 9 ©2015 CliftonLarsonAllen LLP . 30th Edition: Skilled Nursing Facility Cost Comparison Accounts Receivable (Resident Revenue/365) Days Revenue in Accounts Receivable Defined: Calculates the average number of days that receivables are outstanding or how quickly a facility converts its receivables to cash. A lower value of days revenue in accounts receivable is desirable, as this suggests a facility takes less time to convert its receivables to cash. A typical skilled nursing facility receives approximately 70 percent of its resident services revenue from third party payers who traditionally pay for services following the month of service. Therefore, a value of less than 30 days represents strong collection of receivables. As can be seen from the graph below, this ideal benchmark has been difficult to achieve in recent years.
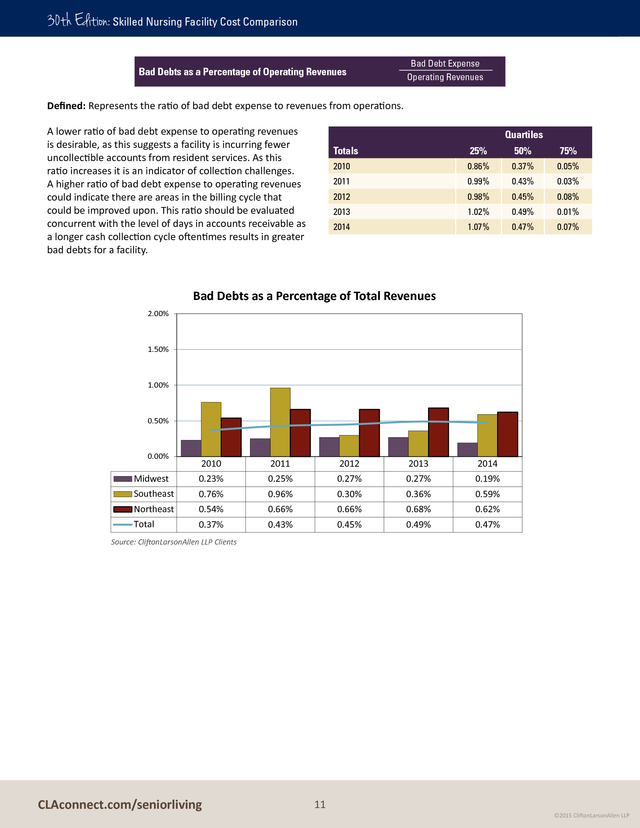
Changing reimbursement systems, budget challenges at State and Federal levels, and the move to more desirable contracts may provide upward pressure on this ratio in future years. Quartiles Totals 25% 50% 75% 2010 56.6 43.0 34.8 2011 53.5 41.6 32.9 2012 55.9 41.6 33.8 2013 54.4 43.4 34.2 2014 57.7 42.9 33.0 Median Days Revenue in Accounts Receivable 70.0 60.0 50.0 40.0 30.0 20.0 10.0 0.0 2010 2011 2012 2013 2014 Midwest 39.4 38.8 38.8 43.4 40.0 Southeast 53.4 46.8 46.8 40.4 42.0 Northeast 46.0 43.8 43.8 45.0 46.7 Total 43.0 41.6 41.6 43.4 42.9 Source: CliftonLarsonAllen LLP Clients CLAconnect.com/seniorliving 10 ©2015 CliftonLarsonAllen LLP . 30th Edition: Skilled Nursing Facility Cost Comparison Bad Debts as a Percentage of Operating Revenues Bad Debt Expense Operating Revenues Defined: Represents the ratio of bad debt expense to revenues from operations. A lower ratio of bad debt expense to operating revenues is desirable, as this suggests a facility is incurring fewer uncollectible accounts from resident services. As this ratio increases it is an indicator of collection challenges. A higher ratio of bad debt expense to operating revenues could indicate there are areas in the billing cycle that could be improved upon. This ratio should be evaluated concurrent with the level of days in accounts receivable as a longer cash collection cycle oftentimes results in greater bad debts for a facility. Quartiles Totals 25% 50% 75% 2010 0.86% 0.37% 0.05% 2011 0.99% 0.43% 0.03% 2012 0.98% 0.45% 0.08% 2013 1.02% 0.49% 0.01% 2014 1.07% 0.47% 0.07% Bad Debts as a Percentage of Total Revenues 2.00% 1.50% 1.00% 0.50% 0.00% 2010 2011 2012 2013 2014 Midwest 0.23% 0.25% 0.27% 0.27% 0.19% Southeast 0.76% 0.96% 0.30% 0.36% 0.59% Northeast 0.54% 0.66% 0.66% 0.68% 0.62% Total 0.37% 0.43% 0.45% 0.49% 0.47% Source: CliftonLarsonAllen LLP Clients CLAconnect.com/seniorliving 11 ©2015 CliftonLarsonAllen LLP . 30th Edition: Skilled Nursing Facility Cost Comparison Days Cash-on-Hand Cash and Cash Equivalents (Operating Expenses – Depreciation)/365 Defined: Measures how long cash on hand will cover average expenses. Similar to the current ratio, a high number of days cash-onhand is considered favorable; however, an extremely high ratio may indicate that the facility could earn a higher rate of return by investing in longer-term investments. A cash position of 60+ days is a target, allowing facilities to pay employees and vendors without the worry of when checks from third party payers arrive. The value of days cash-on-hand has remained relatively level over the last five years, however, it is still below the desired range of 60+ days cash on hand. In our current economic state, facilities are experiencing cash shortages and must closely monitor the timing of payrolls and payment of accounts payable with the receipts from third party payers. To monitor this, we have added an additional graph which calculates the days cash-on-hand using both cash and unrestricted investments. The inclusion of investments, specifically in nonprofit organizations, provides a clearer picture as to the actual liquid resources available to cover average daily expenses.
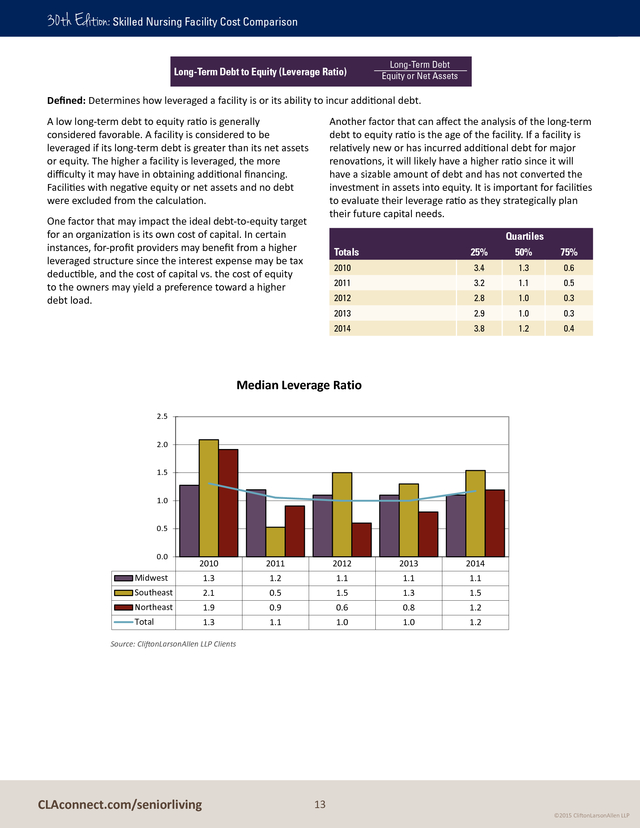
Due to this the quartiles presented to the right include the impact of investments. Quartiles Totals 25% 50% 75% 2010 7.9 36.2 78.3 2011 4.3 21.4 65.0 2012 13.6 40.8 102.4 2013 16.0 50.5 130.2 2014 14.8 45.7 108.5 Median Days Cash-on-Hand Including Investments Median Days Cash-on-Hand 50 45 60 40 35 50 30 40 25 30 20 15 20 10 10 5 - - 2010 2011 2012 2013 2014 2010 2011 2012 2013 2014 Midwest 31.1 28.9 23.9 24.6 25.2 Midwest 43.2 38.4 42.2 55.9 51.8 Southeast 10.5 20.3 22.7 31.9 48.2 Southeast 16.8 21.3 22.7 42.7 55.3 Northeast 13.3 14.7 12.7 15.3 14.0 Northeast 13.3 14.7 39.6 47.0 43.6 Total 20.9 19.4 17.4 21.4 18.5 Total 36.2 21.4 40.8 50.5 45.7 Source: CliftonLarsonAllen LLP Clients CLAconnect.com/seniorliving 12 ©2015 CliftonLarsonAllen LLP . 30th Edition: Skilled Nursing Facility Cost Comparison Long-Term Debt to Equity (Leverage Ratio) Long-Term Debt Equity or Net Assets Defined: Determines how leveraged a facility is or its ability to incur additional debt. A low long-term debt to equity ratio is generally considered favorable. A facility is considered to be leveraged if its long-term debt is greater than its net assets or equity. The higher a facility is leveraged, the more difficulty it may have in obtaining additional financing. Facilities with negative equity or net assets and no debt were excluded from the calculation. Another factor that can affect the analysis of the long-term debt to equity ratio is the age of the facility. If a facility is relatively new or has incurred additional debt for major renovations, it will likely have a higher ratio since it will have a sizable amount of debt and has not converted the investment in assets into equity.
It is important for facilities to evaluate their leverage ratio as they strategically plan their future capital needs. One factor that may impact the ideal debt-to-equity target for an organization is its own cost of capital. In certain instances, for-profit providers may benefit from a higher leveraged structure since the interest expense may be tax deductible, and the cost of capital vs. the cost of equity to the owners may yield a preference toward a higher debt load. Quartiles Totals 25% 50% 75% 2010 3.4 1.3 0.6 2011 3.2 1.1 0.5 2012 2.8 1.0 0.3 2013 2.9 1.0 0.3 2014 3.8 1.2 0.4 Median Leverage Ratio 2.5 2.0 1.5 1.0 0.5 0.0 2010 2011 2012 2013 2014 Midwest 1.3 1.2 1.1 1.1 1.1 Southeast 2.1 0.5 1.5 1.3 1.5 Northeast 1.9 0.9 0.6 0.8 1.2 Total 1.3 1.1 1.0 1.0 1.2 Source: CliftonLarsonAllen LLP Clients CLAconnect.com/seniorliving 13 ©2015 CliftonLarsonAllen LLP .
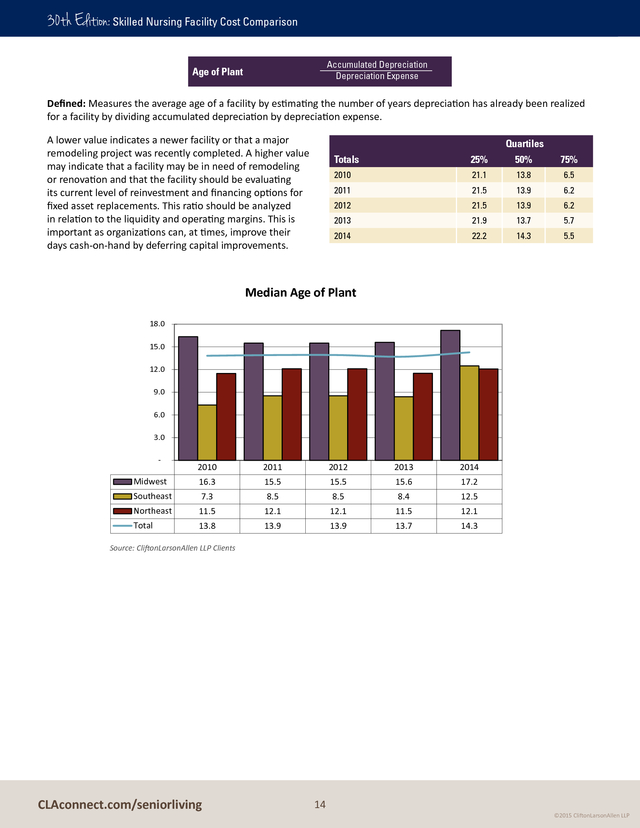
30th Edition: Skilled Nursing Facility Cost Comparison Accumulated Depreciation Depreciation Expense Age of Plant Defined: Measures the average age of a facility by estimating the number of years depreciation has already been realized for a facility by dividing accumulated depreciation by depreciation expense. A lower value indicates a newer facility or that a major remodeling project was recently completed. A higher value may indicate that a facility may be in need of remodeling or renovation and that the facility should be evaluating its current level of reinvestment and financing options for fixed asset replacements. This ratio should be analyzed in relation to the liquidity and operating margins. This is important as organizations can, at times, improve their days cash-on-hand by deferring capital improvements. Quartiles Totals 25% 50% 75% 2010 21.1 13.8 6.5 2011 21.5 13.9 6.2 2012 21.5 13.9 6.2 2013 21.9 13.7 5.7 2014 22.2 14.3 5.5 Median Age of Plant 18.0 15.0 12.0 9.0 6.0 3.0 - Midwest 2010 2011 2012 2013 2014 16.3 15.5 15.5 15.6 17.2 Southeast 7.3 8.5 8.5 8.4 12.5 Northeast 11.5 12.1 12.1 11.5 12.1 Total 13.8 13.9 13.9 13.7 14.3 Source: CliftonLarsonAllen LLP Clients CLAconnect.com/seniorliving 14 ©2015 CliftonLarsonAllen LLP .
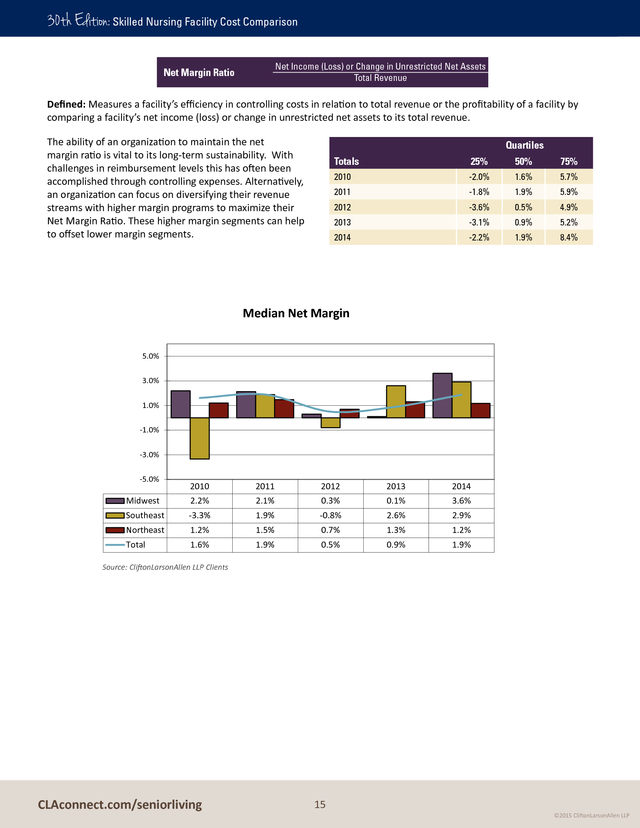
30th Edition: Skilled Nursing Facility Cost Comparison Net Income (Loss) or Change in Unrestricted Net Assets Total Revenue Net Margin Ratio Defined: Measures a facility’s efficiency in controlling costs in relation to total revenue or the profitability of a facility by comparing a facility’s net income (loss) or change in unrestricted net assets to its total revenue. The ability of an organization to maintain the net margin ratio is vital to its long-term sustainability. With challenges in reimbursement levels this has often been accomplished through controlling expenses. Alternatively, an organization can focus on diversifying their revenue streams with higher margin programs to maximize their Net Margin Ratio. These higher margin segments can help to offset lower margin segments. Quartiles Totals 25% 50% 75% 2010 -2.0% 1.6% 5.7% 2011 -1.8% 1.9% 5.9% 2012 -3.6% 0.5% 4.9% 2013 -3.1% 0.9% 5.2% 2014 -2.2% 1.9% 8.4% Median Net Margin 5.0% 3.0% 1.0% -1.0% -3.0% -5.0% 2010 2011 2012 2013 2014 Midwest 2.2% Southeast -3.3% 2.1% 0.3% 0.1% 3.6% 1.9% -0.8% 2.6% 2.9% Northeast Total 1.2% 1.5% 0.7% 1.3% 1.2% 1.6% 1.9% 0.5% 0.9% 1.9% Source: CliftonLarsonAllen LLP Clients CLAconnect.com/seniorliving 15 ©2015 CliftonLarsonAllen LLP .
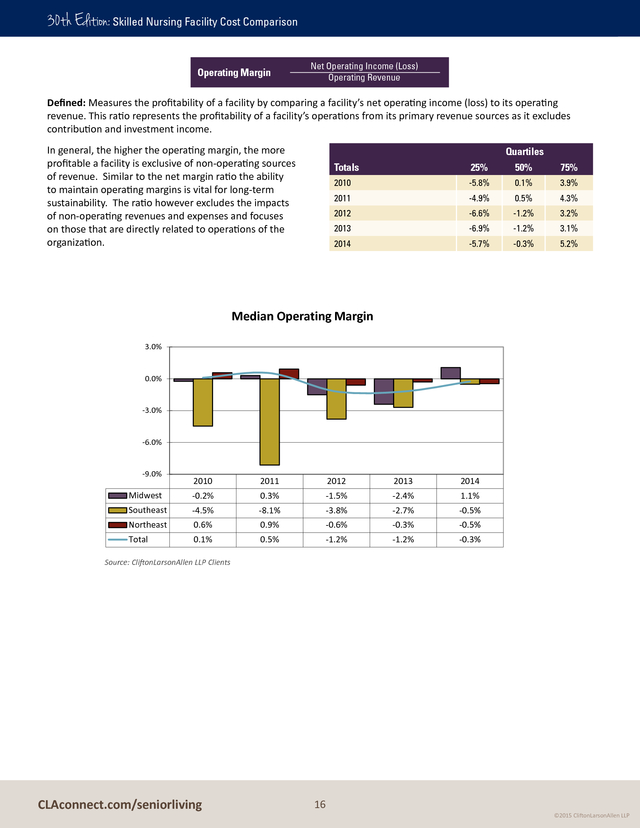
30th Edition: Skilled Nursing Facility Cost Comparison Operating Margin Net Operating Income (Loss) Operating Revenue Defined: Measures the profitability of a facility by comparing a facility’s net operating income (loss) to its operating revenue. This ratio represents the profitability of a facility’s operations from its primary revenue sources as it excludes contribution and investment income. In general, the higher the operating margin, the more profitable a facility is exclusive of non-operating sources of revenue. Similar to the net margin ratio the ability to maintain operating margins is vital for long-term sustainability. The ratio however excludes the impacts of non-operating revenues and expenses and focuses on those that are directly related to operations of the organization. Quartiles Totals 25% 50% 75% 2010 -5.8% 0.1% 3.9% 2011 -4.9% 0.5% 4.3% 2012 -6.6% -1.2% 3.2% 2013 -6.9% -1.2% 3.1% 2014 -5.7% -0.3% 5.2% Median Operating Margin 3.0% 0.0% -3.0% -6.0% -9.0% 2010 2011 2012 2013 2014 Midwest -0.2% 0.3% -1.5% -2.4% 1.1% Southeast -4.5% -8.1% -3.8% -2.7% -0.5% Northeast 0.6% 0.9% -0.6% -0.3% -0.5% Total 0.1% 0.5% -1.2% -1.2% -0.3% Source: CliftonLarsonAllen LLP Clients CLAconnect.com/seniorliving 16 ©2015 CliftonLarsonAllen LLP .
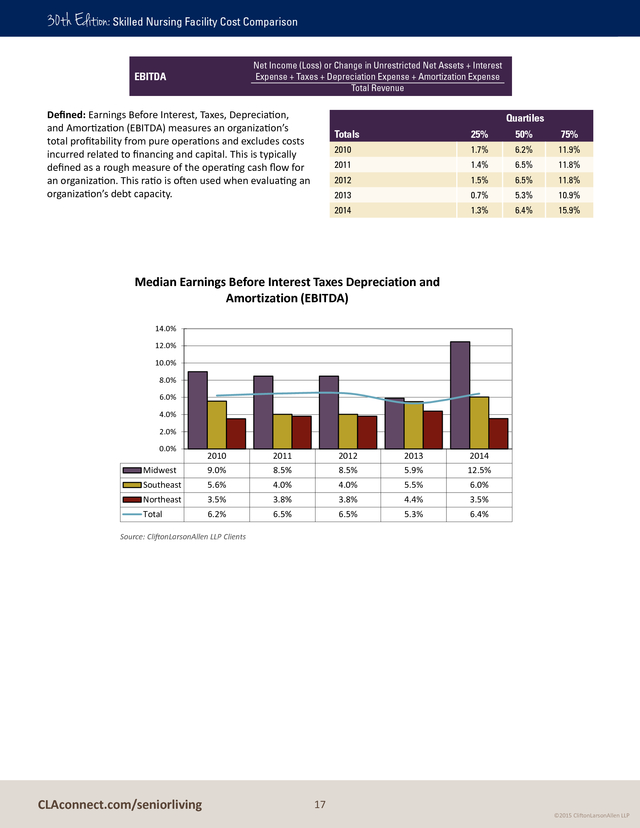
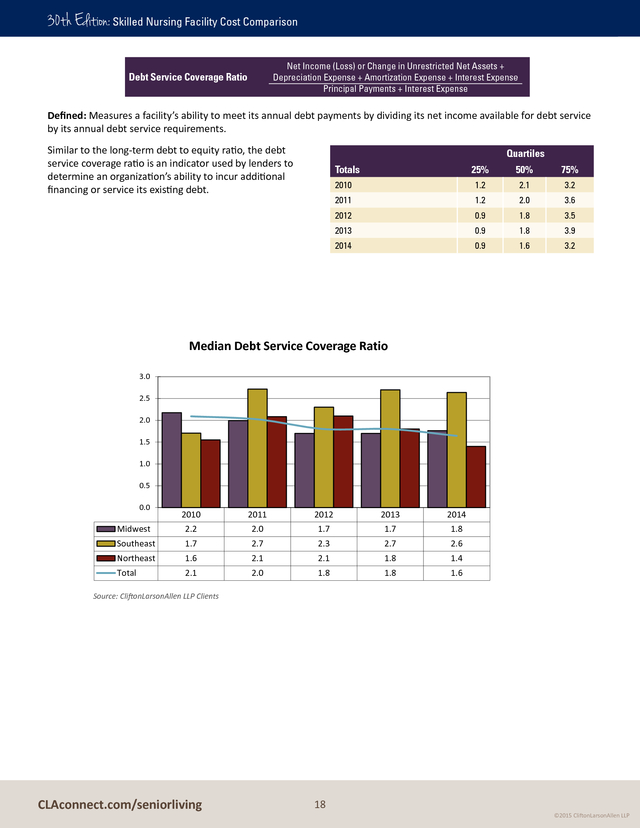
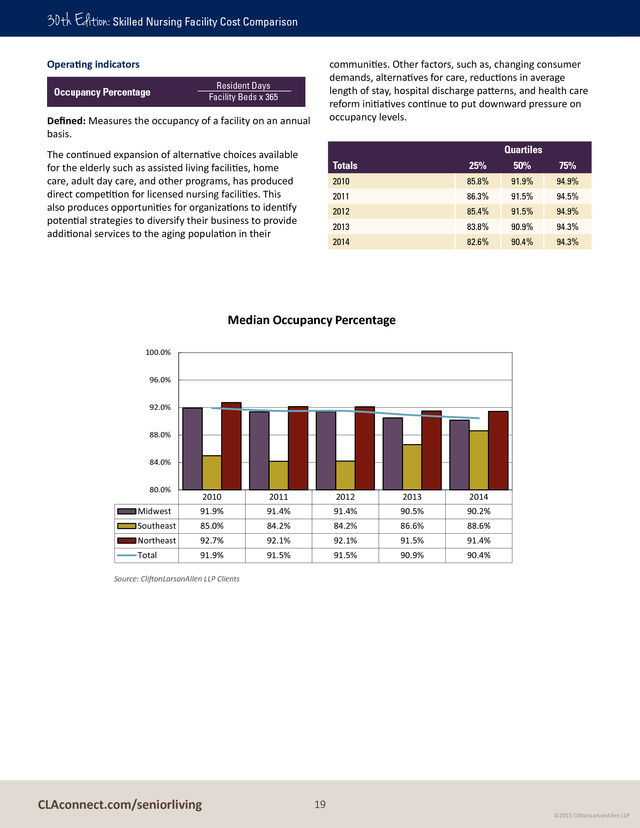
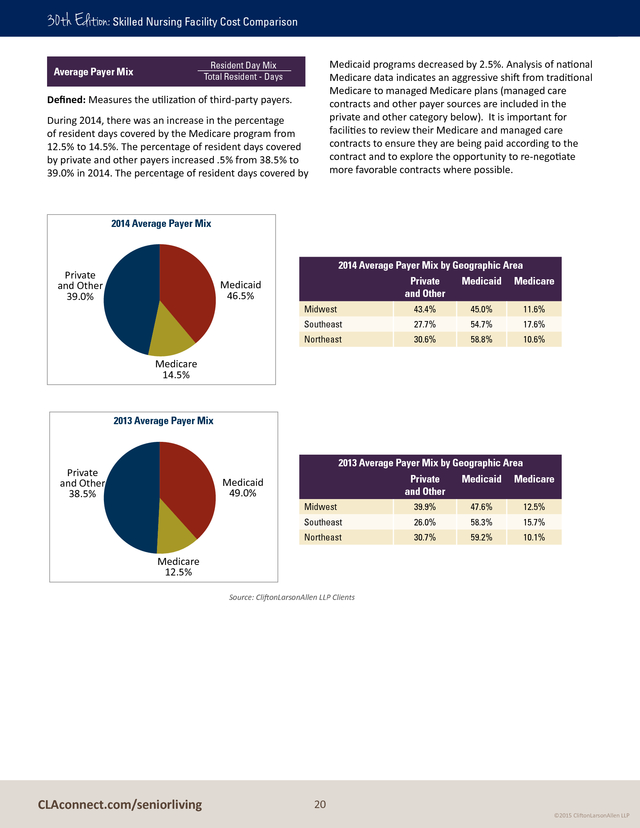
30th Edition: Skilled Nursing Facility Cost Comparison Net Income (Loss) or Change in Unrestricted Net Assets + Interest Expense + Taxes + Depreciation Expense + Amortization Expense Total Revenue EBITDA Defined: Earnings Before Interest, Taxes, Depreciation, and Amortization (EBITDA) measures an organization’s total profitability from pure operations and excludes costs incurred related to financing and capital. This is typically defined as a rough measure of the operating cash flow for an organization. This ratio is often used when evaluating an organization’s debt capacity. Quartiles Totals 25% 50% 75% 2010 1.7% 6.2% 11.9% 2011 1.4% 6.5% 11.8% 2012 1.5% 6.5% 11.8% 2013 0.7% 5.3% 10.9% 2014 1.3% 6.4% 15.9% Median Earnings Before Interest Taxes Depreciation and Amortization (EBITDA) 14.0% 12.0% 10.0% 8.0% 6.0% 4.0% 2.0% 0.0% 2010 2011 2012 2013 2014 Midwest 9.0% 8.5% 8.5% 5.9% 12.5% Southeast 5.6% 4.0% 4.0% 5.5% 6.0% Northeast 3.5% 3.8% 3.8% 4.4% 3.5% Total 6.2% 6.5% 6.5% 5.3% 6.4% Source: CliftonLarsonAllen LLP Clients CLAconnect.com/seniorliving 17 ©2015 CliftonLarsonAllen LLP . 30th Edition: Skilled Nursing Facility Cost Comparison Net Income (Loss) or Change in Unrestricted Net Assets + Depreciation Expense + Amortization Expense + Interest Expense Principal Payments + Interest Expense Debt Service Coverage Ratio Defined: Measures a facility’s ability to meet its annual debt payments by dividing its net income available for debt service by its annual debt service requirements. Similar to the long-term debt to equity ratio, the debt service coverage ratio is an indicator used by lenders to determine an organization’s ability to incur additional financing or service its existing debt. Quartiles Totals 25% 50% 75% 2010 1.2 2.1 3.2 2011 1.2 2.0 3.6 2012 0.9 1.8 3.5 2013 0.9 1.8 3.9 2014 0.9 1.6 3.2 Median Debt Service Coverage Ratio 3.0 2.5 2.0 1.5 1.0 0.5 0.0 2010 2011 2012 2013 2014 Midwest 2.2 2.0 1.7 1.7 1.8 Southeast 1.7 2.7 2.3 2.7 2.6 Northeast 1.6 2.1 2.1 1.8 1.4 Total 2.1 2.0 1.8 1.8 1.6 Source: CliftonLarsonAllen LLP Clients CLAconnect.com/seniorliving 18 ©2015 CliftonLarsonAllen LLP . 30th Edition: Skilled Nursing Facility Cost Comparison Operating indicators communities. Other factors, such as, changing consumer demands, alternatives for care, reductions in average length of stay, hospital discharge patterns, and health care reform initiatives continue to put downward pressure on occupancy levels. Resident Days Facility Beds x 365 Occupancy Percentage Defined: Measures the occupancy of a facility on an annual basis. Quartiles The continued expansion of alternative choices available for the elderly such as assisted living facilities, home care, adult day care, and other programs, has produced direct competition for licensed nursing facilities. This also produces opportunities for organizations to identify potential strategies to diversify their business to provide additional services to the aging population in their Totals 25% 50% 75% 2010 85.8% 91.9% 94.9% 2011 86.3% 91.5% 94.5% 2012 85.4% 91.5% 94.9% 2013 83.8% 90.9% 94.3% 2014 82.6% 90.4% 94.3% Median Occupancy Percentage 100.0% 96.0% 92.0% 88.0% 84.0% 80.0% 2010 2011 2012 2013 2014 Midwest 91.9% 91.4% 91.4% 90.5% 90.2% Southeast 85.0% 84.2% 84.2% 86.6% 88.6% Northeast 92.7% 92.1% 92.1% 91.5% 91.4% Total 91.9% 91.5% 91.5% 90.9% 90.4% Source: CliftonLarsonAllen LLP Clients CLAconnect.com/seniorliving 19 ©2015 CliftonLarsonAllen LLP . 30th Edition: Skilled Nursing Facility Cost Comparison Medicaid programs decreased by 2.5%. Analysis of national Medicare data indicates an aggressive shift from traditional Medicare to managed Medicare plans (managed care contracts and other payer sources are included in the private and other category below). It is important for facilities to review their Medicare and managed care contracts to ensure they are being paid according to the contract and to explore the opportunity to re-negotiate more favorable contracts where possible. Resident Day Mix Total Resident - Days Average Payer Mix Defined: Measures the utilization of third-party payers. During 2014, there was an increase in the percentage of resident days covered by the Medicare program from 12.5% to 14.5%. The percentage of resident days covered by private and other payers increased .5% from 38.5% to 39.0% in 2014.
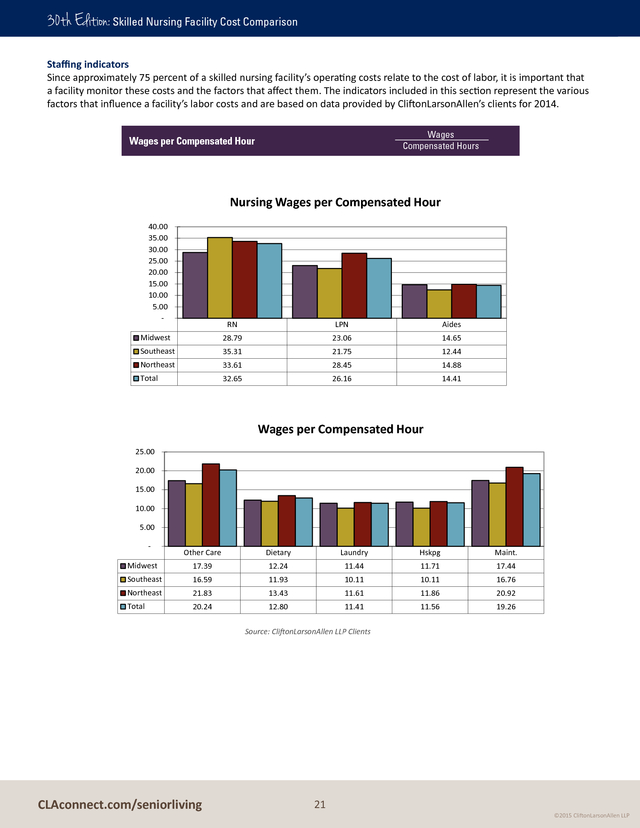
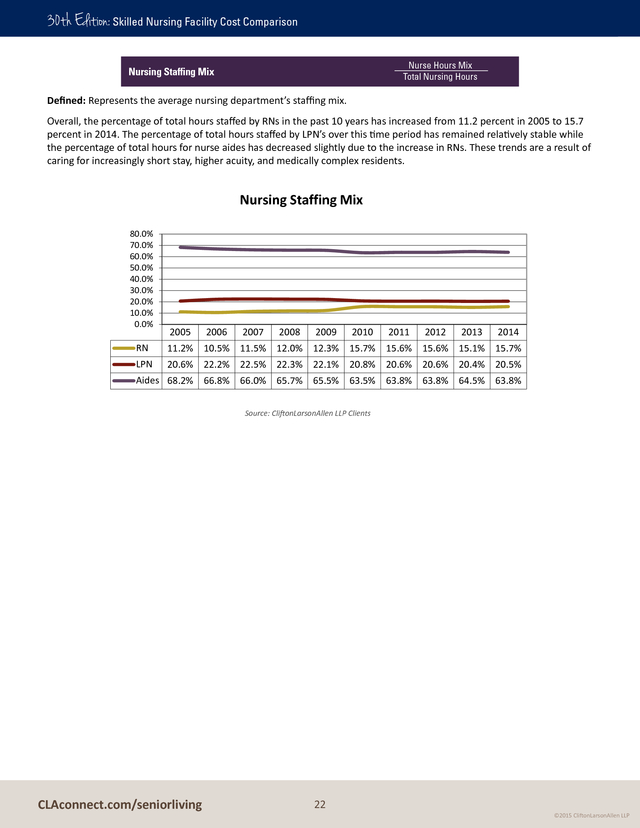
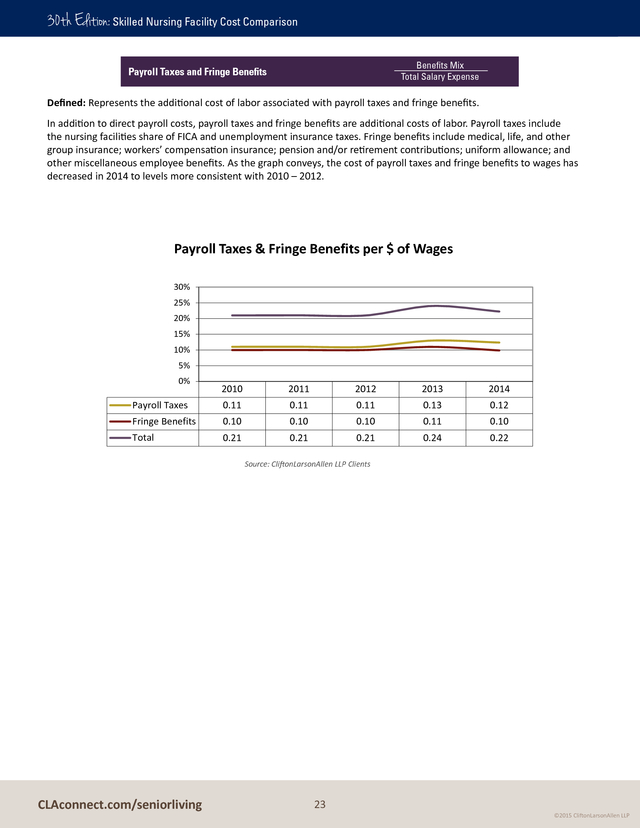
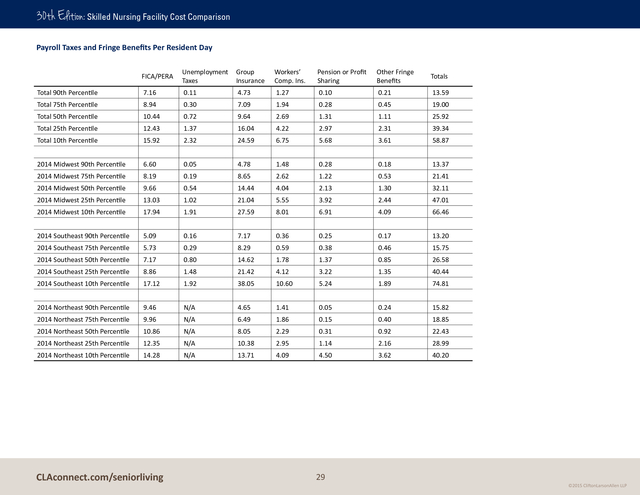
The percentage of resident days covered by 2014 Average Payer Mix 2014 Average Payer Mix by Geographic Area Private and Other 39.0% Private and Other Medicaid Medicare Midwest 43.4% 45.0% 11.6% Southeast 27.7% 54.7% 17.6% Northeast 30.6% 58.8% 10.6% Medicaid 46.5% Medicare 14.5% 2013 Average Payer Mix 2013 Average Payer Mix by Geographic Area Private and Other 38.5% Private and Other Medicaid Medicare Midwest 39.9% 47.6% 12.5% Southeast 26.0% 58.3% 15.7% Northeast 30.7% 59.2% 10.1% Medicaid 49.0% Medicare 12.5% Source: CliftonLarsonAllen LLP Clients CLAconnect.com/seniorliving 20 ©2015 CliftonLarsonAllen LLP . 30th Edition: Skilled Nursing Facility Cost Comparison Staffing indicators Since approximately 75 percent of a skilled nursing facility’s operating costs relate to the cost of labor, it is important that a facility monitor these costs and the factors that affect them. The indicators included in this section represent the various factors that influence a facility’s labor costs and are based on data provided by CliftonLarsonAllen’s clients for 2014. Wages Compensated Hours Wages per Compensated Hour Nursing Wages per Compensated Hour 40.00 35.00 30.00 25.00 20.00 15.00 10.00 5.00 - RN LPN Aides Midwest 28.79 23.06 14.65 Southeast 35.31 21.75 12.44 Northeast 33.61 28.45 14.88 Total 32.65 26.16 14.41 Wages per Compensated Hour 25.00 20.00 15.00 10.00 5.00 - Other Care Dietary Laundry Hskpg Maint. Midwest 17.39 12.24 11.44 11.71 17.44 Southeast 16.59 11.93 10.11 10.11 16.76 Northeast 21.83 13.43 11.61 11.86 20.92 Total 20.24 12.80 11.41 11.56 19.26 Source: CliftonLarsonAllen LLP Clients CLAconnect.com/seniorliving 21 ©2015 CliftonLarsonAllen LLP . 30th Edition: Skilled Nursing Facility Cost Comparison Nurse Hours Mix Total Nursing Hours Nursing Staffing Mix Defined: Represents the average nursing department’s staffing mix. Overall, the percentage of total hours staffed by RNs in the past 10 years has increased from 11.2 percent in 2005 to 15.7 percent in 2014. The percentage of total hours staffed by LPN’s over this time period has remained relatively stable while the percentage of total hours for nurse aides has decreased slightly due to the increase in RNs. These trends are a result of caring for increasingly short stay, higher acuity, and medically complex residents. Nursing Staffing Mix 80.0% 70.0% 60.0% 50.0% 40.0% 30.0% 20.0% 10.0% 0.0% 2005 2006 2007 2008 2009 2010 2011 2012 2013 2014 RN 11.2% 10.5% 11.5% 12.0% 12.3% 15.7% 15.6% 15.6% 15.1% 15.7% LPN 20.6% 22.2% 22.5% 22.3% 22.1% 20.8% 20.6% 20.6% 20.4% 20.5% Aides 68.2% 66.8% 66.0% 65.7% 65.5% 63.5% 63.8% 63.8% 64.5% 63.8% Source: CliftonLarsonAllen LLP Clients CLAconnect.com/seniorliving 22 ©2015 CliftonLarsonAllen LLP . 30th Edition: Skilled Nursing Facility Cost Comparison Benefits Mix Total Salary Expense Payroll Taxes and Fringe Benefits Defined: Represents the additional cost of labor associated with payroll taxes and fringe benefits. In addition to direct payroll costs, payroll taxes and fringe benefits are additional costs of labor. Payroll taxes include the nursing facilities share of FICA and unemployment insurance taxes. Fringe benefits include medical, life, and other group insurance; workers’ compensation insurance; pension and/or retirement contributions; uniform allowance; and other miscellaneous employee benefits. As the graph conveys, the cost of payroll taxes and fringe benefits to wages has decreased in 2014 to levels more consistent with 2010 – 2012. Payroll Taxes & Fringe Benefits per $ of Wages 30% 25% 20% 15% 10% 5% 0% 2010 2011 2012 2013 2014 Payroll Taxes 0.11 0.11 0.11 0.13 0.12 Fringe Benefits 0.10 0.10 0.10 0.11 0.10 Total 0.21 0.21 0.21 0.24 0.22 Source: CliftonLarsonAllen LLP Clients CLAconnect.com/seniorliving 23 ©2015 CliftonLarsonAllen LLP .
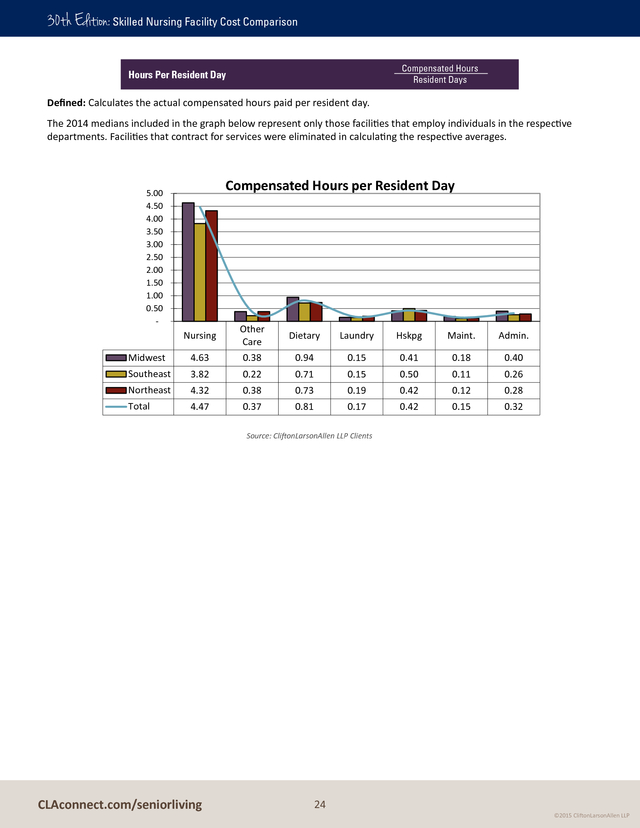
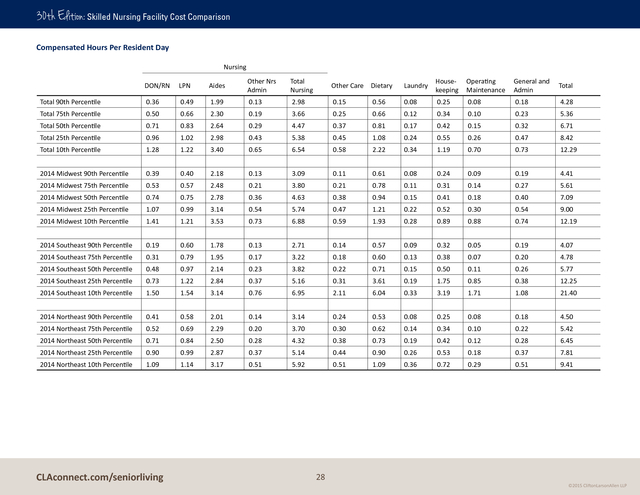
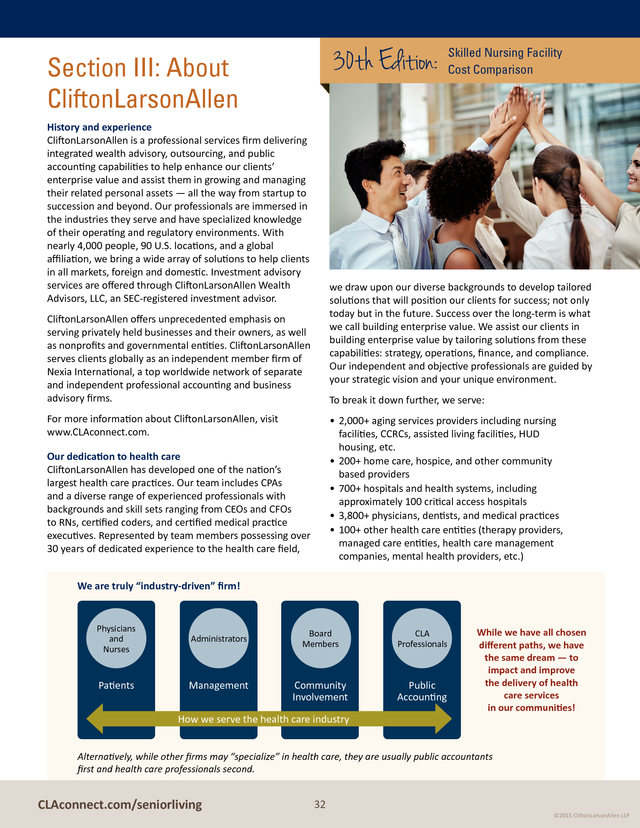
30th Edition: Skilled Nursing Facility Cost Comparison Compensated Hours Resident Days Hours Per Resident Day Defined: Calculates the actual compensated hours paid per resident day. The 2014 medians included in the graph below represent only those facilities that employ individuals in the respective departments. Facilities that contract for services were eliminated in calculating the respective averages. Compensated Hours per Resident Day 5.00 4.50 4.00 3.50 3.00 2.50 2.00 1.50 1.00 0.50 - Nursing Other Care Dietary Laundry Hskpg Maint. Admin. Midwest 4.63 0.38 0.94 0.15 0.41 0.18 0.40 Southeast 3.82 0.22 0.71 0.15 0.50 0.11 0.26 Northeast 4.32 0.38 0.73 0.19 0.42 0.12 0.28 Total 4.47 0.37 0.81 0.17 0.42 0.15 0.32 Source: CliftonLarsonAllen LLP Clients CLAconnect.com/seniorliving 24 ©2015 CliftonLarsonAllen LLP . 30th Edition: Licensed Nursing Facility Cost Comparison Skilled Nursing Facility Cost Comparison Section II: Cost Analyses Tables Department Totals Per Resident Day Nursing Other Care Ancillary Services Dietary Laundry Housekeeping Plant Operations Real Estate General and Administrative Payroll Benefits Totals Total 90th Percentile 69.09 3.80 11.87 14.88 1.21 3.39 8.60 0.82 10.47 19.63 143.77 Total 75th Percentile 83.77 5.59 19.37 16.56 2.11 4.48 10.45 8.33 15.22 23.00 188.88 Total 50th Percentile 96.12 7.81 29.07 19.35 2.98 5.70 12.82 14.15 25.95 31.85 245.80 Total 25th Percentile 109.48 9.71 38.62 23.63 3.88 7.33 16.14 16.88 35.47 48.38 309.52 Total 10th Percentile 125.59 11.85 52.68 29.53 5.00 9.38 24.30 18.41 44.40 69.84 390.98 2014 Midwest 90th Percentile 62.44 3.40 12.95 14.16 1.21 3.45 8.43 0.04 9.17 29.92 145.17 2014 Midwest 75th Percentile 78.48 5.41 21.84 17.48 1.98 4.49 10.02 3.16 12.09 34.86 189.81 2014 Midwest 50th Percentile 94.67 7.04 32.14 20.44 2.83 5.75 13.02 8.56 15.86 44.61 244.91 2014 Midwest 25th Percentile 107.53 8.68 44.04 24.84 3.55 7.70 17.34 9.60 26.41 63.11 312.79 2014 Midwest 10th Percentile 128.64 10.99 63.04 33.69 4.43 11.07 29.44 11.05 36.69 84.41 413.44 2014 Southeast 90th Percentile 65.00 3.48 24.02 12.94 1.05 3.50 6.59 0.03 7.44 31.04 155.07 2014 Southeast 75th Percentile 69.48 4.01 30.24 13.83 1.64 4.19 8.41 1.57 9.61 33.24 176.22 2014 Southeast 50th Percentile 84.46 4.67 41.47 15.11 2.47 5.10 9.77 2.99 13.31 47.83 227.19 2014 Southeast 25th Percentile 99.78 7.18 53.10 16.89 3.11 7.80 13.53 5.50 24.73 55.01 286.63 2014 Southeast 10th Percentile 120.79 17.10 78.80 43.88 4.41 19.37 31.59 11.59 37.78 63.80 429.10 2014 Northeast 90th Percentile 83.63 5.13 10.72 15.50 1.38 3.35 9.70 12.33 22.47 18.08 182.29 2014 Northeast 75th Percentile 90.52 7.04 18.30 16.72 2.62 4.58 11.13 15.09 25.97 20.20 212.17 2014 Northeast 50th Percentile 99.90 8.78 25.36 19.06 3.33 5.68 12.89 16.72 32.32 23.46 247.50 2014 Northeast 25th Percentile 110.91 10.24 34.30 21.79 4.22 7.17 15.82 17.61 39.12 27.79 288.98 2014 Northeast 10th Percentile 124.72 11.87 40.59 26.74 5.32 8.88 19.29 19.46 45.94 39.06 341.88 CLAconnect.com/seniorliving 25 ©2015 CliftonLarsonAllen LLP . 30th Edition: Skilled Nursing Facility Cost Comparison Salary Comparison Per Resident Day Nursing Total Pool and Nursing Consultants Social Services and Activities Ancillary Services Dietary Laundry Housekeeping Plant Operations General and Admin Totals DON & RN LPN Aides Other Nursing Admin Total 90th Percentile 9.97 11.81 26.09 2.05 0.28 50.20 3.52 1.52 6.81 0.74 2.54 1.54 4.00 70.86 Total 75th Percentile 15.17 15.92 32.02 5.12 0.48 68.71 5.26 9.49 8.47 1.34 3.58 1.99 5.95 104.79 Total 50th Percentile 21.64 21.14 37.24 7.87 1.16 89.05 7.25 14.94 10.47 1.99 4.73 2.78 8.25 139.47 Total 25th Percentile 29.34 26.04 45.03 10.65 2.69 113.76 9.27 21.39 12.67 2.79 6.03 4.00 11.93 181.86 Total 10th Percentile 37.55 30.68 51.98 14.02 6.18 140.42 11.25 26.78 16.87 3.73 7.98 6.74 17.77 231.55 2014 Midwest 90th Percentile 7.36 10.04 27.06 3.24 0.33 48.02 3.20 6.65 7.21 0.73 2.58 1.77 3.89 74.05 2014 Midwest 75th Percentile 12.15 12.98 32.42 6.32 0.56 64.43 4.88 11.29 9.34 1.24 3.41 2.45 5.71 102.75 2014 Midwest 50th Percentile 19.59 17.03 40.62 8.63 1.01 86.87 6.39 18.14 11.88 1.89 4.65 3.36 8.72 141.89 2014 Midwest 25th Percentile 29.42 21.49 49.20 12.84 2.57 115.52 8.34 23.00 15.10 2.47 6.27 4.43 12.80 187.93 2014 Midwest 10th Percentile 41.62 26.86 54.69 16.38 5.18 144.74 10.13 32.19 20.31 3.23 8.17 8.31 18.04 245.11 2014 Southeast 90th Percentile 9.84 13.21 21.80 0.66 0.25 45.75 2.39 9.34 5.13 0.84 2.47 0.83 4.86 71.63 2014 Southeast 75th Percentile 12.73 16.84 22.64 0.80 0.40 53.43 3.30 12.35 5.85 1.17 3.17 1.16 5.82 86.24 2014 Southeast 50th Percentile 17.83 21.01 26.20 1.13 1.19 67.37 3.97 17.73 6.91 1.68 4.35 1.69 7.13 110.83 2014 Southeast 25th Percentile 29.40 28.41 44.06 2.47 2.81 107.16 7.08 25.65 8.64 2.58 5.27 2.09 8.90 167.37 2014 Southeast 10th Percentile 38.95 35.64 52.27 14.96 5.81 147.64 11.18 27.57 9.99 4.34 9.26 8.57 17.20 235.74 2014 Northeast 90th Percentile 13.94 15.91 30.59 3.72 0.29 64.44 4.96 0.55 7.12 0.83 2.35 1.60 3.94 85.80 2014 Northeast 75th Percentile 17.48 19.96 33.25 5.48 0.49 76.66 6.72 6.58 8.47 1.58 3.92 1.90 6.23 112.06 2014 Northeast 50th Percentile 23.74 23.74 36.54 7.81 1.23 93.07 8.36 13.67 10.05 2.26 5.00 2.59 8.21 143.21 2014 Northeast 25th Percentile 29.76 27.78 41.12 9.72 2.76 111.14 9.83 19.69 11.75 3.17 6.09 3.33 12.09 177.08 2014 Northeast 10th Percentile 36.06 31.60 47.76 12.66 6.85 134.93 11.53 25.48 13.97 4.31 7.95 4.93 16.65 219.75 CLAconnect.com/seniorliving 26 ©2015 CliftonLarsonAllen LLP . 30th Edition: Skilled Nursing Facility Cost Comparison Salaries Per Compensated Hour Nursing DON/RN LPN Aides Other Total Nursing Nrs Admin. Other Care Dietary Laundry Housekeeping Plant Operations General and Admin Total Total 90th Percentile 20.08 19.60 11.21 19.28 15.81 13.35 10.21 8.92 8.92 14.03 17.46 88.42 Total 75th Percentile 28.27 22.05 12.92 33.59 18.05 16.25 11.59 10.03 10.28 16.30 22.78 105.28 Total 50th Percentile 32.65 26.16 14.41 44.19 20.69 20.24 12.80 11.41 11.56 19.26 27.19 123.15 Total 25th Percentile 35.92 28.94 15.94 52.69 22.69 23.56 14.10 12.84 12.79 21.74 32.77 140.48 Total 10th Percentile 40.42 31.85 18.50 63.18 24.76 28.61 15.56 14.59 13.94 25.45 39.59 162.49 2014 Midwest 90th Percentile 14.39 17.78 10.74 20.10 14.71 10.93 9.83 8.85 8.93 13.31 14.24 80.82 2014 Midwest 75th Percentile 21.67 20.30 12.29 32.09 16.77 14.93 10.74 10.05 10.47 15.77 20.03 98.76 2014 Midwest 50th Percentile 28.79 23.06 14.65 42.37 19.17 17.39 12.24 11.44 11.71 17.44 24.45 113.84 2014 Midwest 25th Percentile 33.51 26.31 16.75 51.71 22.35 21.17 13.47 13.45 12.91 20.65 28.12 132.11 2014 Midwest 10th Percentile 38.65 28.37 18.66 72.22 24.51 38.15 15.58 14.94 14.07 22.80 35.10 165.15 2014 Southeast 90th Percentile 23.60 19.46 10.14 1.98 15.39 9.23 9.60 7.99 8.19 13.69 23.26 87.36 2014 Southeast 75th Percentile 29.21 20.37 11.02 3.74 15.86 15.06 10.57 8.61 8.79 15.27 25.71 99.88 2014 Southeast 50th Percentile 35.31 21.75 12.44 9.22 17.31 16.59 11.93 10.11 10.11 16.76 29.51 112.31 2014 Southeast 25th Percentile 40.52 22.79 13.15 22.32 18.37 17.72 12.73 11.81 11.67 18.75 34.35 125.39 2014 Southeast 10th Percentile 53.86 27.68 16.21 31.67 20.49 22.81 13.57 13.48 12.81 20.62 40.08 143.86 2014 Northeast 90th Percentile 28.88 23.64 13.03 13.27 18.78 17.26 11.56 9.33 9.94 15.82 20.33 103.01 2014 Northeast 75th Percentile 31.83 26.55 13.79 15.31 20.59 19.81 12.64 10.32 10.80 18.07 24.91 117.14 2014 Northeast 50th Percentile 33.61 28.45 14.88 17.56 21.82 21.83 13.43 11.61 11.86 20.92 30.26 131.72 2014 Northeast 25th Percentile 36.29 30.27 15.88 20.71 23.58 24.62 14.58 12.75 12.93 23.51 36.19 148.16 2014 Northeast 10th Percentile 39.42 32.42 17.69 23.02 25.02 27.83 15.69 14.35 13.77 26.54 44.74 167.93 CLAconnect.com/seniorliving 27 ©2015 CliftonLarsonAllen LLP . 30th Edition: Skilled Nursing Facility Cost Comparison Compensated Hours Per Resident Day Nursing DON/RN LPN Aides Other Nrs Admin Total Nursing Other Care Dietary Laundry Housekeeping Operating Maintenance General and Admin Total Total 90th Percentile 0.36 0.49 1.99 0.13 2.98 0.15 0.56 0.08 0.25 0.08 0.18 4.28 Total 75th Percentile 0.50 0.66 2.30 0.19 3.66 0.25 0.66 0.12 0.34 0.10 0.23 5.36 Total 50th Percentile 0.71 0.83 2.64 0.29 4.47 0.37 0.81 0.17 0.42 0.15 0.32 6.71 Total 25th Percentile 0.96 1.02 2.98 0.43 5.38 0.45 1.08 0.24 0.55 0.26 0.47 8.42 Total 10th Percentile 1.28 1.22 3.40 0.65 6.54 0.58 2.22 0.34 1.19 0.70 0.73 12.29 2014 Midwest 90th Percentile 0.39 0.40 2.18 0.13 3.09 0.11 0.61 0.08 0.24 0.09 0.19 4.41 2014 Midwest 75th Percentile 0.53 0.57 2.48 0.21 3.80 0.21 0.78 0.11 0.31 0.14 0.27 5.61 2014 Midwest 50th Percentile 0.74 0.75 2.78 0.36 4.63 0.38 0.94 0.15 0.41 0.18 0.40 7.09 2014 Midwest 25th Percentile 1.07 0.99 3.14 0.54 5.74 0.47 1.21 0.22 0.52 0.30 0.54 9.00 2014 Midwest 10th Percentile 1.41 1.21 3.53 0.73 6.88 0.59 1.93 0.28 0.89 0.88 0.74 12.19 2014 Southeast 90th Percentile 0.19 0.60 1.78 0.13 2.71 0.14 0.57 0.09 0.32 0.05 0.19 4.07 2014 Southeast 75th Percentile 0.31 0.79 1.95 0.17 3.22 0.18 0.60 0.13 0.38 0.07 0.20 4.78 2014 Southeast 50th Percentile 0.48 0.97 2.14 0.23 3.82 0.22 0.71 0.15 0.50 0.11 0.26 5.77 2014 Southeast 25th Percentile 0.73 1.22 2.84 0.37 5.16 0.31 3.61 0.19 1.75 0.85 0.38 12.25 2014 Southeast 10th Percentile 1.50 1.54 3.14 0.76 6.95 2.11 6.04 0.33 3.19 1.71 1.08 21.40 2014 Northeast 90th Percentile 0.41 0.58 2.01 0.14 3.14 0.24 0.53 0.08 0.25 0.08 0.18 4.50 2014 Northeast 75th Percentile 0.52 0.69 2.29 0.20 3.70 0.30 0.62 0.14 0.34 0.10 0.22 5.42 2014 Northeast 50th Percentile 0.71 0.84 2.50 0.28 4.32 0.38 0.73 0.19 0.42 0.12 0.28 6.45 2014 Northeast 25th Percentile 0.90 0.99 2.87 0.37 5.14 0.44 0.90 0.26 0.53 0.18 0.37 7.81 2014 Northeast 10th Percentile 1.09 1.14 3.17 0.51 5.92 0.51 1.09 0.36 0.72 0.29 0.51 9.41 CLAconnect.com/seniorliving 28 ©2015 CliftonLarsonAllen LLP . 30th Edition: Skilled Nursing Facility Cost Comparison Payroll Taxes and Fringe Benefits Per Resident Day FICA/PERA Unemployment Taxes Group Insurance Workers’ Comp. Ins. Pension or Profit Sharing Other Fringe Benefits Totals Total 90th Percentile 7.16 0.11 4.73 1.27 0.10 0.21 13.59 Total 75th Percentile 8.94 0.30 7.09 1.94 0.28 0.45 19.00 Total 50th Percentile 10.44 0.72 9.64 2.69 1.31 1.11 25.92 Total 25th Percentile 12.43 1.37 16.04 4.22 2.97 2.31 39.34 Total 10th Percentile 15.92 2.32 24.59 6.75 5.68 3.61 58.87 2014 Midwest 90th Percentile 6.60 0.05 4.78 1.48 0.28 0.18 13.37 2014 Midwest 75th Percentile 8.19 0.19 8.65 2.62 1.22 0.53 21.41 2014 Midwest 50th Percentile 9.66 0.54 14.44 4.04 2.13 1.30 32.11 2014 Midwest 25th Percentile 13.03 1.02 21.04 5.55 3.92 2.44 47.01 2014 Midwest 10th Percentile 17.94 1.91 27.59 8.01 6.91 4.09 66.46 2014 Southeast 90th Percentile 5.09 0.16 7.17 0.36 0.25 0.17 13.20 2014 Southeast 75th Percentile 5.73 0.29 8.29 0.59 0.38 0.46 15.75 2014 Southeast 50th Percentile 7.17 0.80 14.62 1.78 1.37 0.85 26.58 2014 Southeast 25th Percentile 8.86 1.48 21.42 4.12 3.22 1.35 40.44 2014 Southeast 10th Percentile 17.12 1.92 38.05 10.60 5.24 1.89 74.81 2014 Northeast 90th Percentile 9.46 N/A 4.65 1.41 0.05 0.24 15.82 2014 Northeast 75th Percentile 9.96 N/A 6.49 1.86 0.15 0.40 18.85 2014 Northeast 50th Percentile 10.86 N/A 8.05 2.29 0.31 0.92 22.43 2014 Northeast 25th Percentile 12.35 N/A 10.38 2.95 1.14 2.16 28.99 2014 Northeast 10th Percentile 14.28 N/A 13.71 4.09 4.50 3.62 40.20 CLAconnect.com/seniorliving 29 ©2015 CliftonLarsonAllen LLP . 30th Edition: Skilled Nursing Facility Cost Comparison Food, Utilities, Repairs, Maintenance, and General Insurance Per Resident Day Repairs Maintenance, Contracts, Purchased Services/Other Property and Liability Insurance Property and Related Totals 3.71 0.16 1.23 0.71 6.17 0.60 4.57 0.39 2.36 1.37 9.29 0.92 5.73 0.95 3.73 2.01 13.34 9.08 1.46 7.19 1.58 5.90 2.79 18.91 Total 10th Percentile 12.74 2.11 9.18 3.30 12.81 4.71 32.11 2014 Midwest 90th Percentile 5.67 0.24 3.80 0.18 0.79 1.12 6.12 2014 Midwest 75th Percentile 6.69 0.47 4.55 0.39 1.58 1.61 8.60 2014 Midwest 50th Percentile 8.62 0.75 5.82 0.90 3.42 2.27 13.15 2014 Midwest 25th Percentile 10.97 1.11 7.88 1.51 7.74 3.04 21.28 2014 Midwest 10th Percentile 18.75 1.84 10.27 2.30 15.57 5.82 35.80 2014 Southeast 90th Percentile 1.71 0.99 3.16 N/A 2.37 0.69 7.22 2014 Southeast 75th Percentile 4.87 1.40 3.67 N/A 2.99 0.85 8.92 2014 Southeast 50th Percentile 5.88 2.08 4.83 N/A 4.31 0.98 12.20 2014 Southeast 25th Percentile 6.89 3.22 5.88 N/A 5.52 2.03 16.66 2014 Southeast 10th Percentile 8.51 3.90 7.85 N/A 10.83 7.08 29.65 2014 Northeast 90th Percentile 0.37 0.41 4.00 0.15 1.34 0.39 6.29 2014 Northeast 75th Percentile 6.14 0.65 4.72 0.47 2.08 1.39 9.31 Food Expense Maintenance Supplies Utilities Total 90th Percentile 2.12 0.36 Total 75th Percentile 6.14 Total 50th Percentile 7.37 Total 25th Percentile CLAconnect.com/seniorliving 30 ©2015 CliftonLarsonAllen LLP . 30th Edition: Skilled Nursing Facility Cost Comparison Housekeeping and Plant Operations Costs Per Square Foot Housekeeping Plant Operations Salaries Purch. Services Other Total Salaries Utilities Purch. Services Other Total Total 90th Percentile 1.20 0.01 0.33 1.54 0.80 2.13 0.23 0.23 3.39 Total 75th Percentile 2.06 0.02 0.71 2.80 1.24 2.83 0.39 0.81 5.27 Total 50th Percentile 3.06 0.11 1.17 4.34 2.07 3.90 0.74 2.57 9.28 Total 25th Percentile 4.94 0.97 1.90 7.81 3.49 5.56 1.47 6.14 16.66 Total 10th Percentile 8.40 3.21 3.13 14.74 6.45 9.29 3.56 11.26 30.56 2014 Midwest 90th Percentile 1.01 0.01 0.27 1.29 0.78 2.08 0.20 0.22 3.29 2014 Midwest 75th Percentile 1.81 0.02 0.61 2.45 1.34 2.62 0.35 0.60 4.90 2014 Midwest 50th Percentile 2.86 0.07 1.08 4.00 2.07 3.68 0.68 2.09 8.53 2014 Midwest 25th Percentile 4.23 0.22 1.68 6.12 3.25 5.04 1.17 5.07 14.54 2014 Midwest 10th Percentile 6.28 1.08 2.82 10.19 4.74 6.87 2.49 9.90 24.00 2014 Southeast 90th Percentile 1.91 0.02 0.24 2.17 0.76 2.14 0.32 0.96 4.18 2014 Southeast 75th Percentile 2.43 0.11 0.45 2.99 1.01 3.20 0.42 1.61 6.25 2014 Southeast 50th Percentile 3.93 0.50 0.73 5.16 1.53 4.23 0.76 3.47 9.99 2014 Southeast 25th Percentile 7.02 2.76 1.44 11.22 2.67 5.45 1.32 5.65 15.09 2014 Southeast 10th Percentile 8.77 3.69 2.00 14.46 7.81 8.92 3.27 7.29 27.28 2014 Northeast 90th Percentile N/A N/A N/A N/A N/A N/A N/A N/A N/A 2014 Northeast 75th Percentile N/A N/A N/A N/A N/A N/A N/A N/A N/A 2014 Northeast 50th Percentile N/A N/A N/A N/A N/A N/A N/A N/A N/A 2014 Northeast 25th Percentile N/A N/A N/A N/A N/A N/A N/A N/A N/A 2014 Northeast 10th Percentile N/A N/A N/A N/A N/A N/A N/A N/A N/A CLAconnect.com/seniorliving 31 ©2015 CliftonLarsonAllen LLP . 30th Edition: Section III: About CliftonLarsonAllen History and experience CliftonLarsonAllen is a professional services firm delivering integrated wealth advisory, outsourcing, and public accounting capabilities to help enhance our clients’ enterprise value and assist them in growing and managing their related personal assets — all the way from startup to succession and beyond. Our professionals are immersed in the industries they serve and have specialized knowledge of their operating and regulatory environments. With nearly 4,000 people, 90 U.S. locations, and a global affiliation, we bring a wide array of solutions to help clients in all markets, foreign and domestic.
Investment advisory services are offered through CliftonLarsonAllen Wealth Advisors, LLC, an SEC-registered investment advisor. Skilled Nursing Facility Cost Comparison we draw upon our diverse backgrounds to develop tailored solutions that will position our clients for success; not only today but in the future. Success over the long-term is what we call building enterprise value. We assist our clients in building enterprise value by tailoring solutions from these capabilities: strategy, operations, finance, and compliance. Our independent and objective professionals are guided by your strategic vision and your unique environment. CliftonLarsonAllen offers unprecedented emphasis on serving privately held businesses and their owners, as well as nonprofits and governmental entities.
CliftonLarsonAllen serves clients globally as an independent member firm of Nexia International, a top worldwide network of separate and independent professional accounting and business advisory firms. To break it down further, we serve: For more information about CliftonLarsonAllen, visit www.CLAconnect.com. • 2,000+ aging services providers including nursing facilities, CCRCs, assisted living facilities, HUD housing, etc. • 200+ home care, hospice, and other community based providers • 700+ hospitals and health systems, including approximately 100 critical access hospitals • 3,800+ physicians, dentists, and medical practices • 100+ other health care entities (therapy providers, managed care entities, health care management companies, mental health providers, etc.) Our dedication to health care CliftonLarsonAllen has developed one of the nation’s largest health care practices. Our team includes CPAs and a diverse range of experienced professionals with backgrounds and skill sets ranging from CEOs and CFOs to RNs, certified coders, and certified medical practice executives. Represented by team members possessing over 30 years of dedicated experience to the health care field, We are truly “industry-driven” firm! Physicians and Nurses Administrators Patients Management Board Members CLA Professionals Community Involvement Public Accounting How we serve the health care industry While we have all chosen different paths, we have the same dream — to impact and improve the delivery of health care services in our communities! Alternatively, while other firms may “specialize” in health care, they are usually public accountants first and health care professionals second. CLAconnect.com/seniorliving 32 ©2015 CliftonLarsonAllen LLP .
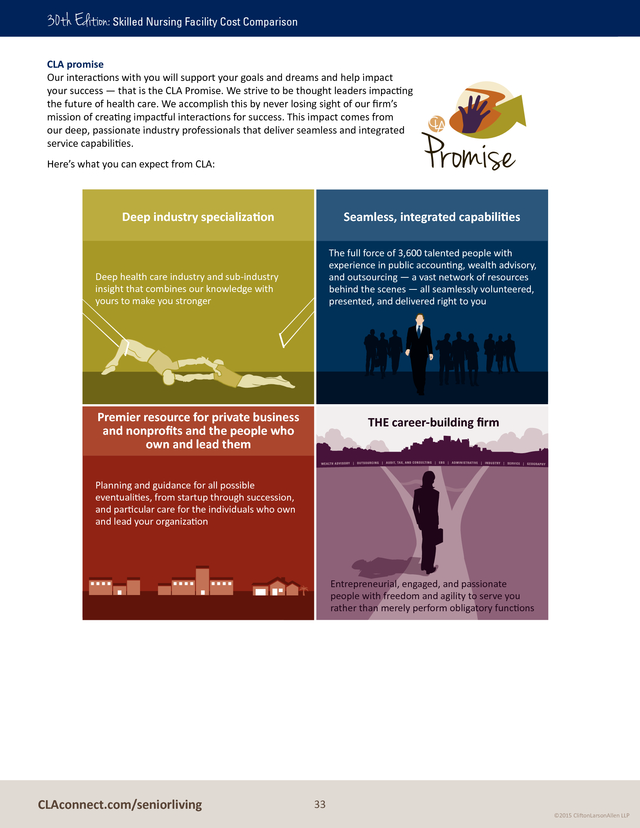
30th Edition: Skilled Nursing Facility Cost Comparison CLA promise Our interactions with you will support your goals and dreams and help impact your success — that is the CLA Promise. We strive to be thought leaders impacting the future of health care. We accomplish this by never losing sight of our firm’s mission of creating impactful interactions for success. This impact comes from our deep, passionate industry professionals that deliver seamless and integrated service capabilities. Here’s what you can expect from CLA: Promise Seamless, integrated capabilities Deep industry specialization The full force of 3,600 talented people with experience in public accounting, wealth advisory, and outsourcing — a vast network of resources behind the scenes — all seamlessly volunteered, presented, and delivered right to you Deep health care industry and sub-industry insight that combines our knowledge with yours to make you stronger Premier resource for private business and nonprofits and the people who own and lead them THE career-building firm Planning and guidance for all possible eventualities, from startup through succession, and particular care for the individuals who own and lead your organization Entrepreneurial, engaged, and passionate people with freedom and agility to serve you rather than merely perform obligatory functions CLAconnect.com/seniorliving 33 ©2015 CliftonLarsonAllen LLP .
30th Edition: Skilled Nursing Facility Cost Comparison A national and regional commitment to the senior living field We recognize the importance of supporting health care associations. On an annual basis, we participate in over 100 health care events at a variety of levels including speaking, exhibiting, and sponsorships. In addition, we regularly contribute articles to trade publications. This level of involvement allows us to thoroughly understand the issues facing the industry and proactively address them. We are especially pleased with the following affiliations. AAOE We are members of the American Association of Orthopaedic Executives (AAOE).
This association regularly invites our professionals to present educational sessions to orthopaedic practice executives and their staff. AHCA As gold level members, we support the American Health Care Association (AHCA). Members of our team routinely attend and speak at the annual conference and trade show. Our professionals are active members within their state affiliated associations and have performed demand studies for a number of them. AICPA Our CPAs are members of the American Institute of Certified Public Accountants (AICPA), and we actively attend the organization’s events.
Our lead assurance and accounting (A&A) quality principal for our national health care audit practice is a member of the AICPA Health Care Expert Panel. He also serves as a reviewer for the annual revisions to the AICPA Health Care Audit Guide and the annual AICPA publication, Health Care Industry Developments. HFMA We are active members of the Healthcare Financial Management Association (HFMA) and the state chapters in the regions we serve. We regularly attend the conferences and our principals are consistently chosen to present educational sessions.
Our professionals have published articles in Healthcare Financial Management magazine. HHFMA Home Care and Hospice Financial Managers Association (HHFMA) was created by the National Association of Home Care & Hospice (NAHC) to meet the growing needs of home care and hospice financial managers and consultants. Two of our health care principals serve on the Finance Manager’s Workgroup. LeadingAge We are a gold partner with LeadingAge . This arrangement offers outstanding benefits, including opportunities to pursue knowledge and information that will be passed along directly to our clients.
We also support LeadingAge by presenting educational sessions at their conferences and jointly sponsoring performance indicator projects. In addition, we are active members of the state affiliated associations and conduct benchmarking surveys for many of them. Lincoln Healthcare We are sponsor partners of several events facilitiated by Lincoln Healthcare, which is an independent organizer of executive leadership communities in health care. Events include: • Hospital 100 for hospital executives • LTC 100 for senior management in long-term care and assisted living • Home Care 100 for home care management MGMA We are active members of the Medical Group Management Association (MGMA) and its state organizations in the regions we serve. Several of our professionals are recognized Certified Medical Practice Executives (CMPE).
On a regular basis, we speak at their conferences. NAHC We are involved members of the National Association of Home Care & Hospice (NAHC). Annually, we speak at several events, and we are proud to be significant sponsors of the financial management conference. In addition, we have contributed articles to the association’s magazine, Caring, and a member of our team has served as the guest editor. RBMA As active members of the Radiology Business Management Association (RBMA), we consistently speak at their conferences and facilitate webinars.
In addition, we write articles for the RBMA Bulletin and annually assist the association conduct its member surveys. CLAconnect.com/seniorliving 34 ©2015 CliftonLarsonAllen LLP . 30th Edition: Skilled Nursing Facility Cost Comparison Solutions for senior living providers Our tailored solutions support the evolving needs of providers who serve individuals in the third age of their lives. • Strategic capital planning • Operations and performance improvement • Health reform advisory • Financial feasibility studies • Market research and analysis • Marketing and sales consulting • Mergers, acquisitions, and affiliation facilitation • Due diligence • Valuation • Executive search • Debt advisory • Facility master planning services • Clinical consulting Due to escalating operating costs, personnel shortages, and changing reimbursement models, senior living providers are being forced to reexamine the way they do business. They need new, more efficient ways to deliver care. New technologies and alternate care models impact the venues in which care is delivered. CliftonLarsonAllen stays informed of industry trends and the legal, regulatory, and operational environment.
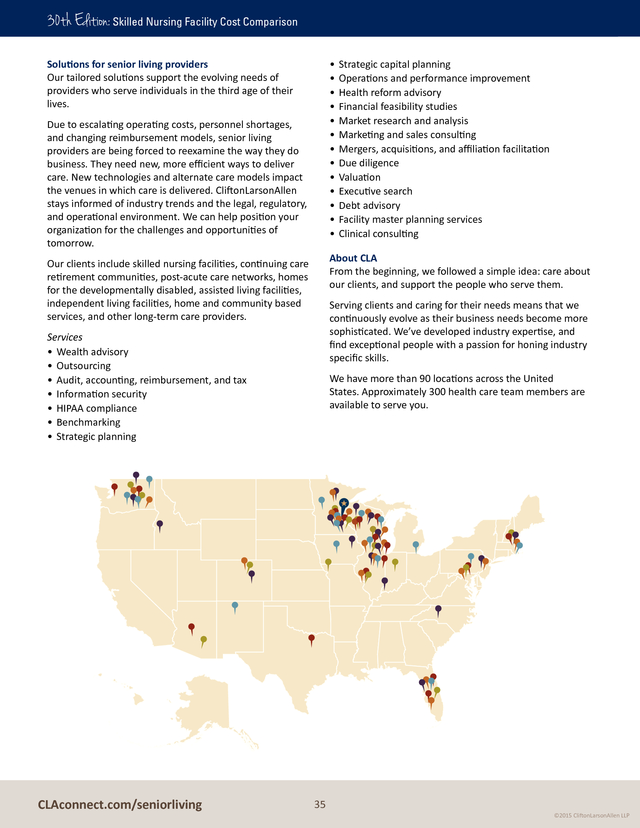
We can help position your organization for the challenges and opportunities of tomorrow. About CLA From the beginning, we followed a simple idea: care about our clients, and support the people who serve them. Our clients include skilled nursing facilities, continuing care retirement communities, post-acute care networks, homes for the developmentally disabled, assisted living facilities, independent living facilities, home and community based services, and other long-term care providers. Serving clients and caring for their needs means that we continuously evolve as their business needs become more sophisticated. We’ve developed industry expertise, and find exceptional people with a passion for honing industry specific skills. Services • Wealth advisory • Outsourcing • Audit, accounting, reimbursement, and tax • Information security • HIPAA compliance • Benchmarking • Strategic planning CLAconnect.com/seniorliving We have more than 90 locations across the United States. Approximately 300 health care team members are available to serve you. 35 ©2015 CliftonLarsonAllen LLP .
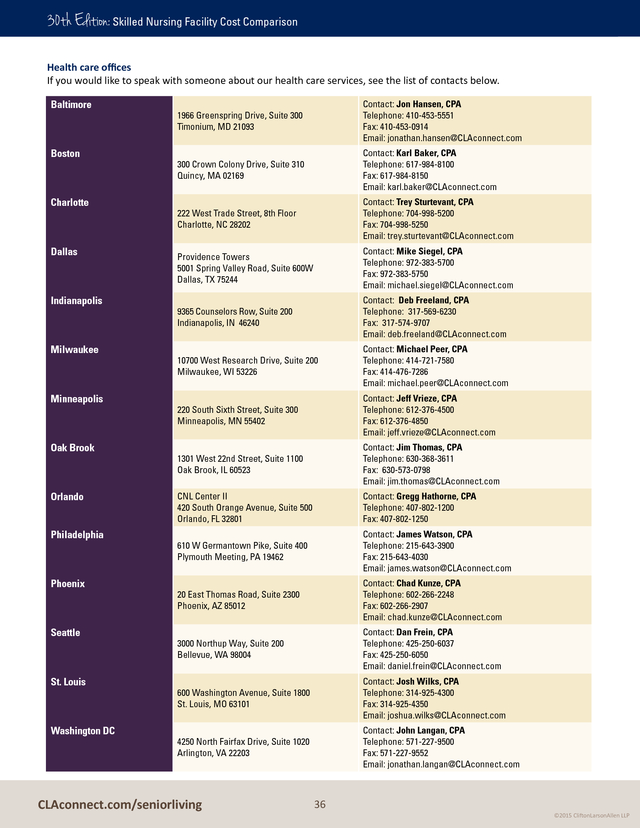
30th Edition: Skilled Nursing Facility Cost Comparison Health care offices If you would like to speak with someone about our health care services, see the list of contacts below. Baltimore Boston Charlotte Dallas Indianapolis Milwaukee Minneapolis Oak Brook Orlando Philadelphia Phoenix Seattle St. Louis Washington DC 1966 Greenspring Drive, Suite 300 Timonium, MD 21093 Contact: Jon Hansen, CPA Telephone: 410-453-5551 Fax: 410-453-0914 Email: jonathan.hansen@CLAconnect.com 300 Crown Colony Drive, Suite 310 Quincy, MA 02169 Contact: Karl Baker, CPA Telephone: 617-984-8100 Fax: 617-984-8150 Email: karl.baker@CLAconnect.com 222 West Trade Street, 8th Floor Charlotte, NC 28202 Contact: Trey Sturtevant, CPA Telephone: 704-998-5200 Fax: 704-998-5250 Email: trey.sturtevant@CLAconnect.com Providence Towers 5001 Spring Valley Road, Suite 600W Dallas, TX 75244 Contact: Mike Siegel, CPA Telephone: 972-383-5700 Fax: 972-383-5750 Email: michael.siegel@CLAconnect.com 9365 Counselors Row, Suite 200 Indianapolis, IN 46240 Contact: Deb Freeland, CPA Telephone: 317-569-6230 Fax: 317-574-9707 Email: deb.freeland@CLAconnect.com 10700 West Research Drive, Suite 200 Milwaukee, WI 53226 Contact: Michael Peer, CPA Telephone: 414-721-7580 Fax: 414-476-7286 Email: michael.peer@CLAconnect.com 220 South Sixth Street, Suite 300 Minneapolis, MN 55402 Contact: Jeff Vrieze, CPA Telephone: 612-376-4500 Fax: 612-376-4850 Email: jeff.vrieze@CLAconnect.com 1301 West 22nd Street, Suite 1100 Oak Brook, IL 60523 Contact: Jim Thomas, CPA Telephone: 630-368-3611 Fax: 630-573-0798 Email: jim.thomas@CLAconnect.com CNL Center II 420 South Orange Avenue, Suite 500 Orlando, FL 32801 Contact: Gregg Hathorne, CPA Telephone: 407-802-1200 Fax: 407-802-1250 610 W Germantown Pike, Suite 400 Plymouth Meeting, PA 19462 Contact: James Watson, CPA Telephone: 215-643-3900 Fax: 215-643-4030 Email: james.watson@CLAconnect.com 20 East Thomas Road, Suite 2300 Phoenix, AZ 85012 Contact: Chad Kunze, CPA Telephone: 602-266-2248 Fax: 602-266-2907 Email: chad.kunze@CLAconnect.com 3000 Northup Way, Suite 200 Bellevue, WA 98004 Contact: Dan Frein, CPA Telephone: 425-250-6037 Fax: 425-250-6050 Email: daniel.frein@CLAconnect.com 600 Washington Avenue, Suite 1800 St. Louis, MO 63101 Contact: Josh Wilks, CPA Telephone: 314-925-4300 Fax: 314-925-4350 Email: joshua.wilks@CLAconnect.com 4250 North Fairfax Drive, Suite 1020 Arlington, VA 22203 Contact: John Langan, CPA Telephone: 571-227-9500 Fax: 571-227-9552 Email: jonathan.langan@CLAconnect.com CLAconnect.com/seniorliving 36 ©2015 CliftonLarsonAllen LLP .
3 The future of skilled nursing facilities................................................................................................................................. 4 Executive Summary....................................................................................................................................................... 5 Industry challenges and opportunities................................................................................................................................
5 Key ratios............................................................................................................................................................................. 5 Key trends........................................................................................................................................................................... 5 Perspective on Ratios and Costs....................................................................................................................................
7 Ratio and cost analyses....................................................................................................................................................... 7 Presentation of data............................................................................................................................................................ 7 Percentile rankings..............................................................................................................................................................
7 Uses of this publication....................................................................................................................................................... 8 Section I: Ratio Analysis................................................................................................................................................. 9 Financial statement indicators............................................................................................................................................
9 Operating indicators.......................................................................................................................................................... 19 Staffing indicators.............................................................................................................................................................. 21 Section II: Cost Analyses Tables....................................................................................................................................
25 Department Totals Per Resident Day................................................................................................................................. 25 Salary Comparison Per Resident Day................................................................................................................................ 26 Salaries Per Compensated Hour........................................................................................................................................
27 Compensated Hours Per Resident Day.............................................................................................................................. 28 Payroll Taxes and Fringe Benefits Per Resident Day.......................................................................................................... 29 Food, Utilities, Repairs, Maintenance, and General Insurance Per Resident Day.............................................................30 Housekeeping and Plant Operations Costs Per Square Foot.............................................................................................
31 Section III: About CliftonLarsonAllen........................................................................................................................... 32 History and experience..................................................................................................................................................... 32 Our dedication to health care...........................................................................................................................................
32 CLA Promise...................................................................................................................................................................... 33 A national and regional commitment to the senior living field......................................................................................... 34 Solutions for senior living providers..................................................................................................................................
35 About CLA.......................................................................................................................................................................... 35 Health care offices............................................................................................................................................................. 36 CLAconnect.com/seniorliving 2 ©2015 CliftonLarsonAllen LLP .
30th Edition: 30th Edition: Skilled Nursing Facility Cost Comparison Mike McConnell, John Racek, Deb Elsey, Gordy Vetsch, John Richter 30th Edition Retrospective Valuable information the industry couldn’t get elsewhere As we assembled our 30th edition of this report, we reflected on how the report got started and the changes we have seen over the years. In 1983, Mike McConnell was serving clients in health care when he and several colleagues realized that the information they routinely collected to file clients’ Rule 50 cost report could be valuable. In fact, long-term care clients often asked how their facilities compared to others in the industry. McConnell asked his supervisor what he thought of collecting this information in a useful format for distribution to clients, and the response was more or less, “Ok, but let’s do this after hours.” Impact on clients and the industry CLA nurtures very close relationships with clients, and the report provided a framework to discuss best practices and efficiencies — everything from food costs to staffing costs. McConnell says, “It was a tough time for our skilled nursing facility clients, and they were trying to figure out how to deal with it. The report helped position us as part of the solution.” The report’s popularity and use spread across the industry and beyond.
Investment bankers used it. Small sites used it to understand how they could compete with larger facilities. It was used as a resource politically and legislatively.
Clients used it to benchmark acquisition targets, since it offered accurate information that could provide the foundation to improve their outcomes. As CLA’s health care client base grew each year, the report included more facilities and the breadth of the information expanded from state to regional to national. McConnell and a team of several colleagues put in many late night hours compiling the information, and the response to the first Skilled Nursing Facility Cost Comparison Report in 1983 took everyone by surprise. Clients were using it right away. In meetings with the auditors, the report helped focus discussions on the data and improving performance. Suddenly, CliftonLarsonAllen stood out as a significant resource for this information. Clients valued the data because it could make them more competitive, and competitors couldn’t duplicate it. Vetsch says, “As professionals, it took our practice in a different direction, because it allowed us to be more proactive.” Principal John Racek met with one client each month because she actively used the information and rate computations in the report.
“She was a disciplined operator, and she was methodical in her attention to this information. It helped her succeed.” “We were simply aligning ourselves with where we thought the industry was going,” says McConnell. “We had information at our disposal, and we thought it could be helpful to our clients.” The report provided vital current business information that the industry couldn’t get anywhere else.
Gordy Vetsch, who worked with McConnell at the time, says, “The only other similar reports came from the Department of Human Services, and there was a two-year lag to get that data — we were the only one doing this.” CLAconnect.com/seniorliving The tool was also used by leadership, management, and boards. “If there were disagreements about staffing needs, they’d pull out the report,” says Vetsch. “It gave them credible information to base their decisions on.” 3 ©2015 CliftonLarsonAllen LLP .
The future of skilled nursing facilities As the health care industry embraces health reform, the cost comparison report will continue to provide essential information for organizations. Skilled nursing facilities will be adjusting to shorter stays, higher acuity, and higher costs of care. The issues of the future will also include new technologies, home care, and monitoring systems, and as a result, there will be even more attention on the management of costs. providers cannot manage costs and demonstrate quality results, your organization may be left out.” John Richter, who has focused on health care for much of his career, marvels at how the industry has transformed over the years. “We’ve gone from large wards with minimal privacy to reinventing buildings to try to really understand and respond to needs.
We are developing ways for seniors to age in place at home because that is what they want. Health reform has actually been great for skilled nursing facilities,” he says. “And this tool we developed back in 1983 has been key to helping organizations succeed, improve, and innovate.” Principal Deb Elsey says, “The future will demand that organizations are not only paying attention to their costs, but the broader picture — the total cost of care. Payers are already selecting the highest quality providers and establishing relationships with quality providers.
If 30 Year Historical Skilled Nursing Facility Costs per Resident Day $275 SNF Cost per Resident Day, $245.80 $250 $225 Cost per Resident Day $200 $175 SNF Wages per Resident Day, $139.47 $150 $125 $100 $75 $50 $25 $- Year SNF Cost per Resident Day SNF Wages per Resident Day Consumer Price Index The 30 year increase in skilled nursing facility cost per resident day equates to 426% The 30 year increase in skilled nursing facility wages per resident day equates to 364% The 30 year increase in the consumer price index equates to 120% The 30 year increase in the cost of a home equates to 247% The 30 year increase in median household income equates to 150% The 30 year increase in the cost of gas equates to 169% The 30 year increase in the cost of a stamp equates to 130% The 30 year increase in the cost of milk equates to 71% Sources: CliftonLarsonAllen LLP Clients, Bureau of Labor Statistics CLAconnect.com/seniorliving 4 ©2015 CliftonLarsonAllen LLP . 30th Edition: Executive Summary Skilled Nursing Facility Cost Comparison Industry challenges and opportunities Because there are at least five key drivers of change — both the complexity and the pace of change have increased dramatically. Briefly, the drivers include: 1. Consumers are increasingly aware of their own aging and, at least in part, the implications. While it might be argued that not enough is known about tomorrow’s consumers, we do know that their choices are becoming clearer, the quality they expect has not been reduced as a result of the recession, and the housing market and pricing and fee approaches demand options and creativity. 2. The federal deficit is intensifying the focus on value, competition, access to capital, payment reform, and stewardship. More to the point, we are in an era when third party payments (from the federal or state governments) are challenged.
For providers, finding a strategic solution is essential for future success. The good news is that there are opportunities to do exactly that. 3. Health care reform is demanding that providers prove the quality that, to this point, was known to be present and is reflected in our positive reputation in the community as well as highly satisfied residents and families. The ‘value’ that is provided (the combination of quality and price) has become a critical driver.
At the same time, health care reform is facilitating the creation of innovative communities that support vulnerable people at home through entrepreneurial products and services. 4. The cultivation of human resources is becoming the most important factor in the success of a new generation of service delivery. 5. Technology is potentially the single most important phenomenon that can synergize the other driving forces to assure value for all concerned. increased from 6.2 percent in 2010 to 6.4 percent in 2014. This ratio indicates that providers continue to find ways to manage profitability despite challenges in reimbursement and declining occupancy. Days Cash-on-Hand Including Investments — As facilities continue to conserve cash, days cash-on-hand has increased from 36.2 days in 2010 to 45.7 days in 2014. The increase is modest but also appears to be from the increases in operating margins. The relatively low days cash-on-hand ratio for these facilities emphasizes the fragility of skilled nursing facilities and their dependence on continued operational performance and lack of reinvestment into the physical plant. Debt Service Coverage Ratio — This ratio has maintained a fairly consistent level over the last five years. This highlights the ability of the industry to manage operating costs given continued economic and legislative pressures. Key trends Health care reform has spurred significant market changes across the country.
While it is important to note that health care is innately local, and as a result, providers must understand the unique characteristics of the market in which they operate, there are a number of national trends to note. As of January 2015 there were 405 participants in Centers for Medicare and Medicaid Services (CMS) Medicare Accountable Care Organizations (ACOs) programs, and applications were taken in June 2015 for a new Next Generation ACO. ACOs are responsible for managing the total cost of care for a designated population.
Numerous commercial and Medicaid ACOs have evolved across the country as well. Massachusetts, Minnesota, and California are all states with a notable presence of ACOs. Other examples of payment and care This document provides a historical look at numerous ratios and trends in the industry over the last 5 to 10 years. Key ratios Occupancy — We continue to see a decline in overall occupancy.
It has decreased from 91.9 percent in 2010 to 90.4 percent in 2014. This is likely a result of shorter stays, use of alternatives such as home and community services, and changes in hospital referral patterns. Earnings Before Interest, Taxes, Depreciation, and Amortization (EBITDA) — The median EBITDA ratio has CLAconnect.com/seniorliving 5 ©2015 CliftonLarsonAllen LLP . 30th Edition: Skilled Nursing Facility Cost Comparison delivery reform include bundled or episodic payments, value-based purchasing, and medical homes. There are currently more than 6,000 providers/organizations who are either participating in Phase I — information gathering — or Phase II — risk bearing/receive bundled payment — in one or more of the four types of CMS bundled payment models. Health Care Organizations’ To-Do List • Identify efficiencies and remove waste • Embrace evidence-based medicine Preventable readmissions and chronic disease management remain important issues for post acute providers. For 2015, CMS has scheduled readmission penalties to hospitals to increase by 3 percent. CMS will begin monitoring the 30-day all-cause readmission rate for skilled nursing facilities on October 1, 2015, and 2 percent of Medicare SNF payments will be at risk for this measure beginning October 1, 2018.
All post-acute providers will also begin reporting new measures to CMS as a result of the Improving Medicare Post-Acute Care Transformation (IMPACT) Act passed in September 2014. It is expected that in future years, value-based payment will be tied to these measures as well. • Enhance clinical competencies • Measure outcomes • Manage different payment methodologies in the near- and mid-term • Select strategic partners • Determine IT needs Commercial payers are rolling out total cost of care contracts and plans for the dually eligible population in states across the country. As a result of ACOs and this commercial payer activity, it will be crucial for post acute providers to develop competencies in contracting that were not essential in prior fiscal years. • Create a culture of change that honors patient choice Nationwide, a clear shift away from volume-based reimbursement to valuebased reimbursement is underway. Nationwide, a clear shift away from volume-based reimbursement to value-based reimbursement is underway.
Both public (CMS) and private payers announced goals to move 75% or more of their payments to providers to a value-based payment model ranging from pay-for-performance to bundled payment, medical homes and shared savings, or total cost of care arrangements. Health care providers, employers, and insurers are faced with a cultural shift that will require them to address upfront investments and reduced near-term reimbursements. Patient-centered care and coordination among providers will be essential for success in this shift from volume to value. CLAconnect.com/seniorliving 6 ©2015 CliftonLarsonAllen LLP . 30th Edition: Perspective on Ratios and Costs Skilled Nursing Facility Cost Comparison Ratio and cost analyses have been computed using information primarily from audited financial statements of our senior living clients. The data has been gathered and analyzed by representatives from our health care practice. The participation in this study is voluntary. This report represents data from approximately 450 nursing facilities, including for-profit and nonprofit in stand-alone and affiliated type organizations. Ratio and cost analyses Analysis of appropriate ratio and cost data can assist in the assessment of an organization’s solvency, cost efficiency, and profitability. A critical element in the review of an organization’s financial condition is understanding the magnitude of any variance in cost structure or operations compared to similar organizations, and then taking the initiative to investigate and understand the reason for any variance.
Ultimately, understanding the cause of variances may lead to a series of operational changes that may both improve quality and create operational efficiencies. Presentation of data Section I presents various ratio analyses depicting the financial and operating condition of the nursing facilities included in their respective geographic region, including the Midwest, Northeast, and Southeast. This section is segregated into three categories: financial statement indicators, operating indicators, and staffing indicators. Included with each of these ratio analyses is a brief definition of the ratio and a brief commentary on what the results appear to indicate. Consistently and routinely monitoring key financial and operational indicators can assist management in identifying opportunities to improve operations. Some of the pros and cons of using comparative indicators are outlined below. Section II consists of cost analyses.
The cost analyses are sorted solely by geographic region. The presentation of the per diem cost comparisons, compensated hours analyses, and property cost information is based on each geographic region, and the overall database’s 10th percentile, 25th percentile, 50th percentile, 75th percentile and 90th percentile. Pros • Highlight areas of potential opportunity or challenges for an organization • Provide comparisons to similar organizations • Identify unusual operating results and trends Percentile rankings Sections I and II of the publication provide a variety of benchmarks for the financial ratios and cost analyses. Each facility’s data was ranked in ascending or descending order and then assembled into the percentile rankings. The 90th percentile represents the mean of the top 10 percent of the population, the 75th percentile represents the mean of the top 25 percent of the population, the 50th percentile represents the median of the population, the 25th percentile represents the mean of the bottom 25 percent of the population, and the 10th percentile represents the mean of the bottom 10 percent of the population. For example, in the cost analysis section, those facilities with the lowest cost base would be included in the 90th percentile as they represent the mean of the top 10 percent. Cons • Variances alone do not necessarily reflect an opportunity or a challenge • Potential for inconsistency in data collection can reduce the usefulness of comparisons • Benchmarks should be used in conjunction with other analysis of operations Ultimately, no ratio or cost comparison should be used alone to assess the financial condition of an organization. Variances from benchmarks should be investigated and reviewed in conjunction with the decision maker’s understanding of the specific organization.
Finally, users should consider that it is the process of benchmarking that creates organizational value. CLAconnect.com/seniorliving 7 ©2015 CliftonLarsonAllen LLP . 30th Edition: Skilled Nursing Facility Cost Comparison Uses of this publication The purpose of this publication is to provide financial ratio and cost comparison data for CliftonLarsonAllen’s senior living clients. In addition, it can assist decision makers in understanding and meeting their responsibilities to residents, assessing their facility operations in comparison to specific benchmarks, and promoting a better understanding of the nursing facility field to external viewers, including investors, legislators, and the general public. Overall, the ratio analyses and cost analyses published in this report should be used on an ongoing basis by decision makers within an organization to assist in strategic planning and internal budgeting and to define and track financial and operating goals. CLAconnect.com/seniorliving 8 ©2015 CliftonLarsonAllen LLP . 30th Edition: Section I: Ratio Analysis Skilled Nursing Facility Cost Comparison Financial statement indicators The financial statement ratios included in this section illustrate the financial condition of nursing facilities. Valuable insights into a facility’s financial condition and operational performance can be gained through analysis of key financial statement indicators. Current Assets Current Liabilities Current Ratio Defined: Measures the liquidity of a facility and is used to determine the degree to which current liabilities are covered by current assets or the ability of a facility to pay short-term obligations as they come due. “Current Assets” consist of a facility’s cash and other assets such as accounts receivable, prepaid expenses, and investments that can be easily converted into cash. “Current Liabilities” include accounts payable, accrued expenses, current portion of long-term debt, and other obligations payable within one year. 1.0 may represent a liquidity problem for a facility. A trend of a decreasing current ratio may provide an early signal that the facility is experiencing financial difficulties. Quartiles Totals 50% 75% 2010 1.1 2.0 3.6 2011 1.1 1.9 3.4 2012 1.0 1.8 3.4 2013 0.9 1.6 2.9 2014 The higher the current ratio, the greater the ability a facility has in meeting its short-term obligations as they come due.
A high liquidity must be weighed against the ability of a facility to obtain higher investment earnings by investing in longer-term investments. A ratio of less than 25% 0.8 1.5 2.8 Median Current Ratio 3.0 2.5 2.0 1.5 1.0 0.5 0.0 2010 2011 2012 2013 2014 Midwest 2.0 2.0 2.0 1.5 1.8 Southeast 0.9 0.5 0.6 0.8 1.0 Northeast 2.1 2.0 1.9 1.7 1.5 Total 2.0 1.9 1.8 1.6 1.5 Source: CliftonLarsonAllen LLP Clients CLAconnect.com/seniorliving 9 ©2015 CliftonLarsonAllen LLP . 30th Edition: Skilled Nursing Facility Cost Comparison Accounts Receivable (Resident Revenue/365) Days Revenue in Accounts Receivable Defined: Calculates the average number of days that receivables are outstanding or how quickly a facility converts its receivables to cash. A lower value of days revenue in accounts receivable is desirable, as this suggests a facility takes less time to convert its receivables to cash. A typical skilled nursing facility receives approximately 70 percent of its resident services revenue from third party payers who traditionally pay for services following the month of service. Therefore, a value of less than 30 days represents strong collection of receivables. As can be seen from the graph below, this ideal benchmark has been difficult to achieve in recent years.
Changing reimbursement systems, budget challenges at State and Federal levels, and the move to more desirable contracts may provide upward pressure on this ratio in future years. Quartiles Totals 25% 50% 75% 2010 56.6 43.0 34.8 2011 53.5 41.6 32.9 2012 55.9 41.6 33.8 2013 54.4 43.4 34.2 2014 57.7 42.9 33.0 Median Days Revenue in Accounts Receivable 70.0 60.0 50.0 40.0 30.0 20.0 10.0 0.0 2010 2011 2012 2013 2014 Midwest 39.4 38.8 38.8 43.4 40.0 Southeast 53.4 46.8 46.8 40.4 42.0 Northeast 46.0 43.8 43.8 45.0 46.7 Total 43.0 41.6 41.6 43.4 42.9 Source: CliftonLarsonAllen LLP Clients CLAconnect.com/seniorliving 10 ©2015 CliftonLarsonAllen LLP . 30th Edition: Skilled Nursing Facility Cost Comparison Bad Debts as a Percentage of Operating Revenues Bad Debt Expense Operating Revenues Defined: Represents the ratio of bad debt expense to revenues from operations. A lower ratio of bad debt expense to operating revenues is desirable, as this suggests a facility is incurring fewer uncollectible accounts from resident services. As this ratio increases it is an indicator of collection challenges. A higher ratio of bad debt expense to operating revenues could indicate there are areas in the billing cycle that could be improved upon. This ratio should be evaluated concurrent with the level of days in accounts receivable as a longer cash collection cycle oftentimes results in greater bad debts for a facility. Quartiles Totals 25% 50% 75% 2010 0.86% 0.37% 0.05% 2011 0.99% 0.43% 0.03% 2012 0.98% 0.45% 0.08% 2013 1.02% 0.49% 0.01% 2014 1.07% 0.47% 0.07% Bad Debts as a Percentage of Total Revenues 2.00% 1.50% 1.00% 0.50% 0.00% 2010 2011 2012 2013 2014 Midwest 0.23% 0.25% 0.27% 0.27% 0.19% Southeast 0.76% 0.96% 0.30% 0.36% 0.59% Northeast 0.54% 0.66% 0.66% 0.68% 0.62% Total 0.37% 0.43% 0.45% 0.49% 0.47% Source: CliftonLarsonAllen LLP Clients CLAconnect.com/seniorliving 11 ©2015 CliftonLarsonAllen LLP . 30th Edition: Skilled Nursing Facility Cost Comparison Days Cash-on-Hand Cash and Cash Equivalents (Operating Expenses – Depreciation)/365 Defined: Measures how long cash on hand will cover average expenses. Similar to the current ratio, a high number of days cash-onhand is considered favorable; however, an extremely high ratio may indicate that the facility could earn a higher rate of return by investing in longer-term investments. A cash position of 60+ days is a target, allowing facilities to pay employees and vendors without the worry of when checks from third party payers arrive. The value of days cash-on-hand has remained relatively level over the last five years, however, it is still below the desired range of 60+ days cash on hand. In our current economic state, facilities are experiencing cash shortages and must closely monitor the timing of payrolls and payment of accounts payable with the receipts from third party payers. To monitor this, we have added an additional graph which calculates the days cash-on-hand using both cash and unrestricted investments. The inclusion of investments, specifically in nonprofit organizations, provides a clearer picture as to the actual liquid resources available to cover average daily expenses.
Due to this the quartiles presented to the right include the impact of investments. Quartiles Totals 25% 50% 75% 2010 7.9 36.2 78.3 2011 4.3 21.4 65.0 2012 13.6 40.8 102.4 2013 16.0 50.5 130.2 2014 14.8 45.7 108.5 Median Days Cash-on-Hand Including Investments Median Days Cash-on-Hand 50 45 60 40 35 50 30 40 25 30 20 15 20 10 10 5 - - 2010 2011 2012 2013 2014 2010 2011 2012 2013 2014 Midwest 31.1 28.9 23.9 24.6 25.2 Midwest 43.2 38.4 42.2 55.9 51.8 Southeast 10.5 20.3 22.7 31.9 48.2 Southeast 16.8 21.3 22.7 42.7 55.3 Northeast 13.3 14.7 12.7 15.3 14.0 Northeast 13.3 14.7 39.6 47.0 43.6 Total 20.9 19.4 17.4 21.4 18.5 Total 36.2 21.4 40.8 50.5 45.7 Source: CliftonLarsonAllen LLP Clients CLAconnect.com/seniorliving 12 ©2015 CliftonLarsonAllen LLP . 30th Edition: Skilled Nursing Facility Cost Comparison Long-Term Debt to Equity (Leverage Ratio) Long-Term Debt Equity or Net Assets Defined: Determines how leveraged a facility is or its ability to incur additional debt. A low long-term debt to equity ratio is generally considered favorable. A facility is considered to be leveraged if its long-term debt is greater than its net assets or equity. The higher a facility is leveraged, the more difficulty it may have in obtaining additional financing. Facilities with negative equity or net assets and no debt were excluded from the calculation. Another factor that can affect the analysis of the long-term debt to equity ratio is the age of the facility. If a facility is relatively new or has incurred additional debt for major renovations, it will likely have a higher ratio since it will have a sizable amount of debt and has not converted the investment in assets into equity.
It is important for facilities to evaluate their leverage ratio as they strategically plan their future capital needs. One factor that may impact the ideal debt-to-equity target for an organization is its own cost of capital. In certain instances, for-profit providers may benefit from a higher leveraged structure since the interest expense may be tax deductible, and the cost of capital vs. the cost of equity to the owners may yield a preference toward a higher debt load. Quartiles Totals 25% 50% 75% 2010 3.4 1.3 0.6 2011 3.2 1.1 0.5 2012 2.8 1.0 0.3 2013 2.9 1.0 0.3 2014 3.8 1.2 0.4 Median Leverage Ratio 2.5 2.0 1.5 1.0 0.5 0.0 2010 2011 2012 2013 2014 Midwest 1.3 1.2 1.1 1.1 1.1 Southeast 2.1 0.5 1.5 1.3 1.5 Northeast 1.9 0.9 0.6 0.8 1.2 Total 1.3 1.1 1.0 1.0 1.2 Source: CliftonLarsonAllen LLP Clients CLAconnect.com/seniorliving 13 ©2015 CliftonLarsonAllen LLP .
30th Edition: Skilled Nursing Facility Cost Comparison Accumulated Depreciation Depreciation Expense Age of Plant Defined: Measures the average age of a facility by estimating the number of years depreciation has already been realized for a facility by dividing accumulated depreciation by depreciation expense. A lower value indicates a newer facility or that a major remodeling project was recently completed. A higher value may indicate that a facility may be in need of remodeling or renovation and that the facility should be evaluating its current level of reinvestment and financing options for fixed asset replacements. This ratio should be analyzed in relation to the liquidity and operating margins. This is important as organizations can, at times, improve their days cash-on-hand by deferring capital improvements. Quartiles Totals 25% 50% 75% 2010 21.1 13.8 6.5 2011 21.5 13.9 6.2 2012 21.5 13.9 6.2 2013 21.9 13.7 5.7 2014 22.2 14.3 5.5 Median Age of Plant 18.0 15.0 12.0 9.0 6.0 3.0 - Midwest 2010 2011 2012 2013 2014 16.3 15.5 15.5 15.6 17.2 Southeast 7.3 8.5 8.5 8.4 12.5 Northeast 11.5 12.1 12.1 11.5 12.1 Total 13.8 13.9 13.9 13.7 14.3 Source: CliftonLarsonAllen LLP Clients CLAconnect.com/seniorliving 14 ©2015 CliftonLarsonAllen LLP .
30th Edition: Skilled Nursing Facility Cost Comparison Net Income (Loss) or Change in Unrestricted Net Assets Total Revenue Net Margin Ratio Defined: Measures a facility’s efficiency in controlling costs in relation to total revenue or the profitability of a facility by comparing a facility’s net income (loss) or change in unrestricted net assets to its total revenue. The ability of an organization to maintain the net margin ratio is vital to its long-term sustainability. With challenges in reimbursement levels this has often been accomplished through controlling expenses. Alternatively, an organization can focus on diversifying their revenue streams with higher margin programs to maximize their Net Margin Ratio. These higher margin segments can help to offset lower margin segments. Quartiles Totals 25% 50% 75% 2010 -2.0% 1.6% 5.7% 2011 -1.8% 1.9% 5.9% 2012 -3.6% 0.5% 4.9% 2013 -3.1% 0.9% 5.2% 2014 -2.2% 1.9% 8.4% Median Net Margin 5.0% 3.0% 1.0% -1.0% -3.0% -5.0% 2010 2011 2012 2013 2014 Midwest 2.2% Southeast -3.3% 2.1% 0.3% 0.1% 3.6% 1.9% -0.8% 2.6% 2.9% Northeast Total 1.2% 1.5% 0.7% 1.3% 1.2% 1.6% 1.9% 0.5% 0.9% 1.9% Source: CliftonLarsonAllen LLP Clients CLAconnect.com/seniorliving 15 ©2015 CliftonLarsonAllen LLP .
30th Edition: Skilled Nursing Facility Cost Comparison Operating Margin Net Operating Income (Loss) Operating Revenue Defined: Measures the profitability of a facility by comparing a facility’s net operating income (loss) to its operating revenue. This ratio represents the profitability of a facility’s operations from its primary revenue sources as it excludes contribution and investment income. In general, the higher the operating margin, the more profitable a facility is exclusive of non-operating sources of revenue. Similar to the net margin ratio the ability to maintain operating margins is vital for long-term sustainability. The ratio however excludes the impacts of non-operating revenues and expenses and focuses on those that are directly related to operations of the organization. Quartiles Totals 25% 50% 75% 2010 -5.8% 0.1% 3.9% 2011 -4.9% 0.5% 4.3% 2012 -6.6% -1.2% 3.2% 2013 -6.9% -1.2% 3.1% 2014 -5.7% -0.3% 5.2% Median Operating Margin 3.0% 0.0% -3.0% -6.0% -9.0% 2010 2011 2012 2013 2014 Midwest -0.2% 0.3% -1.5% -2.4% 1.1% Southeast -4.5% -8.1% -3.8% -2.7% -0.5% Northeast 0.6% 0.9% -0.6% -0.3% -0.5% Total 0.1% 0.5% -1.2% -1.2% -0.3% Source: CliftonLarsonAllen LLP Clients CLAconnect.com/seniorliving 16 ©2015 CliftonLarsonAllen LLP .
30th Edition: Skilled Nursing Facility Cost Comparison Net Income (Loss) or Change in Unrestricted Net Assets + Interest Expense + Taxes + Depreciation Expense + Amortization Expense Total Revenue EBITDA Defined: Earnings Before Interest, Taxes, Depreciation, and Amortization (EBITDA) measures an organization’s total profitability from pure operations and excludes costs incurred related to financing and capital. This is typically defined as a rough measure of the operating cash flow for an organization. This ratio is often used when evaluating an organization’s debt capacity. Quartiles Totals 25% 50% 75% 2010 1.7% 6.2% 11.9% 2011 1.4% 6.5% 11.8% 2012 1.5% 6.5% 11.8% 2013 0.7% 5.3% 10.9% 2014 1.3% 6.4% 15.9% Median Earnings Before Interest Taxes Depreciation and Amortization (EBITDA) 14.0% 12.0% 10.0% 8.0% 6.0% 4.0% 2.0% 0.0% 2010 2011 2012 2013 2014 Midwest 9.0% 8.5% 8.5% 5.9% 12.5% Southeast 5.6% 4.0% 4.0% 5.5% 6.0% Northeast 3.5% 3.8% 3.8% 4.4% 3.5% Total 6.2% 6.5% 6.5% 5.3% 6.4% Source: CliftonLarsonAllen LLP Clients CLAconnect.com/seniorliving 17 ©2015 CliftonLarsonAllen LLP . 30th Edition: Skilled Nursing Facility Cost Comparison Net Income (Loss) or Change in Unrestricted Net Assets + Depreciation Expense + Amortization Expense + Interest Expense Principal Payments + Interest Expense Debt Service Coverage Ratio Defined: Measures a facility’s ability to meet its annual debt payments by dividing its net income available for debt service by its annual debt service requirements. Similar to the long-term debt to equity ratio, the debt service coverage ratio is an indicator used by lenders to determine an organization’s ability to incur additional financing or service its existing debt. Quartiles Totals 25% 50% 75% 2010 1.2 2.1 3.2 2011 1.2 2.0 3.6 2012 0.9 1.8 3.5 2013 0.9 1.8 3.9 2014 0.9 1.6 3.2 Median Debt Service Coverage Ratio 3.0 2.5 2.0 1.5 1.0 0.5 0.0 2010 2011 2012 2013 2014 Midwest 2.2 2.0 1.7 1.7 1.8 Southeast 1.7 2.7 2.3 2.7 2.6 Northeast 1.6 2.1 2.1 1.8 1.4 Total 2.1 2.0 1.8 1.8 1.6 Source: CliftonLarsonAllen LLP Clients CLAconnect.com/seniorliving 18 ©2015 CliftonLarsonAllen LLP . 30th Edition: Skilled Nursing Facility Cost Comparison Operating indicators communities. Other factors, such as, changing consumer demands, alternatives for care, reductions in average length of stay, hospital discharge patterns, and health care reform initiatives continue to put downward pressure on occupancy levels. Resident Days Facility Beds x 365 Occupancy Percentage Defined: Measures the occupancy of a facility on an annual basis. Quartiles The continued expansion of alternative choices available for the elderly such as assisted living facilities, home care, adult day care, and other programs, has produced direct competition for licensed nursing facilities. This also produces opportunities for organizations to identify potential strategies to diversify their business to provide additional services to the aging population in their Totals 25% 50% 75% 2010 85.8% 91.9% 94.9% 2011 86.3% 91.5% 94.5% 2012 85.4% 91.5% 94.9% 2013 83.8% 90.9% 94.3% 2014 82.6% 90.4% 94.3% Median Occupancy Percentage 100.0% 96.0% 92.0% 88.0% 84.0% 80.0% 2010 2011 2012 2013 2014 Midwest 91.9% 91.4% 91.4% 90.5% 90.2% Southeast 85.0% 84.2% 84.2% 86.6% 88.6% Northeast 92.7% 92.1% 92.1% 91.5% 91.4% Total 91.9% 91.5% 91.5% 90.9% 90.4% Source: CliftonLarsonAllen LLP Clients CLAconnect.com/seniorliving 19 ©2015 CliftonLarsonAllen LLP . 30th Edition: Skilled Nursing Facility Cost Comparison Medicaid programs decreased by 2.5%. Analysis of national Medicare data indicates an aggressive shift from traditional Medicare to managed Medicare plans (managed care contracts and other payer sources are included in the private and other category below). It is important for facilities to review their Medicare and managed care contracts to ensure they are being paid according to the contract and to explore the opportunity to re-negotiate more favorable contracts where possible. Resident Day Mix Total Resident - Days Average Payer Mix Defined: Measures the utilization of third-party payers. During 2014, there was an increase in the percentage of resident days covered by the Medicare program from 12.5% to 14.5%. The percentage of resident days covered by private and other payers increased .5% from 38.5% to 39.0% in 2014.
The percentage of resident days covered by 2014 Average Payer Mix 2014 Average Payer Mix by Geographic Area Private and Other 39.0% Private and Other Medicaid Medicare Midwest 43.4% 45.0% 11.6% Southeast 27.7% 54.7% 17.6% Northeast 30.6% 58.8% 10.6% Medicaid 46.5% Medicare 14.5% 2013 Average Payer Mix 2013 Average Payer Mix by Geographic Area Private and Other 38.5% Private and Other Medicaid Medicare Midwest 39.9% 47.6% 12.5% Southeast 26.0% 58.3% 15.7% Northeast 30.7% 59.2% 10.1% Medicaid 49.0% Medicare 12.5% Source: CliftonLarsonAllen LLP Clients CLAconnect.com/seniorliving 20 ©2015 CliftonLarsonAllen LLP . 30th Edition: Skilled Nursing Facility Cost Comparison Staffing indicators Since approximately 75 percent of a skilled nursing facility’s operating costs relate to the cost of labor, it is important that a facility monitor these costs and the factors that affect them. The indicators included in this section represent the various factors that influence a facility’s labor costs and are based on data provided by CliftonLarsonAllen’s clients for 2014. Wages Compensated Hours Wages per Compensated Hour Nursing Wages per Compensated Hour 40.00 35.00 30.00 25.00 20.00 15.00 10.00 5.00 - RN LPN Aides Midwest 28.79 23.06 14.65 Southeast 35.31 21.75 12.44 Northeast 33.61 28.45 14.88 Total 32.65 26.16 14.41 Wages per Compensated Hour 25.00 20.00 15.00 10.00 5.00 - Other Care Dietary Laundry Hskpg Maint. Midwest 17.39 12.24 11.44 11.71 17.44 Southeast 16.59 11.93 10.11 10.11 16.76 Northeast 21.83 13.43 11.61 11.86 20.92 Total 20.24 12.80 11.41 11.56 19.26 Source: CliftonLarsonAllen LLP Clients CLAconnect.com/seniorliving 21 ©2015 CliftonLarsonAllen LLP . 30th Edition: Skilled Nursing Facility Cost Comparison Nurse Hours Mix Total Nursing Hours Nursing Staffing Mix Defined: Represents the average nursing department’s staffing mix. Overall, the percentage of total hours staffed by RNs in the past 10 years has increased from 11.2 percent in 2005 to 15.7 percent in 2014. The percentage of total hours staffed by LPN’s over this time period has remained relatively stable while the percentage of total hours for nurse aides has decreased slightly due to the increase in RNs. These trends are a result of caring for increasingly short stay, higher acuity, and medically complex residents. Nursing Staffing Mix 80.0% 70.0% 60.0% 50.0% 40.0% 30.0% 20.0% 10.0% 0.0% 2005 2006 2007 2008 2009 2010 2011 2012 2013 2014 RN 11.2% 10.5% 11.5% 12.0% 12.3% 15.7% 15.6% 15.6% 15.1% 15.7% LPN 20.6% 22.2% 22.5% 22.3% 22.1% 20.8% 20.6% 20.6% 20.4% 20.5% Aides 68.2% 66.8% 66.0% 65.7% 65.5% 63.5% 63.8% 63.8% 64.5% 63.8% Source: CliftonLarsonAllen LLP Clients CLAconnect.com/seniorliving 22 ©2015 CliftonLarsonAllen LLP . 30th Edition: Skilled Nursing Facility Cost Comparison Benefits Mix Total Salary Expense Payroll Taxes and Fringe Benefits Defined: Represents the additional cost of labor associated with payroll taxes and fringe benefits. In addition to direct payroll costs, payroll taxes and fringe benefits are additional costs of labor. Payroll taxes include the nursing facilities share of FICA and unemployment insurance taxes. Fringe benefits include medical, life, and other group insurance; workers’ compensation insurance; pension and/or retirement contributions; uniform allowance; and other miscellaneous employee benefits. As the graph conveys, the cost of payroll taxes and fringe benefits to wages has decreased in 2014 to levels more consistent with 2010 – 2012. Payroll Taxes & Fringe Benefits per $ of Wages 30% 25% 20% 15% 10% 5% 0% 2010 2011 2012 2013 2014 Payroll Taxes 0.11 0.11 0.11 0.13 0.12 Fringe Benefits 0.10 0.10 0.10 0.11 0.10 Total 0.21 0.21 0.21 0.24 0.22 Source: CliftonLarsonAllen LLP Clients CLAconnect.com/seniorliving 23 ©2015 CliftonLarsonAllen LLP .
30th Edition: Skilled Nursing Facility Cost Comparison Compensated Hours Resident Days Hours Per Resident Day Defined: Calculates the actual compensated hours paid per resident day. The 2014 medians included in the graph below represent only those facilities that employ individuals in the respective departments. Facilities that contract for services were eliminated in calculating the respective averages. Compensated Hours per Resident Day 5.00 4.50 4.00 3.50 3.00 2.50 2.00 1.50 1.00 0.50 - Nursing Other Care Dietary Laundry Hskpg Maint. Admin. Midwest 4.63 0.38 0.94 0.15 0.41 0.18 0.40 Southeast 3.82 0.22 0.71 0.15 0.50 0.11 0.26 Northeast 4.32 0.38 0.73 0.19 0.42 0.12 0.28 Total 4.47 0.37 0.81 0.17 0.42 0.15 0.32 Source: CliftonLarsonAllen LLP Clients CLAconnect.com/seniorliving 24 ©2015 CliftonLarsonAllen LLP . 30th Edition: Licensed Nursing Facility Cost Comparison Skilled Nursing Facility Cost Comparison Section II: Cost Analyses Tables Department Totals Per Resident Day Nursing Other Care Ancillary Services Dietary Laundry Housekeeping Plant Operations Real Estate General and Administrative Payroll Benefits Totals Total 90th Percentile 69.09 3.80 11.87 14.88 1.21 3.39 8.60 0.82 10.47 19.63 143.77 Total 75th Percentile 83.77 5.59 19.37 16.56 2.11 4.48 10.45 8.33 15.22 23.00 188.88 Total 50th Percentile 96.12 7.81 29.07 19.35 2.98 5.70 12.82 14.15 25.95 31.85 245.80 Total 25th Percentile 109.48 9.71 38.62 23.63 3.88 7.33 16.14 16.88 35.47 48.38 309.52 Total 10th Percentile 125.59 11.85 52.68 29.53 5.00 9.38 24.30 18.41 44.40 69.84 390.98 2014 Midwest 90th Percentile 62.44 3.40 12.95 14.16 1.21 3.45 8.43 0.04 9.17 29.92 145.17 2014 Midwest 75th Percentile 78.48 5.41 21.84 17.48 1.98 4.49 10.02 3.16 12.09 34.86 189.81 2014 Midwest 50th Percentile 94.67 7.04 32.14 20.44 2.83 5.75 13.02 8.56 15.86 44.61 244.91 2014 Midwest 25th Percentile 107.53 8.68 44.04 24.84 3.55 7.70 17.34 9.60 26.41 63.11 312.79 2014 Midwest 10th Percentile 128.64 10.99 63.04 33.69 4.43 11.07 29.44 11.05 36.69 84.41 413.44 2014 Southeast 90th Percentile 65.00 3.48 24.02 12.94 1.05 3.50 6.59 0.03 7.44 31.04 155.07 2014 Southeast 75th Percentile 69.48 4.01 30.24 13.83 1.64 4.19 8.41 1.57 9.61 33.24 176.22 2014 Southeast 50th Percentile 84.46 4.67 41.47 15.11 2.47 5.10 9.77 2.99 13.31 47.83 227.19 2014 Southeast 25th Percentile 99.78 7.18 53.10 16.89 3.11 7.80 13.53 5.50 24.73 55.01 286.63 2014 Southeast 10th Percentile 120.79 17.10 78.80 43.88 4.41 19.37 31.59 11.59 37.78 63.80 429.10 2014 Northeast 90th Percentile 83.63 5.13 10.72 15.50 1.38 3.35 9.70 12.33 22.47 18.08 182.29 2014 Northeast 75th Percentile 90.52 7.04 18.30 16.72 2.62 4.58 11.13 15.09 25.97 20.20 212.17 2014 Northeast 50th Percentile 99.90 8.78 25.36 19.06 3.33 5.68 12.89 16.72 32.32 23.46 247.50 2014 Northeast 25th Percentile 110.91 10.24 34.30 21.79 4.22 7.17 15.82 17.61 39.12 27.79 288.98 2014 Northeast 10th Percentile 124.72 11.87 40.59 26.74 5.32 8.88 19.29 19.46 45.94 39.06 341.88 CLAconnect.com/seniorliving 25 ©2015 CliftonLarsonAllen LLP . 30th Edition: Skilled Nursing Facility Cost Comparison Salary Comparison Per Resident Day Nursing Total Pool and Nursing Consultants Social Services and Activities Ancillary Services Dietary Laundry Housekeeping Plant Operations General and Admin Totals DON & RN LPN Aides Other Nursing Admin Total 90th Percentile 9.97 11.81 26.09 2.05 0.28 50.20 3.52 1.52 6.81 0.74 2.54 1.54 4.00 70.86 Total 75th Percentile 15.17 15.92 32.02 5.12 0.48 68.71 5.26 9.49 8.47 1.34 3.58 1.99 5.95 104.79 Total 50th Percentile 21.64 21.14 37.24 7.87 1.16 89.05 7.25 14.94 10.47 1.99 4.73 2.78 8.25 139.47 Total 25th Percentile 29.34 26.04 45.03 10.65 2.69 113.76 9.27 21.39 12.67 2.79 6.03 4.00 11.93 181.86 Total 10th Percentile 37.55 30.68 51.98 14.02 6.18 140.42 11.25 26.78 16.87 3.73 7.98 6.74 17.77 231.55 2014 Midwest 90th Percentile 7.36 10.04 27.06 3.24 0.33 48.02 3.20 6.65 7.21 0.73 2.58 1.77 3.89 74.05 2014 Midwest 75th Percentile 12.15 12.98 32.42 6.32 0.56 64.43 4.88 11.29 9.34 1.24 3.41 2.45 5.71 102.75 2014 Midwest 50th Percentile 19.59 17.03 40.62 8.63 1.01 86.87 6.39 18.14 11.88 1.89 4.65 3.36 8.72 141.89 2014 Midwest 25th Percentile 29.42 21.49 49.20 12.84 2.57 115.52 8.34 23.00 15.10 2.47 6.27 4.43 12.80 187.93 2014 Midwest 10th Percentile 41.62 26.86 54.69 16.38 5.18 144.74 10.13 32.19 20.31 3.23 8.17 8.31 18.04 245.11 2014 Southeast 90th Percentile 9.84 13.21 21.80 0.66 0.25 45.75 2.39 9.34 5.13 0.84 2.47 0.83 4.86 71.63 2014 Southeast 75th Percentile 12.73 16.84 22.64 0.80 0.40 53.43 3.30 12.35 5.85 1.17 3.17 1.16 5.82 86.24 2014 Southeast 50th Percentile 17.83 21.01 26.20 1.13 1.19 67.37 3.97 17.73 6.91 1.68 4.35 1.69 7.13 110.83 2014 Southeast 25th Percentile 29.40 28.41 44.06 2.47 2.81 107.16 7.08 25.65 8.64 2.58 5.27 2.09 8.90 167.37 2014 Southeast 10th Percentile 38.95 35.64 52.27 14.96 5.81 147.64 11.18 27.57 9.99 4.34 9.26 8.57 17.20 235.74 2014 Northeast 90th Percentile 13.94 15.91 30.59 3.72 0.29 64.44 4.96 0.55 7.12 0.83 2.35 1.60 3.94 85.80 2014 Northeast 75th Percentile 17.48 19.96 33.25 5.48 0.49 76.66 6.72 6.58 8.47 1.58 3.92 1.90 6.23 112.06 2014 Northeast 50th Percentile 23.74 23.74 36.54 7.81 1.23 93.07 8.36 13.67 10.05 2.26 5.00 2.59 8.21 143.21 2014 Northeast 25th Percentile 29.76 27.78 41.12 9.72 2.76 111.14 9.83 19.69 11.75 3.17 6.09 3.33 12.09 177.08 2014 Northeast 10th Percentile 36.06 31.60 47.76 12.66 6.85 134.93 11.53 25.48 13.97 4.31 7.95 4.93 16.65 219.75 CLAconnect.com/seniorliving 26 ©2015 CliftonLarsonAllen LLP . 30th Edition: Skilled Nursing Facility Cost Comparison Salaries Per Compensated Hour Nursing DON/RN LPN Aides Other Total Nursing Nrs Admin. Other Care Dietary Laundry Housekeeping Plant Operations General and Admin Total Total 90th Percentile 20.08 19.60 11.21 19.28 15.81 13.35 10.21 8.92 8.92 14.03 17.46 88.42 Total 75th Percentile 28.27 22.05 12.92 33.59 18.05 16.25 11.59 10.03 10.28 16.30 22.78 105.28 Total 50th Percentile 32.65 26.16 14.41 44.19 20.69 20.24 12.80 11.41 11.56 19.26 27.19 123.15 Total 25th Percentile 35.92 28.94 15.94 52.69 22.69 23.56 14.10 12.84 12.79 21.74 32.77 140.48 Total 10th Percentile 40.42 31.85 18.50 63.18 24.76 28.61 15.56 14.59 13.94 25.45 39.59 162.49 2014 Midwest 90th Percentile 14.39 17.78 10.74 20.10 14.71 10.93 9.83 8.85 8.93 13.31 14.24 80.82 2014 Midwest 75th Percentile 21.67 20.30 12.29 32.09 16.77 14.93 10.74 10.05 10.47 15.77 20.03 98.76 2014 Midwest 50th Percentile 28.79 23.06 14.65 42.37 19.17 17.39 12.24 11.44 11.71 17.44 24.45 113.84 2014 Midwest 25th Percentile 33.51 26.31 16.75 51.71 22.35 21.17 13.47 13.45 12.91 20.65 28.12 132.11 2014 Midwest 10th Percentile 38.65 28.37 18.66 72.22 24.51 38.15 15.58 14.94 14.07 22.80 35.10 165.15 2014 Southeast 90th Percentile 23.60 19.46 10.14 1.98 15.39 9.23 9.60 7.99 8.19 13.69 23.26 87.36 2014 Southeast 75th Percentile 29.21 20.37 11.02 3.74 15.86 15.06 10.57 8.61 8.79 15.27 25.71 99.88 2014 Southeast 50th Percentile 35.31 21.75 12.44 9.22 17.31 16.59 11.93 10.11 10.11 16.76 29.51 112.31 2014 Southeast 25th Percentile 40.52 22.79 13.15 22.32 18.37 17.72 12.73 11.81 11.67 18.75 34.35 125.39 2014 Southeast 10th Percentile 53.86 27.68 16.21 31.67 20.49 22.81 13.57 13.48 12.81 20.62 40.08 143.86 2014 Northeast 90th Percentile 28.88 23.64 13.03 13.27 18.78 17.26 11.56 9.33 9.94 15.82 20.33 103.01 2014 Northeast 75th Percentile 31.83 26.55 13.79 15.31 20.59 19.81 12.64 10.32 10.80 18.07 24.91 117.14 2014 Northeast 50th Percentile 33.61 28.45 14.88 17.56 21.82 21.83 13.43 11.61 11.86 20.92 30.26 131.72 2014 Northeast 25th Percentile 36.29 30.27 15.88 20.71 23.58 24.62 14.58 12.75 12.93 23.51 36.19 148.16 2014 Northeast 10th Percentile 39.42 32.42 17.69 23.02 25.02 27.83 15.69 14.35 13.77 26.54 44.74 167.93 CLAconnect.com/seniorliving 27 ©2015 CliftonLarsonAllen LLP . 30th Edition: Skilled Nursing Facility Cost Comparison Compensated Hours Per Resident Day Nursing DON/RN LPN Aides Other Nrs Admin Total Nursing Other Care Dietary Laundry Housekeeping Operating Maintenance General and Admin Total Total 90th Percentile 0.36 0.49 1.99 0.13 2.98 0.15 0.56 0.08 0.25 0.08 0.18 4.28 Total 75th Percentile 0.50 0.66 2.30 0.19 3.66 0.25 0.66 0.12 0.34 0.10 0.23 5.36 Total 50th Percentile 0.71 0.83 2.64 0.29 4.47 0.37 0.81 0.17 0.42 0.15 0.32 6.71 Total 25th Percentile 0.96 1.02 2.98 0.43 5.38 0.45 1.08 0.24 0.55 0.26 0.47 8.42 Total 10th Percentile 1.28 1.22 3.40 0.65 6.54 0.58 2.22 0.34 1.19 0.70 0.73 12.29 2014 Midwest 90th Percentile 0.39 0.40 2.18 0.13 3.09 0.11 0.61 0.08 0.24 0.09 0.19 4.41 2014 Midwest 75th Percentile 0.53 0.57 2.48 0.21 3.80 0.21 0.78 0.11 0.31 0.14 0.27 5.61 2014 Midwest 50th Percentile 0.74 0.75 2.78 0.36 4.63 0.38 0.94 0.15 0.41 0.18 0.40 7.09 2014 Midwest 25th Percentile 1.07 0.99 3.14 0.54 5.74 0.47 1.21 0.22 0.52 0.30 0.54 9.00 2014 Midwest 10th Percentile 1.41 1.21 3.53 0.73 6.88 0.59 1.93 0.28 0.89 0.88 0.74 12.19 2014 Southeast 90th Percentile 0.19 0.60 1.78 0.13 2.71 0.14 0.57 0.09 0.32 0.05 0.19 4.07 2014 Southeast 75th Percentile 0.31 0.79 1.95 0.17 3.22 0.18 0.60 0.13 0.38 0.07 0.20 4.78 2014 Southeast 50th Percentile 0.48 0.97 2.14 0.23 3.82 0.22 0.71 0.15 0.50 0.11 0.26 5.77 2014 Southeast 25th Percentile 0.73 1.22 2.84 0.37 5.16 0.31 3.61 0.19 1.75 0.85 0.38 12.25 2014 Southeast 10th Percentile 1.50 1.54 3.14 0.76 6.95 2.11 6.04 0.33 3.19 1.71 1.08 21.40 2014 Northeast 90th Percentile 0.41 0.58 2.01 0.14 3.14 0.24 0.53 0.08 0.25 0.08 0.18 4.50 2014 Northeast 75th Percentile 0.52 0.69 2.29 0.20 3.70 0.30 0.62 0.14 0.34 0.10 0.22 5.42 2014 Northeast 50th Percentile 0.71 0.84 2.50 0.28 4.32 0.38 0.73 0.19 0.42 0.12 0.28 6.45 2014 Northeast 25th Percentile 0.90 0.99 2.87 0.37 5.14 0.44 0.90 0.26 0.53 0.18 0.37 7.81 2014 Northeast 10th Percentile 1.09 1.14 3.17 0.51 5.92 0.51 1.09 0.36 0.72 0.29 0.51 9.41 CLAconnect.com/seniorliving 28 ©2015 CliftonLarsonAllen LLP . 30th Edition: Skilled Nursing Facility Cost Comparison Payroll Taxes and Fringe Benefits Per Resident Day FICA/PERA Unemployment Taxes Group Insurance Workers’ Comp. Ins. Pension or Profit Sharing Other Fringe Benefits Totals Total 90th Percentile 7.16 0.11 4.73 1.27 0.10 0.21 13.59 Total 75th Percentile 8.94 0.30 7.09 1.94 0.28 0.45 19.00 Total 50th Percentile 10.44 0.72 9.64 2.69 1.31 1.11 25.92 Total 25th Percentile 12.43 1.37 16.04 4.22 2.97 2.31 39.34 Total 10th Percentile 15.92 2.32 24.59 6.75 5.68 3.61 58.87 2014 Midwest 90th Percentile 6.60 0.05 4.78 1.48 0.28 0.18 13.37 2014 Midwest 75th Percentile 8.19 0.19 8.65 2.62 1.22 0.53 21.41 2014 Midwest 50th Percentile 9.66 0.54 14.44 4.04 2.13 1.30 32.11 2014 Midwest 25th Percentile 13.03 1.02 21.04 5.55 3.92 2.44 47.01 2014 Midwest 10th Percentile 17.94 1.91 27.59 8.01 6.91 4.09 66.46 2014 Southeast 90th Percentile 5.09 0.16 7.17 0.36 0.25 0.17 13.20 2014 Southeast 75th Percentile 5.73 0.29 8.29 0.59 0.38 0.46 15.75 2014 Southeast 50th Percentile 7.17 0.80 14.62 1.78 1.37 0.85 26.58 2014 Southeast 25th Percentile 8.86 1.48 21.42 4.12 3.22 1.35 40.44 2014 Southeast 10th Percentile 17.12 1.92 38.05 10.60 5.24 1.89 74.81 2014 Northeast 90th Percentile 9.46 N/A 4.65 1.41 0.05 0.24 15.82 2014 Northeast 75th Percentile 9.96 N/A 6.49 1.86 0.15 0.40 18.85 2014 Northeast 50th Percentile 10.86 N/A 8.05 2.29 0.31 0.92 22.43 2014 Northeast 25th Percentile 12.35 N/A 10.38 2.95 1.14 2.16 28.99 2014 Northeast 10th Percentile 14.28 N/A 13.71 4.09 4.50 3.62 40.20 CLAconnect.com/seniorliving 29 ©2015 CliftonLarsonAllen LLP . 30th Edition: Skilled Nursing Facility Cost Comparison Food, Utilities, Repairs, Maintenance, and General Insurance Per Resident Day Repairs Maintenance, Contracts, Purchased Services/Other Property and Liability Insurance Property and Related Totals 3.71 0.16 1.23 0.71 6.17 0.60 4.57 0.39 2.36 1.37 9.29 0.92 5.73 0.95 3.73 2.01 13.34 9.08 1.46 7.19 1.58 5.90 2.79 18.91 Total 10th Percentile 12.74 2.11 9.18 3.30 12.81 4.71 32.11 2014 Midwest 90th Percentile 5.67 0.24 3.80 0.18 0.79 1.12 6.12 2014 Midwest 75th Percentile 6.69 0.47 4.55 0.39 1.58 1.61 8.60 2014 Midwest 50th Percentile 8.62 0.75 5.82 0.90 3.42 2.27 13.15 2014 Midwest 25th Percentile 10.97 1.11 7.88 1.51 7.74 3.04 21.28 2014 Midwest 10th Percentile 18.75 1.84 10.27 2.30 15.57 5.82 35.80 2014 Southeast 90th Percentile 1.71 0.99 3.16 N/A 2.37 0.69 7.22 2014 Southeast 75th Percentile 4.87 1.40 3.67 N/A 2.99 0.85 8.92 2014 Southeast 50th Percentile 5.88 2.08 4.83 N/A 4.31 0.98 12.20 2014 Southeast 25th Percentile 6.89 3.22 5.88 N/A 5.52 2.03 16.66 2014 Southeast 10th Percentile 8.51 3.90 7.85 N/A 10.83 7.08 29.65 2014 Northeast 90th Percentile 0.37 0.41 4.00 0.15 1.34 0.39 6.29 2014 Northeast 75th Percentile 6.14 0.65 4.72 0.47 2.08 1.39 9.31 Food Expense Maintenance Supplies Utilities Total 90th Percentile 2.12 0.36 Total 75th Percentile 6.14 Total 50th Percentile 7.37 Total 25th Percentile CLAconnect.com/seniorliving 30 ©2015 CliftonLarsonAllen LLP . 30th Edition: Skilled Nursing Facility Cost Comparison Housekeeping and Plant Operations Costs Per Square Foot Housekeeping Plant Operations Salaries Purch. Services Other Total Salaries Utilities Purch. Services Other Total Total 90th Percentile 1.20 0.01 0.33 1.54 0.80 2.13 0.23 0.23 3.39 Total 75th Percentile 2.06 0.02 0.71 2.80 1.24 2.83 0.39 0.81 5.27 Total 50th Percentile 3.06 0.11 1.17 4.34 2.07 3.90 0.74 2.57 9.28 Total 25th Percentile 4.94 0.97 1.90 7.81 3.49 5.56 1.47 6.14 16.66 Total 10th Percentile 8.40 3.21 3.13 14.74 6.45 9.29 3.56 11.26 30.56 2014 Midwest 90th Percentile 1.01 0.01 0.27 1.29 0.78 2.08 0.20 0.22 3.29 2014 Midwest 75th Percentile 1.81 0.02 0.61 2.45 1.34 2.62 0.35 0.60 4.90 2014 Midwest 50th Percentile 2.86 0.07 1.08 4.00 2.07 3.68 0.68 2.09 8.53 2014 Midwest 25th Percentile 4.23 0.22 1.68 6.12 3.25 5.04 1.17 5.07 14.54 2014 Midwest 10th Percentile 6.28 1.08 2.82 10.19 4.74 6.87 2.49 9.90 24.00 2014 Southeast 90th Percentile 1.91 0.02 0.24 2.17 0.76 2.14 0.32 0.96 4.18 2014 Southeast 75th Percentile 2.43 0.11 0.45 2.99 1.01 3.20 0.42 1.61 6.25 2014 Southeast 50th Percentile 3.93 0.50 0.73 5.16 1.53 4.23 0.76 3.47 9.99 2014 Southeast 25th Percentile 7.02 2.76 1.44 11.22 2.67 5.45 1.32 5.65 15.09 2014 Southeast 10th Percentile 8.77 3.69 2.00 14.46 7.81 8.92 3.27 7.29 27.28 2014 Northeast 90th Percentile N/A N/A N/A N/A N/A N/A N/A N/A N/A 2014 Northeast 75th Percentile N/A N/A N/A N/A N/A N/A N/A N/A N/A 2014 Northeast 50th Percentile N/A N/A N/A N/A N/A N/A N/A N/A N/A 2014 Northeast 25th Percentile N/A N/A N/A N/A N/A N/A N/A N/A N/A 2014 Northeast 10th Percentile N/A N/A N/A N/A N/A N/A N/A N/A N/A CLAconnect.com/seniorliving 31 ©2015 CliftonLarsonAllen LLP . 30th Edition: Section III: About CliftonLarsonAllen History and experience CliftonLarsonAllen is a professional services firm delivering integrated wealth advisory, outsourcing, and public accounting capabilities to help enhance our clients’ enterprise value and assist them in growing and managing their related personal assets — all the way from startup to succession and beyond. Our professionals are immersed in the industries they serve and have specialized knowledge of their operating and regulatory environments. With nearly 4,000 people, 90 U.S. locations, and a global affiliation, we bring a wide array of solutions to help clients in all markets, foreign and domestic.
Investment advisory services are offered through CliftonLarsonAllen Wealth Advisors, LLC, an SEC-registered investment advisor. Skilled Nursing Facility Cost Comparison we draw upon our diverse backgrounds to develop tailored solutions that will position our clients for success; not only today but in the future. Success over the long-term is what we call building enterprise value. We assist our clients in building enterprise value by tailoring solutions from these capabilities: strategy, operations, finance, and compliance. Our independent and objective professionals are guided by your strategic vision and your unique environment. CliftonLarsonAllen offers unprecedented emphasis on serving privately held businesses and their owners, as well as nonprofits and governmental entities.
CliftonLarsonAllen serves clients globally as an independent member firm of Nexia International, a top worldwide network of separate and independent professional accounting and business advisory firms. To break it down further, we serve: For more information about CliftonLarsonAllen, visit www.CLAconnect.com. • 2,000+ aging services providers including nursing facilities, CCRCs, assisted living facilities, HUD housing, etc. • 200+ home care, hospice, and other community based providers • 700+ hospitals and health systems, including approximately 100 critical access hospitals • 3,800+ physicians, dentists, and medical practices • 100+ other health care entities (therapy providers, managed care entities, health care management companies, mental health providers, etc.) Our dedication to health care CliftonLarsonAllen has developed one of the nation’s largest health care practices. Our team includes CPAs and a diverse range of experienced professionals with backgrounds and skill sets ranging from CEOs and CFOs to RNs, certified coders, and certified medical practice executives. Represented by team members possessing over 30 years of dedicated experience to the health care field, We are truly “industry-driven” firm! Physicians and Nurses Administrators Patients Management Board Members CLA Professionals Community Involvement Public Accounting How we serve the health care industry While we have all chosen different paths, we have the same dream — to impact and improve the delivery of health care services in our communities! Alternatively, while other firms may “specialize” in health care, they are usually public accountants first and health care professionals second. CLAconnect.com/seniorliving 32 ©2015 CliftonLarsonAllen LLP .
30th Edition: Skilled Nursing Facility Cost Comparison CLA promise Our interactions with you will support your goals and dreams and help impact your success — that is the CLA Promise. We strive to be thought leaders impacting the future of health care. We accomplish this by never losing sight of our firm’s mission of creating impactful interactions for success. This impact comes from our deep, passionate industry professionals that deliver seamless and integrated service capabilities. Here’s what you can expect from CLA: Promise Seamless, integrated capabilities Deep industry specialization The full force of 3,600 talented people with experience in public accounting, wealth advisory, and outsourcing — a vast network of resources behind the scenes — all seamlessly volunteered, presented, and delivered right to you Deep health care industry and sub-industry insight that combines our knowledge with yours to make you stronger Premier resource for private business and nonprofits and the people who own and lead them THE career-building firm Planning and guidance for all possible eventualities, from startup through succession, and particular care for the individuals who own and lead your organization Entrepreneurial, engaged, and passionate people with freedom and agility to serve you rather than merely perform obligatory functions CLAconnect.com/seniorliving 33 ©2015 CliftonLarsonAllen LLP .
30th Edition: Skilled Nursing Facility Cost Comparison A national and regional commitment to the senior living field We recognize the importance of supporting health care associations. On an annual basis, we participate in over 100 health care events at a variety of levels including speaking, exhibiting, and sponsorships. In addition, we regularly contribute articles to trade publications. This level of involvement allows us to thoroughly understand the issues facing the industry and proactively address them. We are especially pleased with the following affiliations. AAOE We are members of the American Association of Orthopaedic Executives (AAOE).
This association regularly invites our professionals to present educational sessions to orthopaedic practice executives and their staff. AHCA As gold level members, we support the American Health Care Association (AHCA). Members of our team routinely attend and speak at the annual conference and trade show. Our professionals are active members within their state affiliated associations and have performed demand studies for a number of them. AICPA Our CPAs are members of the American Institute of Certified Public Accountants (AICPA), and we actively attend the organization’s events.
Our lead assurance and accounting (A&A) quality principal for our national health care audit practice is a member of the AICPA Health Care Expert Panel. He also serves as a reviewer for the annual revisions to the AICPA Health Care Audit Guide and the annual AICPA publication, Health Care Industry Developments. HFMA We are active members of the Healthcare Financial Management Association (HFMA) and the state chapters in the regions we serve. We regularly attend the conferences and our principals are consistently chosen to present educational sessions.
Our professionals have published articles in Healthcare Financial Management magazine. HHFMA Home Care and Hospice Financial Managers Association (HHFMA) was created by the National Association of Home Care & Hospice (NAHC) to meet the growing needs of home care and hospice financial managers and consultants. Two of our health care principals serve on the Finance Manager’s Workgroup. LeadingAge We are a gold partner with LeadingAge . This arrangement offers outstanding benefits, including opportunities to pursue knowledge and information that will be passed along directly to our clients.
We also support LeadingAge by presenting educational sessions at their conferences and jointly sponsoring performance indicator projects. In addition, we are active members of the state affiliated associations and conduct benchmarking surveys for many of them. Lincoln Healthcare We are sponsor partners of several events facilitiated by Lincoln Healthcare, which is an independent organizer of executive leadership communities in health care. Events include: • Hospital 100 for hospital executives • LTC 100 for senior management in long-term care and assisted living • Home Care 100 for home care management MGMA We are active members of the Medical Group Management Association (MGMA) and its state organizations in the regions we serve. Several of our professionals are recognized Certified Medical Practice Executives (CMPE).
On a regular basis, we speak at their conferences. NAHC We are involved members of the National Association of Home Care & Hospice (NAHC). Annually, we speak at several events, and we are proud to be significant sponsors of the financial management conference. In addition, we have contributed articles to the association’s magazine, Caring, and a member of our team has served as the guest editor. RBMA As active members of the Radiology Business Management Association (RBMA), we consistently speak at their conferences and facilitate webinars.
In addition, we write articles for the RBMA Bulletin and annually assist the association conduct its member surveys. CLAconnect.com/seniorliving 34 ©2015 CliftonLarsonAllen LLP . 30th Edition: Skilled Nursing Facility Cost Comparison Solutions for senior living providers Our tailored solutions support the evolving needs of providers who serve individuals in the third age of their lives. • Strategic capital planning • Operations and performance improvement • Health reform advisory • Financial feasibility studies • Market research and analysis • Marketing and sales consulting • Mergers, acquisitions, and affiliation facilitation • Due diligence • Valuation • Executive search • Debt advisory • Facility master planning services • Clinical consulting Due to escalating operating costs, personnel shortages, and changing reimbursement models, senior living providers are being forced to reexamine the way they do business. They need new, more efficient ways to deliver care. New technologies and alternate care models impact the venues in which care is delivered. CliftonLarsonAllen stays informed of industry trends and the legal, regulatory, and operational environment.
We can help position your organization for the challenges and opportunities of tomorrow. About CLA From the beginning, we followed a simple idea: care about our clients, and support the people who serve them. Our clients include skilled nursing facilities, continuing care retirement communities, post-acute care networks, homes for the developmentally disabled, assisted living facilities, independent living facilities, home and community based services, and other long-term care providers. Serving clients and caring for their needs means that we continuously evolve as their business needs become more sophisticated. We’ve developed industry expertise, and find exceptional people with a passion for honing industry specific skills. Services • Wealth advisory • Outsourcing • Audit, accounting, reimbursement, and tax • Information security • HIPAA compliance • Benchmarking • Strategic planning CLAconnect.com/seniorliving We have more than 90 locations across the United States. Approximately 300 health care team members are available to serve you. 35 ©2015 CliftonLarsonAllen LLP .
30th Edition: Skilled Nursing Facility Cost Comparison Health care offices If you would like to speak with someone about our health care services, see the list of contacts below. Baltimore Boston Charlotte Dallas Indianapolis Milwaukee Minneapolis Oak Brook Orlando Philadelphia Phoenix Seattle St. Louis Washington DC 1966 Greenspring Drive, Suite 300 Timonium, MD 21093 Contact: Jon Hansen, CPA Telephone: 410-453-5551 Fax: 410-453-0914 Email: jonathan.hansen@CLAconnect.com 300 Crown Colony Drive, Suite 310 Quincy, MA 02169 Contact: Karl Baker, CPA Telephone: 617-984-8100 Fax: 617-984-8150 Email: karl.baker@CLAconnect.com 222 West Trade Street, 8th Floor Charlotte, NC 28202 Contact: Trey Sturtevant, CPA Telephone: 704-998-5200 Fax: 704-998-5250 Email: trey.sturtevant@CLAconnect.com Providence Towers 5001 Spring Valley Road, Suite 600W Dallas, TX 75244 Contact: Mike Siegel, CPA Telephone: 972-383-5700 Fax: 972-383-5750 Email: michael.siegel@CLAconnect.com 9365 Counselors Row, Suite 200 Indianapolis, IN 46240 Contact: Deb Freeland, CPA Telephone: 317-569-6230 Fax: 317-574-9707 Email: deb.freeland@CLAconnect.com 10700 West Research Drive, Suite 200 Milwaukee, WI 53226 Contact: Michael Peer, CPA Telephone: 414-721-7580 Fax: 414-476-7286 Email: michael.peer@CLAconnect.com 220 South Sixth Street, Suite 300 Minneapolis, MN 55402 Contact: Jeff Vrieze, CPA Telephone: 612-376-4500 Fax: 612-376-4850 Email: jeff.vrieze@CLAconnect.com 1301 West 22nd Street, Suite 1100 Oak Brook, IL 60523 Contact: Jim Thomas, CPA Telephone: 630-368-3611 Fax: 630-573-0798 Email: jim.thomas@CLAconnect.com CNL Center II 420 South Orange Avenue, Suite 500 Orlando, FL 32801 Contact: Gregg Hathorne, CPA Telephone: 407-802-1200 Fax: 407-802-1250 610 W Germantown Pike, Suite 400 Plymouth Meeting, PA 19462 Contact: James Watson, CPA Telephone: 215-643-3900 Fax: 215-643-4030 Email: james.watson@CLAconnect.com 20 East Thomas Road, Suite 2300 Phoenix, AZ 85012 Contact: Chad Kunze, CPA Telephone: 602-266-2248 Fax: 602-266-2907 Email: chad.kunze@CLAconnect.com 3000 Northup Way, Suite 200 Bellevue, WA 98004 Contact: Dan Frein, CPA Telephone: 425-250-6037 Fax: 425-250-6050 Email: daniel.frein@CLAconnect.com 600 Washington Avenue, Suite 1800 St. Louis, MO 63101 Contact: Josh Wilks, CPA Telephone: 314-925-4300 Fax: 314-925-4350 Email: joshua.wilks@CLAconnect.com 4250 North Fairfax Drive, Suite 1020 Arlington, VA 22203 Contact: John Langan, CPA Telephone: 571-227-9500 Fax: 571-227-9552 Email: jonathan.langan@CLAconnect.com CLAconnect.com/seniorliving 36 ©2015 CliftonLarsonAllen LLP .


