


Description
MARKET AND ECONOMIC
OUTLOOK
October 2014
Construction Adds Fuel to U.S. Economic Growth
Tax Information
Find these topics of interest at
CLAconnect.com/tax:
• Life Insurance: A Retirement Strategy
With Tax Savings for High Earners
• Don’t Miss the Potential Tax Savings on
Property Improvements
• IRS Streamlines Offshore Voluntary
Disclosure Program
Despite below-average growth during the recovery, the U.S. economy is expanding faster than many of the developed
areas of the world, including Europe and Japan. Federal budget deficits are decreasing while construction is picking
up and employment continues to steadily improve.
We believe this momentum will persist to the end of the year. Unfortunately, the U.S. stock market may have already discounted or considered some of this good news. Our economy is also the beneficiary of capital seeking a safe haven as armed conflicts increase around the world. Some of the positives and negatives on the horizon include: Positives Negatives Record corporate earnings and profitability Federal Reserve stimulus being “tapered;” QE ending Strong leading indicators in manufacturing U.S.
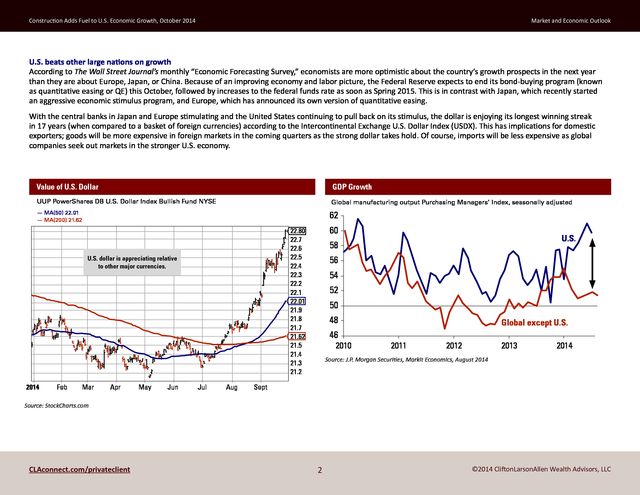
stocks are fairly valued to slightly overvalued Strong auto sales Corporate earnings growth is slowing Real estate prices continue to firm Geo-political risks are rising; watch Russia and Ukraine Federal budget deficits are getting smaller Deflation risks in Europe Low reported inflation U.S. energy renaissance CLAconnect.com/privateclient ©2014 CliftonLarsonAllen Wealth Advisors, LLC . Construction Adds Fuel to U.S. Economic Growth, October 2014 Market and Economic Outlook U.S. beats other large nations on growth According to The Wall Street Journal’s monthly “Economic Forecasting Survey,” economists are more optimistic about the country’s growth prospects in the next year than they are about Europe, Japan, or China. Because of an improving economy and labor picture, the Federal Reserve expects to end its bond-buying program (known as quantitative easing or QE) this October, followed by increases to the federal funds rate as soon as Spring 2015.
This is in contrast with Japan, which recently started an aggressive economic stimulus program, and Europe, which has announced its own version of quantitative easing. With the central banks in Japan and Europe stimulating and the United States continuing to pull back on its stimulus, the dollar is enjoying its longest winning streak in 17 years (when compared to a basket of foreign currencies) according to the Intercontinental Exchange U.S. Dollar Index (USDX). This has implications for domestic exporters; goods will be more expensive in foreign markets in the coming quarters as the strong dollar takes hold.
Of course, imports will be less expensive as global companies seek out markets in the stronger U.S. economy. Value of U.S. Dollar GDP Growth UUP PowerShares DB U.S.
Dollar Index Bullish Fund NYSE Global manufacturing output Purchasing Managers’ Index, seasonally adjusted — MA(50) 22.01 — MA(200) 21.62 62 U.S. dollar is appreciating relative to other major currencies. 2014 Feb Mar Apr May Jun 60 22.80 22.7 22.6 22.5 22.4 22.3 22.2 22.1 22.01 21.9 21.8 21.7 21.62 21.5 21.4 21.3 21.2 Jul Aug U.S. 58 56 54 52 50 48 46 2010 Global except U.S. 2011 2012 2013 2014 Source: J.P. Morgan Securities, Markit Economics, August 2014 Sept Source: StockCharts.com CLAconnect.com/privateclient 2 ©2014 CliftonLarsonAllen Wealth Advisors, LLC .
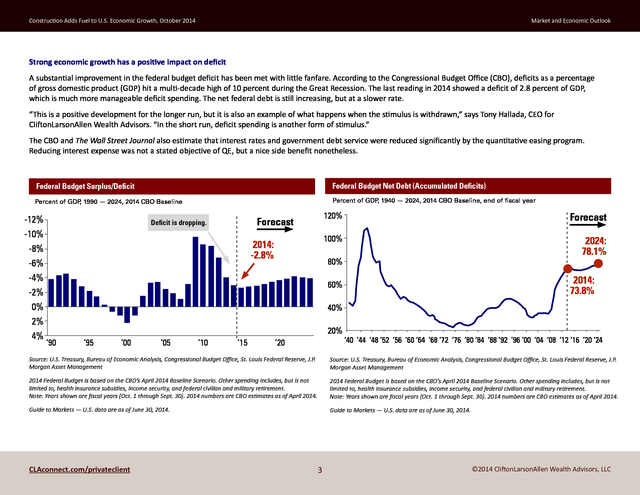
Construction Adds Fuel to U.S. Economic Growth, October 2014 Market and Economic Outlook Strong economic growth has a positive impact on deficit A substantial improvement in the federal budget deficit has been met with little fanfare. According to the Congressional Budget Office (CBO), deficits as a percentage of gross domestic product (GDP) hit a multi-decade high of 10 percent during the Great Recession. The last reading in 2014 showed a deficit of 2.8 percent of GDP, which is much more manageable deficit spending.
The net federal debt is still increasing, but at a slower rate. “This is a positive development for the longer run, but it is also an example of what happens when the stimulus is withdrawn,” says Tony Hallada, CEO for CliftonLarsonAllen Wealth Advisors. “In the short run, deficit spending is another form of stimulus.” The CBO and The Wall Street Journal also estimate that interest rates and government debt service were reduced significantly by the quantitative easing program. Reducing interest expense was not a stated objective of QE, but a nice side benefit nonetheless. Federal Budget Surplus/Deficit Federal Budget Net Debt (Accumulated Deficits) Percent of GDP 1990 — 2024, 2014 CBO Baseline , Percent of GDP 1940 — 2024, 2014 CBO Baseline, end of fiscal year , -12% -10% -8% -6% -4% -2% 0% 2% 4% 120% 2014: -2.8% Forecast 100% Forecast Deficit is dropping. 2024: 78.1% 80% 2014: 73.8% 60% 40% 20% ‘90 ‘95 ‘00 ‘05 ‘10 ‘15 ‘20 ‘40 ‘44 ‘48 ‘52 ‘56 ‘60 ‘64 ‘68 ‘72 ‘76 ‘80 ‘84 ‘88 ‘92 ‘96 ‘00 ‘04 ‘08 ‘12 ‘16 ‘20 ‘24 Source: U.S. Treasury, Bureau of Economic Analysis, Congressional Budget Office, St.
Louis Federal Reserve, J.P. Morgan Asset Management Source: U.S. Treasury, Bureau of Economic Analysis, Congressional Budget Office, St. Louis Federal Reserve, J.P. Morgan Asset Management 2014 Federal Budget is based on the CBO’s April 2014 Baseline Scenario.
Other spending includes, but is not limited to, health insurance subsidies, income security, and federal civilian and military retirement. Note: Years shown are fiscal years (Oct. 1 through Sept. 30).
2014 numbers are CBO estimates as of April 2014. 2014 Federal Budget is based on the CBO’s April 2014 Baseline Scenario. Other spending includes, but is not limited to, health insurance subsidies, income security, and federal civilian and military retirement. Note: Years shown are fiscal years (Oct. 1 through Sept.
30). 2014 numbers are CBO estimates as of April 2014. Guide to Markets — U.S. data are as of June 30, 2014. Guide to Markets — U.S.
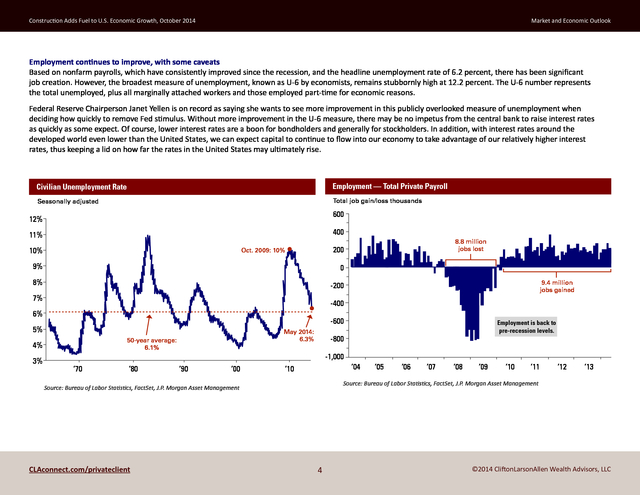
data are as of June 30, 2014. CLAconnect.com/privateclient 3 ©2014 CliftonLarsonAllen Wealth Advisors, LLC . Construction Adds Fuel to U.S. Economic Growth, October 2014 Market and Economic Outlook Employment continues to improve, with some caveats Based on nonfarm payrolls, which have consistently improved since the recession, and the headline unemployment rate of 6.2 percent, there has been significant job creation. However, the broadest measure of unemployment, known as U-6 by economists, remains stubbornly high at 12.2 percent. The U-6 number represents the total unemployed, plus all marginally attached workers and those employed part-time for economic reasons. Federal Reserve Chairperson Janet Yellen is on record as saying she wants to see more improvement in this publicly overlooked measure of unemployment when deciding how quickly to remove Fed stimulus.
Without more improvement in the U-6 measure, there may be no impetus from the central bank to raise interest rates as quickly as some expect. Of course, lower interest rates are a boon for bondholders and generally for stockholders. In addition, with interest rates around the developed world even lower than the United States, we can expect capital to continue to flow into our economy to take advantage of our relatively higher interest rates, thus keeping a lid on how far the rates in the United States may ultimately rise. Civilian Unemployment Rate Employment — Total Private Payroll Seasonally adjusted Total job gain/loss thousands 600 12% 400 11% 10% 8.8 million jobs lost 200 Oct.
2009: 10% 9% 0 8% -200 7% -400 6% -600 5% May 2014: 6.3% 50-year average: 6.1% 4% 3% 9.4 million jobs gained Employment is back to pre-recession levels. -800 -1,000 ‘70 ‘80 ‘90 ‘00 ‘04 ‘10 ‘06 ‘07 ‘08 ‘09 ‘10 ‘11 ‘12 ‘13 Source: Bureau of Labor Statistics, FactSet, J.P. Morgan Asset Management Source: Bureau of Labor Statistics, FactSet, J.P. Morgan Asset Management CLAconnect.com/privateclient ‘05 4 ©2014 CliftonLarsonAllen Wealth Advisors, LLC .
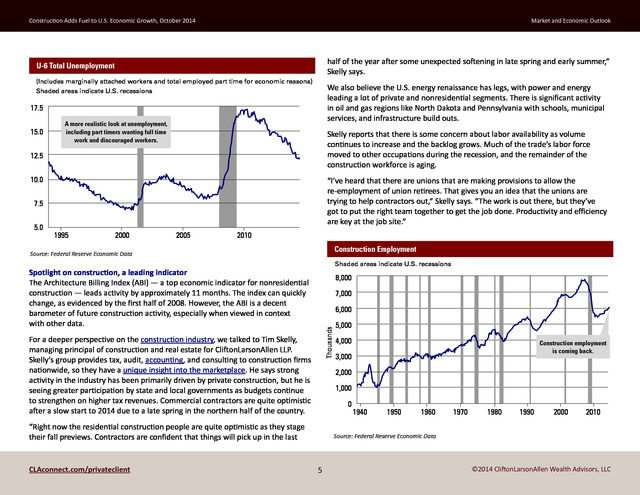
Construction Adds Fuel to U.S. Economic Growth, October 2014 Market and Economic Outlook half of the year after some unexpected softening in late spring and early summer,” Skelly says. U-6 Total Unemployment (Includes marginally attached workers and total employed part time for economic reasons) Shaded areas indicate U.S. recessions We also believe the U.S. energy renaissance has legs, with power and energy leading a lot of private and nonresidential segments.
There is significant activity in oil and gas regions like North Dakota and Pennsylvania with schools, municipal services, and infrastructure build outs. 17.5 15.0 A more realistic look at unemployment, including part timers wanting full time work and discouraged workers. Skelly reports that there is some concern about labor availability as volume continues to increase and the backlog grows. Much of the trade’s labor force moved to other occupations during the recession, and the remainder of the construction workforce is aging. 12.5 10.0 “I’ve heard that there are unions that are making provisions to allow the re-employment of union retirees. That gives you an idea that the unions are trying to help contractors out,” Skelly says.
“The work is out there, but they’ve got to put the right team together to get the job done. Productivity and efficiency are key at the job site.” 7.5 5.0 1995 2000 2005 2010 Construction Employment Source: Federal Reserve Economic Data Shaded areas indicate U.S. recessions Spotlight on construction, a leading indicator The Architecture Billing Index (ABI) — a top economic indicator for nonresidential construction — leads activity by approximately 11 months.
The index can quickly change, as evidenced by the first half of 2008. However, the ABI is a decent barometer of future construction activity, especially when viewed in context with other data. 8,000 7,000 Thousands 6,000 For a deeper perspective on the construction industry, we talked to Tim Skelly, managing principal of construction and real estate for CliftonLarsonAllen LLP. Skelly’s group provides tax, audit, accounting, and consulting to construction firms nationwide, so they have a unique insight into the marketplace. He says strong activity in the industry has been primarily driven by private construction, but he is seeing greater participation by state and local governments as budgets continue to strengthen on higher tax revenues.
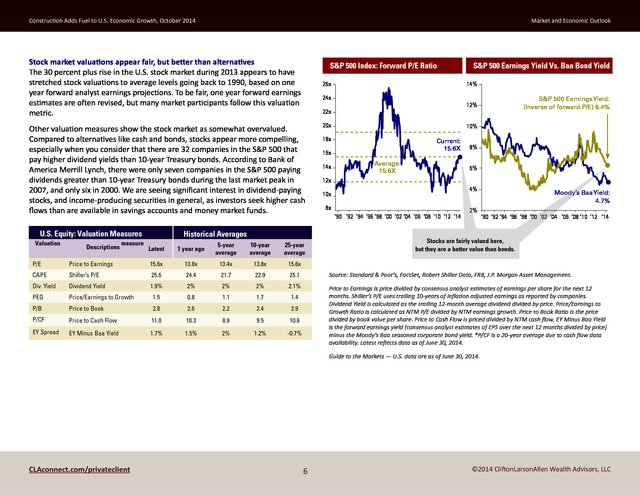
Commercial contractors are quite optimistic after a slow start to 2014 due to a late spring in the northern half of the country. 4,000 Construction employment is coming back. 3,000 2,000 1,000 0 “Right now the residential construction people are quite optimistic as they stage their fall previews. Contractors are confident that things will pick up in the last CLAconnect.com/privateclient 5,000 1940 1950 1960 1970 1980 1990 2000 2010 Source: Federal Reserve Economic Data 5 ©2014 CliftonLarsonAllen Wealth Advisors, LLC . Construction Adds Fuel to U.S. Economic Growth, October 2014 Market and Economic Outlook Stock market valuations appear fair, but better than alternatives The 30 percent plus rise in the U.S. stock market during 2013 appears to have stretched stock valuations to average levels going back to 1990, based on one year forward analyst earnings projections. To be fair, one year forward earnings estimates are often revised, but many market participants follow this valuation metric. S&P 500 Index: Forward P/E Ratio 26x U.S.
Equity: Valuation Measures Valuation Descriptions measure 14% 24x Historical Averages Latest 1 year ago 5-year average 10-year average 25-year average 20x 10% 18x Current: 15.6X 16x 14x S&P 500 Earnings Yield: (Inverse of forward P/E) 6.4% 12% 22x Other valuation measures show the stock market as somewhat overvalued. Compared to alternatives like cash and bonds, stocks appear more compelling, especially when you consider that there are 32 companies in the S&P 500 that pay higher dividend yields than 10-year Treasury bonds. According to Bank of America Merrill Lynch, there were only seven companies in the S&P 500 paying dividends greater than 10-year Treasury bonds during the last market peak in 2007, and only six in 2000. We are seeing significant interest in dividend-paying stocks, and income-producing securities in general, as investors seek higher cash flows than are available in savings accounts and money market funds. S&P 500 Earnings Yield Vs.
Baa Bond Yield Average: 15.6X 8% 6% 12x 4% 10x 8x ‘90 ‘92 ‘94 ‘96 ‘98 ‘00 ‘02 ‘04 ‘06 ‘08 ‘10 ‘12 ‘14 2% Moody’s Baa Yield: 4.7% ‘90 ‘92 ‘94 ‘96 ‘98 ‘00 ‘02 ‘04 ‘06 ‘08 ‘10 ‘12 ‘14 Stocks are fairly valued here, but they are a better value than bonds. P/E Price to Earnings 15.6x 13.8x 13.4x 13.8x 15.6x CAPE Shiller’s P/E 25.6 24.4 21.7 22.9 25.1 Source: Standard & Poor’s, FactSet, Robert Shiller Data, FRB, J.P. Morgan Asset Management. Div. Yield Dividend Yield 1.9% 2% 2% 2% 2.1% PEG Price/Earnings to Growth 1.5 0.8 1.1 1.7 1.4 P/B Price to Book 2.8 2.6 2.2 2.4 2.9 P/CF Price to Cash Flow 11.0 10.3 8.9 9.5 10.6 EY Spread EY Minus Baa Yield 1.7% 1.5% 2% 1.2% -0.7% Price to Earnings is price divided by consensus analyst estimates of earnings per share for the next 12 months.
Shiller’s P/E uses trailing 10-years of inflation adjusted earnings as reported by companies. Dividend Yield is calculated as the trailing 12-month average dividend divided by price. Price/Earnings to Growth Ratio is calculated as NTM P/E divided by NTM earnings growth. Price to Book Ratio is the price divided by book value per share.
Price to Cash Flow is priced divided by NTM cash flow. EY Minus Baa Yield is the forward earnings yield (consensus analyst estimates of EPS over the next 12 months divided by price) minus the Moody’s Baa seasoned corporate bond yield. *P/CF is a 20-year average due to cash flow data availability.
Latest reflects data as of June 30, 2014. Guide to the Markets — U.S. data are as of June 30, 2014. CLAconnect.com/privateclient 6 ©2014 CliftonLarsonAllen Wealth Advisors, LLC . Construction Adds Fuel to U.S. Economic Growth, October 2014 Market and Economic Outlook Trouble continues in Russia and Ukraine Geo-political hot spots dot the globe. While the human tragedy and suffering cannot be diminished, the capital markets will move when news that economic activity and company earnings are impacted. The capital markets have generally grinded upward despite the headline risks overseas.
We believe the Russia and Ukraine conflict is the one to monitor. It has the greatest potential to impact economic activity, especially in Europe. Western nations are using economic sanctions to influence Russia’s involvement in Ukraine.
An escalation in economic sanctions by Russian and western countries could crimp an already tenuous recovery in Europe and impact worldwide economic activity. Expect a market correction We still have not witnessed a 10 percent stock market correction in three years. With stock indices sitting at all time highs, a correction could develop at any time and should be expected. Corrections are a necessary event to keep valuations in check and reduce the probability of bubble formation. “With the end of the Fed’s QE program in sight, numerous geo-political concerns, and deflationary signs elsewhere around the world, we believe volatility will pick up,” says Hallada.
“However, this should not impact a long-term investor’s strategy. Where appropriate, we are diversifying our client portfolios into private real estate, where we are seeing much more compelling returns for risk assumed than in traditional stocks and bonds.” CliftonLarsonAllen Wealth Advisors, LLC Investment Committee connect@CLAconnect.com CliftonLarsonAllen Wealth Advisors, LLC (“CLA Wealth Advisors”) The purpose of this publication is purely educational and informational. It is not intended to promote any product or service and should not be relied on for accounting, legal, tax, or investment advice. The views expressed are those of CLA Wealth Advisors.
They are subject to change at any time. Past performance does not imply or guarantee future results. Investing entails risks, including possible loss of principal.
Diversification cannot assure a profit or guarantee against a loss. Investing involves other forms of risk that are not described here. For that reason, you should contact an investment professional before acting on any information in this publication. Financial information is from third party sources.
Such information is believed to be reliable but is not verified or guaranteed. Performances from any indices in this report are presented without factoring fees or charges, and are provided for reference and competitive purposes only. Any fees, charges, or holdings different than the indices will effect individual results.
Indexes are unmanaged; one cannot invest directly into an index. Investment advisory services are offered through CliftonLarsonAllen Wealth Advisors, LLC, an SEC-registered investment advisor. Prior approval is required for further distribution of this material. CLAconnect.com/privateclient 7 ©2014 CliftonLarsonAllen Wealth Advisors, LLC .
We believe this momentum will persist to the end of the year. Unfortunately, the U.S. stock market may have already discounted or considered some of this good news. Our economy is also the beneficiary of capital seeking a safe haven as armed conflicts increase around the world. Some of the positives and negatives on the horizon include: Positives Negatives Record corporate earnings and profitability Federal Reserve stimulus being “tapered;” QE ending Strong leading indicators in manufacturing U.S.
stocks are fairly valued to slightly overvalued Strong auto sales Corporate earnings growth is slowing Real estate prices continue to firm Geo-political risks are rising; watch Russia and Ukraine Federal budget deficits are getting smaller Deflation risks in Europe Low reported inflation U.S. energy renaissance CLAconnect.com/privateclient ©2014 CliftonLarsonAllen Wealth Advisors, LLC . Construction Adds Fuel to U.S. Economic Growth, October 2014 Market and Economic Outlook U.S. beats other large nations on growth According to The Wall Street Journal’s monthly “Economic Forecasting Survey,” economists are more optimistic about the country’s growth prospects in the next year than they are about Europe, Japan, or China. Because of an improving economy and labor picture, the Federal Reserve expects to end its bond-buying program (known as quantitative easing or QE) this October, followed by increases to the federal funds rate as soon as Spring 2015.
This is in contrast with Japan, which recently started an aggressive economic stimulus program, and Europe, which has announced its own version of quantitative easing. With the central banks in Japan and Europe stimulating and the United States continuing to pull back on its stimulus, the dollar is enjoying its longest winning streak in 17 years (when compared to a basket of foreign currencies) according to the Intercontinental Exchange U.S. Dollar Index (USDX). This has implications for domestic exporters; goods will be more expensive in foreign markets in the coming quarters as the strong dollar takes hold.
Of course, imports will be less expensive as global companies seek out markets in the stronger U.S. economy. Value of U.S. Dollar GDP Growth UUP PowerShares DB U.S.
Dollar Index Bullish Fund NYSE Global manufacturing output Purchasing Managers’ Index, seasonally adjusted — MA(50) 22.01 — MA(200) 21.62 62 U.S. dollar is appreciating relative to other major currencies. 2014 Feb Mar Apr May Jun 60 22.80 22.7 22.6 22.5 22.4 22.3 22.2 22.1 22.01 21.9 21.8 21.7 21.62 21.5 21.4 21.3 21.2 Jul Aug U.S. 58 56 54 52 50 48 46 2010 Global except U.S. 2011 2012 2013 2014 Source: J.P. Morgan Securities, Markit Economics, August 2014 Sept Source: StockCharts.com CLAconnect.com/privateclient 2 ©2014 CliftonLarsonAllen Wealth Advisors, LLC .
Construction Adds Fuel to U.S. Economic Growth, October 2014 Market and Economic Outlook Strong economic growth has a positive impact on deficit A substantial improvement in the federal budget deficit has been met with little fanfare. According to the Congressional Budget Office (CBO), deficits as a percentage of gross domestic product (GDP) hit a multi-decade high of 10 percent during the Great Recession. The last reading in 2014 showed a deficit of 2.8 percent of GDP, which is much more manageable deficit spending.
The net federal debt is still increasing, but at a slower rate. “This is a positive development for the longer run, but it is also an example of what happens when the stimulus is withdrawn,” says Tony Hallada, CEO for CliftonLarsonAllen Wealth Advisors. “In the short run, deficit spending is another form of stimulus.” The CBO and The Wall Street Journal also estimate that interest rates and government debt service were reduced significantly by the quantitative easing program. Reducing interest expense was not a stated objective of QE, but a nice side benefit nonetheless. Federal Budget Surplus/Deficit Federal Budget Net Debt (Accumulated Deficits) Percent of GDP 1990 — 2024, 2014 CBO Baseline , Percent of GDP 1940 — 2024, 2014 CBO Baseline, end of fiscal year , -12% -10% -8% -6% -4% -2% 0% 2% 4% 120% 2014: -2.8% Forecast 100% Forecast Deficit is dropping. 2024: 78.1% 80% 2014: 73.8% 60% 40% 20% ‘90 ‘95 ‘00 ‘05 ‘10 ‘15 ‘20 ‘40 ‘44 ‘48 ‘52 ‘56 ‘60 ‘64 ‘68 ‘72 ‘76 ‘80 ‘84 ‘88 ‘92 ‘96 ‘00 ‘04 ‘08 ‘12 ‘16 ‘20 ‘24 Source: U.S. Treasury, Bureau of Economic Analysis, Congressional Budget Office, St.
Louis Federal Reserve, J.P. Morgan Asset Management Source: U.S. Treasury, Bureau of Economic Analysis, Congressional Budget Office, St. Louis Federal Reserve, J.P. Morgan Asset Management 2014 Federal Budget is based on the CBO’s April 2014 Baseline Scenario.
Other spending includes, but is not limited to, health insurance subsidies, income security, and federal civilian and military retirement. Note: Years shown are fiscal years (Oct. 1 through Sept. 30).
2014 numbers are CBO estimates as of April 2014. 2014 Federal Budget is based on the CBO’s April 2014 Baseline Scenario. Other spending includes, but is not limited to, health insurance subsidies, income security, and federal civilian and military retirement. Note: Years shown are fiscal years (Oct. 1 through Sept.
30). 2014 numbers are CBO estimates as of April 2014. Guide to Markets — U.S. data are as of June 30, 2014. Guide to Markets — U.S.
data are as of June 30, 2014. CLAconnect.com/privateclient 3 ©2014 CliftonLarsonAllen Wealth Advisors, LLC . Construction Adds Fuel to U.S. Economic Growth, October 2014 Market and Economic Outlook Employment continues to improve, with some caveats Based on nonfarm payrolls, which have consistently improved since the recession, and the headline unemployment rate of 6.2 percent, there has been significant job creation. However, the broadest measure of unemployment, known as U-6 by economists, remains stubbornly high at 12.2 percent. The U-6 number represents the total unemployed, plus all marginally attached workers and those employed part-time for economic reasons. Federal Reserve Chairperson Janet Yellen is on record as saying she wants to see more improvement in this publicly overlooked measure of unemployment when deciding how quickly to remove Fed stimulus.
Without more improvement in the U-6 measure, there may be no impetus from the central bank to raise interest rates as quickly as some expect. Of course, lower interest rates are a boon for bondholders and generally for stockholders. In addition, with interest rates around the developed world even lower than the United States, we can expect capital to continue to flow into our economy to take advantage of our relatively higher interest rates, thus keeping a lid on how far the rates in the United States may ultimately rise. Civilian Unemployment Rate Employment — Total Private Payroll Seasonally adjusted Total job gain/loss thousands 600 12% 400 11% 10% 8.8 million jobs lost 200 Oct.
2009: 10% 9% 0 8% -200 7% -400 6% -600 5% May 2014: 6.3% 50-year average: 6.1% 4% 3% 9.4 million jobs gained Employment is back to pre-recession levels. -800 -1,000 ‘70 ‘80 ‘90 ‘00 ‘04 ‘10 ‘06 ‘07 ‘08 ‘09 ‘10 ‘11 ‘12 ‘13 Source: Bureau of Labor Statistics, FactSet, J.P. Morgan Asset Management Source: Bureau of Labor Statistics, FactSet, J.P. Morgan Asset Management CLAconnect.com/privateclient ‘05 4 ©2014 CliftonLarsonAllen Wealth Advisors, LLC .
Construction Adds Fuel to U.S. Economic Growth, October 2014 Market and Economic Outlook half of the year after some unexpected softening in late spring and early summer,” Skelly says. U-6 Total Unemployment (Includes marginally attached workers and total employed part time for economic reasons) Shaded areas indicate U.S. recessions We also believe the U.S. energy renaissance has legs, with power and energy leading a lot of private and nonresidential segments.
There is significant activity in oil and gas regions like North Dakota and Pennsylvania with schools, municipal services, and infrastructure build outs. 17.5 15.0 A more realistic look at unemployment, including part timers wanting full time work and discouraged workers. Skelly reports that there is some concern about labor availability as volume continues to increase and the backlog grows. Much of the trade’s labor force moved to other occupations during the recession, and the remainder of the construction workforce is aging. 12.5 10.0 “I’ve heard that there are unions that are making provisions to allow the re-employment of union retirees. That gives you an idea that the unions are trying to help contractors out,” Skelly says.
“The work is out there, but they’ve got to put the right team together to get the job done. Productivity and efficiency are key at the job site.” 7.5 5.0 1995 2000 2005 2010 Construction Employment Source: Federal Reserve Economic Data Shaded areas indicate U.S. recessions Spotlight on construction, a leading indicator The Architecture Billing Index (ABI) — a top economic indicator for nonresidential construction — leads activity by approximately 11 months.
The index can quickly change, as evidenced by the first half of 2008. However, the ABI is a decent barometer of future construction activity, especially when viewed in context with other data. 8,000 7,000 Thousands 6,000 For a deeper perspective on the construction industry, we talked to Tim Skelly, managing principal of construction and real estate for CliftonLarsonAllen LLP. Skelly’s group provides tax, audit, accounting, and consulting to construction firms nationwide, so they have a unique insight into the marketplace. He says strong activity in the industry has been primarily driven by private construction, but he is seeing greater participation by state and local governments as budgets continue to strengthen on higher tax revenues.
Commercial contractors are quite optimistic after a slow start to 2014 due to a late spring in the northern half of the country. 4,000 Construction employment is coming back. 3,000 2,000 1,000 0 “Right now the residential construction people are quite optimistic as they stage their fall previews. Contractors are confident that things will pick up in the last CLAconnect.com/privateclient 5,000 1940 1950 1960 1970 1980 1990 2000 2010 Source: Federal Reserve Economic Data 5 ©2014 CliftonLarsonAllen Wealth Advisors, LLC . Construction Adds Fuel to U.S. Economic Growth, October 2014 Market and Economic Outlook Stock market valuations appear fair, but better than alternatives The 30 percent plus rise in the U.S. stock market during 2013 appears to have stretched stock valuations to average levels going back to 1990, based on one year forward analyst earnings projections. To be fair, one year forward earnings estimates are often revised, but many market participants follow this valuation metric. S&P 500 Index: Forward P/E Ratio 26x U.S.
Equity: Valuation Measures Valuation Descriptions measure 14% 24x Historical Averages Latest 1 year ago 5-year average 10-year average 25-year average 20x 10% 18x Current: 15.6X 16x 14x S&P 500 Earnings Yield: (Inverse of forward P/E) 6.4% 12% 22x Other valuation measures show the stock market as somewhat overvalued. Compared to alternatives like cash and bonds, stocks appear more compelling, especially when you consider that there are 32 companies in the S&P 500 that pay higher dividend yields than 10-year Treasury bonds. According to Bank of America Merrill Lynch, there were only seven companies in the S&P 500 paying dividends greater than 10-year Treasury bonds during the last market peak in 2007, and only six in 2000. We are seeing significant interest in dividend-paying stocks, and income-producing securities in general, as investors seek higher cash flows than are available in savings accounts and money market funds. S&P 500 Earnings Yield Vs.
Baa Bond Yield Average: 15.6X 8% 6% 12x 4% 10x 8x ‘90 ‘92 ‘94 ‘96 ‘98 ‘00 ‘02 ‘04 ‘06 ‘08 ‘10 ‘12 ‘14 2% Moody’s Baa Yield: 4.7% ‘90 ‘92 ‘94 ‘96 ‘98 ‘00 ‘02 ‘04 ‘06 ‘08 ‘10 ‘12 ‘14 Stocks are fairly valued here, but they are a better value than bonds. P/E Price to Earnings 15.6x 13.8x 13.4x 13.8x 15.6x CAPE Shiller’s P/E 25.6 24.4 21.7 22.9 25.1 Source: Standard & Poor’s, FactSet, Robert Shiller Data, FRB, J.P. Morgan Asset Management. Div. Yield Dividend Yield 1.9% 2% 2% 2% 2.1% PEG Price/Earnings to Growth 1.5 0.8 1.1 1.7 1.4 P/B Price to Book 2.8 2.6 2.2 2.4 2.9 P/CF Price to Cash Flow 11.0 10.3 8.9 9.5 10.6 EY Spread EY Minus Baa Yield 1.7% 1.5% 2% 1.2% -0.7% Price to Earnings is price divided by consensus analyst estimates of earnings per share for the next 12 months.
Shiller’s P/E uses trailing 10-years of inflation adjusted earnings as reported by companies. Dividend Yield is calculated as the trailing 12-month average dividend divided by price. Price/Earnings to Growth Ratio is calculated as NTM P/E divided by NTM earnings growth. Price to Book Ratio is the price divided by book value per share.
Price to Cash Flow is priced divided by NTM cash flow. EY Minus Baa Yield is the forward earnings yield (consensus analyst estimates of EPS over the next 12 months divided by price) minus the Moody’s Baa seasoned corporate bond yield. *P/CF is a 20-year average due to cash flow data availability.
Latest reflects data as of June 30, 2014. Guide to the Markets — U.S. data are as of June 30, 2014. CLAconnect.com/privateclient 6 ©2014 CliftonLarsonAllen Wealth Advisors, LLC . Construction Adds Fuel to U.S. Economic Growth, October 2014 Market and Economic Outlook Trouble continues in Russia and Ukraine Geo-political hot spots dot the globe. While the human tragedy and suffering cannot be diminished, the capital markets will move when news that economic activity and company earnings are impacted. The capital markets have generally grinded upward despite the headline risks overseas.
We believe the Russia and Ukraine conflict is the one to monitor. It has the greatest potential to impact economic activity, especially in Europe. Western nations are using economic sanctions to influence Russia’s involvement in Ukraine.
An escalation in economic sanctions by Russian and western countries could crimp an already tenuous recovery in Europe and impact worldwide economic activity. Expect a market correction We still have not witnessed a 10 percent stock market correction in three years. With stock indices sitting at all time highs, a correction could develop at any time and should be expected. Corrections are a necessary event to keep valuations in check and reduce the probability of bubble formation. “With the end of the Fed’s QE program in sight, numerous geo-political concerns, and deflationary signs elsewhere around the world, we believe volatility will pick up,” says Hallada.
“However, this should not impact a long-term investor’s strategy. Where appropriate, we are diversifying our client portfolios into private real estate, where we are seeing much more compelling returns for risk assumed than in traditional stocks and bonds.” CliftonLarsonAllen Wealth Advisors, LLC Investment Committee connect@CLAconnect.com CliftonLarsonAllen Wealth Advisors, LLC (“CLA Wealth Advisors”) The purpose of this publication is purely educational and informational. It is not intended to promote any product or service and should not be relied on for accounting, legal, tax, or investment advice. The views expressed are those of CLA Wealth Advisors.
They are subject to change at any time. Past performance does not imply or guarantee future results. Investing entails risks, including possible loss of principal.
Diversification cannot assure a profit or guarantee against a loss. Investing involves other forms of risk that are not described here. For that reason, you should contact an investment professional before acting on any information in this publication. Financial information is from third party sources.
Such information is believed to be reliable but is not verified or guaranteed. Performances from any indices in this report are presented without factoring fees or charges, and are provided for reference and competitive purposes only. Any fees, charges, or holdings different than the indices will effect individual results.
Indexes are unmanaged; one cannot invest directly into an index. Investment advisory services are offered through CliftonLarsonAllen Wealth Advisors, LLC, an SEC-registered investment advisor. Prior approval is required for further distribution of this material. CLAconnect.com/privateclient 7 ©2014 CliftonLarsonAllen Wealth Advisors, LLC .


