Confident Consumers and Manufacturers; Markets Should Expect the Unexpected – April 14, 2015
CliftonLarsenAllen


Description
MARKET AND ECONOMIC
OUTLOOK
April 2015
Confident Consumers and Manufacturers; Markets Should
Expect the Unexpected
Tax Information
Find these topics of interest at
CLAconnect.com/tax:
• Life Insurance: A Retirement Strategy
With Tax Savings for High Earners
• Make Use of the Gift Tax Exemption
With Spousal Access Trusts
• You’ve Been Asked to be the Executive
for an Estate. Now What?
American consumers are finally beginning to feel the effects of the recovering economy through higher expected
income and a brighter employment outlook. Based on gross domestic product (GDP) from the last three quarters of
2014, the U.S. economy is growing at an average rate of 3.9 percent, its fastest pace since March 2004.
All signs point to the Federal Reserve moving soon to raise short-term interest rates. While economic growth overseas is decidedly less robust than here at home (think Greece and the Eurozone), there are reasons for investor optimism in Europe, and the European Central Bank (ECB) has initiated its own version of stimulus (quantitative easing). International equity markets have significantly lagged U.S. equity markets over the past two years, but we have been cautioning clients that this will most likely change and that they should stay patient with a diversified portfolio of U.S.
and international equities. This message has come home to roost in the first quarter of 2015 as the European, Asia, and Far East (EAFE) index of international stocks has significantly outperformed the S&P 500 (+4.88 percent versus +.95 percent). We believe the trend is likely to continue due to the ECB bond-buying program and recovering economies in Europe and Asia.
In addition, valuations are much more attractive than in the United States. Some positives and negatives in the economic and investment background include: Positives Negatives Improving employment Federal Reserve stimulus/quantitative easing is ending Corporate earnings and cash U.S. stocks no longer cheap Strong auto sales Strong U.S. dollar is negative for multinational U.S.
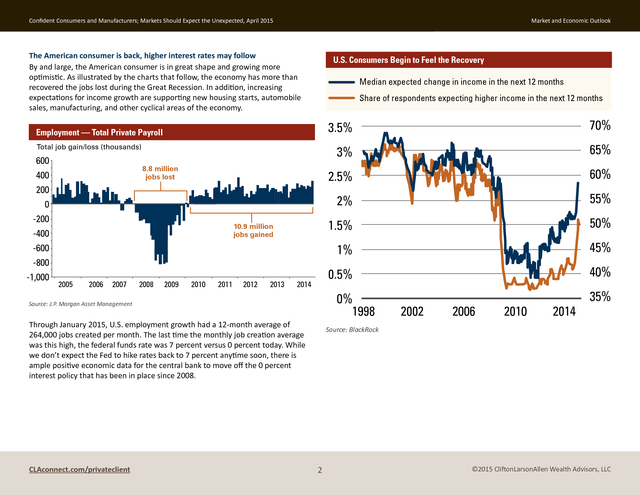
companies Firming housing prices Deflation risks outside the United States Low inflation Geopolitical risks Lower gasoline prices CLAconnect.com/privateclient ©2015 CliftonLarsonAllen Wealth Advisors, LLC . Confident Consumers and Manufacturers; Markets Should Expect the Unexpected, April 2015 Market and Economic Outlook The American consumer is back, higher interest rates may follow By and large, the American consumer is in great shape and growing more optimistic. As illustrated by the charts that follow, the economy has more than recovered the jobs lost during the Great Recession. In addition, increasing expectations for income growth are supporting new housing starts, automobile sales, manufacturing, and other cyclical areas of the economy. U.S. Consumers Begin to Feel the Recovery Median expected change in income in the next 12 months Share of respondents expecting higher income in the next 12 months 3.5% 600 400 200 0 -200 -400 -600 -800 -1,000 2006 2007 2008 2009 2010 2011 2012 2013 40% 0% 1998 Source: J.P.
Morgan Asset Management Through January 2015, U.S. employment growth had a 12-month average of 264,000 jobs created per month. The last time the monthly job creation average was this high, the federal funds rate was 7 percent versus 0 percent today.
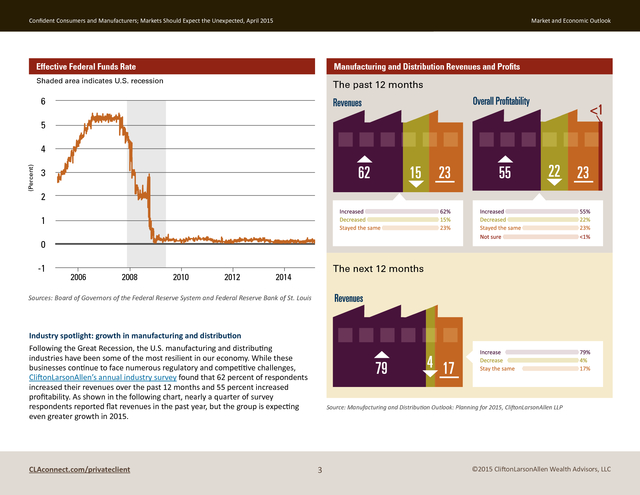
While we don’t expect the Fed to hike rates back to 7 percent anytime soon, there is ample positive economic data for the central bank to move off the 0 percent interest policy that has been in place since 2008. CLAconnect.com/privateclient 45% 0.5% 2014 50% 1% 2005 55% 1.5% 10.9 million jobs gained 60% 2% 8.8 million jobs lost 65% 2.5% Total job gain/loss (thousands) 70% 3% Employment — Total Private Payroll 2002 2006 2010 2014 35% Source: BlackRock 2 ©2015 CliftonLarsonAllen Wealth Advisors, LLC . Confident Consumers and Manufacturers; Markets Should Expect the Unexpected, April 2015 Market and Economic Outlook Effective Federal Funds Rate Manufacturing and Distribution Revenues and Profits Shaded area indicates U.S. recession The past 12 months 6 5 (Percent) 4 3 2 1 0 -1 2006 2008 2010 2012 The next 12 months 2014 Sources: Board of Governors of the Federal Reserve System and Federal Reserve Bank of St. Louis Industry spotlight: growth in manufacturing and distribution Following the Great Recession, the U.S. manufacturing and distributing industries have been some of the most resilient in our economy.
While these businesses continue to face numerous regulatory and competitive challenges, CliftonLarsonAllen’s annual industry survey found that 62 percent of respondents increased their revenues over the past 12 months and 55 percent increased profitability. As shown in the following chart, nearly a quarter of survey respondents reported flat revenues in the past year, but the group is expecting even greater growth in 2015. CLAconnect.com/privateclient Source: Manufacturing and Distribution Outlook: Planning for 2015, CliftonLarsonAllen LLP 3 ©2015 CliftonLarsonAllen Wealth Advisors, LLC . Confident Consumers and Manufacturers; Markets Should Expect the Unexpected, April 2015 Market and Economic Outlook That’s all positive news to Erik Skie, managing principal for the manufacturing and distribution industry with CLA. “We expect the growth in the industry to continue,” Skie says. “It is also encouraging to see the industry adapting to the prevailing uncertainty in our domestic and global economy.” Issues Causing the Most Concern Over the Next Two Years CLA’s annual survey had “economic and political uncertainty” topping its list of concerns for 51 percent of respondents in Erik Skie, CPA, 2012, and 46 percent in 2013. In 2014, it slipped to 36 percent Managing and has been replaced by “pricing and margin compression” Principal as the number one concern.
Skie says the survey results affirm that manufacturers have become more accepting of some uncertainty despite the significant competitive challenges that persist. “In either case, it says that manufacturers and distributors are more focused today on the business issues they can control and less on forces that are out of their hands,” Skie adds. Not surprisingly, owners and executives also indicated that their positive outlook will continue to be tested by rising health care and regulatory costs and the shortage of skilled labor. Respondents indicated they are focusing their continuous improvement efforts to offset these challenges. While the skilled labor shortage has dominated headlines, Skie sees the impending ownership and leadership transition in manufacturing as a significant issue for the industry.
An estimated 9 million of America’s 15 million business owners were born on or before 1964 and are quickly approaching retirement age. As a result, there is an estimated $11 trillion of business wealth that will soon be transferred from one generation to the next. Forty-five percent of survey respondents expect that transition to take place in one to five years, so the immediacy of the issue seems to be getting much more attention. Source: Manufactring and Distribution Outlook: Planning for 2015, CliftonLarsonAllen LLP We believe that leadership transition is a risk factor for those who have not planned or prepared for succession, and a significant acquisition growth opportunity for those with strong leadership and management teams. CLAconnect.com/privateclient 4 ©2015 CliftonLarsonAllen Wealth Advisors, LLC .
Confident Consumers and Manufacturers; Markets Should Expect the Unexpected, April 2015 Market and Economic Outlook International stocks are worth keeping With U.S. stocks handily outperforming overseas stocks (including emerging markets) over the last three years, we are seeing more client interest in reducing foreign stocks and adding to their U.S. stock exposure. This is commonly known as selling low and buying high and is not a recommended wealth creation strategy. Keep in mind that the Fed ended its bond-buying program at the end of 2014 and is poised to raise interest rates.
Stimulus is being reduced in the United States and increased significantly in Europe and Japan. History suggests superior equity returns from those countries with accommodative monetary policies and more attractive valuations. At this time, valuations in non-U.S. stocks, especially emerging market stocks, look more compelling than the United States.
This does not mean that non-U.S. stocks will immediately start to outperform domestic issues; however, valuation advantages tend to work out in favor of the patient investor. Consider real estate for safety, income, and growth Commercial real estate investments represented by the National Council of Real Estate Investment Fiduciaries (NCREIF) property index have been a mainstay of institutional investors for decades. Individual investors have been able to participate in real estate investing through publicly traded real estate investment trusts (REITs). While REITs have provided liquidity and access to the real estate sector, they have tended to move up and down with the stock market, muting their appeal.
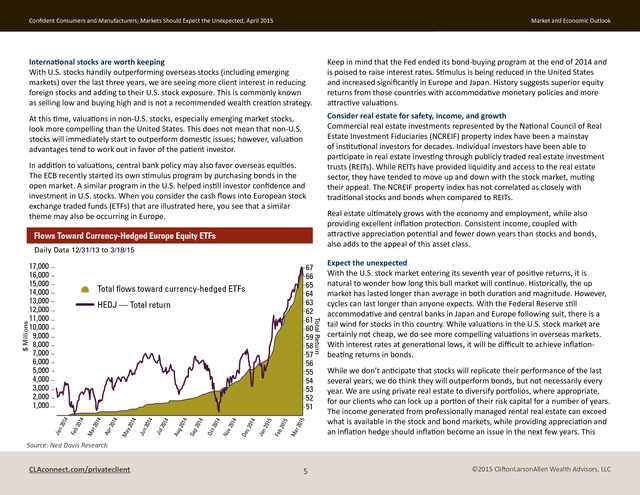
The NCREIF property index has not correlated as closely with traditional stocks and bonds when compared to REITs. In addition to valuations, central bank policy may also favor overseas equities. The ECB recently started its own stimulus program by purchasing bonds in the open market. A similar program in the U.S. helped instill investor confidence and investment in U.S.
stocks. When you consider the cash flows into European stock exchange traded funds (ETFs) that are illustrated here, you see that a similar theme may also be occurring in Europe. Real estate ultimately grows with the economy and employment, while also providing excellent inflation protection. Consistent income, coupled with attractive appreciation potential and fewer down years than stocks and bonds, also adds to the appeal of this asset class. Flows Toward Currency-Hedged Europe Equity ETFs Daily Data 12/31/13 to 3/18/15 67 66 65 64 63 62 61 60 59 58 57 56 55 54 53 52 51 Total flows toward currency-hedged ETFs 5 5 15 r 20 Ma 201 Feb 201 Jan 014 14 4 014 De c2 No v2 t 20 Oc 4 014 201 Se p g2 Au 201 Jul 201 4 Jun 014 14 r 20 Ma y2 14 Ap r 20 Ma 201 4 201 Jan Feb 4 $ Millions HEDJ — Total return Total Return 17,000 16,000 15,000 14,000 13,000 12,000 11,000 10,000 9,000 8,000 7,000 6,000 5,000 4,000 3,000 2,000 1,000 Expect the unexpected With the U.S.
stock market entering its seventh year of positive returns, it is natural to wonder how long this bull market will continue. Historically, the up market has lasted longer than average in both duration and magnitude. However, cycles can last longer than anyone expects.
With the Federal Reserve still accommodative and central banks in Japan and Europe following suit, there is a tail wind for stocks in this country. While valuations in the U.S. stock market are certainly not cheap, we do see more compelling valuations in overseas markets. With interest rates at generational lows, it will be difficult to achieve inflationbeating returns in bonds. While we don’t anticipate that stocks will replicate their performance of the last several years, we do think they will outperform bonds, but not necessarily every year.
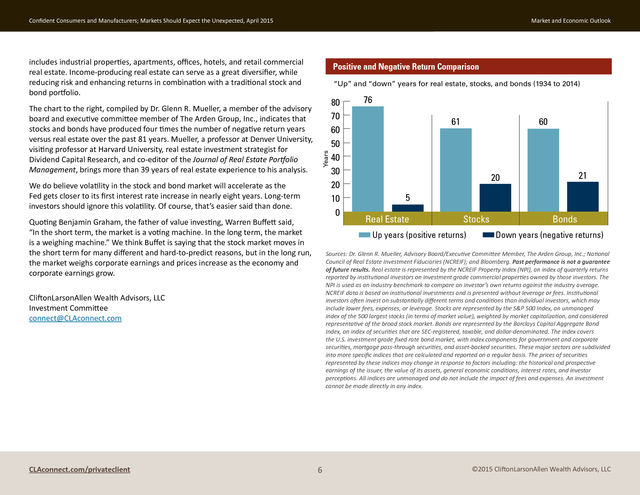
We are using private real estate to diversify portfolios, where appropriate, for our clients who can lock up a portion of their risk capital for a number of years. The income generated from professionally managed rental real estate can exceed what is available in the stock and bond markets, while providing appreciation and an inflation hedge should inflation become an issue in the next few years. This Source: Ned Davis Research CLAconnect.com/privateclient 5 ©2015 CliftonLarsonAllen Wealth Advisors, LLC . Confident Consumers and Manufacturers; Markets Should Expect the Unexpected, April 2015 Market and Economic Outlook includes industrial properties, apartments, offices, hotels, and retail commercial real estate. Income-producing real estate can serve as a great diversifier, while reducing risk and enhancing returns in combination with a traditional stock and bond portfolio. “Up” and “down” years for real estate, stocks, and bonds (1934 to 2014) Years The chart to the right, compiled by Dr. Glenn R. Mueller, a member of the advisory board and executive committee member of The Arden Group, Inc., indicates that stocks and bonds have produced four times the number of negative return years versus real estate over the past 81 years.
Mueller, a professor at Denver University, visiting professor at Harvard University, real estate investment strategist for Dividend Capital Research, and co-editor of the Journal of Real Estate Portfolio Management, brings more than 39 years of real estate experience to his analysis. Positive and Negative Return Comparison We do believe volatility in the stock and bond market will accelerate as the Fed gets closer to its first interest rate increase in nearly eight years. Long-term investors should ignore this volatility. Of course, that’s easier said than done. Quoting Benjamin Graham, the father of value investing, Warren Buffett said, “In the short term, the market is a voting machine.
In the long term, the market is a weighing machine.” We think Buffet is saying that the stock market moves in the short term for many different and hard-to-predict reasons, but in the long run, the market weighs corporate earnings and prices increase as the economy and corporate earnings grow. 76 61 60 21 20 5 Real Estate Stocks Up years (positive returns) Bonds Down years (negative returns) Sources: Dr. Glenn R. Mueller, Advisory Board/Executive Committee Member, The Arden Group, Inc.; National Council of Real Estate Investment Fiduciaries (NCREIF); and Bloomberg.
Past performance is not a guarantee of future results. Real estate is represented by the NCREIF Property Index (NPI), an index of quarterly returns reported by institutional investors on investment grade commercial properties owned by those investors. The NPI is used as an industry benchmark to compare an investor’s own returns against the industry average. NCREIF data is based on institutional investments and is presented without leverage or fees.
Institutional investors often invest on substantially different terms and conditions than individual investors, which may include lower fees, expenses, or leverage. Stocks are represented by the S&P 500 Index, an unmanaged index of the 500 largest stocks (in terms of market value), weighted by market capitalization, and considered representative of the broad stock market. Bonds are represented by the Barclays Capital Aggregate Bond Index, an index of securities that are SECâ€registered, taxable, and dollarâ€denominated.
The index covers the U.S. investment grade fixed rate bond market, with index components for government and corporate securities, mortgage passâ€through securities, and assetâ€backed securities. These major sectors are subdivided into more specific indices that are calculated and reported on a regular basis.
The prices of securities represented by these indices may change in response to factors including: the historical and prospective earnings of the issuer, the value of its assets, general economic conditions, interest rates, and investor perceptions. All indices are unmanaged and do not include the impact of fees and expenses. An investment cannot be made directly in any index. CliftonLarsonAllen Wealth Advisors, LLC Investment Committee connect@CLAconnect.com CLAconnect.com/privateclient 80 70 60 50 40 30 20 10 0 6 ©2015 CliftonLarsonAllen Wealth Advisors, LLC .
Confident Consumers and Manufacturers; Markets Should Expect the Unexpected, April 2015 Market and Economic Outlook CliftonLarsonAllen Wealth Advisors, LLC (“CLA Wealth Advisors”) The purpose of this publication is purely educational and informational. It is not intended to promote any product or service and should not be relied on for accounting, legal, tax, or investment advice. The views expressed are those of CLA Wealth Advisors. They are subject to change at any time. Past performance does not imply or guarantee future results.
Investing entails risks, including possible loss of principal. Diversification cannot assure a profit or guarantee against a loss. Investing involves other forms of risk that are not described here.
For that reason, you should contact an investment professional before acting on any information in this publication. Financial information is from third party sources. Such information is believed to be reliable but is not verified or guaranteed. Performances from any indices in this report are presented without factoring fees or charges, and are provided for reference and competitive purposes only.
Any fees, charges, or holdings different than the indices will effect individual results. Indexes are unmanaged; one cannot invest directly into an index. Investment advisory services are offered through CliftonLarsonAllen Wealth Advisors, LLC, an SEC-registered investment advisor. Prior approval is required for further distribution of this material. CLAconnect.com/privateclient 7 ©2015 CliftonLarsonAllen Wealth Advisors, LLC .
All signs point to the Federal Reserve moving soon to raise short-term interest rates. While economic growth overseas is decidedly less robust than here at home (think Greece and the Eurozone), there are reasons for investor optimism in Europe, and the European Central Bank (ECB) has initiated its own version of stimulus (quantitative easing). International equity markets have significantly lagged U.S. equity markets over the past two years, but we have been cautioning clients that this will most likely change and that they should stay patient with a diversified portfolio of U.S.
and international equities. This message has come home to roost in the first quarter of 2015 as the European, Asia, and Far East (EAFE) index of international stocks has significantly outperformed the S&P 500 (+4.88 percent versus +.95 percent). We believe the trend is likely to continue due to the ECB bond-buying program and recovering economies in Europe and Asia.
In addition, valuations are much more attractive than in the United States. Some positives and negatives in the economic and investment background include: Positives Negatives Improving employment Federal Reserve stimulus/quantitative easing is ending Corporate earnings and cash U.S. stocks no longer cheap Strong auto sales Strong U.S. dollar is negative for multinational U.S.
companies Firming housing prices Deflation risks outside the United States Low inflation Geopolitical risks Lower gasoline prices CLAconnect.com/privateclient ©2015 CliftonLarsonAllen Wealth Advisors, LLC . Confident Consumers and Manufacturers; Markets Should Expect the Unexpected, April 2015 Market and Economic Outlook The American consumer is back, higher interest rates may follow By and large, the American consumer is in great shape and growing more optimistic. As illustrated by the charts that follow, the economy has more than recovered the jobs lost during the Great Recession. In addition, increasing expectations for income growth are supporting new housing starts, automobile sales, manufacturing, and other cyclical areas of the economy. U.S. Consumers Begin to Feel the Recovery Median expected change in income in the next 12 months Share of respondents expecting higher income in the next 12 months 3.5% 600 400 200 0 -200 -400 -600 -800 -1,000 2006 2007 2008 2009 2010 2011 2012 2013 40% 0% 1998 Source: J.P.
Morgan Asset Management Through January 2015, U.S. employment growth had a 12-month average of 264,000 jobs created per month. The last time the monthly job creation average was this high, the federal funds rate was 7 percent versus 0 percent today.
While we don’t expect the Fed to hike rates back to 7 percent anytime soon, there is ample positive economic data for the central bank to move off the 0 percent interest policy that has been in place since 2008. CLAconnect.com/privateclient 45% 0.5% 2014 50% 1% 2005 55% 1.5% 10.9 million jobs gained 60% 2% 8.8 million jobs lost 65% 2.5% Total job gain/loss (thousands) 70% 3% Employment — Total Private Payroll 2002 2006 2010 2014 35% Source: BlackRock 2 ©2015 CliftonLarsonAllen Wealth Advisors, LLC . Confident Consumers and Manufacturers; Markets Should Expect the Unexpected, April 2015 Market and Economic Outlook Effective Federal Funds Rate Manufacturing and Distribution Revenues and Profits Shaded area indicates U.S. recession The past 12 months 6 5 (Percent) 4 3 2 1 0 -1 2006 2008 2010 2012 The next 12 months 2014 Sources: Board of Governors of the Federal Reserve System and Federal Reserve Bank of St. Louis Industry spotlight: growth in manufacturing and distribution Following the Great Recession, the U.S. manufacturing and distributing industries have been some of the most resilient in our economy.
While these businesses continue to face numerous regulatory and competitive challenges, CliftonLarsonAllen’s annual industry survey found that 62 percent of respondents increased their revenues over the past 12 months and 55 percent increased profitability. As shown in the following chart, nearly a quarter of survey respondents reported flat revenues in the past year, but the group is expecting even greater growth in 2015. CLAconnect.com/privateclient Source: Manufacturing and Distribution Outlook: Planning for 2015, CliftonLarsonAllen LLP 3 ©2015 CliftonLarsonAllen Wealth Advisors, LLC . Confident Consumers and Manufacturers; Markets Should Expect the Unexpected, April 2015 Market and Economic Outlook That’s all positive news to Erik Skie, managing principal for the manufacturing and distribution industry with CLA. “We expect the growth in the industry to continue,” Skie says. “It is also encouraging to see the industry adapting to the prevailing uncertainty in our domestic and global economy.” Issues Causing the Most Concern Over the Next Two Years CLA’s annual survey had “economic and political uncertainty” topping its list of concerns for 51 percent of respondents in Erik Skie, CPA, 2012, and 46 percent in 2013. In 2014, it slipped to 36 percent Managing and has been replaced by “pricing and margin compression” Principal as the number one concern.
Skie says the survey results affirm that manufacturers have become more accepting of some uncertainty despite the significant competitive challenges that persist. “In either case, it says that manufacturers and distributors are more focused today on the business issues they can control and less on forces that are out of their hands,” Skie adds. Not surprisingly, owners and executives also indicated that their positive outlook will continue to be tested by rising health care and regulatory costs and the shortage of skilled labor. Respondents indicated they are focusing their continuous improvement efforts to offset these challenges. While the skilled labor shortage has dominated headlines, Skie sees the impending ownership and leadership transition in manufacturing as a significant issue for the industry.
An estimated 9 million of America’s 15 million business owners were born on or before 1964 and are quickly approaching retirement age. As a result, there is an estimated $11 trillion of business wealth that will soon be transferred from one generation to the next. Forty-five percent of survey respondents expect that transition to take place in one to five years, so the immediacy of the issue seems to be getting much more attention. Source: Manufactring and Distribution Outlook: Planning for 2015, CliftonLarsonAllen LLP We believe that leadership transition is a risk factor for those who have not planned or prepared for succession, and a significant acquisition growth opportunity for those with strong leadership and management teams. CLAconnect.com/privateclient 4 ©2015 CliftonLarsonAllen Wealth Advisors, LLC .
Confident Consumers and Manufacturers; Markets Should Expect the Unexpected, April 2015 Market and Economic Outlook International stocks are worth keeping With U.S. stocks handily outperforming overseas stocks (including emerging markets) over the last three years, we are seeing more client interest in reducing foreign stocks and adding to their U.S. stock exposure. This is commonly known as selling low and buying high and is not a recommended wealth creation strategy. Keep in mind that the Fed ended its bond-buying program at the end of 2014 and is poised to raise interest rates.
Stimulus is being reduced in the United States and increased significantly in Europe and Japan. History suggests superior equity returns from those countries with accommodative monetary policies and more attractive valuations. At this time, valuations in non-U.S. stocks, especially emerging market stocks, look more compelling than the United States.
This does not mean that non-U.S. stocks will immediately start to outperform domestic issues; however, valuation advantages tend to work out in favor of the patient investor. Consider real estate for safety, income, and growth Commercial real estate investments represented by the National Council of Real Estate Investment Fiduciaries (NCREIF) property index have been a mainstay of institutional investors for decades. Individual investors have been able to participate in real estate investing through publicly traded real estate investment trusts (REITs). While REITs have provided liquidity and access to the real estate sector, they have tended to move up and down with the stock market, muting their appeal.
The NCREIF property index has not correlated as closely with traditional stocks and bonds when compared to REITs. In addition to valuations, central bank policy may also favor overseas equities. The ECB recently started its own stimulus program by purchasing bonds in the open market. A similar program in the U.S. helped instill investor confidence and investment in U.S.
stocks. When you consider the cash flows into European stock exchange traded funds (ETFs) that are illustrated here, you see that a similar theme may also be occurring in Europe. Real estate ultimately grows with the economy and employment, while also providing excellent inflation protection. Consistent income, coupled with attractive appreciation potential and fewer down years than stocks and bonds, also adds to the appeal of this asset class. Flows Toward Currency-Hedged Europe Equity ETFs Daily Data 12/31/13 to 3/18/15 67 66 65 64 63 62 61 60 59 58 57 56 55 54 53 52 51 Total flows toward currency-hedged ETFs 5 5 15 r 20 Ma 201 Feb 201 Jan 014 14 4 014 De c2 No v2 t 20 Oc 4 014 201 Se p g2 Au 201 Jul 201 4 Jun 014 14 r 20 Ma y2 14 Ap r 20 Ma 201 4 201 Jan Feb 4 $ Millions HEDJ — Total return Total Return 17,000 16,000 15,000 14,000 13,000 12,000 11,000 10,000 9,000 8,000 7,000 6,000 5,000 4,000 3,000 2,000 1,000 Expect the unexpected With the U.S.
stock market entering its seventh year of positive returns, it is natural to wonder how long this bull market will continue. Historically, the up market has lasted longer than average in both duration and magnitude. However, cycles can last longer than anyone expects.
With the Federal Reserve still accommodative and central banks in Japan and Europe following suit, there is a tail wind for stocks in this country. While valuations in the U.S. stock market are certainly not cheap, we do see more compelling valuations in overseas markets. With interest rates at generational lows, it will be difficult to achieve inflationbeating returns in bonds. While we don’t anticipate that stocks will replicate their performance of the last several years, we do think they will outperform bonds, but not necessarily every year.
We are using private real estate to diversify portfolios, where appropriate, for our clients who can lock up a portion of their risk capital for a number of years. The income generated from professionally managed rental real estate can exceed what is available in the stock and bond markets, while providing appreciation and an inflation hedge should inflation become an issue in the next few years. This Source: Ned Davis Research CLAconnect.com/privateclient 5 ©2015 CliftonLarsonAllen Wealth Advisors, LLC . Confident Consumers and Manufacturers; Markets Should Expect the Unexpected, April 2015 Market and Economic Outlook includes industrial properties, apartments, offices, hotels, and retail commercial real estate. Income-producing real estate can serve as a great diversifier, while reducing risk and enhancing returns in combination with a traditional stock and bond portfolio. “Up” and “down” years for real estate, stocks, and bonds (1934 to 2014) Years The chart to the right, compiled by Dr. Glenn R. Mueller, a member of the advisory board and executive committee member of The Arden Group, Inc., indicates that stocks and bonds have produced four times the number of negative return years versus real estate over the past 81 years.
Mueller, a professor at Denver University, visiting professor at Harvard University, real estate investment strategist for Dividend Capital Research, and co-editor of the Journal of Real Estate Portfolio Management, brings more than 39 years of real estate experience to his analysis. Positive and Negative Return Comparison We do believe volatility in the stock and bond market will accelerate as the Fed gets closer to its first interest rate increase in nearly eight years. Long-term investors should ignore this volatility. Of course, that’s easier said than done. Quoting Benjamin Graham, the father of value investing, Warren Buffett said, “In the short term, the market is a voting machine.
In the long term, the market is a weighing machine.” We think Buffet is saying that the stock market moves in the short term for many different and hard-to-predict reasons, but in the long run, the market weighs corporate earnings and prices increase as the economy and corporate earnings grow. 76 61 60 21 20 5 Real Estate Stocks Up years (positive returns) Bonds Down years (negative returns) Sources: Dr. Glenn R. Mueller, Advisory Board/Executive Committee Member, The Arden Group, Inc.; National Council of Real Estate Investment Fiduciaries (NCREIF); and Bloomberg.
Past performance is not a guarantee of future results. Real estate is represented by the NCREIF Property Index (NPI), an index of quarterly returns reported by institutional investors on investment grade commercial properties owned by those investors. The NPI is used as an industry benchmark to compare an investor’s own returns against the industry average. NCREIF data is based on institutional investments and is presented without leverage or fees.
Institutional investors often invest on substantially different terms and conditions than individual investors, which may include lower fees, expenses, or leverage. Stocks are represented by the S&P 500 Index, an unmanaged index of the 500 largest stocks (in terms of market value), weighted by market capitalization, and considered representative of the broad stock market. Bonds are represented by the Barclays Capital Aggregate Bond Index, an index of securities that are SECâ€registered, taxable, and dollarâ€denominated.
The index covers the U.S. investment grade fixed rate bond market, with index components for government and corporate securities, mortgage passâ€through securities, and assetâ€backed securities. These major sectors are subdivided into more specific indices that are calculated and reported on a regular basis.
The prices of securities represented by these indices may change in response to factors including: the historical and prospective earnings of the issuer, the value of its assets, general economic conditions, interest rates, and investor perceptions. All indices are unmanaged and do not include the impact of fees and expenses. An investment cannot be made directly in any index. CliftonLarsonAllen Wealth Advisors, LLC Investment Committee connect@CLAconnect.com CLAconnect.com/privateclient 80 70 60 50 40 30 20 10 0 6 ©2015 CliftonLarsonAllen Wealth Advisors, LLC .
Confident Consumers and Manufacturers; Markets Should Expect the Unexpected, April 2015 Market and Economic Outlook CliftonLarsonAllen Wealth Advisors, LLC (“CLA Wealth Advisors”) The purpose of this publication is purely educational and informational. It is not intended to promote any product or service and should not be relied on for accounting, legal, tax, or investment advice. The views expressed are those of CLA Wealth Advisors. They are subject to change at any time. Past performance does not imply or guarantee future results.
Investing entails risks, including possible loss of principal. Diversification cannot assure a profit or guarantee against a loss. Investing involves other forms of risk that are not described here.
For that reason, you should contact an investment professional before acting on any information in this publication. Financial information is from third party sources. Such information is believed to be reliable but is not verified or guaranteed. Performances from any indices in this report are presented without factoring fees or charges, and are provided for reference and competitive purposes only.
Any fees, charges, or holdings different than the indices will effect individual results. Indexes are unmanaged; one cannot invest directly into an index. Investment advisory services are offered through CliftonLarsonAllen Wealth Advisors, LLC, an SEC-registered investment advisor. Prior approval is required for further distribution of this material. CLAconnect.com/privateclient 7 ©2015 CliftonLarsonAllen Wealth Advisors, LLC .


