Cheap Oil, Booming Auto Sales, Volatility, and Why Diversification Matters – January 20, 2015
CliftonLarsenAllen


Description
MARKET AND ECONOMIC
OUTLOOK
January 2015
Cheap Oil, Booming Auto Sales, Volatility,
and Why Diversification Matters
Tax Information
Find these topics of interest at
CLAconnect.com/tax:
• Plan Ahead: Key Information
for 2015 Tax Year
• Tax-Smart Tips for Handling
your IRA and Estate Plan
• New Legislation Extends Tax
Provisions for Businesses
and Individuals
Few predicted two surprises that emerged during 2014: lower interest rates and falling oil and gasoline prices. Both
contributed to robust U.S. economic growth touching 5 percent in the third quarter of 2014. Of course, firming
employment and stability in housing prices also led to increasing consumer confidence, and that ultimately put growth
on a higher course.
We believe the momentum will persist into the new year as the cascading effect of lower energy costs acts as another level of support for consumers and businesses. The effect of lower energy costs is a net positive for our economy, but maybe not as big as many think. Domestic oil production has ramped up significantly in the past five years due to technology breakthroughs, so the growing energy sector will feel the effects. Overall, the investment picture was decidedly mixed in 2014, with U.S. large stocks and bonds putting in solid returns, while small stocks, overseas stocks, and commodities were mostly negative to flat. Some positives and negatives in the economic and investment background include: Positives Negatives Record corporate earnings Federal Reserve stimulus/QE ending Strong auto sales U.S.
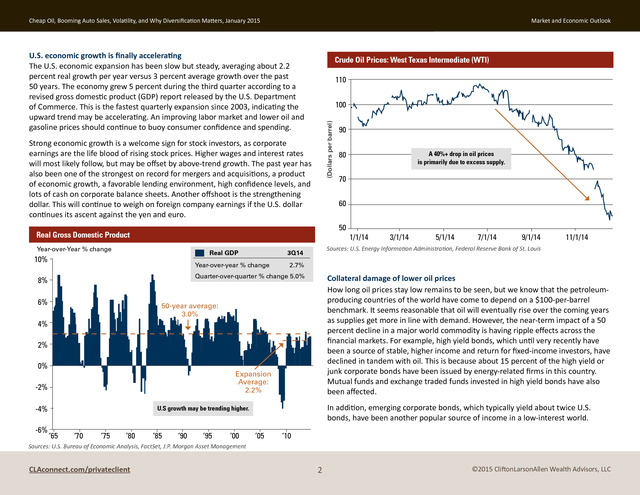
stocks no longer cheap Firming housing prices Corporate earnings growth is slowing Benign inflation Deflation risks outside the United States Improving employment Geopolitical risks Lower gasoline prices CLAconnect.com/privateclient ©2015 CliftonLarsonAllen Wealth Advisors, LLC . Cheap Oil, Booming Auto Sales, Volatility, and Why Diversification Matters, January 2015 Market and Economic Outlook U.S. economic growth is finally accelerating The U.S. economic expansion has been slow but steady, averaging about 2.2 percent real growth per year versus 3 percent average growth over the past 50 years. The economy grew 5 percent during the third quarter according to a revised gross domestic product (GDP) report released by the U.S.
Department of Commerce. This is the fastest quarterly expansion since 2003, indicating the upward trend may be accelerating. An improving labor market and lower oil and gasoline prices should continue to buoy consumer confidence and spending. Crude Oil Prices: West Texas Intermediate (WTI) 110 (Dollars per barrel) 100 Strong economic growth is a welcome sign for stock investors, as corporate earnings are the life blood of rising stock prices.
Higher wages and interest rates will most likely follow, but may be offset by above-trend growth. The past year has also been one of the strongest on record for mergers and acquisitions, a product of economic growth, a favorable lending environment, high confidence levels, and lots of cash on corporate balance sheets. Another offshoot is the strengthening dollar.
This will continue to weigh on foreign company earnings if the U.S. dollar continues its ascent against the yen and euro. Real GDP 10% 4% 2% Expansion Average: 2.2% -2% -6% ‘70 ‘75 ‘80 ‘85 ‘90 ‘95 ‘00 7/1/14 9/1/14 11/1/14 In addition, emerging corporate bonds, which typically yield about twice U.S. bonds, have been another popular source of income in a low-interest world. U.S growth may be trending higher. ‘65 5/1/14 Collateral damage of lower oil prices How long oil prices stay low remains to be seen, but we know that the petroleumproducing countries of the world have come to depend on a $100-per-barrel benchmark. It seems reasonable that oil will eventually rise over the coming years as supplies get more in line with demand.
However, the near-term impact of a 50 percent decline in a major world commodity is having ripple effects across the financial markets. For example, high yield bonds, which until very recently have been a source of stable, higher income and return for fixed-income investors, have declined in tandem with oil. This is because about 15 percent of the high yield or junk corporate bonds have been issued by energy-related firms in this country. Mutual funds and exchange traded funds invested in high yield bonds have also been affected. 50-year average: 3.0% 0% 3/1/14 2.7% Quarter-over-quarter % change 5.0% 8% 1/1/14 Sources: U.S.
Energy Information Administration, Federal Reserve Bank of St. Louis 3Q14 Year-over-year % change A 40%+ drop in oil prices is primarily due to excess supply. 70 50 Year-over-Year % change -4% 80 60 Real Gross Domestic Product 6% 90 ‘05 ‘10 Sources: U.S. Bureau of Economic Analysis, FactSet, J.P.
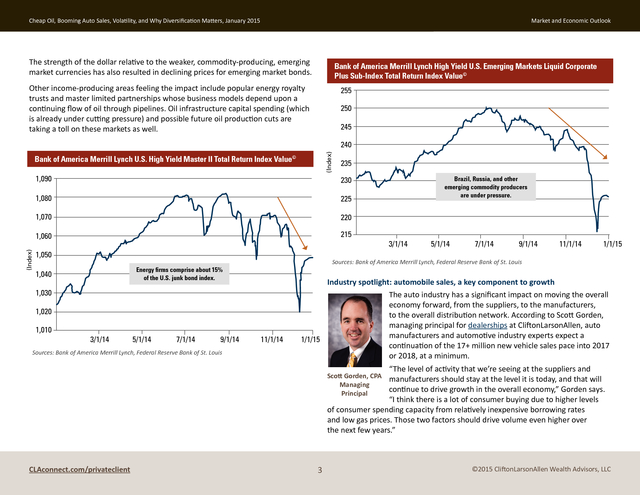
Morgan Asset Management CLAconnect.com/privateclient 2 ©2015 CliftonLarsonAllen Wealth Advisors, LLC . Cheap Oil, Booming Auto Sales, Volatility, and Why Diversification Matters, January 2015 Market and Economic Outlook The strength of the dollar relative to the weaker, commodity-producing, emerging market currencies has also resulted in declining prices for emerging market bonds. Bank of America Merrill Lynch High Yield U.S. Emerging Markets Liquid Corporate Plus Sub-Index Total Return Index Value© Other income-producing areas feeling the impact include popular energy royalty trusts and master limited partnerships whose business models depend upon a continuing flow of oil through pipelines. Oil infrastructure capital spending (which is already under cutting pressure) and possible future oil production cuts are taking a toll on these markets as well. 255 250 245 (Index) 240 Bank of America Merrill Lynch U.S. High Yield Master II Total Return Index Value© 235 230 1,080 225 1,070 220 1,060 (Index) 1,090 215 1,050 1,030 1,020 1,010 3/1/14 5/1/14 7/1/14 9/1/14 Sources: Bank of America Merrill Lynch, Federal Reserve Bank of St.
Louis 3/1/14 5/1/14 7/1/14 9/1/14 11/1/14 1/1/15 Sources: Bank of America Merrill Lynch, Federal Reserve Bank of St. Louis Energy firms comprise about 15% of the U.S. junk bond index. 1,040 Brazil, Russia, and other emerging commodity producers are under pressure. 11/1/14 Industry spotlight: automobile sales, a key component to growth The auto industry has a significant impact on moving the overall economy forward, from the suppliers, to the manufacturers, to the overall distribution network.
According to Scott Gorden, managing principal for dealerships at CliftonLarsonAllen, auto manufacturers and automotive industry experts expect a 1/1/15 continuation of the 17+ million new vehicle sales pace into 2017 or 2018, at a minimum. “The level of activity that we’re seeing at the suppliers and manufacturers should stay at the level it is today, and that will continue to drive growth in the overall economy,” Gorden says. “I think there is a lot of consumer buying due to higher levels of consumer spending capacity from relatively inexpensive borrowing rates and low gas prices. Those two factors should drive volume even higher over the next few years.” Scott Gorden, CPA Managing Principal CLAconnect.com/privateclient 3 ©2015 CliftonLarsonAllen Wealth Advisors, LLC . Cheap Oil, Booming Auto Sales, Volatility, and Why Diversification Matters, January 2015 Market and Economic Outlook Don’t chase an arbitrary benchmark: focus on your investment strategy With the S&P 500 and Dow Jones Industrial averages hitting all-time highs, we are receiving inquiries about putting more money in these “winning” areas of the market. As the “Why Diversification Matters” chart illustrates, U.S. large stocks and real estate were the leaders for 2014. However, the chart also shows that the annual investment category winners tend to vary with no known correlation.
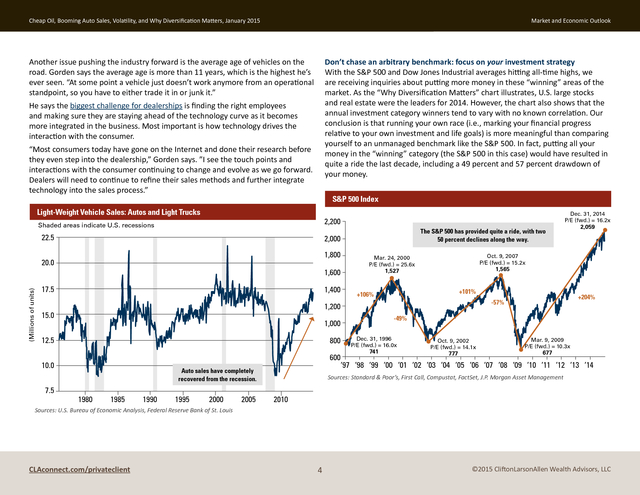
Our conclusion is that running your own race (i.e., marking your financial progress relative to your own investment and life goals) is more meaningful than comparing yourself to an unmanaged benchmark like the S&P 500. In fact, putting all your money in the “winning” category (the S&P 500 in this case) would have resulted in quite a ride the last decade, including a 49 percent and 57 percent drawdown of your money. Another issue pushing the industry forward is the average age of vehicles on the road. Gorden says the average age is more than 11 years, which is the highest he’s ever seen.
“At some point a vehicle just doesn’t work anymore from an operational standpoint, so you have to either trade it in or junk it.” He says the biggest challenge for dealerships is finding the right employees and making sure they are staying ahead of the technology curve as it becomes more integrated in the business. Most important is how technology drives the interaction with the consumer. “Most consumers today have gone on the Internet and done their research before they even step into the dealership,” Gorden says. ”I see the touch points and interactions with the consumer continuing to change and evolve as we go forward. Dealers will need to continue to refine their sales methods and further integrate technology into the sales process.” S&P 500 Index Light-Weight Vehicle Sales: Autos and Light Trucks 2,200 Shaded areas indicate U.S.
recessions 22.5 1,800 20.0 (Millions of units) The S&P 500 has provided quite a ride, with two 50 percent declines along the way. 2,000 1,600 17.5 1,400 Oct. 9, 2007 P/E (fwd.) = 15.2x 1,565 Mar. 24, 2000 P/E (fwd.) = 25.6x 1,527 +101% +106% 1,000 +204% -57% 1,200 15.0 Dec.
31, 2014 P/E (fwd.) = 16.2x 2,059 -49% 12.5 800 10.0 600 ‘97 ‘98 ‘99 ‘00 ‘01 ‘02 ‘03 ‘04 ‘05 ‘06 ‘07 ‘08 ‘09 ‘10 ‘11 ‘12 ‘13 ‘14 7.5 Auto sales have completely recovered from the recession. 1980 1985 1990 1995 2000 2005 Dec. 31, 1996 P/E (fwd.) = 16.0x 741 Oct. 9, 2002 P/E (fwd.) = 14.1x 777 Mar.
9, 2009 P/E (fwd.) = 10.3x 677 Sources: Standard & Poor’s, First Call, Compustat, FactSet, J.P. Morgan Asset Management 2010 Sources: U.S. Bureau of Economic Analysis, Federal Reserve Bank of St.
Louis CLAconnect.com/privateclient 4 ©2015 CliftonLarsonAllen Wealth Advisors, LLC . Cheap Oil, Booming Auto Sales, Volatility, and Why Diversification Matters, January 2015 Market and Economic Outlook Why Diversification Matters 2004 2005 2006 2007 2008 2009 2010 2011 2012 2013 2014 31.2% 31.5% 35.5% 30.4% 11.4% 58.7% 26.9% 7.8% 18.9% 38.8% 27.2% 20.3% 13.5% 26.3% 11.2% 5.2% 58.2% 26.9% 6.6% 17.9% 33.5% 13.7% 18.3% 12.6% 25.6% 8.8% Asset Alloc. -21.7% 37.4% 26.6% 6.1% 17.3% 32.3% 9.8% 16.5% 9.6% 18.4% Asset Alloc. 8.5% -26.2% 31.8% 15.1% 5.0% 16.4% 22.8% 6.0% 13.2% Asset Alloc. 7.7% 15.8% 8.0% -33.8% 30.8% 15.1% 2.1% 16.0% Asset Alloc. 14.6% Asset Alloc. 5.5% 11.1% 4.9% Asset Alloc. 13.9% 7.0% -36.2% 27.2% 11.7% Asset Alloc. 0.0% 15.8% 7.4% 4.9% 10.9% 4.6% 11.9% 5.5% -37.0% 26.5% Asset Alloc. 11.6% -1.7% 13.9% 1.8% 2.6% Asset Alloc. 10.6% 2.7% 10.3% 1.9% -40.1% Asset Alloc. 22.2% 7.8% -4.2% Asset Alloc. 11.3% -1.3% 2.5% 4.3% 2.4% 4.3% -1.6% -43.4% 5.9% 6.5% -12.1% 4.2% -2.0% -2.2% 2.0% 1.6% 3.5% -18.2% -47.3% -1.4% 5.3% -14.9% 1.7% -2.6% -4.9% The asset allocation or diversified portfolio keeps investors on their plans. Sources: Morningstar, BlackRock U.S. Large Cap = S&P 500 Index measuring the performance of large capitalization U.S. stocks Real Estate = Dow Jones U.S. Real Estate Index measuring the performance of the real estate sector of the U.S.
equity market U.S. Mid Cap = S&P 400 MidCap Index measuring the performance of 400 medium capitalization U.S. stocks Treasuries = Barclays Capital U.S.
Intermediate Treasury Index measuring the performance of intermediate maturity treasuries U.S. Small Cap = Russell 2000 Index measuring the performance of small capitalization U.S. stocks High Yield = Barclays Corporate High Yield Index measuring the performance of bonds rated below investment grade Foreign Equity = MSCI EAFE Index measuring the performance of the developed stock markets of Europe, Australia, Asia, and Far East Emerging Markets = MSCI Emerging Market Index measuring the performance of diversified undeveloped markets in U.S.
currency Fixed Income = Barclays Capital U.S. Aggregate Index measuring the performance of U.S. government, corporate, and mortgage backed securities with maturities of up to 30 years Asset Allocation = Blend of benchmarks comprised of Barclays U.S. Agg 40%, S&P 500 25.2%, MSCI EAFE 14.4%, Russell 2000 10.8%, and MSCI Emerging Markets 9.6% All data are based on Morningstar and Bloomberg reports and represent total return for stated period.
Indexes are unmanaged; one cannot invest directly in an index. Diversification does not guarantee investment results and does not eliminate the risk of loss. International investing involves a greater degree of risk and increased volatility due to such factors as fluctuations in currency exchange rates, differences in accounting and taxation policies; some overseas markets may not be as politically and economically stable as the United States and other nations.
Small company stocks may be subject to a higher degree of market risk than securities of more established companies because they tend to be more volatile and less liquid. Past performance is not an indication of future results. Investing in securities involves risk; you may lose money including the principal amount invested.
Data as of 12/31/2014. For illustrative purposes only. CLAconnect.com/privateclient 5 ©2015 CliftonLarsonAllen Wealth Advisors, LLC . Cheap Oil, Booming Auto Sales, Volatility, and Why Diversification Matters, January 2015 Market and Economic Outlook Be an investor, not a speculator The best way to run your own race is to be an investor, not a speculator. Investors seek to reduce risk while maximizing returns prudently through diversification. In the absence of a perfect investment view, a well-constructed portfolio is built to withstand multiple risks that, if not addressed, could dramatically impact your personal financial plan. The best way to reduce risk is to diversify. The “Why Diversification Matters” chart shows that a diversified portfolio is consistently in the middle of the results — not the best, nor the worst. This helps keep investors on their personal financial plans.
In fact, a study by Dalbar Inc. that utilizes the net of the aggregate mutual fund sales, redemptions, and exchanges each month as a measure of investor behavior, showed that for the 20-year period ending in 2013, investors averaged a 2.5 percent return annually — well below bonds (5.7 percent annually) and the S&P 500 (9.2 percent annually). Obstacles to successful investing As humans, we have numerous cognitive biases that hamper successful investing, including (but not limited to) overconfidence, confirmation bias, bandwagon effect, and anchoring, which are in full display in the Dalbar investor results. Burton Malkiel, renowned Princeton University professor and author of A Random Walk Down Wall Street, says, “I’ve never known anybody who can time the market. I’ve never known anybody who knows anybody who can consistently time the market.” It is easy for investors to suddenly become undisciplined when markets become “narrow.” But here is a history lesson: In 1998 and 1999, the only sector that performed well was technology stocks.
Record levels of money flowed into technology stocks in late 1999 and early 2000, only to witness one of the greatest bear market corrections in an asset class in market history. From 2000 to 2002, the NASDAQ went on a three-year, 70 percent decline. Today, with the S&P 500 hitting all-time highs, investors are focused on the narrow part of the market that has worked the best in the past two years.
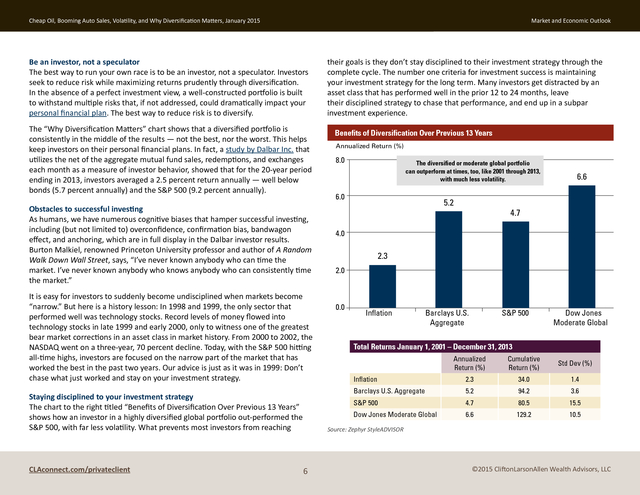
Our advice is just as it was in 1999: Don’t chase what just worked and stay on your investment strategy. Benefits of Diversification Over Previous 13 Years Annualized Return (%) 8.0 The diversified or moderate global portfolio can outperform at times, too, like 2001 through 2013, with much less volatility. 6.0 5.2 6.6 4.7 4.0 2.3 2.0 0.0 Inflation Barclays U.S. Aggregate S&P 500 Dow Jones Moderate Global Total Returns January 1, 2001 – December 31, 2013 Annualized Return (%) Cumulative Return (%) Std Dev (%) Inflation 2.3 34.0 1.4 Barclays U.S. Aggregate 5.2 94.2 3.6 S&P 500 4.7 80.5 15.5 Dow Jones Moderate Global Staying disciplined to your investment strategy The chart to the right titled “Benefits of Diversification Over Previous 13 Years” shows how an investor in a highly diversified global portfolio out-performed the S&P 500, with far less volatility. What prevents most investors from reaching CLAconnect.com/privateclient their goals is they don’t stay disciplined to their investment strategy through the complete cycle.
The number one criteria for investment success is maintaining your investment strategy for the long term. Many investors get distracted by an asset class that has performed well in the prior 12 to 24 months, leave their disciplined strategy to chase that performance, and end up in a subpar investment experience. 6.6 129.2 10.5 Source: Zephyr StyleADVISOR 6 ©2015 CliftonLarsonAllen Wealth Advisors, LLC . Cheap Oil, Booming Auto Sales, Volatility, and Why Diversification Matters, January 2015 Market and Economic Outlook Diversification is not a panacea The price for hedging multiple risks means you will own investments that don’t do well in any one year. For 2014, owning emerging market and other international stocks has been disappointing. However, as history shows, these areas of the market will have their day in the sun too, we just don’t know when. History also shows us that buying stocks during periods of above-average valuations leads to lower-than-average returns.
For example, selling international stocks at lower valuations and buying U.S. blue chips at relatively higher valuations is counterproductive in the long term, even though you may be in sync with the current trend. It is generally better to think long term in the markets.
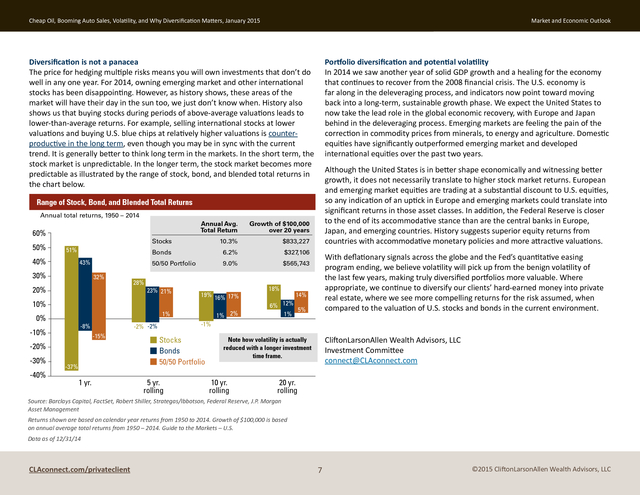
In the short term, the stock market is unpredictable. In the longer term, the stock market becomes more predictable as illustrated by the range of stock, bond, and blended total returns in the chart below. Portfolio diversification and potential volatility In 2014 we saw another year of solid GDP growth and a healing for the economy that continues to recover from the 2008 financial crisis. The U.S.
economy is far along in the deleveraging process, and indicators now point toward moving back into a long-term, sustainable growth phase. We expect the United States to now take the lead role in the global economic recovery, with Europe and Japan behind in the deleveraging process. Emerging markets are feeling the pain of the correction in commodity prices from minerals, to energy and agriculture.
Domestic equities have significantly outperformed emerging market and developed international equities over the past two years. Although the United States is in better shape economically and witnessing better growth, it does not necessarily translate to higher stock market returns. European and emerging market equities are trading at a substantial discount to U.S. equities, so any indication of an uptick in Europe and emerging markets could translate into significant returns in those asset classes.
In addition, the Federal Reserve is closer to the end of its accommodative stance than are the central banks in Europe, Japan, and emerging countries. History suggests superior equity returns from countries with accommodative monetary policies and more attractive valuations. Range of Stock, Bond, and Blended Total Returns Annual total returns, 1950 – 2014 60% 50% Annual Avg. Total Return Stocks 10.3% 30% 32% 20% 28% $327,106 50/50 Portfolio 43% $833,227 Bonds 6.2% 51% 40% $565,743 23% 21% 10% -8% -10% 19% 16% 17% 1% 2% -37% 1 yr. With deflationary signals across the globe and the Fed’s quantitative easing program ending, we believe volatility will pick up from the benign volatility of the last few years, making truly diversified portfolios more valuable. Where appropriate, we continue to diversify our clients’ hard-earned money into private real estate, where we see more compelling returns for the risk assumed, when compared to the valuation of U.S.
stocks and bonds in the current environment. 18% 16% 14% 12% 6% 5% 1% -1% -2% -2% -15% -20% -40% 9.0% 1% 0% -30% Growth of $100,000 over 20 years Stocks Bonds 50/50 Portfolio 5 yr. rolling CliftonLarsonAllen Wealth Advisors, LLC Investment Committee connect@CLAconnect.com Note how volatility is actually reduced with a longer investment time frame. 10 yr. rolling 20 yr. rolling Source: Barclays Capital, FactSet, Robert Shiller, Strategas/Ibbotson, Federal Reserve, J.P. Morgan Asset Management Returns shown are based on calendar year returns from 1950 to 2014. Growth of $100,000 is based on annual average total returns from 1950 – 2014.
Guide to the Markets – U.S. Data as of 12/31/14 CLAconnect.com/privateclient 7 ©2015 CliftonLarsonAllen Wealth Advisors, LLC . Cheap Oil, Booming Auto Sales, Volatility, and Why Diversification Matters, January 2015 Market and Economic Outlook CliftonLarsonAllen Wealth Advisors, LLC (“CLA Wealth Advisors”) The purpose of this publication is purely educational and informational. It is not intended to promote any product or service and should not be relied on for accounting, legal, tax, or investment advice. The views expressed are those of CLA Wealth Advisors. They are subject to change at any time. Past performance does not imply or guarantee future results.
Investing entails risks, including possible loss of principal. Diversification cannot assure a profit or guarantee against a loss. Investing involves other forms of risk that are not described here.
For that reason, you should contact an investment professional before acting on any information in this publication. Financial information is from third party sources. Such information is believed to be reliable but is not verified or guaranteed. Performances from any indices in this report are presented without factoring fees or charges, and are provided for reference and competitive purposes only.
Any fees, charges, or holdings different than the indices will effect individual results. Indexes are unmanaged; one cannot invest directly into an index. Investment advisory services are offered through CliftonLarsonAllen Wealth Advisors, LLC, an SEC-registered investment advisor. Prior approval is required for further distribution of this material. CLAconnect.com/privateclient 8 ©2015 CliftonLarsonAllen Wealth Advisors, LLC .
We believe the momentum will persist into the new year as the cascading effect of lower energy costs acts as another level of support for consumers and businesses. The effect of lower energy costs is a net positive for our economy, but maybe not as big as many think. Domestic oil production has ramped up significantly in the past five years due to technology breakthroughs, so the growing energy sector will feel the effects. Overall, the investment picture was decidedly mixed in 2014, with U.S. large stocks and bonds putting in solid returns, while small stocks, overseas stocks, and commodities were mostly negative to flat. Some positives and negatives in the economic and investment background include: Positives Negatives Record corporate earnings Federal Reserve stimulus/QE ending Strong auto sales U.S.
stocks no longer cheap Firming housing prices Corporate earnings growth is slowing Benign inflation Deflation risks outside the United States Improving employment Geopolitical risks Lower gasoline prices CLAconnect.com/privateclient ©2015 CliftonLarsonAllen Wealth Advisors, LLC . Cheap Oil, Booming Auto Sales, Volatility, and Why Diversification Matters, January 2015 Market and Economic Outlook U.S. economic growth is finally accelerating The U.S. economic expansion has been slow but steady, averaging about 2.2 percent real growth per year versus 3 percent average growth over the past 50 years. The economy grew 5 percent during the third quarter according to a revised gross domestic product (GDP) report released by the U.S.
Department of Commerce. This is the fastest quarterly expansion since 2003, indicating the upward trend may be accelerating. An improving labor market and lower oil and gasoline prices should continue to buoy consumer confidence and spending. Crude Oil Prices: West Texas Intermediate (WTI) 110 (Dollars per barrel) 100 Strong economic growth is a welcome sign for stock investors, as corporate earnings are the life blood of rising stock prices.
Higher wages and interest rates will most likely follow, but may be offset by above-trend growth. The past year has also been one of the strongest on record for mergers and acquisitions, a product of economic growth, a favorable lending environment, high confidence levels, and lots of cash on corporate balance sheets. Another offshoot is the strengthening dollar.
This will continue to weigh on foreign company earnings if the U.S. dollar continues its ascent against the yen and euro. Real GDP 10% 4% 2% Expansion Average: 2.2% -2% -6% ‘70 ‘75 ‘80 ‘85 ‘90 ‘95 ‘00 7/1/14 9/1/14 11/1/14 In addition, emerging corporate bonds, which typically yield about twice U.S. bonds, have been another popular source of income in a low-interest world. U.S growth may be trending higher. ‘65 5/1/14 Collateral damage of lower oil prices How long oil prices stay low remains to be seen, but we know that the petroleumproducing countries of the world have come to depend on a $100-per-barrel benchmark. It seems reasonable that oil will eventually rise over the coming years as supplies get more in line with demand.
However, the near-term impact of a 50 percent decline in a major world commodity is having ripple effects across the financial markets. For example, high yield bonds, which until very recently have been a source of stable, higher income and return for fixed-income investors, have declined in tandem with oil. This is because about 15 percent of the high yield or junk corporate bonds have been issued by energy-related firms in this country. Mutual funds and exchange traded funds invested in high yield bonds have also been affected. 50-year average: 3.0% 0% 3/1/14 2.7% Quarter-over-quarter % change 5.0% 8% 1/1/14 Sources: U.S.
Energy Information Administration, Federal Reserve Bank of St. Louis 3Q14 Year-over-year % change A 40%+ drop in oil prices is primarily due to excess supply. 70 50 Year-over-Year % change -4% 80 60 Real Gross Domestic Product 6% 90 ‘05 ‘10 Sources: U.S. Bureau of Economic Analysis, FactSet, J.P.
Morgan Asset Management CLAconnect.com/privateclient 2 ©2015 CliftonLarsonAllen Wealth Advisors, LLC . Cheap Oil, Booming Auto Sales, Volatility, and Why Diversification Matters, January 2015 Market and Economic Outlook The strength of the dollar relative to the weaker, commodity-producing, emerging market currencies has also resulted in declining prices for emerging market bonds. Bank of America Merrill Lynch High Yield U.S. Emerging Markets Liquid Corporate Plus Sub-Index Total Return Index Value© Other income-producing areas feeling the impact include popular energy royalty trusts and master limited partnerships whose business models depend upon a continuing flow of oil through pipelines. Oil infrastructure capital spending (which is already under cutting pressure) and possible future oil production cuts are taking a toll on these markets as well. 255 250 245 (Index) 240 Bank of America Merrill Lynch U.S. High Yield Master II Total Return Index Value© 235 230 1,080 225 1,070 220 1,060 (Index) 1,090 215 1,050 1,030 1,020 1,010 3/1/14 5/1/14 7/1/14 9/1/14 Sources: Bank of America Merrill Lynch, Federal Reserve Bank of St.
Louis 3/1/14 5/1/14 7/1/14 9/1/14 11/1/14 1/1/15 Sources: Bank of America Merrill Lynch, Federal Reserve Bank of St. Louis Energy firms comprise about 15% of the U.S. junk bond index. 1,040 Brazil, Russia, and other emerging commodity producers are under pressure. 11/1/14 Industry spotlight: automobile sales, a key component to growth The auto industry has a significant impact on moving the overall economy forward, from the suppliers, to the manufacturers, to the overall distribution network.
According to Scott Gorden, managing principal for dealerships at CliftonLarsonAllen, auto manufacturers and automotive industry experts expect a 1/1/15 continuation of the 17+ million new vehicle sales pace into 2017 or 2018, at a minimum. “The level of activity that we’re seeing at the suppliers and manufacturers should stay at the level it is today, and that will continue to drive growth in the overall economy,” Gorden says. “I think there is a lot of consumer buying due to higher levels of consumer spending capacity from relatively inexpensive borrowing rates and low gas prices. Those two factors should drive volume even higher over the next few years.” Scott Gorden, CPA Managing Principal CLAconnect.com/privateclient 3 ©2015 CliftonLarsonAllen Wealth Advisors, LLC . Cheap Oil, Booming Auto Sales, Volatility, and Why Diversification Matters, January 2015 Market and Economic Outlook Don’t chase an arbitrary benchmark: focus on your investment strategy With the S&P 500 and Dow Jones Industrial averages hitting all-time highs, we are receiving inquiries about putting more money in these “winning” areas of the market. As the “Why Diversification Matters” chart illustrates, U.S. large stocks and real estate were the leaders for 2014. However, the chart also shows that the annual investment category winners tend to vary with no known correlation.
Our conclusion is that running your own race (i.e., marking your financial progress relative to your own investment and life goals) is more meaningful than comparing yourself to an unmanaged benchmark like the S&P 500. In fact, putting all your money in the “winning” category (the S&P 500 in this case) would have resulted in quite a ride the last decade, including a 49 percent and 57 percent drawdown of your money. Another issue pushing the industry forward is the average age of vehicles on the road. Gorden says the average age is more than 11 years, which is the highest he’s ever seen.
“At some point a vehicle just doesn’t work anymore from an operational standpoint, so you have to either trade it in or junk it.” He says the biggest challenge for dealerships is finding the right employees and making sure they are staying ahead of the technology curve as it becomes more integrated in the business. Most important is how technology drives the interaction with the consumer. “Most consumers today have gone on the Internet and done their research before they even step into the dealership,” Gorden says. ”I see the touch points and interactions with the consumer continuing to change and evolve as we go forward. Dealers will need to continue to refine their sales methods and further integrate technology into the sales process.” S&P 500 Index Light-Weight Vehicle Sales: Autos and Light Trucks 2,200 Shaded areas indicate U.S.
recessions 22.5 1,800 20.0 (Millions of units) The S&P 500 has provided quite a ride, with two 50 percent declines along the way. 2,000 1,600 17.5 1,400 Oct. 9, 2007 P/E (fwd.) = 15.2x 1,565 Mar. 24, 2000 P/E (fwd.) = 25.6x 1,527 +101% +106% 1,000 +204% -57% 1,200 15.0 Dec.
31, 2014 P/E (fwd.) = 16.2x 2,059 -49% 12.5 800 10.0 600 ‘97 ‘98 ‘99 ‘00 ‘01 ‘02 ‘03 ‘04 ‘05 ‘06 ‘07 ‘08 ‘09 ‘10 ‘11 ‘12 ‘13 ‘14 7.5 Auto sales have completely recovered from the recession. 1980 1985 1990 1995 2000 2005 Dec. 31, 1996 P/E (fwd.) = 16.0x 741 Oct. 9, 2002 P/E (fwd.) = 14.1x 777 Mar.
9, 2009 P/E (fwd.) = 10.3x 677 Sources: Standard & Poor’s, First Call, Compustat, FactSet, J.P. Morgan Asset Management 2010 Sources: U.S. Bureau of Economic Analysis, Federal Reserve Bank of St.
Louis CLAconnect.com/privateclient 4 ©2015 CliftonLarsonAllen Wealth Advisors, LLC . Cheap Oil, Booming Auto Sales, Volatility, and Why Diversification Matters, January 2015 Market and Economic Outlook Why Diversification Matters 2004 2005 2006 2007 2008 2009 2010 2011 2012 2013 2014 31.2% 31.5% 35.5% 30.4% 11.4% 58.7% 26.9% 7.8% 18.9% 38.8% 27.2% 20.3% 13.5% 26.3% 11.2% 5.2% 58.2% 26.9% 6.6% 17.9% 33.5% 13.7% 18.3% 12.6% 25.6% 8.8% Asset Alloc. -21.7% 37.4% 26.6% 6.1% 17.3% 32.3% 9.8% 16.5% 9.6% 18.4% Asset Alloc. 8.5% -26.2% 31.8% 15.1% 5.0% 16.4% 22.8% 6.0% 13.2% Asset Alloc. 7.7% 15.8% 8.0% -33.8% 30.8% 15.1% 2.1% 16.0% Asset Alloc. 14.6% Asset Alloc. 5.5% 11.1% 4.9% Asset Alloc. 13.9% 7.0% -36.2% 27.2% 11.7% Asset Alloc. 0.0% 15.8% 7.4% 4.9% 10.9% 4.6% 11.9% 5.5% -37.0% 26.5% Asset Alloc. 11.6% -1.7% 13.9% 1.8% 2.6% Asset Alloc. 10.6% 2.7% 10.3% 1.9% -40.1% Asset Alloc. 22.2% 7.8% -4.2% Asset Alloc. 11.3% -1.3% 2.5% 4.3% 2.4% 4.3% -1.6% -43.4% 5.9% 6.5% -12.1% 4.2% -2.0% -2.2% 2.0% 1.6% 3.5% -18.2% -47.3% -1.4% 5.3% -14.9% 1.7% -2.6% -4.9% The asset allocation or diversified portfolio keeps investors on their plans. Sources: Morningstar, BlackRock U.S. Large Cap = S&P 500 Index measuring the performance of large capitalization U.S. stocks Real Estate = Dow Jones U.S. Real Estate Index measuring the performance of the real estate sector of the U.S.
equity market U.S. Mid Cap = S&P 400 MidCap Index measuring the performance of 400 medium capitalization U.S. stocks Treasuries = Barclays Capital U.S.
Intermediate Treasury Index measuring the performance of intermediate maturity treasuries U.S. Small Cap = Russell 2000 Index measuring the performance of small capitalization U.S. stocks High Yield = Barclays Corporate High Yield Index measuring the performance of bonds rated below investment grade Foreign Equity = MSCI EAFE Index measuring the performance of the developed stock markets of Europe, Australia, Asia, and Far East Emerging Markets = MSCI Emerging Market Index measuring the performance of diversified undeveloped markets in U.S.
currency Fixed Income = Barclays Capital U.S. Aggregate Index measuring the performance of U.S. government, corporate, and mortgage backed securities with maturities of up to 30 years Asset Allocation = Blend of benchmarks comprised of Barclays U.S. Agg 40%, S&P 500 25.2%, MSCI EAFE 14.4%, Russell 2000 10.8%, and MSCI Emerging Markets 9.6% All data are based on Morningstar and Bloomberg reports and represent total return for stated period.
Indexes are unmanaged; one cannot invest directly in an index. Diversification does not guarantee investment results and does not eliminate the risk of loss. International investing involves a greater degree of risk and increased volatility due to such factors as fluctuations in currency exchange rates, differences in accounting and taxation policies; some overseas markets may not be as politically and economically stable as the United States and other nations.
Small company stocks may be subject to a higher degree of market risk than securities of more established companies because they tend to be more volatile and less liquid. Past performance is not an indication of future results. Investing in securities involves risk; you may lose money including the principal amount invested.
Data as of 12/31/2014. For illustrative purposes only. CLAconnect.com/privateclient 5 ©2015 CliftonLarsonAllen Wealth Advisors, LLC . Cheap Oil, Booming Auto Sales, Volatility, and Why Diversification Matters, January 2015 Market and Economic Outlook Be an investor, not a speculator The best way to run your own race is to be an investor, not a speculator. Investors seek to reduce risk while maximizing returns prudently through diversification. In the absence of a perfect investment view, a well-constructed portfolio is built to withstand multiple risks that, if not addressed, could dramatically impact your personal financial plan. The best way to reduce risk is to diversify. The “Why Diversification Matters” chart shows that a diversified portfolio is consistently in the middle of the results — not the best, nor the worst. This helps keep investors on their personal financial plans.
In fact, a study by Dalbar Inc. that utilizes the net of the aggregate mutual fund sales, redemptions, and exchanges each month as a measure of investor behavior, showed that for the 20-year period ending in 2013, investors averaged a 2.5 percent return annually — well below bonds (5.7 percent annually) and the S&P 500 (9.2 percent annually). Obstacles to successful investing As humans, we have numerous cognitive biases that hamper successful investing, including (but not limited to) overconfidence, confirmation bias, bandwagon effect, and anchoring, which are in full display in the Dalbar investor results. Burton Malkiel, renowned Princeton University professor and author of A Random Walk Down Wall Street, says, “I’ve never known anybody who can time the market. I’ve never known anybody who knows anybody who can consistently time the market.” It is easy for investors to suddenly become undisciplined when markets become “narrow.” But here is a history lesson: In 1998 and 1999, the only sector that performed well was technology stocks.
Record levels of money flowed into technology stocks in late 1999 and early 2000, only to witness one of the greatest bear market corrections in an asset class in market history. From 2000 to 2002, the NASDAQ went on a three-year, 70 percent decline. Today, with the S&P 500 hitting all-time highs, investors are focused on the narrow part of the market that has worked the best in the past two years.
Our advice is just as it was in 1999: Don’t chase what just worked and stay on your investment strategy. Benefits of Diversification Over Previous 13 Years Annualized Return (%) 8.0 The diversified or moderate global portfolio can outperform at times, too, like 2001 through 2013, with much less volatility. 6.0 5.2 6.6 4.7 4.0 2.3 2.0 0.0 Inflation Barclays U.S. Aggregate S&P 500 Dow Jones Moderate Global Total Returns January 1, 2001 – December 31, 2013 Annualized Return (%) Cumulative Return (%) Std Dev (%) Inflation 2.3 34.0 1.4 Barclays U.S. Aggregate 5.2 94.2 3.6 S&P 500 4.7 80.5 15.5 Dow Jones Moderate Global Staying disciplined to your investment strategy The chart to the right titled “Benefits of Diversification Over Previous 13 Years” shows how an investor in a highly diversified global portfolio out-performed the S&P 500, with far less volatility. What prevents most investors from reaching CLAconnect.com/privateclient their goals is they don’t stay disciplined to their investment strategy through the complete cycle.
The number one criteria for investment success is maintaining your investment strategy for the long term. Many investors get distracted by an asset class that has performed well in the prior 12 to 24 months, leave their disciplined strategy to chase that performance, and end up in a subpar investment experience. 6.6 129.2 10.5 Source: Zephyr StyleADVISOR 6 ©2015 CliftonLarsonAllen Wealth Advisors, LLC . Cheap Oil, Booming Auto Sales, Volatility, and Why Diversification Matters, January 2015 Market and Economic Outlook Diversification is not a panacea The price for hedging multiple risks means you will own investments that don’t do well in any one year. For 2014, owning emerging market and other international stocks has been disappointing. However, as history shows, these areas of the market will have their day in the sun too, we just don’t know when. History also shows us that buying stocks during periods of above-average valuations leads to lower-than-average returns.
For example, selling international stocks at lower valuations and buying U.S. blue chips at relatively higher valuations is counterproductive in the long term, even though you may be in sync with the current trend. It is generally better to think long term in the markets.
In the short term, the stock market is unpredictable. In the longer term, the stock market becomes more predictable as illustrated by the range of stock, bond, and blended total returns in the chart below. Portfolio diversification and potential volatility In 2014 we saw another year of solid GDP growth and a healing for the economy that continues to recover from the 2008 financial crisis. The U.S.
economy is far along in the deleveraging process, and indicators now point toward moving back into a long-term, sustainable growth phase. We expect the United States to now take the lead role in the global economic recovery, with Europe and Japan behind in the deleveraging process. Emerging markets are feeling the pain of the correction in commodity prices from minerals, to energy and agriculture.
Domestic equities have significantly outperformed emerging market and developed international equities over the past two years. Although the United States is in better shape economically and witnessing better growth, it does not necessarily translate to higher stock market returns. European and emerging market equities are trading at a substantial discount to U.S. equities, so any indication of an uptick in Europe and emerging markets could translate into significant returns in those asset classes.
In addition, the Federal Reserve is closer to the end of its accommodative stance than are the central banks in Europe, Japan, and emerging countries. History suggests superior equity returns from countries with accommodative monetary policies and more attractive valuations. Range of Stock, Bond, and Blended Total Returns Annual total returns, 1950 – 2014 60% 50% Annual Avg. Total Return Stocks 10.3% 30% 32% 20% 28% $327,106 50/50 Portfolio 43% $833,227 Bonds 6.2% 51% 40% $565,743 23% 21% 10% -8% -10% 19% 16% 17% 1% 2% -37% 1 yr. With deflationary signals across the globe and the Fed’s quantitative easing program ending, we believe volatility will pick up from the benign volatility of the last few years, making truly diversified portfolios more valuable. Where appropriate, we continue to diversify our clients’ hard-earned money into private real estate, where we see more compelling returns for the risk assumed, when compared to the valuation of U.S.
stocks and bonds in the current environment. 18% 16% 14% 12% 6% 5% 1% -1% -2% -2% -15% -20% -40% 9.0% 1% 0% -30% Growth of $100,000 over 20 years Stocks Bonds 50/50 Portfolio 5 yr. rolling CliftonLarsonAllen Wealth Advisors, LLC Investment Committee connect@CLAconnect.com Note how volatility is actually reduced with a longer investment time frame. 10 yr. rolling 20 yr. rolling Source: Barclays Capital, FactSet, Robert Shiller, Strategas/Ibbotson, Federal Reserve, J.P. Morgan Asset Management Returns shown are based on calendar year returns from 1950 to 2014. Growth of $100,000 is based on annual average total returns from 1950 – 2014.
Guide to the Markets – U.S. Data as of 12/31/14 CLAconnect.com/privateclient 7 ©2015 CliftonLarsonAllen Wealth Advisors, LLC . Cheap Oil, Booming Auto Sales, Volatility, and Why Diversification Matters, January 2015 Market and Economic Outlook CliftonLarsonAllen Wealth Advisors, LLC (“CLA Wealth Advisors”) The purpose of this publication is purely educational and informational. It is not intended to promote any product or service and should not be relied on for accounting, legal, tax, or investment advice. The views expressed are those of CLA Wealth Advisors. They are subject to change at any time. Past performance does not imply or guarantee future results.
Investing entails risks, including possible loss of principal. Diversification cannot assure a profit or guarantee against a loss. Investing involves other forms of risk that are not described here.
For that reason, you should contact an investment professional before acting on any information in this publication. Financial information is from third party sources. Such information is believed to be reliable but is not verified or guaranteed. Performances from any indices in this report are presented without factoring fees or charges, and are provided for reference and competitive purposes only.
Any fees, charges, or holdings different than the indices will effect individual results. Indexes are unmanaged; one cannot invest directly into an index. Investment advisory services are offered through CliftonLarsonAllen Wealth Advisors, LLC, an SEC-registered investment advisor. Prior approval is required for further distribution of this material. CLAconnect.com/privateclient 8 ©2015 CliftonLarsonAllen Wealth Advisors, LLC .


