Mutual Fund OneSource Select List & Income Select List - First Quarter 2016
Charles Schwab & Co


Description
FIRST QUARTER
2016
Also available at
schwab.com/selectlist
Mutual Fund
OneSource
Select List
& Income Select List
Analysis and Commentary on Actively
Managed Mutual Funds by Charles
Schwab Investment Advisory, Inc.
With thousands of mutual funds available,
finding the right funds for your portfolio can
seem more time-consuming and difficult than
ever. The Mutual Fund OneSource Select List,
consisting only of OneSource funds available
without a load or transaction fee, is a smart
solution that can help you make confident
investment decisions.
Opportunities Expanded With Lower Minimums
for Funds in Schwab OneSource®
HIGHLIGHTS
Key points:
(Pages 1–3)
• Schwab recently lowered the minimums for initial and subsequent
investments for most funds participating in its Mutual Fund
OneSource service, making it even easier for individual investors
to get started.
• The reduced minimums also open the door to Schwab’s Automatic
Investment Program (AIP) to more investors, allowing them to
automate their investing and take advantage of the strategy of
dollar-cost averaging.
• AIP brings discipline and consistency to an investment program
and can help investors overcome inertia and resist the temptation
of market-timing.
(continued on page 2)
Opportunities Expanded With
Lower Minimums for Funds in
Schwab OneSource®
Fund Selection Considerations
(Page 4)
Fourth Quarter Perspectives
and Summaries
(Pages 5–11)
Mutual Fund OneSource Select List
(Pages 5–11)
Income Mutual Fund Select List
(Pages 12–13)
Additional Important Information
(Page 14)
. Opportunities Expanded With Lower Minimums for Funds in Schwab OneSource® (continued)
Many investors consider the most difficult aspect of wealth-
It can be hard to maintain the discipline required to invest regularly.
building to be getting started—determining how to allocate their
Market volatility, nonstop news and commentary, conflicting
assets, choosing appropriate investment vehicles, and taking
opinions, and simply the fear of the unknown can all conspire
the action required to create an initial portfolio. There can be
against us, leading even the most resolute investor to second-
many reasons for inaction or procrastination, but many would-be
guess his or her intentions and often leading to poorly timed
investors simply believe that they haven’t amassed sufficient
purchases or sales, or worse—inertia. Sometimes investors are
resources to get started. To help overcome this barrier, Schwab
so stymied that they end up doing nothing, simply sitting on the
has lowered its investment minimums for both initial and
sidelines.
That’s where automatic investing can help. subsequent mutual fund purchases for the majority of funds participating in its Mutual Fund OneSource service. Opening the Door to More Investors A pioneer in the fund supermarket model, Schwab developed Mutual Fund OneSource to provide investors access to a large number of funds and fund families through a single account, with no loads or transaction fees. Always looking to further increase the attractiveness of the platform and to enable more investors to take advantage of it, Schwab recently lowered its initial investment minimums on Mutual Fund OneSource funds from $2,500 to as little as $100 for most funds. And once an initial position has been established, subsequent, ongoing investments in that fund can now be made for as little as $1, down from $500.
The changes apply to most funds participating in Schwab’s Mutual Fund OneSource service—including the vast majority of funds listed in the Mutual Fund OneSource Select List. As with all Mutual Fund OneSource funds, initial and subsequent mutual fund investments incur no transaction fees.1 Recognizing the challenges and temptations that can potentially derail investors or lead to less-than-optimal timing decisions, Schwab has long encouraged investors to put the strategy of dollar-cost averaging to work for them through AIP. And with the lower minimums for initial investments, AIP becomes available for small accounts and to investors who don’t have a lot to invest upfront but want to build their portfolio over the long term. Dollar-Cost Averaging: A Prudent Strategy Dollar-cost averaging is a wealth-building strategy that involves investing a fixed amount of money at regular intervals over a long period regardless of share price.
Many investors may already be practicing it if they participate in a 401(k) or 403(b) retirement plan in which contributions are made through regular payroll deductions. Instead of purchasing shares of one or more mutual funds in a single lump sum, dollar-cost averaging allows investors to spread their purchases over a longer period of time. In so doing, investors can reduce the impact of short-term market moves, which typically smooth out over time. Benefits of Lower Minimums Here’s how it works: Every month (or other regular interval), Lower minimum investments are meaningful for more than just you invest a set amount of money in one or more mutual funds, small or first-time investors.
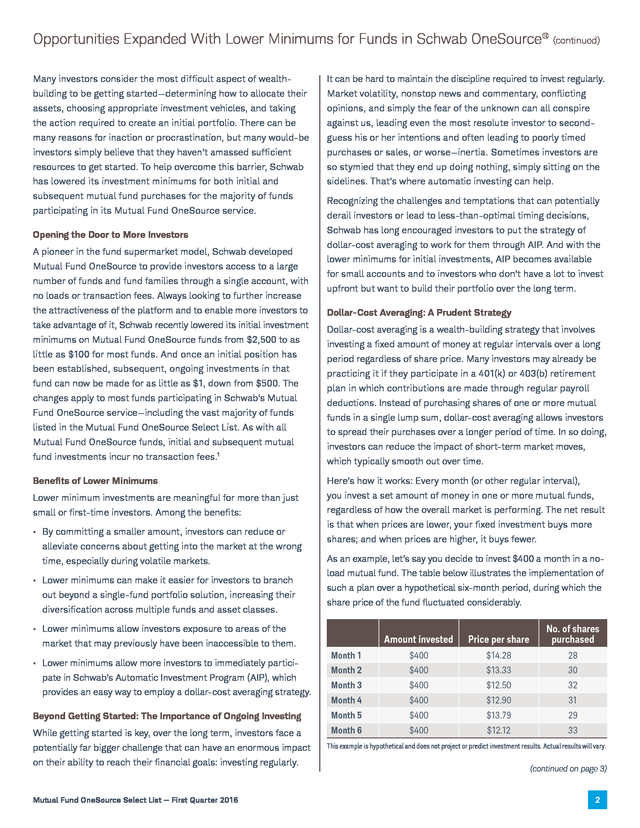
Among the benefits: regardless of how the overall market is performing. The net result • By committing a smaller amount, investors can reduce or alleviate concerns about getting into the market at the wrong time, especially during volatile markets. • Lower minimums can make it easier for investors to branch out beyond a single-fund portfolio solution, increasing their diversification across multiple funds and asset classes. is that when prices are lower, your fixed investment buys more shares; and when prices are higher, it buys fewer. As an example, let’s say you decide to invest $400 a month in a noload mutual fund. The table below illustrates the implementation of such a plan over a hypothetical six-month period, during which the share price of the fund fluctuated considerably. Amount invested Price per share No.
of shares purchased Month 1 $400 $14.28 28 Month 2 $400 $13.33 30 Month 3 $400 $12.50 32 Month 4 $400 $12.90 31 Month 5 $400 $13.79 29 Month 6 $400 $12.12 33 • Lower minimums allow investors exposure to areas of the market that may previously have been inaccessible to them. • Lower minimums allow more investors to immediately participate in Schwab’s Automatic Investment Program (AIP), which provides an easy way to employ a dollar-cost averaging strategy. Beyond Getting Started: The Importance of Ongoing Investing While getting started is key, over the long term, investors face a potentially far bigger challenge that can have an enormous impact on their ability to reach their financial goals: investing regularly. Mutual Fund OneSource Select List — First Quarter 2016 This example is hypothetical and does not project or predict investment results. Actual results will vary. (continued on page 3) 2 . Opportunities Expanded With Lower Minimums for Funds in Schwab OneSource® (continued) If, instead of employing dollar-cost averaging, you had used the entire $2,400 at the outset to buy fund shares at their then-price of $14.28 per share, you would have purchased 168 shares. In this example, due to the fluctuation of the fund’s share price, at the end of the six-month period you would have had 183 shares, purchased at an average price of $13.15 per share. Of course, no strategy—dollar-cost averaging included—can protect against losses when share prices tumble. And in a rising market, it would make more sense to have purchased shares earlier, at a lower price. But without the benefit of hindsight, one never knows where prices are headed. Schwab’s lower investment minimums have the potential to give a whole new group of investors the ability to grow their portfolio over time.
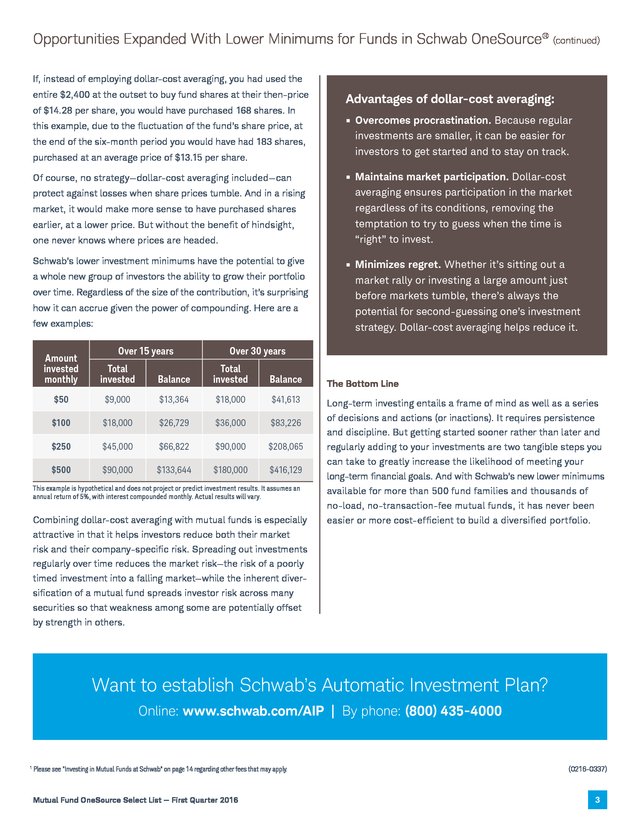
Regardless of the size of the contribution, it’s surprising how it can accrue given the power of compounding. Here are a few examples: Over 15 years Advantages of dollar-cost averaging: • Overcomes procrastination. Because regular investments are smaller, it can be easier for investors to get started and to stay on track. • Maintains market participation.
Dollar-cost averaging ensures participation in the market regardless of its conditions, removing the temptation to try to guess when the time is “right” to invest. • Minimizes regret. Whether it’s sitting out a market rally or investing a large amount just before markets tumble, there’s always the potential for second-guessing one’s investment strategy. Dollar-cost averaging helps reduce it. Over 30 years Amount invested monthly Total invested Balance Total invested Balance The Bottom Line $50 $9,000 $13,364 $18,000 $41,613 Long-term investing entails a frame of mind as well as a series $100 $18,000 $26,729 $36,000 $83,226 $250 $45,000 $66,822 $90,000 $208,065 $500 $90,000 $133,644 $180,000 $416,129 of decisions and actions (or inactions).
It requires persistence and discipline. But getting started sooner rather than later and regularly adding to your investments are two tangible steps you can take to greatly increase the likelihood of meeting your long-term financial goals. And with Schwab’s new lower minimums This example is hypothetical and does not project or predict investment results.
It assumes an annual return of 5%, with interest compounded monthly. Actual results will vary. available for more than 500 fund families and thousands of Combining dollar-cost averaging with mutual funds is especially easier or more cost-efficient to build a diversified portfolio. no-load, no-transaction-fee mutual funds, it has never been attractive in that it helps investors reduce both their market risk and their company-specific risk. Spreading out investments regularly over time reduces the market risk—the risk of a poorly timed investment into a falling market—while the inherent diversification of a mutual fund spreads investor risk across many securities so that weakness among some are potentially offset by strength in others. Want to establish Schwab’s Automatic Investment Plan? Online: www.schwab.com/AIP | By phone: (800) 435-4000 1 Please see “Investing in Mutual Funds at Schwab” on page 14 regarding other fees that may apply. Mutual Fund OneSource Select List — First Quarter 2016 (0216-0337) 3 .
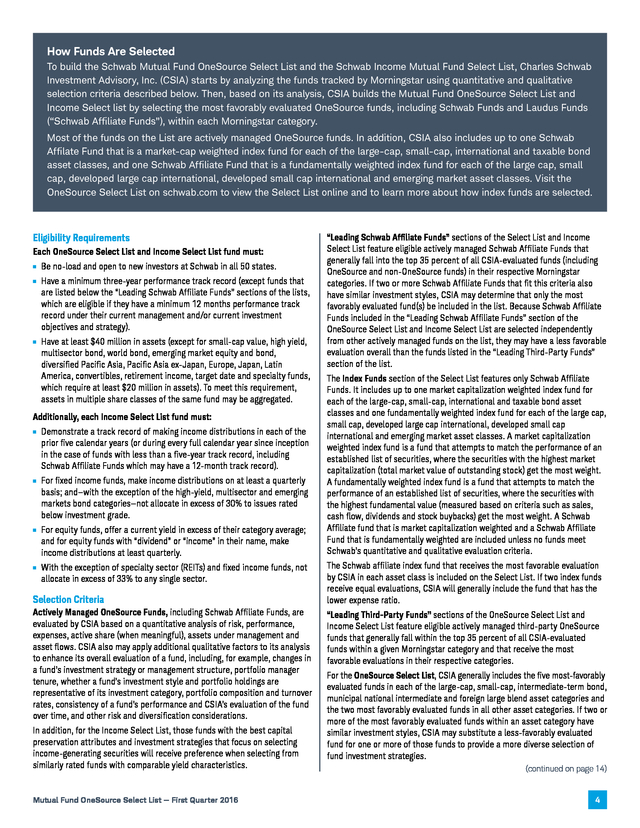
How Funds Are Selected To build the Schwab Mutual Fund OneSource Select List and the Schwab Income Mutual Fund Select List, Charles Schwab Investment Advisory, Inc. (CSIA) starts by analyzing the funds tracked by Morningstar using quantitative and qualitative selection criteria described below. Then, based on its analysis, CSIA builds the Mutual Fund OneSource Select List and Income Select list by selecting the most favorably evaluated OneSource funds, including Schwab Funds and Laudus Funds (“Schwab Affiliate Funds”), within each Morningstar category. Most of the funds on the List are actively managed OneSource funds. In addition, CSIA also includes up to one Schwab Affilate Fund that is a market-cap weighted index fund for each of the large-cap, small-cap, international and taxable bond asset classes, and one Schwab Affiliate Fund that is a fundamentally weighted index fund for each of the large cap, small cap, developed large cap international, developed small cap international and emerging market asset classes.
Visit the OneSource Select List on schwab.com to view the Select List online and to learn more about how index funds are selected. Eligibility Requirements Each OneSource Select List and Income Select List fund must: Be no-load and open to new investors at Schwab in all 50 states. Have a minimum three-year performance track record (except funds that are listed below the “Leading Schwab Affiliate Funds” sections of the lists, which are eligible if they have a minimum 12 months performance track record under their current management and/or current investment objectives and strategy). Have at least $40 million in assets (except for small-cap value, high yield, multisector bond, world bond, emerging market equity and bond, diversified Pacific Asia, Pacific Asia ex-Japan, Europe, Japan, Latin America, convertibles, retirement income, target date and specialty funds, which require at least $20 million in assets). To meet this requirement, assets in multiple share classes of the same fund may be aggregated. Additionally, each Income Select List fund must: Demonstrate a track record of making income distributions in each of the prior five calendar years (or during every full calendar year since inception in the case of funds with less than a five-year track record, including Schwab Affiliate Funds which may have a 12-month track record). For fixed income funds, make income distributions on at least a quarterly basis; and—with the exception of the high-yield, multisector and emerging markets bond categories—not allocate in excess of 30% to issues rated below investment grade. For equity funds, offer a current yield in excess of their category average; and for equity funds with “dividend” or “income” in their name, make income distributions at least quarterly. With the exception of specialty sector (REITs) and fixed income funds, not allocate in excess of 33% to any single sector. Selection Criteria Actively Managed OneSource Funds, including Schwab Affiliate Funds, are evaluated by CSIA based on a quantitative analysis of risk, performance, expenses, active share (when meaningful), assets under management and asset flows. CSIA also may apply additional qualitative factors to its analysis to enhance its overall evaluation of a fund, including, for example, changes in a fund’s investment strategy or management structure, portfolio manager tenure, whether a fund’s investment style and portfolio holdings are representative of its investment category, portfolio composition and turnover rates, consistency of a fund’s performance and CSIA’s evaluation of the fund over time, and other risk and diversification considerations. In addition, for the Income Select List, those funds with the best capital preservation attributes and investment strategies that focus on selecting income-generating securities will receive preference when selecting from similarly rated funds with comparable yield characteristics. Mutual Fund OneSource Select List — First Quarter 2016 “Leading Schwab Affiliate Funds” sections of the Select List and Income Select List feature eligible actively managed Schwab Affiliate Funds that generally fall into the top 35 percent of all CSIA-evaluated funds (including OneSource and non-OneSource funds) in their respective Morningstar categories.
If two or more Schwab Affiliate Funds that fit this criteria also have similar investment styles, CSIA may determine that only the most favorably evaluated fund(s) be included in the list. Because Schwab Affiliate Funds included in the “Leading Schwab Affiliate Funds” section of the OneSource Select List and Income Select List are selected independently from other actively managed funds on the list, they may have a less favorable evaluation overall than the funds listed in the “Leading Third-Party Funds” section of the list. The Index Funds section of the Select List features only Schwab Affiliate Funds. It includes up to one market capitalization weighted index fund for each of the large-cap, small-cap, international and taxable bond asset classes and one fundamentally weighted index fund for each of the large cap, small cap, developed large cap international, developed small cap international and emerging market asset classes.
A market capitalization weighted index fund is a fund that attempts to match the performance of an established list of securities, where the securities with the highest market capitalization (total market value of outstanding stock) get the most weight. A fundamentally weighted index fund is a fund that attempts to match the performance of an established list of securities, where the securities with the highest fundamental value (measured based on criteria such as sales, cash flow, dividends and stock buybacks) get the most weight. A Schwab Affiliate fund that is market capitalization weighted and a Schwab Affiliate Fund that is fundamentally weighted are included unless no funds meet Schwab’s quantitative and qualitative evaluation criteria. The Schwab affiliate index fund that receives the most favorable evaluation by CSIA in each asset class is included on the Select List. If two index funds receive equal evaluations, CSIA will generally include the fund that has the lower expense ratio. “Leading Third-Party Funds” sections of the OneSource Select List and Income Select List feature eligible actively managed third-party OneSource funds that generally fall within the top 35 percent of all CSIA-evaluated funds within a given Morningstar category and that receive the most favorable evaluations in their respective categories. For the OneSource Select List, CSIA generally includes the five most-favorably evaluated funds in each of the large-cap, small-cap, intermediate-term bond, municipal national intermediate and foreign large blend asset categories and the two most favorably evaluated funds in all other asset categories.
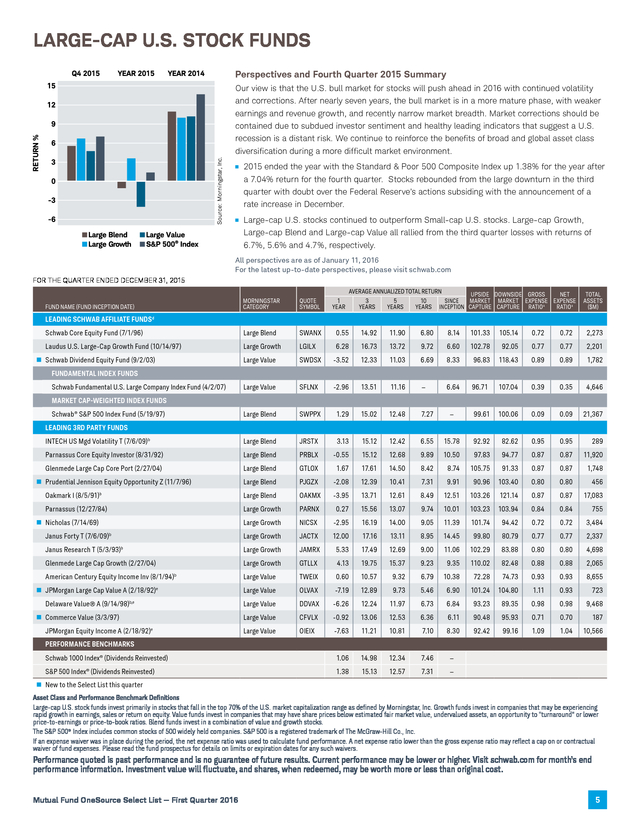
If two or more of the most favorably evaluated funds within an asset category have similar investment styles, CSIA may substitute a less-favorably evaluated fund for one or more of those funds to provide a more diverse selection of fund investment strategies. (continued on page 14) 4 . LARGE-CAP U.S. STOCK FUNDS Perspectives and Fourth Quarter 2015 Summary Our view is that the U.S. bull market for stocks will push ahead in 2016 with continued volatility and corrections. After nearly seven years, the bull market is in a more mature phase, with weaker earnings and revenue growth, and recently narrow market breadth.
Market corrections should be contained due to subdued investor sentiment and healthy leading indicators that suggest a U.S. recession is a distant risk. We continue to reinforce the benefits of broad and global asset class diversification during a more difficult market environment. 2015 ended the year with the Standard & Poor 500 Composite Index up 1.38% for the year after a 7.04% return for the fourth quarter. Stocks rebounded from the large downturn in the third quarter with doubt over the Federal Reserve’s actions subsiding with the announcement of a rate increase in December. Large-cap U.S.
stocks continued to outperform Small-cap U.S. stocks. Large-cap Growth, Large-cap Blend and Large-cap Value all rallied from the third quarter losses with returns of 6.7%, 5.6% and 4.7%, respectively. All perspectives are as of January 11, 2016 For the latest up-to-date perspectives, please visit schwab.com FOR THE QUARTER ENDED DECEMBER 31, 2015 1 YEAR AVERAGE ANNUALIZED TOTAL RETURN UPSIDE DOWNSIDE GROSS NET 3 5 10 SINCE MARKET MARKET EXPENSE EXPENSE YEARS YEARS YEARS INCEPTION CAPTURE CAPTURE RATIO a RATIO a TOTAL ASSETS ($M) MORNINGSTAR CATEGORY QUOTE SYMBOL Schwab Core Equity Fund (7/1/96) Large Blend SWANX 0.55 14.92 11.90 6.80 8.14 101.33 105.14 0.72 0.72 2,273 Laudus U.S.
Large-Cap Growth Fund (10/14/97) Large Growth LGILX 6.28 16.73 13.72 9.72 6.60 102.78 92.05 0.77 0.77 2,201 Schwab Dividend Equity Fund (9/2/03) Large Value SWDSX -3.52 12.33 11.03 6.69 8.33 96.83 118.43 0.89 0.89 1,782 Large Value SFLNX -2.96 13.51 11.16 — 6.64 96.71 107.04 0.39 0.35 4,646 Large Blend SWPPX 1.29 15.02 12.48 7.27 — 99.61 100.06 0.09 0.09 21,367 INTECH US Mgd Volatility T (7/6/09)b Large Blend JRSTX 3.13 15.12 12.42 6.55 15.78 92.92 82.62 0.95 0.95 289 Parnassus Core Equity Investor (8/31/92) Large Blend PRBLX -0.55 15.12 12.68 9.89 10.50 97.83 94.77 0.87 0.87 11,920 Glenmede Large Cap Core Port (2/27/04) Large Blend GTLOX 1.67 17.61 14.50 8.42 8.74 105.75 91.33 0.87 0.87 1,748 Prudential Jennison Equity Opportunity Z (11/7/96) Large Blend PJGZX -2.08 12.39 10.41 7.31 9.91 90.96 103.40 0.80 0.80 456 Oakmark I (8/5/91) 17,083 FUND NAME (FUND INCEPTION DATE) LEADING SCHWAB AFFILIATE FUNDSd FUNDAMENTAL INDEX FUNDS Schwab Fundamental U.S. Large Company Index Fund (4/2/07) MARKET CAP-WEIGHTED INDEX FUNDS Schwab ® S&P 500 Index Fund (5/19/97) LEADING 3RD PARTY FUNDS Large Blend OAKMX -3.95 13.71 12.61 8.49 12.51 103.26 121.14 0.87 0.87 Parnassus (12/27/84) Large Growth PARNX 0.27 15.56 13.07 9.74 10.01 103.23 103.94 0.84 0.84 755 Nicholas (7/14/69) Large Growth NICSX -2.95 16.19 14.00 9.05 11.39 101.74 94.42 0.72 0.72 3,484 Large Growth JACTX 12.00 17.16 13.11 8.95 14.45 99.80 80.79 0.77 0.77 2,337 b Janus Forty T (7/6/09)b Janus Research T (5/3/93) Large Growth JAMRX 5.33 17.49 12.69 9.00 11.06 102.29 83.88 0.80 0.80 4,698 Glenmede Large Cap Growth (2/27/04) Large Growth GTLLX 4.13 19.75 15.37 9.23 9.35 110.02 82.48 0.88 0.88 2,065 American Century Equity Income Inv (8/1/94)b Large Value TWEIX 0.60 10.57 9.32 6.79 10.38 72.28 74.73 0.93 0.93 8,655 JPMorgan Large Cap Value A (2/18/92)e Large Value OLVAX -7.19 12.89 9.73 5.46 6.90 101.24 104.80 1.11 0.93 723 Delaware Value® A (9/14/98)b,e Large Value DDVAX -6.26 12.24 11.97 6.73 6.84 93.23 89.35 0.98 0.98 9,468 Commerce Value (3/3/97) Large Value CFVLX -0.92 13.06 12.53 6.36 6.11 90.48 95.93 0.71 0.70 187 JPMorgan Equity Income A (2/18/92)e Large Value OIEIX -7.63 11.21 10.81 7.10 8.30 92.42 99.16 1.09 1.04 10,566 Schwab 1000 Index® (Dividends Reinvested) 1.06 14.98 12.34 7.46 — S&P 500 Index (Dividends Reinvested) 1.38 15.13 12.57 7.31 — b PERFORMANCE BENCHMARKS ® New to the Select List this quarter Asset Class and Performance Benchmark Definitions Large-cap U.S. stock funds invest primarily in stocks that fall in the top 70% of the U.S.
market capitalization range as defined by Morningstar, Inc. Growth funds invest in companies that may be experiencing rapid growth in earnings, sales or return on equity. Value funds invest in companies that may have share prices below estimated fair market value, undervalued assets, an opportunity to “turnaround” or lower price-to-earnings or price-to-book ratios.
Blend funds invest in a combination of value and growth stocks. The S&P 500® Index includes common stocks of 500 widely held companies. S&P 500 is a registered trademark of The McGraw-Hill Co., Inc. If an expense waiver was in place during the period, the net expense ratio was used to calculate fund performance. A net expense ratio lower than the gross expense ratio may reflect a cap on or contractual waiver of fund expenses.
Please read the fund prospectus for details on limits or expiration dates for any such waivers. Performance quoted is past performance and is no guarantee of future results. Current performance may be lower or higher. Visit schwab.com for month’s end performance information.
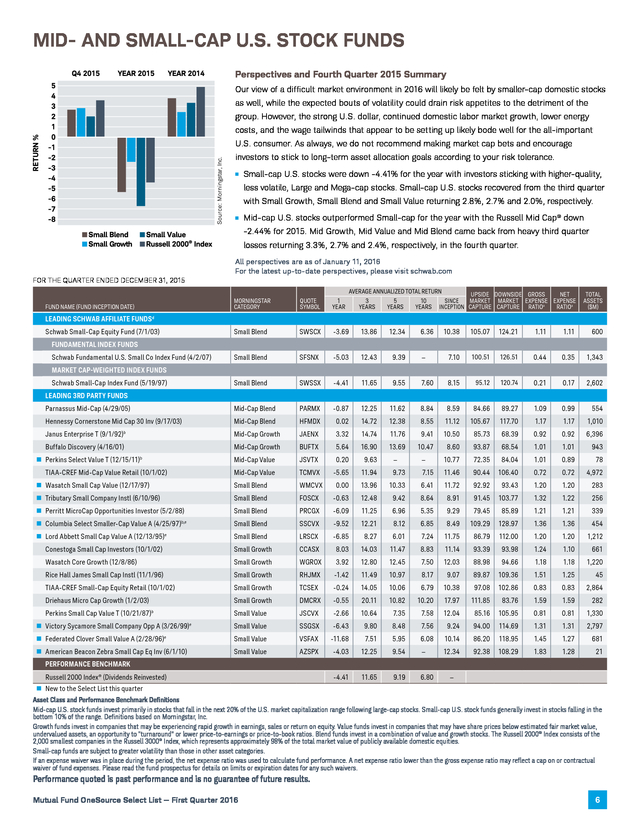
Investment value will fluctuate, and shares, when redeemed, may be worth more or less than original cost. Mutual Fund OneSource Select List — First Quarter 2016 5 . MID- AND SMALL-CAP U.S. STOCK FUNDS Perspectives and Fourth Quarter 2015 Summary Our view of a difficult market environment in 2016 will likely be felt by smaller-cap domestic stocks as well, while the expected bouts of volatility could drain risk appetites to the detriment of the group. However, the strong U.S. dollar, continued domestic labor market growth, lower energy costs, and the wage tailwinds that appear to be setting up likely bode well for the all-important U.S.
consumer. As always, we do not recommend making market cap bets and encourage investors to stick to long-term asset allocation goals according to your risk tolerance. Small-cap U.S. stocks were down -4.41% for the year with investors sticking with higher-quality, less volatile, Large and Mega-cap stocks.
Small-cap U.S. stocks recovered from the third quarter with Small Growth, Small Blend and Small Value returning 2.8%, 2.7% and 2.0%, respectively. Mid-cap U.S. stocks outperformed Small-cap for the year with the Russell Mid Cap ® down -2.44% for 2015.
Mid Growth, Mid Value and Mid Blend came back from heavy third quarter losses returning 3.3%, 2.7% and 2.4%, respectively, in the fourth quarter. All perspectives are as of January 11, 2016 For the latest up-to-date perspectives, please visit schwab.com FOR THE QUARTER ENDED DECEMBER 31, 2015 AVERAGE ANNUALIZED TOTAL RETURN UPSIDE DOWNSIDE GROSS NET 3 5 10 SINCE MARKET MARKET EXPENSE EXPENSE YEARS YEARS YEARS INCEPTION CAPTURE CAPTURE RATIOa RATIOa MORNINGSTAR CATEGORY QUOTE SYMBOL 1 YEAR Small Blend SWSCX -3.69 13.86 12.34 Small Blend SFSNX -5.03 12.43 9.39 Small Blend SWSSX -4.41 11.65 Parnassus Mid-Cap (4/29/05) Mid-Cap Blend PARMX -0.87 Hennessy Cornerstone Mid Cap 30 Inv (9/17/03) Mid-Cap Blend HFMDX 0.02 Janus Enterprise T (9/1/92)b Mid-Cap Growth JAENX 3.32 14.74 Buffalo Discovery (4/16/01) Mid-Cap Growth BUFTX 5.64 16.90 Perkins Select Value T (12/15/11)b Mid-Cap Value JSVTX 0.20 9.63 TIAA-CREF Mid-Cap Value Retail (10/1/02) Mid-Cap Value TCMVX -5.65 Wasatch Small Cap Value (12/17/97) Small Blend WMCVX Tributary Small Company Instl (6/10/96) Small Blend FOSCX Perritt MicroCap Opportunities Investor (5/2/88) Small Blend PRCGX Columbia Select Smaller-Cap Value A (4/25/97)b,e Small Blend Lord Abbett Small Cap Value A (12/13/95)e Small Blend Conestoga Small Cap Investors (10/1/02) Small Growth Wasatch Core Growth (12/8/86) Small Growth Rice Hall James Small Cap Instl (11/1/96) Small Growth RHJMX -1.42 11.49 10.97 TIAA-CREF Small-Cap Equity Retail (10/1/02) Small Growth TCSEX -0.24 14.05 10.06 Driehaus Micro Cap Growth (1/2/03) Small Growth DMCRX -0.55 20.11 10.82 Perkins Small Cap Value T (10/21/87)b Small Value JSCVX -2.66 10.64 7.35 Victory Sycamore Small Company Opp A (3/26/99)e Small Value SSGSX -6.43 9.80 8.48 Federated Clover Small Value A (2/28/96)e Small Value VSFAX -11.68 7.51 5.95 American Beacon Zebra Small Cap Eq Inv (6/1/10) Small Value AZSPX -4.03 12.25 9.54 — -4.41 11.65 9.19 6.80 FUND NAME (FUND INCEPTION DATE) TOTAL ASSETS ($M) LEADING SCHWAB AFFILIATE FUNDSd Schwab Small-Cap Equity Fund (7/1/03) 6.36 10.38 105.07 124.21 1.11 1.11 600 — 7.10 100.51 126.51 0.44 0.35 1,343 9.55 7.60 8.15 95.12 120.74 0.21 0.17 2,602 12.25 11.62 8.84 8.59 84.66 89.27 1.09 0.99 554 14.72 12.38 8.55 11.12 105.67 117.70 1.17 1.17 1,010 11.76 9.41 10.50 85.73 68.39 0.92 0.92 6,396 13.69 10.47 8.60 93.87 68.54 1.01 1.01 943 — — 10.77 72.35 84.04 1.01 0.89 78 11.94 9.73 7.15 11.46 90.44 106.40 0.72 0.72 4,972 0.00 13.96 10.33 6.41 11.72 92.92 93.43 1.20 1.20 283 -0.63 12.48 9.42 8.64 8.91 91.45 103.77 1.32 1.22 256 -6.09 11.25 6.96 5.35 9.29 79.45 85.89 1.21 1.21 339 SSCVX -9.52 12.21 8.12 6.85 8.49 109.29 128.97 1.36 1.36 454 LRSCX -6.85 8.27 6.01 7.24 11.75 86.79 112.00 1.20 1.20 1,212 CCASX 8.03 14.03 11.47 8.83 11.14 93.39 93.98 1.24 1.10 661 WGROX 3.92 12.80 12.45 7.50 12.03 88.98 94.66 1.18 1.18 1,220 8.17 9.07 89.87 109.36 1.51 1.25 45 6.79 10.38 97.08 102.86 0.83 0.83 2,864 10.20 17.97 111.85 83.76 1.59 1.59 282 7.58 12.04 85.16 105.95 0.81 0.81 1,330 7.56 9.24 94.00 114.69 1.31 1.31 2,797 6.08 10.14 86.20 118.95 1.45 1.27 681 12.34 92.38 108.29 1.83 1.28 21 FUNDAMENTAL INDEX FUNDS Schwab Fundamental U.S. Small Co Index Fund (4/2/07) MARKET CAP-WEIGHTED INDEX FUNDS Schwab Small-Cap Index Fund (5/19/97) LEADING 3RD PARTY FUNDS PERFORMANCE BENCHMARK Russell 2000 Index® (Dividends Reinvested) — New to the Select List this quarter Asset Class and Performance Benchmark Definitions Mid-cap U.S. stock funds invest primarily in stocks that fall in the next 20% of the U.S.
market capitalization range following large-cap stocks. Small-cap U.S. stock funds generally invest in stocks falling in the bottom 10% of the range.
Definitions based on Morningstar, Inc. Growth funds invest in companies that may be experiencing rapid growth in earnings, sales or return on equity. Value funds invest in companies that may have share prices below estimated fair market value, undervalued assets, an opportunity to “turnaround” or lower price-to-earnings or price-to-book ratios. Blend funds invest in a combination of value and growth stocks.
The Russell 2000® Index consists of the 2,000 smallest companies in the Russell 3000® Index, which represents approximately 98% of the total market value of publicly available domestic equities. Small-cap funds are subject to greater volatility than those in other asset categories. If an expense waiver was in place during the period, the net expense ratio was used to calculate fund performance. A net expense ratio lower than the gross expense ratio may reflect a cap on or contractual waiver of fund expenses. Please read the fund prospectus for details on limits or expiration dates for any such waivers. Performance quoted is past performance and is no guarantee of future results. Mutual Fund OneSource Select List — First Quarter 2016 6 .
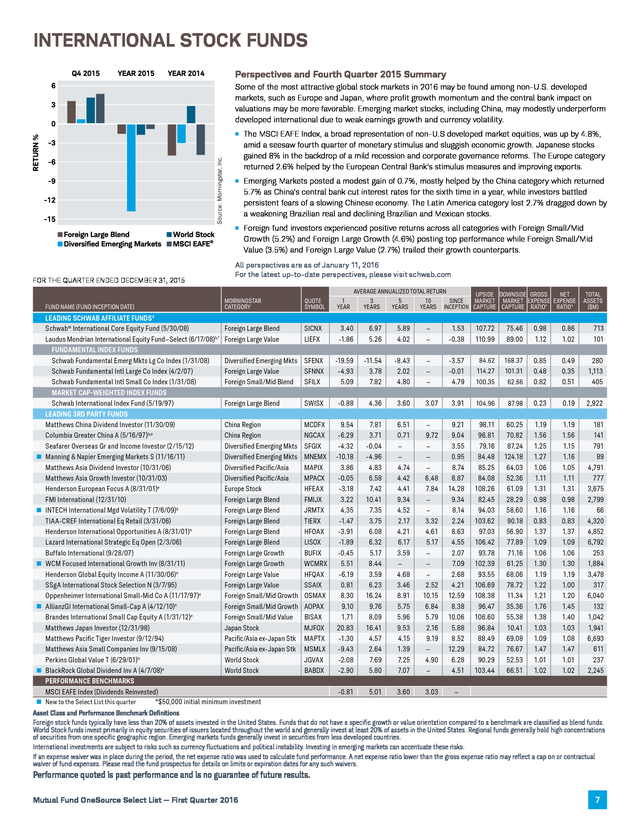
INTERNATIONAL STOCK FUNDS Perspectives and Fourth Quarter 2015 Summary Some of the most attractive global stock markets in 2016 may be found among non-U.S. developed markets, such as Europe and Japan, where profit growth momentum and the central bank impact on valuations may be more favorable. Emerging market stocks, including China, may modestly underperform developed international due to weak earnings growth and currency volatility. The MSCI EAFE Index, a broad representation of non-U.S developed market equities, was up by 4.8%, amid a seesaw fourth quarter of monetary stimulus and sluggish economic growth. Japanese stocks gained 8% in the backdrop of a mild recession and corporate governance reforms.
The Europe category returned 2.6% helped by the European Central Bank’s stimulus measures and improving exports. Emerging Markets posted a modest gain of 0.7%, mostly helped by the China category which returned 5.7% as China’s central bank cut interest rates for the sixth time in a year, while investors battled persistent fears of a slowing Chinese economy. The Latin America category lost 2.7% dragged down by a weakening Brazilian real and declining Brazilian and Mexican stocks. Foreign fund investors experienced positive returns across all categories with Foreign Small/Mid Growth (5.2%) and Foreign Large Growth (4.6%) posting top performance while Foreign Small/Mid Value (3.5%) and Foreign Large Value (2.7%) trailed their growth counterparts. FOR THE QUARTER ENDED DECEMBER 31, 2015 FUND NAME (FUND INCEPTION DATE) All perspectives are as of January 11, 2016 For the latest up-to-date perspectives, please visit schwab.com MORNINGSTAR CATEGORY LEADING SCHWAB AFFILIATE FUNDSd Schwab ® International Core Equity Fund (5/30/08) Foreign Large Blend Laudus Mondrian International Equity Fund—Select (6/17/08)b,* Foreign Large Value FUNDAMENTAL INDEX FUNDS Schwab Fundamental Emerg Mkts Lg Co Index (1/31/08) Diversified Emerging Mkts Schwab Fundamental Intl Large Co Index (4/2/07) Foreign Large Value Schwab Fundamental Intl Small Co Index (1/31/08) Foreign Small/Mid Blend MARKET CAP-WEIGHTED INDEX FUNDS Schwab International Index Fund (5/19/97) Foreign Large Blend LEADING 3RD PARTY FUNDS Matthews China Dividend Investor (11/30/09) China Region Columbia Greater China A (5/16/97)b,e China Region Seafarer Overseas Gr and Income Investor (2/15/12) Diversified Emerging Mkts Manning & Napier Emerging Markets S (11/16/11) Diversified Emerging Mkts Matthews Asia Dividend Investor (10/31/06) Diversified Pacific/Asia Matthews Asia Growth Investor (10/31/03) Diversified Pacific/Asia Henderson European Focus A (8/31/01)e Europe Stock FMI International (12/31/10) Foreign Large Blend INTECH International Mgd Volatility T (7/6/09)b Foreign Large Blend TIAA-CREF International Eq Retail (3/31/06) Foreign Large Blend Henderson International Opportunities A (8/31/01) e Foreign Large Blend Lazard International Strategic Eq Open (2/3/06) Foreign Large Blend Buffalo International (9/28/07) Foreign Large Growth WCM Focused International Growth Inv (8/31/11) Foreign Large Growth Henderson Global Equity Income A (11/30/06)e Foreign Large Value SSgA International Stock Selection N (3/7/95) Foreign Large Value Oppenheimer International Small-Mid Co A (11/17/97) e Foreign Small/Mid Growth AllianzGI International Small-Cap A (4/12/10) e Foreign Small/Mid Growth Brandes International Small Cap Equity A (1/31/12)e Foreign Small/Mid Value Matthews Japan Investor (12/31/98) Japan Stock Matthews Pacific Tiger Investor (9/12/94) Pacific/Asia ex-Japan Stk Matthews Asia Small Companies Inv (9/15/08) Pacific/Asia ex-Japan Stk Perkins Global Value T (6/29/01)b World Stock BlackRock Global Dividend Inv A (4/7/08)e World Stock PERFORMANCE BENCHMARKS MSCI EAFE Index (Dividends Reinvested) New to the Select List this quarter *$50,000 initial minimum investment AVERAGE ANNUALIZED TOTAL RETURN UPSIDE DOWNSIDE GROSS NET 3 5 10 SINCE MARKET MARKET EXPENSE EXPENSE YEARS YEARS YEARS INCEPTION CAPTURE CAPTURE RATIO a RATIO a TOTAL ASSETS ($M) QUOTE SYMBOL 1 YEAR SICNX LIEFX 3.40 -1.86 6.97 5.26 5.89 4.02 — — 1.53 -0.38 107.72 110.99 75.46 89.00 0.98 1.12 0.86 1.02 713 101 SFENX SFNNX SFILX -19.59 -4.93 5.09 -11.54 3.78 7.82 -8.43 2.02 4.80 — — — -3.57 -0.01 4.79 84.62 168.37 114.27 101.31 100.35 62.66 0.85 0.48 0.82 0.49 0.35 0.51 280 1,113 405 SWISX -0.88 4.36 3.60 3.07 3.91 104.96 87.98 0.23 0.19 2,922 MCDFX NGCAX SFGIX MNEMX MAPIX MPACX HFEAX FMIJX JRMTX TIERX HFOAX LISOX BUFIX WCMRX HFQAX SSAIX OSMAX AOPAX BISAX MJFOX MAPTX MSMLX JGVAX BABDX 9.54 -6.29 -4.32 -10.18 3.86 -0.05 -3.18 3.22 4.35 -1.47 -3.91 -1.89 -0.45 5.51 -6.19 0.81 8.30 9.10 1.71 20.83 -1.30 -9.43 -2.08 -2.90 7.81 3.71 -0.04 -4.96 4.83 6.58 7.42 10.41 7.35 3.75 6.08 6.32 5.17 8.44 3.59 6.23 16.24 9.76 8.09 16.41 4.57 2.64 7.69 5.80 6.51 0.71 — — 4.74 4.42 4.41 9.34 4.52 2.17 4.21 6.17 3.59 — 4.68 3.46 8.91 5.75 5.96 9.53 4.15 1.39 7.25 7.07 — 9.72 — — — 6.48 7.84 — — 3.32 4.61 5.17 — — — 2.52 10.15 6.84 5.79 2.16 9.19 — 4.90 — 9.21 9.04 3.55 0.95 8.74 8.87 14.28 9.34 8.14 2.24 8.63 4.55 2.07 7.09 2.68 4.21 12.59 8.38 10.06 5.88 8.52 12.29 6.28 4.51 98.11 96.81 79.16 84.48 85.25 84.08 108.26 82.45 94.03 103.62 97.03 106.42 93.78 102.39 93.55 106.69 108.38 96.47 106.60 96.84 88.49 84.72 90.29 103.44 60.25 70.82 87.24 124.18 64.03 52.36 61.09 28.29 58.60 90.18 56.90 77.89 71.16 61.25 68.06 78.72 11.34 35.36 55.38 10.41 69.08 76.67 52.53 66.51 1.19 1.56 1.25 1.27 1.06 1.11 1.31 0.98 1.16 0.83 1.37 1.09 1.06 1.30 1.19 1.22 1.21 1.76 1.38 1.03 1.09 1.47 1.01 1.02 1.19 1.56 1.15 1.16 1.05 1.11 1.31 0.98 1.16 0.83 1.37 1.09 1.06 1.30 1.19 1.00 1.20 1.45 1.40 1.03 1.08 1.47 1.01 1.02 181 141 791 89 4,791 777 3,675 2,799 66 4,320 4,852 6,792 253 1,884 3,478 317 6,040 132 1,042 1,941 6,693 611 237 2,245 -0.81 5.01 3.60 3.03 — Asset Class and Performance Benchmark Definitions Foreign stock funds typically have less than 20% of assets invested in the United States. Funds that do not have a specific growth or value orientation compared to a benchmark are classified as blend funds. World Stock funds invest primarily in equity securities of issuers located throughout the world and generally invest at least 20% of assets in the United States.
Regional funds generally hold high concentrations of securities from one specific geographic region. Emerging markets funds generally invest in securities from less developed countries. International investments are subject to risks such as currency fluctuations and political instability. Investing in emerging markets can accentuate these risks. If an expense waiver was in place during the period, the net expense ratio was used to calculate fund performance.
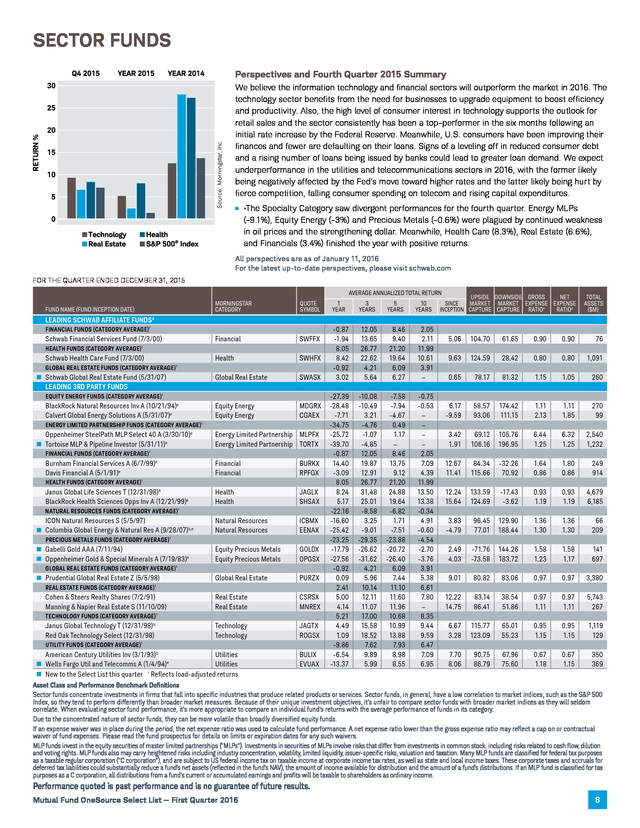
A net expense ratio lower than the gross expense ratio may reflect a cap on or contractual waiver of fund expenses. Please read the fund prospectus for details on limits or expiration dates for any such waivers. Performance quoted is past performance and is no guarantee of future results. Mutual Fund OneSource Select List — First Quarter 2016 7 . SECTOR FUNDS Perspectives and Fourth Quarter 2015 Summary We believe the information technology and financial sectors will outperform the market in 2016. The technology sector benefits from the need for businesses to upgrade equipment to boost efficiency and productivity. Also, the high level of consumer interest in technology supports the outlook for retail sales and the sector consistently has been a top-performer in the six months following an initial rate increase by the Federal Reserve. Meanwhile, U.S.
consumers have been improving their finances and fewer are defaulting on their loans. Signs of a leveling off in reduced consumer debt and a rising number of loans being issued by banks could lead to greater loan demand. We expect underperformance in the utilities and telecommunications sectors in 2016, with the former likely being negatively affected by the Fed’s move toward higher rates and the latter likely being hurt by fierce competition, falling consumer spending on telecom and rising capital expenditures. •The Specialty Category saw divergent performances for the fourth quarter.
Energy MLPs (-9.1%), Equity Energy (-3%) and Precious Metals (-0.6%) were plagued by continued weakness in oil prices and the strengthening dollar. Meanwhile, Health Care (8.3%), Real Estate (6.6%), and Financials (3.4%) finished the year with positive returns. All perspectives are as of January 11, 2016 For the latest up-to-date perspectives, please visit schwab.com FOR THE QUARTER ENDED DECEMBER 31, 2015 AVERAGE ANNUALIZED TOTAL RETURN MORNINGSTAR CATEGORY Financial SWFFX Health SWHFX Global Real Estate FUND NAME (FUND INCEPTION DATE) QUOTE SYMBOL SWASX Equity Energy Equity Energy MDGRX CGAEX 1 YEAR 3 YEARS 5 YEARS 10 YEARS -0.87 -1.94 8.05 8.42 -0.92 3.02 12.05 13.65 26.77 22.62 4.21 5.64 8.46 9.40 21.20 19.64 6.09 6.27 2.05 2.11 11.99 10.61 3.91 — -27.39 -28.48 -7.71 -34.75 -25.72 -39.70 -0.87 14.40 -3.09 8.05 8.24 5.17 -22.16 -16.60 -25.42 -23.25 -17.79 -27.56 -0.92 0.09 2.41 5.00 4.14 5.21 4.49 1.09 -9.86 -6.54 -13.37 -10.08 -10.49 3.21 -4.76 -1.07 -4.85 12.05 19.87 12.91 26.77 31.48 25.01 -8.58 3.25 -9.01 -29.35 -26.62 -31.62 4.21 5.96 10.14 12.11 11.07 17.00 15.58 18.52 7.62 9.89 5.99 -7.58 -7.94 -4.67 0.49 1.17 — 8.46 13.75 9.12 21.20 24.88 19.64 -6.82 1.71 -7.51 -23.88 -20.72 -26.40 6.09 7.44 11.10 11.60 11.96 10.68 10.99 13.88 7.93 8.98 8.55 -0.75 -0.53 — — — — 2.05 7.09 4.39 11.99 13.50 13.38 -0.34 4.91 -0.60 -4.54 -2.70 -3.76 3.91 5.38 6.61 7.80 — 8.35 9.44 9.59 6.47 7.09 6.95 UPSIDE DOWNSIDE GROSS NET SINCE MARKET MARKET EXPENSE EXPENSE INCEPTION CAPTURE CAPTURE RATIOa RATIOa TOTAL ASSETS ($M) LEADING SCHWAB AFFILIATE FUNDSd FINANCIAL FUNDS (CATEGORY AVERAGE) † Schwab Financial Services Fund (7/3/00) HEALTH FUNDS (CATEGORY AVERAGE) † Schwab Health Care Fund (7/3/00) GLOBAL REAL ESTATE FUNDS (CATEGORY AVERAGE) † Schwab Global Real Estate Fund (5/31/07) LEADING 3RD PARTY FUNDS EQUITY ENERGY FUNDS (CATEGORY AVERAGE) † BlackRock Natural Resources Inv A (10/21/94)e Calvert Global Energy Solutions A (5/31/07)e ENERGY LIMITED PARTNERSHIP FUNDS (CATEGORY AVERAGE) † Oppenheimer SteelPath MLP Select 40 A (3/30/10) e Tortoise MLP & Pipeline Investor (5/31/11)e Energy Limited Partnership MLPFX Energy Limited Partnership TORTX FINANCIAL FUNDS (CATEGORY AVERAGE) † Burnham Financial Services A (6/7/99) e Davis Financial A (5/1/91)e Financial Financial BURKX RPFGX Health Health JAGLX SHSAX Natural Resources Natural Resources ICBMX EENAX Equity Precious Metals Equity Precious Metals GOLDX OPGSX Global Real Estate PURZX Real Estate Real Estate CSRSX MNREX Technology Technology JAGTX ROGSX HEALTH FUNDS (CATEGORY AVERAGE) † Janus Global Life Sciences T (12/31/98)b BlackRock Health Sciences Opps Inv A (12/21/99)e NATURAL RESOURCES FUNDS (CATEGORY AVERAGE) † ICON Natural Resources S (5/5/97) Columbia Global Energy & Natural Res A (9/28/07)b,e PRECIOUS METALS FUNDS (CATEGORY AVERAGE) † Gabelli Gold AAA (7/11/94) Oppenheimer Gold & Special Minerals A (7/19/83)e GLOBAL REAL ESTATE FUNDS (CATEGORY AVERAGE) † Prudential Global Real Estate Z (5/5/98) REAL ESTATE FUNDS (CATEGORY AVERAGE) † Cohen & Steers Realty Shares (7/2/91) Manning & Napier Real Estate S (11/10/09) TECHNOLOGY FUNDS (CATEGORY AVERAGE) † Janus Global Technology T (12/31/98)b Red Oak Technology Select (12/31/98) UTILITY FUNDS (CATEGORY AVERAGE) † 5.06 104.70 61.65 0.90 0.90 76 9.63 124.59 28.42 0.80 0.80 1,091 0.65 78.17 81.32 1.15 1.05 260 6.17 -9.59 58.57 93.06 174.42 111.15 1.11 2.13 1.11 1.85 270 99 3.42 1.91 69.12 106.16 105.76 196.95 6.44 1.25 6.32 1.25 2,540 1,232 12.67 11.41 84.34 115.66 -32.26 70.92 1.64 0.86 1.80 0.86 249 914 12.24 15.64 133.59 124.69 -17.43 -3.62 0.93 1.19 0.93 1.19 4,679 6,185 3.83 -4.79 96.45 77.01 129.90 188.44 1.36 1.30 1.36 1.30 66 209 2.49 4.03 -71.76 -73.58 144.26 183.72 1.58 1.23 1.58 1.17 141 697 9.01 80.82 83.06 0.97 0.97 3,380 12.22 14.75 83.14 86.41 38.54 51.86 0.97 1.11 0.97 1.11 5,743 267 6.67 3.28 115.77 123.09 65.01 55.23 0.95 1.15 0.95 1.15 1,119 129 American Century Utilities Inv (3/1/93)b Utilities BULIX 7.70 90.75 67.96 0.67 0.67 350 Wells Fargo Util and Telecomms A (1/4/94)e Utilities EVUAX 8.06 86.79 75.60 1.18 1.15 369 New to the Select List this quarter † Reflects load-adjusted returns Asset Class and Performance Benchmark Definitions Sector funds concentrate investments in firms that fall into specific industries that produce related products or services. Sector funds, in general, have a low correlation to market indices, such as the S&P 500 Index, so they tend to perform differently than broader market measures.
Because of their unique investment objectives, it’s unfair to compare sector funds with broader market indices as they will seldom correlate. When evaluating sector fund performance, it’s more appropriate to compare an individual fund’s returns with the average performance of funds in its category. Due to the concentrated nature of sector funds, they can be more volatile than broadly diversified equity funds. If an expense waiver was in place during the period, the net expense ratio was used to calculate fund performance. A net expense ratio lower than the gross expense ratio may reflect a cap on or contractual waiver of fund expenses.
Please read the fund prospectus for details on limits or expiration dates for any such waivers. MLP funds invest in the equity securities of master limited partnerships (“MLPs”). Investments in securities of MLPs involve risks that differ from investments in common stock, including risks related to cash flow, dilution and voting rights. MLP funds also may carry heightened risks including industry concentration, volatility, limited liquidity, issuer-specific risks, valuation and taxation.
Many MLP funds are classified for federal tax purposes as a taxable regular corporation (“C corporation”), and are subject to US federal income tax on taxable income at corporate income tax rates, as well as state and local income taxes. These corporate taxes and accruals for deferred tax liabilities could substantially reduce a fund’s net assets (reflected in the fund’s NAV), the amount of income available for distribution and the amount of a fund’s distributions. If an MLP fund is classified for tax purposes as a C corporation, all distributions from a fund’s current or accumulated earnings and profits will be taxable to shareholders as ordinary income. Performance quoted is past performance and is no guarantee of future results. Mutual Fund OneSource Select List — First Quarter 2016 8 .
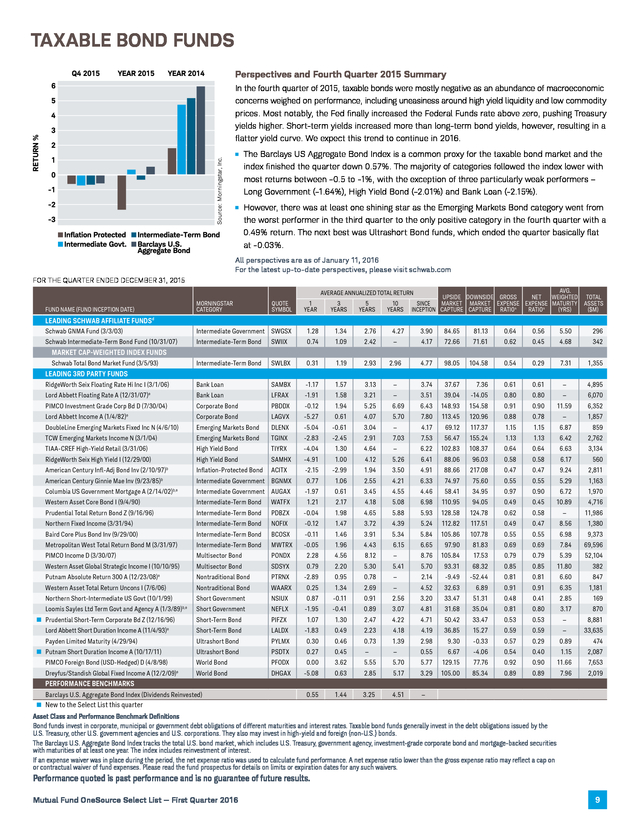
TAXABLE BOND FUNDS Perspectives and Fourth Quarter 2015 Summary In the fourth quarter of 2015, taxable bonds were mostly negative as an abundance of macroeconomic concerns weighed on performance, including uneasiness around high yield liquidity and low commodity prices. Most notably, the Fed finally increased the Federal Funds rate above zero, pushing Treasury yields higher. Short-term yields increased more than long-term bond yields, however, resulting in a flatter yield curve. We expect this trend to continue in 2016. The Barclays US Aggregate Bond Index is a common proxy for the taxable bond market and the index finished the quarter down 0.57%.
The majority of categories followed the index lower with most returns between -0.5 to -1%, with the exception of three particularly weak performers – Long Government (-1.64%), High Yield Bond (-2.01%) and Bank Loan (-2.15%). However, there was at least one shining star as the Emerging Markets Bond category went from the worst performer in the third quarter to the only positive category in the fourth quarter with a 0.49% return. The next best was Ultrashort Bond funds, which ended the quarter basically flat at -0.03%. All perspectives are as of January 11, 2016 For the latest up-to-date perspectives, please visit schwab.com FOR THE QUARTER ENDED DECEMBER 31, 2015 AVG. UPSIDE DOWNSIDE GROSS NET WEIGHTED TOTAL SINCE MARKET MARKET EXPENSE EXPENSE MATURITY ASSETS a a INCEPTION CAPTURE CAPTURE RATIO RATIO (YRS) ($M) AVERAGE ANNUALIZED TOTAL RETURN QUOTE SYMBOL 1 YEAR 3 YEARS Schwab GNMA Fund (3/3/03) Intermediate Government SWGSX 1.28 Schwab Intermediate-Term Bond Fund (10/31/07) Intermediate-Term Bond SWIIX 0.74 Intermediate-Term Bond SWLBX 0.31 RidgeWorth Seix Floating Rate Hi Inc I (3/1/06) Bank Loan SAMBX -1.17 Lord Abbett Floating Rate A (12/31/07) e Bank Loan LFRAX -1.91 PIMCO Investment Grade Corp Bd D (7/30/04) Corporate Bond PBDDX -0.12 1.94 Lord Abbett Income A (1/4/82) e Corporate Bond LAGVX -5.27 DoubleLine Emerging Markets Fixed Inc N (4/6/10) Emerging Markets Bond DLENX -5.04 TCW Emerging Markets Income N (3/1/04) Emerging Markets Bond TGINX -2.83 TIAA-CREF High-Yield Retail (3/31/06) High Yield Bond TIYRX RidgeWorth Seix High Yield I (12/29/00) High Yield Bond SAMHX American Century Infl-Adj Bond Inv (2/10/97)b Inflation-Protected Bond ACITX American Century Ginnie Mae Inv (9/23/85)b Intermediate Government BGNMX 0.77 1.06 Columbia US Government Mortgage A (2/14/02)b,e Intermediate Government AUGAX -1.97 0.61 Western Asset Core Bond I (9/4/90) Intermediate-Term Bond WATFX 1.21 2.17 Prudential Total Return Bond Z (9/16/96) Intermediate-Term Bond PDBZX -0.04 1.98 Northern Fixed Income (3/31/94) Intermediate-Term Bond NOFIX -0.12 1.47 3.72 4.39 5.24 Baird Core Plus Bond Inv (9/29/00) Intermediate-Term Bond BCOSX -0.11 1.46 3.91 5.34 5.84 Metropolitan West Total Return Bond M (3/31/97) Intermediate-Term Bond MWTRX -0.05 1.96 4.43 6.15 6.65 PIMCO Income D (3/30/07) Multisector Bond PONDX 2.28 4.56 8.12 — 8.76 Western Asset Global Strategic Income I (10/10/95) Multisector Bond SDSYX 0.79 2.20 5.30 5.41 5.70 Putnam Absolute Return 300 A (12/23/08) e Nontraditional Bond PTRNX -2.89 0.95 0.78 — Western Asset Total Return Uncons I (7/6/06) Nontraditional Bond WAARX 0.25 1.34 2.69 Northern Short-Intermediate US Govt (10/1/99) Short Government NSIUX 0.87 -0.11 Loomis Sayles Ltd Term Govt and Agency A (1/3/89)b,e Short Government NEFLX -1.95 -0.41 Prudential Short-Term Corporate Bd Z (12/16/96) Short-Term Bond PIFZX 1.07 1.30 Lord Abbett Short Duration Income A (11/4/93)e Short-Term Bond LALDX -1.83 0.49 Payden Limited Maturity (4/29/94) Ultrashort Bond PYLMX 0.30 0.46 Putnam Short Duration Income A (10/17/11) Ultrashort Bond PSDTX 0.27 0.45 PIMCO Foreign Bond (USD-Hedged) D (4/8/98) World Bond PFODX 0.00 Dreyfus/Standish Global Fixed Income A (12/2/09)e World Bond DHGAX -5.08 0.55 1.44 FUND NAME (FUND INCEPTION DATE) MORNINGSTAR CATEGORY 5 YEARS 10 YEARS 1.34 2.76 4.27 3.90 84.65 81.13 0.64 0.56 5.50 296 1.09 2.42 — 4.17 72.66 71.61 0.62 0.45 4.68 342 1.19 2.93 2.96 4.77 98.05 104.58 0.54 0.29 7.31 1,355 1.57 3.13 — 3.74 37.67 7.36 0.61 0.61 — 4,895 1.58 3.21 — 3.51 39.04 -14.05 0.80 0.80 — 6,070 5.25 6.69 6.43 148.93 154.58 0.91 0.90 11.59 6,352 0.61 4.07 5.70 7.80 113.45 120.96 0.88 0.78 — 1,857 -0.61 3.04 — 4.17 69.12 117.37 1.15 1.15 6.87 859 -2.45 2.91 7.03 7.53 56.47 155.24 1.13 1.13 6.42 2,762 -4.04 1.30 4.64 — 6.22 102.83 108.37 0.64 0.64 6.63 3,134 -4.91 1.00 4.12 5.26 6.41 88.06 96.03 0.58 0.58 6.17 560 -2.15 -2.99 1.94 3.50 4.91 88.66 217.08 0.47 0.47 9.24 2,811 2.55 4.21 6.33 74.97 75.60 0.55 0.55 5.29 1,163 3.45 4.55 4.46 58.41 34.95 0.97 0.90 6.72 1,970 4.18 5.08 6.98 110.95 94.05 0.49 0.45 10.89 4,716 4.65 5.88 5.93 128.58 124.78 0.62 0.58 — 11,986 112.82 117.51 0.49 0.47 8.56 1,380 105.86 107.78 0.55 0.55 6.98 9,373 97.90 81.83 0.69 0.69 7.84 69,596 105.84 17.53 0.79 0.79 5.39 52,104 93.31 68.32 0.85 0.85 11.80 382 2.14 -9.49 -52.44 0.81 0.81 6.60 847 — 4.52 32.63 6.89 0.91 0.91 6.35 1,181 0.91 2.56 3.20 33.47 51.31 0.48 0.41 2.85 169 0.89 3.07 4.81 31.68 35.04 0.81 0.80 3.17 870 2.47 4.22 4.71 50.42 33.47 0.53 0.53 — 8,881 2.23 4.18 4.19 36.85 15.27 0.59 0.59 — 33,635 0.73 1.39 2.98 9.30 -0.33 0.57 0.29 0.89 474 — — 0.55 6.67 -4.06 0.54 0.40 1.15 2,087 3.62 5.55 5.70 5.77 129.15 77.76 0.92 0.90 11.66 7,653 0.63 2.85 5.17 3.29 105.00 85.34 0.89 0.89 7.96 2,019 3.25 4.51 — LEADING SCHWAB AFFILIATE FUNDS d MARKET CAP-WEIGHTED INDEX FUNDS Schwab Total Bond Market Fund (3/5/93) LEADING 3RD PARTY FUNDS PERFORMANCE BENCHMARKS Barclays U.S. Aggregate Bond Index (Dividends Reinvested) New to the Select List this quarter Asset Class and Performance Benchmark Definitions Bond funds invest in corporate, municipal or government debt obligations of different maturities and interest rates.
Taxable bond funds generally invest in the debt obligations issued by the U.S. Treasury, other U.S. government agencies and U.S.
corporations. They also may invest in high-yield and foreign (non-U.S.) bonds. The Barclays U.S. Aggregate Bond Index tracks the total U.S.
bond market, which includes U.S. Treasury, government agency, investment-grade corporate bond and mortgage-backed securities with maturities of at least one year. The index includes reinvestment of interest. If an expense waiver was in place during the period, the net expense ratio was used to calculate fund performance.
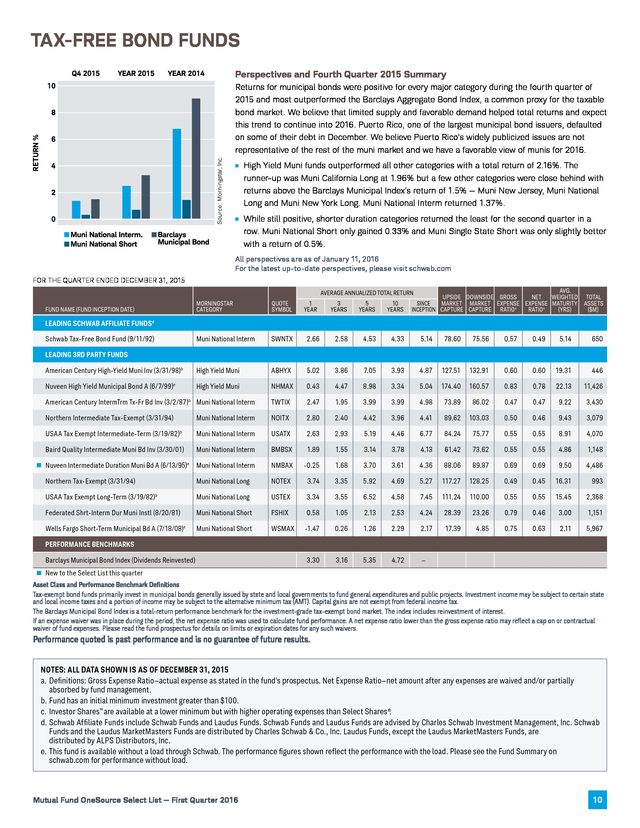
A net expense ratio lower than the gross expense ratio may reflect a cap on or contractual waiver of fund expenses. Please read the fund prospectus for details on limits or expiration dates for any such waivers. Performance quoted is past performance and is no guarantee of future results. Mutual Fund OneSource Select List — First Quarter 2016 9 . TAX-FREE BOND FUNDS Perspectives and Fourth Quarter 2015 Summary Returns for municipal bonds were positive for every major category during the fourth quarter of 2015 and most outperformed the Barclays Aggregate Bond Index, a common proxy for the taxable bond market. We believe that limited supply and favorable demand helped total returns and expect this trend to continue into 2016. Puerto Rico, one of the largest municipal bond issuers, defaulted on some of their debt in December. We believe Puerto Rico’s widely publicized issues are not representative of the rest of the muni market and we have a favorable view of munis for 2016. High Yield Muni funds outperformed all other categories with a total return of 2.16%.
The runner-up was Muni California Long at 1.96% but a few other categories were close behind with returns above the Barclays Municipal Index’s return of 1.5% — Muni New Jersey, Muni National Long and Muni New York Long. Muni National Interm returned 1.37%. While still positive, shorter duration categories returned the least for the second quarter in a row. Muni National Short only gained 0.33% and Muni Single State Short was only slightly better with a return of 0.5%. All perspectives are as of January 11, 2016 For the latest up-to-date perspectives, please visit schwab.com FOR THE QUARTER ENDED DECEMBER 31, 2015 AVG. UPSIDE DOWNSIDE GROSS NET WEIGHTED TOTAL SINCE MARKET MARKET EXPENSE EXPENSE MATURITY ASSETS a a INCEPTION CAPTURE CAPTURE RATIO RATIO (YRS) ($M) AVERAGE ANNUALIZED TOTAL RETURN MORNINGSTAR CATEGORY QUOTE SYMBOL 3 YEARS 5 YEARS 10 YEARS Muni National Interm SWNTX 2.66 2.58 4.53 4.33 American Century High-Yield Muni Inv (3/31/98)b High Yield Muni Nuveen High Yield Municipal Bond A (6/7/99)e High Yield Muni ABHYX 5.02 3.86 7.05 3.93 4.87 127.51 NHMAX 0.43 4.47 8.98 3.34 5.04 174.40 American Century IntermTrm Tx-Fr Bd Inv (3/2/87)b Muni National Interm TWTIX 2.47 1.95 3.99 3.99 4.98 73.89 Northern Intermediate Tax-Exempt (3/31/94) Muni National Interm NOITX 2.80 2.40 4.42 3.96 4.41 Muni National Interm USATX 2.63 2.93 5.19 4.46 6.77 FUND NAME (FUND INCEPTION DATE) 1 YEAR LEADING SCHWAB AFFILIATE FUNDSd Schwab Tax-Free Bond Fund (9/11/92) 5.14 78.60 75.56 0.57 0.49 5.14 650 132.91 0.60 0.60 19.31 446 160.57 0.83 0.78 22.13 11,426 86.02 0.47 0.47 9.22 3,430 89.62 103.03 0.50 0.46 9.43 3,079 84.24 75.77 0.55 0.55 8.91 4,070 LEADING 3RD PARTY FUNDS USAA Tax Exempt Intermediate-Term (3/19/82) b Baird Quality Intermediate Muni Bd Inv (3/30/01) Muni National Interm BMBSX 1.89 1.55 3.14 3.78 4.13 61.42 73.62 0.55 0.55 4.86 1,148 Nuveen Intermediate Duration Muni Bd A (6/13/95)e Muni National Interm NMBAX -0.25 1.68 3.70 3.61 4.36 88.06 89.87 0.69 0.69 9.50 4,486 Northern Tax-Exempt (3/31/94) Muni National Long NOTEX 3.74 3.35 5.92 4.69 5.27 117.27 128.25 0.49 0.45 16.31 993 Muni National Long USTEX 3.34 3.55 6.52 4.58 7.45 111.24 110.00 0.55 0.55 15.45 2,368 Federated Shrt-Interm Dur Muni Instl (8/20/81) Muni National Short FSHIX 0.58 1.05 2.13 2.53 4.24 28.39 23.26 0.79 0.46 3.00 1,151 Wells Fargo Short-Term Municipal Bd A (7/18/08)e Muni National Short WSMAX -1.47 0.26 1.26 2.29 2.17 17.39 4.85 0.75 0.63 2.11 5,967 3.30 3.16 5.35 4.72 — USAA Tax Exempt Long-Term (3/19/82) b PERFORMANCE BENCHMARKS Barclays Municipal Bond Index (Dividends Reinvested) New to the Select List this quarter Asset Class and Performance Benchmark Definitions Tax-exempt bond funds primarily invest in municipal bonds generally issued by state and local governments to fund general expenditures and public projects.
Investment income may be subject to certain state and local income taxes and a portion of income may be subject to the alternative minimum tax (AMT). Capital gains are not exempt from federal income tax. The Barclays Municipal Bond Index is a total-return performance benchmark for the investment-grade tax-exempt bond market. The index includes reinvestment of interest. If an expense waiver was in place during the period, the net expense ratio was used to calculate fund performance.
A net expense ratio lower than the gross expense ratio may reflect a cap on or contractual waiver of fund expenses. Please read the fund prospectus for details on limits or expiration dates for any such waivers. Performance quoted is past performance and is no guarantee of future results. NOTES: ALL DATA SHOWN IS AS OF DECEMBER 31, 2015 a. Definitions: Gross Expense Ratio—actual expense as stated in the fund’s prospectus. Net Expense Ratio—net amount after any expenses are waived and/or partially absorbed by fund management. b. Fund has an initial minimum investment greater than $100. c. Investor Shares™ are available at a lower minimum but with higher operating expenses than Select Shares® . d. Schwab Affiliate Funds include Schwab Funds and Laudus Funds.
Schwab Funds and Laudus Funds are advised by Charles Schwab Investment Management, Inc. Schwab Funds and the Laudus MarketMasters Funds are distributed by Charles Schwab & Co., Inc. Laudus Funds, except the Laudus MarketMasters Funds, are distributed by ALPS Distributors, Inc. e. This fund is available without a load through Schwab.
The performance figures shown reflect the performance with the load. Please see the Fund Summary on schwab.com for performance without load. Mutual Fund OneSource Select List — First Quarter 2016 10 . ADDITIONAL FUND CATEGORIES FOR THE QUARTER ENDED DECEMBER 31, 2015 AVERAGE ANNUALIZED TOTAL RETURN FUND NAME (FUND INCEPTION DATE) MORNINGSTAR CATEGORY QUOTE SYMBOL 1 YEAR 3 YEARS 5 YEARS 10 YEARS UPSIDE DOWNSIDE GROSS NET SINCE MARKET MARKET EXPENSE EXPENSE INCEPTION CAPTURE CAPTURE RATIO a RATIO a TOTAL ASSETS ($M) BALANCED FUNDS—LEADING SCHWAB AFFILIATE FUNDSd Schwab® Monthly Income Fund—Enhanced Payout (3/28/08) Conservative Allocation SWKRX 0.02 3.66 4.47 — 4.21 59.21 54.30 0.72 0.57 Schwab® Monthly Income Fund—Moderate Payout (3/28/08) Conservative Allocation SWJRX -0.24 4.91 5.29 — 4.62 79.52 73.14 0.91 0.66 97 48 Schwab Balanced Fund (11/18/96) Moderate Allocation SWOBX 0.92 9.14 8.19 5.39 6.44 110.57 70.69 0.71 0.62 287 Putnam Dynamic Asset Allocation Gr A (2/8/94)e Aggressive Allocation PAEAX -6.01 8.54 7.43 5.34 7.26 148.48 116.73 1.07 1.07 2,215 American Century One Choice Agrsv Inv (9/30/04)b Aggressive Allocation AOGIX -1.26 8.52 7.72 6.21 7.09 133.81 119.94 0.98 0.98 1,043 JPMorgan Income Builder A (5/31/07)e Conservative Allocation JNBAX -5.40 2.35 4.56 — 4.31 93.09 110.92 1.11 0.75 12,074 American Century One Choice VryCnsrv Inv (9/30/04)b Conservative Allocation AONIX -1.12 2.86 4.03 4.33 4.41 53.25 55.04 0.68 0.68 369 Villere Balanced Inv (9/30/99) Moderate Allocation VILLX -8.24 3.00 7.56 6.00 7.54 100.65 137.22 0.89 0.89 521 Oakmark Equity & Income I (11/1/95)b Moderate Allocation OAKBX -4.60 8.22 6.82 6.62 10.16 119.53 98.79 0.74 0.74 17,670 BlackRock Global Allocation Inv A (10/21/94)e World Allocation MDLOX -6.25 3.01 2.97 5.22 8.61 94.56 100.34 1.13 1.13 48,537 Loomis Sayles Global Equity and Income A (2/1/06)b,e World Allocation LGMAX -4.32 4.62 5.49 6.69 6.33 121.92 123.42 1.16 1.16 1,402 Schwab Target 2015 Fund (3/12/08) Target Date 2011-2015 SWGRX 0.32 5.81 5.99 — 4.85 83.31 67.44 0.64 0.53 112 Schwab Target 2020 Fund (7/1/05) Target Date 2016-2020 SWCRX 0.20 7.18 6.99 5.23 5.65 103.42 84.44 0.65 0.61 531 Schwab Target 2025 Fund (3/12/08) Target Date 2021-2025 SWHRX 0.17 8.21 7.67 — 6.50 118.38 96.88 0.73 0.67 409 Schwab Target 2030 Fund (7/1/05) Target Date 2026-2030 SWDRX 0.04 8.99 8.10 5.97 6.40 129.80 106.65 0.75 0.72 784 Schwab Target 2035 Fund (3/12/08) Target Date 2031-2035 SWIRX -0.10 9.69 8.55 — 6.99 140.14 115.50 0.82 0.75 337 Schwab Target 2040 Fund (7/1/05) Target Date 2036-2040 SWERX -0.18 10.21 8.89 6.40 6.89 147.94 122.25 0.82 0.78 824 Schwab Target 2045 Fund (1/23/13) Target Date 2041-2045 SWMRX -0.21 — — — 9.19 — — 1.12 0.80 67 Schwab Target 2050 Fund (1/23/13) Target Date 2046-2050 SWNRX -0.21 — — — 9.46 — — 1.20 0.81 54 Schwab Target 2055 Fund (1/23/13) Target Date 2051+ SWORX -0.40 — — — 9.51 — — 1.50 0.82 30 American Century One Choice 2025 Inv (8/31/04)b Target Date 2021-2025 ARWIX -1.52 6.27 6.49 5.53 6.31 99.19 89.28 0.83 0.83 2,547 American Century One Choice 2030 Inv (5/30/08)b Target Date 2026-2030 ARCVX -1.37 7.00 6.90 — 4.77 107.22 93.51 0.85 0.85 1,745 American Century One Choice 2035 Inv (8/31/04)b Target Date 2031-2035 ARYIX -1.23 7.80 7.40 5.85 6.83 116.18 98.54 0.87 0.87 2,033 American Century One Choice 2040 Inv (5/30/08)b Target Date 2036-2040 ARDVX -1.32 8.46 7.82 — 5.23 125.34 105.82 0.90 0.90 1,315 American Century One Choice 2045 Inv (8/31/04)b Target Date 2041-2045 AROIX -1.38 8.98 8.11 6.14 7.18 133.32 112.90 0.94 0.94 1,461 American Century One Choice 2050 Inv (5/30/08)b Target Date 2046-2050 ARFVX -1.59 9.12 8.23 — 5.10 136.27 116.25 0.96 0.96 773 American Century One Choice 2055 Inv (3/31/11)b Target Date 2051+ AREVX -1.64 9.36 — — 7.79 139.10 118.05 0.97 0.97 265 Long/Short Equity SWHEX -0.39 8.15 6.76 3.96 6.44 63.80 77.28 2.02 1.33 210 -16.94 -10.24 -8.18 -2.96 -1.34 48.88 51.56 1.17 0.99 1,854 -22.36 -16.08 — — -12.40 62.38 76.75 1.24 0.95 107 Glenmede Secured Options (6/30/10) Commodities Broad Basket SKIRX Commodities Broad EAPCX Basket Long/Short Equity GTSOX 6.98 8.39 8.45 — 11.52 49.11 38.03 0.87 0.87 384 Glenmede Long/Short (9/29/06) Long/Short Equity GTAPX 0.27 6.21 5.66 — 1.76 36.91 29.06 2.48 1.22 209 JPMorgan Multi-Cap Market Neutral A (5/23/03)e Market Neutral OGNAX -4.12 0.40 0.16 -0.06 0.84 36.04 -14.36 3.26 1.25 272 AC Alternatives™ Market Neutral Val Inv (10/31/11)b Market Neutral ACVVX 3.68 2.79 — — 3.22 21.91 -51.48 4.20 1.62 213 S&P 500 Index® (Dividends Reinvested) 1.38 15.13 12.57 7.31 — Barclays U.S. Aggregate Bond Index (Dividends Reinvested) 0.55 1.44 3.25 4.51 — BALANCED FUNDS—LEADING 3RD PARTY FUNDS TARGET DATE FUNDS—LEADING SCHWAB AFFILIATE FUNDSd TARGET DATE FUNDS—LEADING 3RD PARTY FUNDS ALTERNATIVE FUNDS—LEADING SCHWAB AFFILIATE FUNDSd Schwab Hedged Equity Fund (9/3/02) ALTERNATIVE FUNDS—LEADING 3RD PARTY FUNDS Deutsche Enhanced Commodity Strat Instl (2/14/05) Parametric Commodity Strategy Investor (1/3/12) PERFORMANCE BENCHMARKS New to the Select List this quarter Asset Class Definitions Balanced funds invest in a mix of stocks, bonds and cash within one fund and are classified into two categories. Conservative Allocation funds may invest 20% to 50% of assets in equities and 50% to 80% of assets in fixed income and cash. Moderate Allocation funds may invest 50% to 70% of assets in equities, with the balance invested in fixed income and cash.
Convertible funds invest primarily in bonds and preferred stocks that can be converted into common stocks. Target maturity or “Lifecycle” funds are managed for investors planning to retire (or to begin withdrawing substantial portions of their investments) in a particular year. These funds provide both asset allocation and rebalancing for investors following an investment strategy that grows more conservative as the target date approaches. Commodity-related products, including futures, carry a high level of risk and are not suitable for all investors.
Commodity-related products may be extremely volatile, illiquid and can be significantly affected by underlying commodity prices, world events, import controls, worldwide competition, government regulations, and economic conditions, regardless of the length of time shares are held. Investments in commodity-related products may subject the fund to significantly greater volatility than investments in traditional securities and involve substantial risks, including risk of loss of a significant portion of their principal value. If an expense waiver was in place during the period, the net expense ratio was used to calculate fund performance. A net expense ratio lower than the gross expense ratio may reflect a cap on or contractual waiver of fund expenses.
Please read the fund prospectus for details on limits or expiration dates for any such waivers. Performance quoted is past performance and is no guarantee of future results. Data provided by Morningstar, Inc. ©2015 by Morningstar, Inc. All rights reserved.
The information contained herein is the proprietary information of Morningstar, Inc., and may not be copied or redistributed for any purpose and may only be used for noncommercial, personal purposes. The information contained herein is not represented or warranted to be accurate, correct, complete or timely. Morningstar, Inc., shall not be responsible for investment decisions, damages or other losses resulting from use of this information.
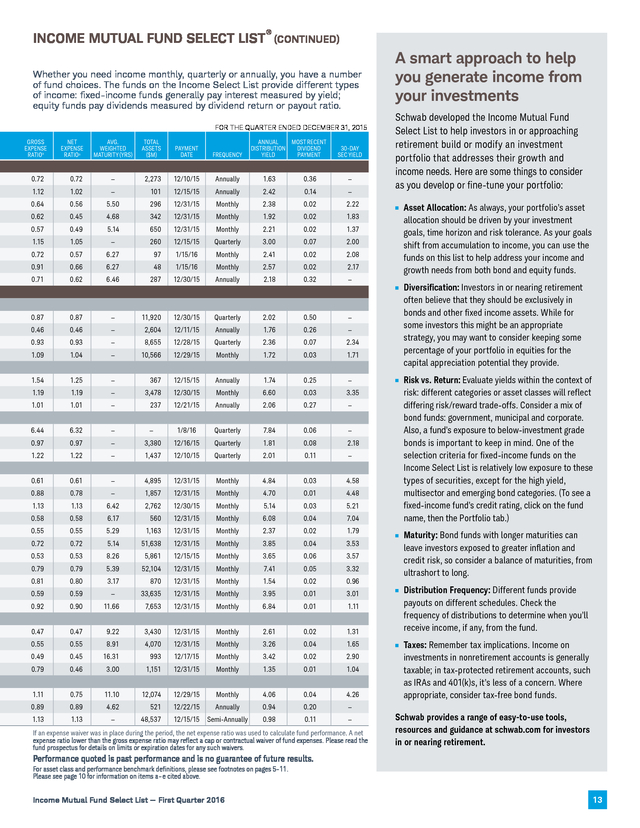
Morningstar, Inc., has not granted consent for it to be considered or deemed an “expert” under the Securities Act of 1933. Mutual Fund OneSource Select List — First Quarter 2016 11 . INCOME MUTUAL FUND SELECT LIST ® Schwab’s Income Mutual Fund Select List was developed and is managed by the Charles Schwab Investment Advisory, Inc. (CSIA) experts and includes mutual funds that have met their rigorous criteria, including both quantitative and qualitative factors. All are no-load and no-transaction fee and are selected based on their ability to generate income in their respective asset classes. The list is designed to help you achieve income and growth.
For more information on how funds are selected, see pages 4 and 14. FOR THE QUARTER ENDED DECEMBER 31, 2015 AVERAGE ANNUALIZED TOTAL RETURN MORNINGSTAR CATEGORY Large Blend FUND NAME (FUND INCEPTION DATE) QUOTE SYMBOL 1 YEAR 3 YEARS 5 YEARS 10 YEARS 6.80 SINCE INCEPTION UPSIDE MARKET CAPTURE DOWNSIDE MARKET CAPTURE LEADING SCHWAB AFFILIATE FUNDSd Schwab Core Equity Fund (7/1/96) SWANX 0.55 14.92 11.90 Laudus Mondrian International Equity Fund — Select Shares (6/17/08)b,* Foreign Large Value LIEFX -1.86 5.26 4.02 — 8.14 101.33 105.14 -0.38 110.99 Schwab GNMA Fund (3/3/03) Intermediate Government SWGSX 1.28 1.34 2.76 89.00 4.27 3.90 84.65 Schwab Intermediate-Term Bond Fund (10/31/07) Intermediate-Term Bond SWIIX 0.74 1.09 81.13 2.42 — 4.17 72.66 71.61 Schwab Tax-Free Bond Fund (9/11/92) Muni National Interm SWNTX 2.66 Schwab Global Real Estate Fund (5/31/07) Global Real Estate SWASX 3.02 2.58 4.53 4.33 5.14 78.60 75.56 5.64 6.27 — 0.65 78.17 Schwab ® Monthly Income Fund — Enhanced Payout (3/28/08) Conservative Allocation SWKRX 0.02 81.32 3.66 4.47 — 4.21 59.21 54.30 Schwab ® Monthly Income Fund — Moderate Payout (3/28/08) Conservative Allocation SWJRX Schwab Balanced Fund (11/18/96) Moderate Allocation SWOBX -0.24 4.91 5.29 — 4.62 79.52 73.14 0.92 9.14 8.19 5.39 6.44 110.57 70.69 Parnassus Core Equity Investor (8/31/92) Large Blend PRBLX -0.55 15.12 TIAA-CREF Social Choice Eq Retail (3/31/06) Large Blend TICRX -2.70 13.08 12.68 9.89 10.50 97.83 94.77 10.39 6.62 6.27 96.10 109.57 American Century Equity Income Inv (8/1/94)b Large Value TWEIX 0.60 10.57 JPMorgan Equity Income A (2/18/92)e Large Value OIEIX -7.63 11.21 9.32 6.79 10.38 72.28 74.73 10.81 7.10 8.30 92.42 99.16 Tocqueville International Value (8/1/94) Foreign Large Blend TIVFX 7.27 7.78 Henderson Global Equity Income A (11/30/06)e Foreign Large Value HFQAX -6.19 3.59 4.78 4.50 5.69 100.81 63.35 4.68 — 2.68 93.55 68.06 Perkins Global Value T (6/29/01)b World Stock JGVAX -2.08 7.69 7.25 4.90 6.28 90.29 52.53 Oppenheimer SteelPath MLP Select 40 A (3/30/10) e Energy Limited Partnership MLPFX -25.72 -1.07 Prudential Global Real Estate Z (5/5/98) Global Real Estate PURZX 0.09 5.96 1.17 — 3.42 69.12 105.76 7.44 5.38 9.01 80.82 Cohen & Steers Real Estate Securities A (9/2/97)e Real Estate CSEIX 2.52 12.26 11.92 83.06 7.29 9.53 90.02 35.35 RidgeWorth Seix Floating Rate Hi Inc I (3/1/06) Bank Loan SAMBX -1.17 1.57 3.13 — 3.74 37.67 7.36 Lord Abbett Income A (1/4/82)e Corporate Bond LAGVX -5.27 0.61 4.07 5.70 7.80 113.45 120.96 TCW Emerging Markets Income N (3/1/04) Emerging Markets Bond TGINX -2.83 -2.45 2.91 7.03 7.53 56.47 155.24 RidgeWorth Seix High Yield I (12/29/00) High Yield Bond SAMHX -4.91 1.00 4.12 5.26 6.41 88.06 96.03 American Century Ginnie Mae Inv (9/23/85)b Intermediate Government BGNMX 0.77 1.06 2.55 4.21 6.33 74.97 75.60 DoubleLine Total Return Bond N (4/6/10) Intermediate-Term Bond DLTNX 2.07 2.73 5.22 — 7.34 96.41 57.07 USAA Income (3/4/74)b Intermediate-Term Bond USAIX -1.11 1.49 3.63 4.86 8.13 100.51 99.47 PIMCO Income D (3/30/07) Multisector Bond PONDX 2.28 4.56 8.12 — 8.76 105.84 17.53 Loomis Sayles Ltd Term Govt and Agency A (1/3/89)b,e Short Government NEFLX -1.95 -0.41 0.89 3.07 4.81 31.68 35.04 Lord Abbett Short Duration Income A (11/4/93)e Short-Term Bond LALDX -1.83 0.49 2.23 4.18 4.19 36.85 15.27 PIMCO Foreign Bond (USD-Hedged) D (4/8/98) World Bond PFODX 0.00 3.62 5.55 5.70 5.77 129.15 77.76 American Century IntermTrm Tx-Fr Bd Inv (3/2/87)b Muni National Interm TWTIX 2.47 1.95 3.99 3.99 4.98 73.89 86.02 USAA Tax Exempt Intermediate-Term (3/19/82)b Muni National Interm USATX 2.63 2.93 5.19 4.46 6.77 84.24 75.77 Northern Tax-Exempt (3/31/94) Muni National Long NOTEX 3.74 3.35 5.92 4.69 5.27 117.27 128.25 Federated Shrt-Interm Dur Muni Instl (8/20/81) Muni National Short FSHIX 0.58 1.05 2.13 2.53 4.24 28.39 23.26 JPMorgan Income Builder A (5/31/07)e Conservative Allocation JNBAX -5.40 2.35 4.56 — 4.31 93.09 110.92 Villere Balanced Inv (9/30/99) Moderate Allocation VILLX -8.24 3.00 7.56 6.00 7.54 100.65 137.22 BlackRock Global Allocation Inv A (10/21/94)e World Allocation MDLOX -6.25 3.01 2.97 5.22 8.61 94.56 100.34 LEADING 3RD PARTY FUNDS DOMESTIC INTERNATIONAL SECTOR TAXABLE BOND TAX-FREE BOND BALANCED FUNDS New to the Select List this quarter *$50,000 initial minimum investment Definitions 30-day SEC Yield: Based on a fund’s most recently reported portfolio holdings, this measure shows the income an investor would earn if invested in that fund for the subsequent 12 months. Although a fund’s holdings are likely to change over that time, the SEC yield provides a yardstick for comparing the income potential across funds within the same category. Annual Distribution Yield: This measure looks back at the actual payouts of a mutual fund over the past 12 months. It provides an accurate picture of the fund’s recent short-term distributions without any forward anticipation.
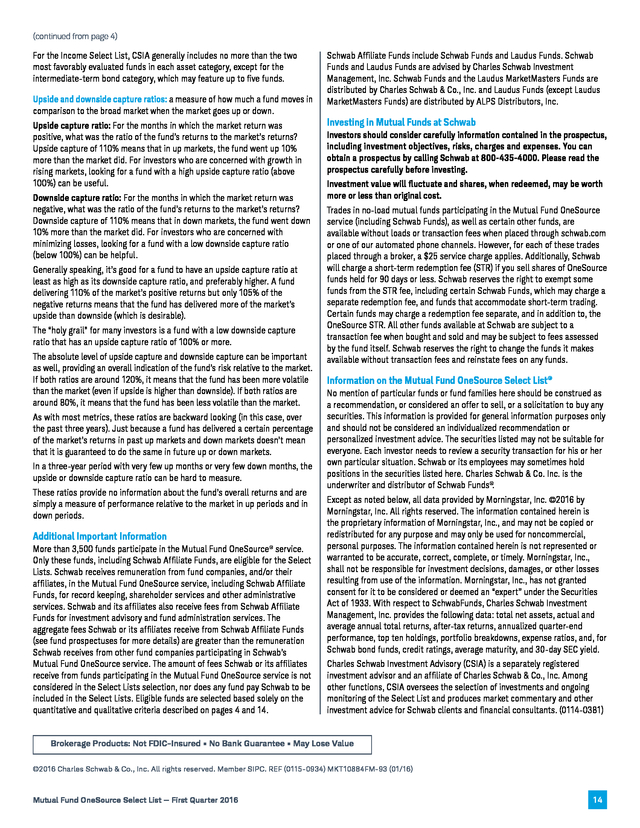
The Income Select List shows the 12-month dividend and interest return for each fund in the form of a percentage of its share price (also known as “payout ratio”). The yield does not include long- or short-term capital gains distributions. Income Mutual Fund Select List — First Quarter 2016 12 . INCOME MUTUAL FUND SELECT LIST ® (CONTINUED) Whether you need income monthly, quarterly or annually, you have a number of fund choices. The funds on the Income Select List provide different types of income: fixed-income funds generally pay interest measured by yield; equity funds pay dividends measured by dividend return or payout ratio. FOR THE QUARTER ENDED DECEMBER 31, 2015 GROSS EXPENSE RATIOa NET EXPENSE RATIOa AVG. WEIGHTED MATURITY (YRS) TOTAL ASSETS ($M) PAYMENT DATE FREQUENCY ANNUAL MOST RECENT DISTRIBUTION DIVIDEND YIELD PAYMENT 30-DAY SEC YIELD 0.72 0.72 — 2,273 12/10/15 Annually 1.63 0.36 1.12 1.02 — 101 12/15/15 Annually 2.42 0.14 — — 0.64 0.56 5.50 296 12/31/15 Monthly 2.38 0.02 2.22 0.62 0.45 4.68 342 12/31/15 Monthly 1.92 0.02 1.83 0.57 0.49 5.14 650 12/31/15 Monthly 2.21 0.02 1.37 1.15 1.05 — 260 12/15/15 Quarterly 3.00 0.07 2.00 0.72 0.57 6.27 97 1/15/16 Monthly 2.41 0.02 2.08 0.91 0.66 6.27 48 1/15/16 Monthly 2.57 0.02 2.17 0.71 0.62 6.46 287 12/30/15 Annually 2.18 0.32 — — 0.87 0.87 — 11,920 12/30/15 Quarterly 2.02 0.50 0.46 0.46 — 2,604 12/11/15 Annually 1.76 0.26 — 0.93 0.93 — 8,655 12/28/15 Quarterly 2.36 0.07 2.34 1.09 1.04 — 10,566 12/29/15 Monthly 1.72 0.03 1.71 1.54 1.25 — 367 12/15/15 Annually 1.74 0.25 — 1.19 1.19 — 3,478 12/30/15 Monthly 6.60 0.03 3.35 1.01 1.01 — 237 12/21/15 Annually 2.06 0.27 — 6.44 6.32 — — 1/8/16 Quarterly 7.84 0.06 — 0.97 0.97 — 3,380 12/16/15 Quarterly 1.81 0.08 2.18 1.22 1.22 — 1,437 12/10/15 Quarterly 2.01 0.11 — 0.61 0.61 — 4,895 12/31/15 Monthly 4.84 0.03 4.58 0.88 0.78 — 1,857 12/31/15 Monthly 4.70 0.01 4.48 1.13 1.13 6.42 2,762 12/30/15 Monthly 5.14 0.03 5.21 0.58 0.58 6.17 560 12/31/15 Monthly 6.08 0.04 7.04 0.55 0.55 5.29 1,163 12/31/15 Monthly 2.37 0.02 1.79 0.72 0.72 5.14 51,638 12/31/15 Monthly 3.85 0.04 3.53 0.53 0.53 8.26 5,861 12/15/15 Monthly 3.65 0.06 3.57 0.79 0.79 5.39 52,104 12/31/15 Monthly 7.41 0.05 3.32 0.81 0.80 3.17 870 12/31/15 Monthly 1.54 0.02 0.96 0.59 0.59 — 33,635 12/31/15 Monthly 3.95 0.01 3.01 0.92 0.90 11.66 7,653 12/31/15 Monthly 6.84 0.01 1.11 0.47 0.47 9.22 3,430 12/31/15 Monthly 2.61 0.02 1.31 0.55 0.55 8.91 4,070 12/31/15 Monthly 3.26 0.04 1.65 0.49 0.45 16.31 993 12/17/15 Monthly 3.42 0.02 2.90 0.79 0.46 3.00 1,151 12/31/15 Monthly 1.35 0.01 1.04 1.11 0.75 11.10 12,074 12/29/15 Monthly 4.06 0.04 4.26 0.89 0.89 4.62 521 12/22/15 Annually 0.94 0.20 1.13 — 48,537 12/15/15 Semi-Annually 0.98 0.11 — Schwab developed the Income Mutual Fund Select List to help investors in or approaching retirement build or modify an investment portfolio that addresses their growth and income needs. Here are some things to consider as you develop or fine-tune your portfolio: Asset Allocation: As always, your portfolio’s asset allocation should be driven by your investment goals, time horizon and risk tolerance. As your goals shift from accumulation to income, you can use the funds on this list to help address your income and growth needs from both bond and equity funds. Diversification: Investors in or nearing retirement often believe that they should be exclusively in bonds and other fixed income assets.
While for some investors this might be an appropriate strategy, you may want to consider keeping some percentage of your portfolio in equities for the capital appreciation potential they provide. Risk vs. Return: Evaluate yields within the context of risk: different categories or asset classes will reflect differing risk/reward trade-offs. Consider a mix of bond funds: government, municipal and corporate. Also, a fund’s exposure to below-investment grade bonds is important to keep in mind.
One of the selection criteria for fixed-income funds on the Income Select List is relatively low exposure to these types of securities, except for the high yield, multisector and emerging bond categories. (To see a fixed-income fund’s credit rating, click on the fund name, then the Portfolio tab.) Maturity: Bond funds with longer maturities can leave investors exposed to greater inflation and credit risk, so consider a balance of maturities, from ultrashort to long. Distribution Frequency: Different funds provide payouts on different schedules. Check the frequency of distributions to determine when you’ll receive income, if any, from the fund. Taxes: Remember tax implications.
Income on investments in nonretirement accounts is generally taxable; in tax-protected retirement accounts, such as IRAs and 401(k)s, it’s less of a concern. Where appropriate, consider tax-free bond funds. — 1.13 A smart approach to help you generate income from your investments If an expense waiver was in place during the period, the net expense ratio was used to calculate fund performance. A net expense ratio lower than the gross expense ratio may reflect a cap or contractual waiver of fund expenses.
Please read the fund prospectus for details on limits or expiration dates for any such waivers. Schwab provides a range of easy-to-use tools, resources and guidance at schwab.com for investors in or nearing retirement. Performance quoted is past performance and is no guarantee of future results. For asset class and performance benchmark definitions, please see footnotes on pages 5–11. Please see page 10 for information on items a–e cited above. Income Mutual Fund Select List — First Quarter 2016 13 . (continued from page 4) For the Income Select List, CSIA generally includes no more than the two most favorably evaluated funds in each asset category, except for the intermediate-term bond category, which may feature up to five funds. Upside and downside capture ratios: a measure of how much a fund moves in comparison to the broad market when the market goes up or down. Upside capture ratio: For the months in which the market return was positive, what was the ratio of the fund’s returns to the market’s returns? Upside capture of 110% means that in up markets, the fund went up 10% more than the market did. For investors who are concerned with growth in rising markets, looking for a fund with a high upside capture ratio (above 100%) can be useful. Downside capture ratio: For the months in which the market return was negative, what was the ratio of the fund’s returns to the market’s returns? Downside capture of 110% means that in down markets, the fund went down 10% more than the market did. For investors who are concerned with minimizing losses, looking for a fund with a low downside capture ratio (below 100%) can be helpful. Generally speaking, it’s good for a fund to have an upside capture ratio at least as high as its downside capture ratio, and preferably higher. A fund delivering 110% of the market’s positive returns but only 105% of the negative returns means that the fund has delivered more of the market’s upside than downside (which is desirable). The “holy grail” for many investors is a fund with a low downside capture ratio that has an upside capture ratio of 100% or more. The absolute level of upside capture and downside capture can be important as well, providing an overall indication of the fund’s risk relative to the market. If both ratios are around 120%, it means that the fund has been more volatile than the market (even if upside is higher than downside).
If both ratios are around 80%, it means that the fund has been less volatile than the market. As with most metrics, these ratios are backward looking (in this case, over the past three years). Just because a fund has delivered a certain percentage of the market’s returns in past up markets and down markets doesn’t mean that it is guaranteed to do the same in future up or down markets. In a three-year period with very few up months or very few down months, the upside or downside capture ratio can be hard to measure. These ratios provide no information about the fund’s overall returns and are simply a measure of performance relative to the market in up periods and in down periods. Additional Important Information More than 3,500 funds participate in the Mutual Fund OneSource® service. Only these funds, including Schwab Affiliate Funds, are eligible for the Select Lists. Schwab receives remuneration from fund companies, and/or their affiliates, in the Mutual Fund OneSource service, including Schwab Affiliate Funds, for record keeping, shareholder services and other administrative services.
Schwab and its affiliates also receive fees from Schwab Affiliate Funds for investment advisory and fund administration services. The aggregate fees Schwab or its affiliates receive from Schwab Affiliate Funds (see fund prospectuses for more details) are greater than the remuneration Schwab receives from other fund companies participating in Schwab’s Mutual Fund OneSource service. The amount of fees Schwab or its affiliates receive from funds participating in the Mutual Fund OneSource service is not considered in the Select Lists selection, nor does any fund pay Schwab to be included in the Select Lists.
Eligible funds are selected based solely on the quantitative and qualitative criteria described on pages 4 and 14. Schwab Affiliate Funds include Schwab Funds and Laudus Funds. Schwab Funds and Laudus Funds are advised by Charles Schwab Investment Management, Inc. Schwab Funds and the Laudus MarketMasters Funds are distributed by Charles Schwab & Co., Inc.
and Laudus Funds (except Laudus MarketMasters Funds) are distributed by ALPS Distributors, Inc. Investing in Mutual Funds at Schwab Investors should consider carefully information contained in the prospectus, including investment objectives, risks, charges and expenses. You can obtain a prospectus by calling Schwab at 800-435-4000. Please read the prospectus carefully before investing. Investment value will fluctuate and shares, when redeemed, may be worth more or less than original cost. Trades in no-load mutual funds participating in the Mutual Fund OneSource service (including Schwab Funds), as well as certain other funds, are available without loads or transaction fees when placed through schwab.com or one of our automated phone channels.
However, for each of these trades placed through a broker, a $25 service charge applies. Additionally, Schwab will charge a short-term redemption fee (STR) if you sell shares of OneSource funds held for 90 days or less. Schwab reserves the right to exempt some funds from the STR fee, including certain Schwab Funds, which may charge a separate redemption fee, and funds that accommodate short-term trading. Certain funds may charge a redemption fee separate, and in addition to, the OneSource STR.
All other funds available at Schwab are subject to a transaction fee when bought and sold and may be subject to fees assessed by the fund itself. Schwab reserves the right to change the funds it makes available without transaction fees and reinstate fees on any funds. Information on the Mutual Fund OneSource Select List® No mention of particular funds or fund families here should be construed as a recommendation, or considered an offer to sell, or a solicitation to buy any securities. This information is provided for general information purposes only and should not be considered an individualized recommendation or personalized investment advice.
The securities listed may not be suitable for everyone. Each investor needs to review a security transaction for his or her own particular situation. Schwab or its employees may sometimes hold positions in the securities listed here.
Charles Schwab & Co. Inc. is the underwriter and distributor of Schwab Funds®. Except as noted below, all data provided by Morningstar, Inc.
©2016 by Morningstar, Inc. All rights reserved. The information contained herein is the proprietary information of Morningstar, Inc., and may not be copied or redistributed for any purpose and may only be used for noncommercial, personal purposes.
The information contained herein is not represented or warranted to be accurate, correct, complete, or timely. Morningstar, Inc., shall not be responsible for investment decisions, damages, or other losses resulting from use of the information. Morningstar, Inc., has not granted consent for it to be considered or deemed an “expert” under the Securities Act of 1933.
With respect to SchwabFunds, Charles Schwab Investment Management, Inc. provides the following data: total net assets, actual and average annual total returns, after-tax returns, annualized quarter-end performance, top ten holdings, portfolio breakdowns, expense ratios, and, for Schwab bond funds, credit ratings, average maturity, and 30-day SEC yield. Charles Schwab Investment Advisory (CSIA) is a separately registered investment advisor and an affiliate of Charles Schwab & Co., Inc. Among other functions, CSIA oversees the selection of investments and ongoing monitoring of the Select List and produces market commentary and other investment advice for Schwab clients and financial consultants.
(0114-0381) Brokerage Products: Not FDIC-Insured • No Bank Guarantee • May Lose Value ©2016 Charles Schwab & Co., Inc. All rights reserved. Member SIPC.
REF (0115-0934) MKT10884FM-93 (01/16) Mutual Fund OneSource Select List — First Quarter 2016 14 .
That’s where automatic investing can help. subsequent mutual fund purchases for the majority of funds participating in its Mutual Fund OneSource service. Opening the Door to More Investors A pioneer in the fund supermarket model, Schwab developed Mutual Fund OneSource to provide investors access to a large number of funds and fund families through a single account, with no loads or transaction fees. Always looking to further increase the attractiveness of the platform and to enable more investors to take advantage of it, Schwab recently lowered its initial investment minimums on Mutual Fund OneSource funds from $2,500 to as little as $100 for most funds. And once an initial position has been established, subsequent, ongoing investments in that fund can now be made for as little as $1, down from $500.
The changes apply to most funds participating in Schwab’s Mutual Fund OneSource service—including the vast majority of funds listed in the Mutual Fund OneSource Select List. As with all Mutual Fund OneSource funds, initial and subsequent mutual fund investments incur no transaction fees.1 Recognizing the challenges and temptations that can potentially derail investors or lead to less-than-optimal timing decisions, Schwab has long encouraged investors to put the strategy of dollar-cost averaging to work for them through AIP. And with the lower minimums for initial investments, AIP becomes available for small accounts and to investors who don’t have a lot to invest upfront but want to build their portfolio over the long term. Dollar-Cost Averaging: A Prudent Strategy Dollar-cost averaging is a wealth-building strategy that involves investing a fixed amount of money at regular intervals over a long period regardless of share price.
Many investors may already be practicing it if they participate in a 401(k) or 403(b) retirement plan in which contributions are made through regular payroll deductions. Instead of purchasing shares of one or more mutual funds in a single lump sum, dollar-cost averaging allows investors to spread their purchases over a longer period of time. In so doing, investors can reduce the impact of short-term market moves, which typically smooth out over time. Benefits of Lower Minimums Here’s how it works: Every month (or other regular interval), Lower minimum investments are meaningful for more than just you invest a set amount of money in one or more mutual funds, small or first-time investors.
Among the benefits: regardless of how the overall market is performing. The net result • By committing a smaller amount, investors can reduce or alleviate concerns about getting into the market at the wrong time, especially during volatile markets. • Lower minimums can make it easier for investors to branch out beyond a single-fund portfolio solution, increasing their diversification across multiple funds and asset classes. is that when prices are lower, your fixed investment buys more shares; and when prices are higher, it buys fewer. As an example, let’s say you decide to invest $400 a month in a noload mutual fund. The table below illustrates the implementation of such a plan over a hypothetical six-month period, during which the share price of the fund fluctuated considerably. Amount invested Price per share No.
of shares purchased Month 1 $400 $14.28 28 Month 2 $400 $13.33 30 Month 3 $400 $12.50 32 Month 4 $400 $12.90 31 Month 5 $400 $13.79 29 Month 6 $400 $12.12 33 • Lower minimums allow investors exposure to areas of the market that may previously have been inaccessible to them. • Lower minimums allow more investors to immediately participate in Schwab’s Automatic Investment Program (AIP), which provides an easy way to employ a dollar-cost averaging strategy. Beyond Getting Started: The Importance of Ongoing Investing While getting started is key, over the long term, investors face a potentially far bigger challenge that can have an enormous impact on their ability to reach their financial goals: investing regularly. Mutual Fund OneSource Select List — First Quarter 2016 This example is hypothetical and does not project or predict investment results. Actual results will vary. (continued on page 3) 2 . Opportunities Expanded With Lower Minimums for Funds in Schwab OneSource® (continued) If, instead of employing dollar-cost averaging, you had used the entire $2,400 at the outset to buy fund shares at their then-price of $14.28 per share, you would have purchased 168 shares. In this example, due to the fluctuation of the fund’s share price, at the end of the six-month period you would have had 183 shares, purchased at an average price of $13.15 per share. Of course, no strategy—dollar-cost averaging included—can protect against losses when share prices tumble. And in a rising market, it would make more sense to have purchased shares earlier, at a lower price. But without the benefit of hindsight, one never knows where prices are headed. Schwab’s lower investment minimums have the potential to give a whole new group of investors the ability to grow their portfolio over time.
Regardless of the size of the contribution, it’s surprising how it can accrue given the power of compounding. Here are a few examples: Over 15 years Advantages of dollar-cost averaging: • Overcomes procrastination. Because regular investments are smaller, it can be easier for investors to get started and to stay on track. • Maintains market participation.
Dollar-cost averaging ensures participation in the market regardless of its conditions, removing the temptation to try to guess when the time is “right” to invest. • Minimizes regret. Whether it’s sitting out a market rally or investing a large amount just before markets tumble, there’s always the potential for second-guessing one’s investment strategy. Dollar-cost averaging helps reduce it. Over 30 years Amount invested monthly Total invested Balance Total invested Balance The Bottom Line $50 $9,000 $13,364 $18,000 $41,613 Long-term investing entails a frame of mind as well as a series $100 $18,000 $26,729 $36,000 $83,226 $250 $45,000 $66,822 $90,000 $208,065 $500 $90,000 $133,644 $180,000 $416,129 of decisions and actions (or inactions).
It requires persistence and discipline. But getting started sooner rather than later and regularly adding to your investments are two tangible steps you can take to greatly increase the likelihood of meeting your long-term financial goals. And with Schwab’s new lower minimums This example is hypothetical and does not project or predict investment results.
It assumes an annual return of 5%, with interest compounded monthly. Actual results will vary. available for more than 500 fund families and thousands of Combining dollar-cost averaging with mutual funds is especially easier or more cost-efficient to build a diversified portfolio. no-load, no-transaction-fee mutual funds, it has never been attractive in that it helps investors reduce both their market risk and their company-specific risk. Spreading out investments regularly over time reduces the market risk—the risk of a poorly timed investment into a falling market—while the inherent diversification of a mutual fund spreads investor risk across many securities so that weakness among some are potentially offset by strength in others. Want to establish Schwab’s Automatic Investment Plan? Online: www.schwab.com/AIP | By phone: (800) 435-4000 1 Please see “Investing in Mutual Funds at Schwab” on page 14 regarding other fees that may apply. Mutual Fund OneSource Select List — First Quarter 2016 (0216-0337) 3 .
How Funds Are Selected To build the Schwab Mutual Fund OneSource Select List and the Schwab Income Mutual Fund Select List, Charles Schwab Investment Advisory, Inc. (CSIA) starts by analyzing the funds tracked by Morningstar using quantitative and qualitative selection criteria described below. Then, based on its analysis, CSIA builds the Mutual Fund OneSource Select List and Income Select list by selecting the most favorably evaluated OneSource funds, including Schwab Funds and Laudus Funds (“Schwab Affiliate Funds”), within each Morningstar category. Most of the funds on the List are actively managed OneSource funds. In addition, CSIA also includes up to one Schwab Affilate Fund that is a market-cap weighted index fund for each of the large-cap, small-cap, international and taxable bond asset classes, and one Schwab Affiliate Fund that is a fundamentally weighted index fund for each of the large cap, small cap, developed large cap international, developed small cap international and emerging market asset classes.
Visit the OneSource Select List on schwab.com to view the Select List online and to learn more about how index funds are selected. Eligibility Requirements Each OneSource Select List and Income Select List fund must: Be no-load and open to new investors at Schwab in all 50 states. Have a minimum three-year performance track record (except funds that are listed below the “Leading Schwab Affiliate Funds” sections of the lists, which are eligible if they have a minimum 12 months performance track record under their current management and/or current investment objectives and strategy). Have at least $40 million in assets (except for small-cap value, high yield, multisector bond, world bond, emerging market equity and bond, diversified Pacific Asia, Pacific Asia ex-Japan, Europe, Japan, Latin America, convertibles, retirement income, target date and specialty funds, which require at least $20 million in assets). To meet this requirement, assets in multiple share classes of the same fund may be aggregated. Additionally, each Income Select List fund must: Demonstrate a track record of making income distributions in each of the prior five calendar years (or during every full calendar year since inception in the case of funds with less than a five-year track record, including Schwab Affiliate Funds which may have a 12-month track record). For fixed income funds, make income distributions on at least a quarterly basis; and—with the exception of the high-yield, multisector and emerging markets bond categories—not allocate in excess of 30% to issues rated below investment grade. For equity funds, offer a current yield in excess of their category average; and for equity funds with “dividend” or “income” in their name, make income distributions at least quarterly. With the exception of specialty sector (REITs) and fixed income funds, not allocate in excess of 33% to any single sector. Selection Criteria Actively Managed OneSource Funds, including Schwab Affiliate Funds, are evaluated by CSIA based on a quantitative analysis of risk, performance, expenses, active share (when meaningful), assets under management and asset flows. CSIA also may apply additional qualitative factors to its analysis to enhance its overall evaluation of a fund, including, for example, changes in a fund’s investment strategy or management structure, portfolio manager tenure, whether a fund’s investment style and portfolio holdings are representative of its investment category, portfolio composition and turnover rates, consistency of a fund’s performance and CSIA’s evaluation of the fund over time, and other risk and diversification considerations. In addition, for the Income Select List, those funds with the best capital preservation attributes and investment strategies that focus on selecting income-generating securities will receive preference when selecting from similarly rated funds with comparable yield characteristics. Mutual Fund OneSource Select List — First Quarter 2016 “Leading Schwab Affiliate Funds” sections of the Select List and Income Select List feature eligible actively managed Schwab Affiliate Funds that generally fall into the top 35 percent of all CSIA-evaluated funds (including OneSource and non-OneSource funds) in their respective Morningstar categories.
If two or more Schwab Affiliate Funds that fit this criteria also have similar investment styles, CSIA may determine that only the most favorably evaluated fund(s) be included in the list. Because Schwab Affiliate Funds included in the “Leading Schwab Affiliate Funds” section of the OneSource Select List and Income Select List are selected independently from other actively managed funds on the list, they may have a less favorable evaluation overall than the funds listed in the “Leading Third-Party Funds” section of the list. The Index Funds section of the Select List features only Schwab Affiliate Funds. It includes up to one market capitalization weighted index fund for each of the large-cap, small-cap, international and taxable bond asset classes and one fundamentally weighted index fund for each of the large cap, small cap, developed large cap international, developed small cap international and emerging market asset classes.
A market capitalization weighted index fund is a fund that attempts to match the performance of an established list of securities, where the securities with the highest market capitalization (total market value of outstanding stock) get the most weight. A fundamentally weighted index fund is a fund that attempts to match the performance of an established list of securities, where the securities with the highest fundamental value (measured based on criteria such as sales, cash flow, dividends and stock buybacks) get the most weight. A Schwab Affiliate fund that is market capitalization weighted and a Schwab Affiliate Fund that is fundamentally weighted are included unless no funds meet Schwab’s quantitative and qualitative evaluation criteria. The Schwab affiliate index fund that receives the most favorable evaluation by CSIA in each asset class is included on the Select List. If two index funds receive equal evaluations, CSIA will generally include the fund that has the lower expense ratio. “Leading Third-Party Funds” sections of the OneSource Select List and Income Select List feature eligible actively managed third-party OneSource funds that generally fall within the top 35 percent of all CSIA-evaluated funds within a given Morningstar category and that receive the most favorable evaluations in their respective categories. For the OneSource Select List, CSIA generally includes the five most-favorably evaluated funds in each of the large-cap, small-cap, intermediate-term bond, municipal national intermediate and foreign large blend asset categories and the two most favorably evaluated funds in all other asset categories.
If two or more of the most favorably evaluated funds within an asset category have similar investment styles, CSIA may substitute a less-favorably evaluated fund for one or more of those funds to provide a more diverse selection of fund investment strategies. (continued on page 14) 4 . LARGE-CAP U.S. STOCK FUNDS Perspectives and Fourth Quarter 2015 Summary Our view is that the U.S. bull market for stocks will push ahead in 2016 with continued volatility and corrections. After nearly seven years, the bull market is in a more mature phase, with weaker earnings and revenue growth, and recently narrow market breadth.
Market corrections should be contained due to subdued investor sentiment and healthy leading indicators that suggest a U.S. recession is a distant risk. We continue to reinforce the benefits of broad and global asset class diversification during a more difficult market environment. 2015 ended the year with the Standard & Poor 500 Composite Index up 1.38% for the year after a 7.04% return for the fourth quarter. Stocks rebounded from the large downturn in the third quarter with doubt over the Federal Reserve’s actions subsiding with the announcement of a rate increase in December. Large-cap U.S.
stocks continued to outperform Small-cap U.S. stocks. Large-cap Growth, Large-cap Blend and Large-cap Value all rallied from the third quarter losses with returns of 6.7%, 5.6% and 4.7%, respectively. All perspectives are as of January 11, 2016 For the latest up-to-date perspectives, please visit schwab.com FOR THE QUARTER ENDED DECEMBER 31, 2015 1 YEAR AVERAGE ANNUALIZED TOTAL RETURN UPSIDE DOWNSIDE GROSS NET 3 5 10 SINCE MARKET MARKET EXPENSE EXPENSE YEARS YEARS YEARS INCEPTION CAPTURE CAPTURE RATIO a RATIO a TOTAL ASSETS ($M) MORNINGSTAR CATEGORY QUOTE SYMBOL Schwab Core Equity Fund (7/1/96) Large Blend SWANX 0.55 14.92 11.90 6.80 8.14 101.33 105.14 0.72 0.72 2,273 Laudus U.S.
Large-Cap Growth Fund (10/14/97) Large Growth LGILX 6.28 16.73 13.72 9.72 6.60 102.78 92.05 0.77 0.77 2,201 Schwab Dividend Equity Fund (9/2/03) Large Value SWDSX -3.52 12.33 11.03 6.69 8.33 96.83 118.43 0.89 0.89 1,782 Large Value SFLNX -2.96 13.51 11.16 — 6.64 96.71 107.04 0.39 0.35 4,646 Large Blend SWPPX 1.29 15.02 12.48 7.27 — 99.61 100.06 0.09 0.09 21,367 INTECH US Mgd Volatility T (7/6/09)b Large Blend JRSTX 3.13 15.12 12.42 6.55 15.78 92.92 82.62 0.95 0.95 289 Parnassus Core Equity Investor (8/31/92) Large Blend PRBLX -0.55 15.12 12.68 9.89 10.50 97.83 94.77 0.87 0.87 11,920 Glenmede Large Cap Core Port (2/27/04) Large Blend GTLOX 1.67 17.61 14.50 8.42 8.74 105.75 91.33 0.87 0.87 1,748 Prudential Jennison Equity Opportunity Z (11/7/96) Large Blend PJGZX -2.08 12.39 10.41 7.31 9.91 90.96 103.40 0.80 0.80 456 Oakmark I (8/5/91) 17,083 FUND NAME (FUND INCEPTION DATE) LEADING SCHWAB AFFILIATE FUNDSd FUNDAMENTAL INDEX FUNDS Schwab Fundamental U.S. Large Company Index Fund (4/2/07) MARKET CAP-WEIGHTED INDEX FUNDS Schwab ® S&P 500 Index Fund (5/19/97) LEADING 3RD PARTY FUNDS Large Blend OAKMX -3.95 13.71 12.61 8.49 12.51 103.26 121.14 0.87 0.87 Parnassus (12/27/84) Large Growth PARNX 0.27 15.56 13.07 9.74 10.01 103.23 103.94 0.84 0.84 755 Nicholas (7/14/69) Large Growth NICSX -2.95 16.19 14.00 9.05 11.39 101.74 94.42 0.72 0.72 3,484 Large Growth JACTX 12.00 17.16 13.11 8.95 14.45 99.80 80.79 0.77 0.77 2,337 b Janus Forty T (7/6/09)b Janus Research T (5/3/93) Large Growth JAMRX 5.33 17.49 12.69 9.00 11.06 102.29 83.88 0.80 0.80 4,698 Glenmede Large Cap Growth (2/27/04) Large Growth GTLLX 4.13 19.75 15.37 9.23 9.35 110.02 82.48 0.88 0.88 2,065 American Century Equity Income Inv (8/1/94)b Large Value TWEIX 0.60 10.57 9.32 6.79 10.38 72.28 74.73 0.93 0.93 8,655 JPMorgan Large Cap Value A (2/18/92)e Large Value OLVAX -7.19 12.89 9.73 5.46 6.90 101.24 104.80 1.11 0.93 723 Delaware Value® A (9/14/98)b,e Large Value DDVAX -6.26 12.24 11.97 6.73 6.84 93.23 89.35 0.98 0.98 9,468 Commerce Value (3/3/97) Large Value CFVLX -0.92 13.06 12.53 6.36 6.11 90.48 95.93 0.71 0.70 187 JPMorgan Equity Income A (2/18/92)e Large Value OIEIX -7.63 11.21 10.81 7.10 8.30 92.42 99.16 1.09 1.04 10,566 Schwab 1000 Index® (Dividends Reinvested) 1.06 14.98 12.34 7.46 — S&P 500 Index (Dividends Reinvested) 1.38 15.13 12.57 7.31 — b PERFORMANCE BENCHMARKS ® New to the Select List this quarter Asset Class and Performance Benchmark Definitions Large-cap U.S. stock funds invest primarily in stocks that fall in the top 70% of the U.S.
market capitalization range as defined by Morningstar, Inc. Growth funds invest in companies that may be experiencing rapid growth in earnings, sales or return on equity. Value funds invest in companies that may have share prices below estimated fair market value, undervalued assets, an opportunity to “turnaround” or lower price-to-earnings or price-to-book ratios.
Blend funds invest in a combination of value and growth stocks. The S&P 500® Index includes common stocks of 500 widely held companies. S&P 500 is a registered trademark of The McGraw-Hill Co., Inc. If an expense waiver was in place during the period, the net expense ratio was used to calculate fund performance. A net expense ratio lower than the gross expense ratio may reflect a cap on or contractual waiver of fund expenses.
Please read the fund prospectus for details on limits or expiration dates for any such waivers. Performance quoted is past performance and is no guarantee of future results. Current performance may be lower or higher. Visit schwab.com for month’s end performance information.
Investment value will fluctuate, and shares, when redeemed, may be worth more or less than original cost. Mutual Fund OneSource Select List — First Quarter 2016 5 . MID- AND SMALL-CAP U.S. STOCK FUNDS Perspectives and Fourth Quarter 2015 Summary Our view of a difficult market environment in 2016 will likely be felt by smaller-cap domestic stocks as well, while the expected bouts of volatility could drain risk appetites to the detriment of the group. However, the strong U.S. dollar, continued domestic labor market growth, lower energy costs, and the wage tailwinds that appear to be setting up likely bode well for the all-important U.S.
consumer. As always, we do not recommend making market cap bets and encourage investors to stick to long-term asset allocation goals according to your risk tolerance. Small-cap U.S. stocks were down -4.41% for the year with investors sticking with higher-quality, less volatile, Large and Mega-cap stocks.
Small-cap U.S. stocks recovered from the third quarter with Small Growth, Small Blend and Small Value returning 2.8%, 2.7% and 2.0%, respectively. Mid-cap U.S. stocks outperformed Small-cap for the year with the Russell Mid Cap ® down -2.44% for 2015.
Mid Growth, Mid Value and Mid Blend came back from heavy third quarter losses returning 3.3%, 2.7% and 2.4%, respectively, in the fourth quarter. All perspectives are as of January 11, 2016 For the latest up-to-date perspectives, please visit schwab.com FOR THE QUARTER ENDED DECEMBER 31, 2015 AVERAGE ANNUALIZED TOTAL RETURN UPSIDE DOWNSIDE GROSS NET 3 5 10 SINCE MARKET MARKET EXPENSE EXPENSE YEARS YEARS YEARS INCEPTION CAPTURE CAPTURE RATIOa RATIOa MORNINGSTAR CATEGORY QUOTE SYMBOL 1 YEAR Small Blend SWSCX -3.69 13.86 12.34 Small Blend SFSNX -5.03 12.43 9.39 Small Blend SWSSX -4.41 11.65 Parnassus Mid-Cap (4/29/05) Mid-Cap Blend PARMX -0.87 Hennessy Cornerstone Mid Cap 30 Inv (9/17/03) Mid-Cap Blend HFMDX 0.02 Janus Enterprise T (9/1/92)b Mid-Cap Growth JAENX 3.32 14.74 Buffalo Discovery (4/16/01) Mid-Cap Growth BUFTX 5.64 16.90 Perkins Select Value T (12/15/11)b Mid-Cap Value JSVTX 0.20 9.63 TIAA-CREF Mid-Cap Value Retail (10/1/02) Mid-Cap Value TCMVX -5.65 Wasatch Small Cap Value (12/17/97) Small Blend WMCVX Tributary Small Company Instl (6/10/96) Small Blend FOSCX Perritt MicroCap Opportunities Investor (5/2/88) Small Blend PRCGX Columbia Select Smaller-Cap Value A (4/25/97)b,e Small Blend Lord Abbett Small Cap Value A (12/13/95)e Small Blend Conestoga Small Cap Investors (10/1/02) Small Growth Wasatch Core Growth (12/8/86) Small Growth Rice Hall James Small Cap Instl (11/1/96) Small Growth RHJMX -1.42 11.49 10.97 TIAA-CREF Small-Cap Equity Retail (10/1/02) Small Growth TCSEX -0.24 14.05 10.06 Driehaus Micro Cap Growth (1/2/03) Small Growth DMCRX -0.55 20.11 10.82 Perkins Small Cap Value T (10/21/87)b Small Value JSCVX -2.66 10.64 7.35 Victory Sycamore Small Company Opp A (3/26/99)e Small Value SSGSX -6.43 9.80 8.48 Federated Clover Small Value A (2/28/96)e Small Value VSFAX -11.68 7.51 5.95 American Beacon Zebra Small Cap Eq Inv (6/1/10) Small Value AZSPX -4.03 12.25 9.54 — -4.41 11.65 9.19 6.80 FUND NAME (FUND INCEPTION DATE) TOTAL ASSETS ($M) LEADING SCHWAB AFFILIATE FUNDSd Schwab Small-Cap Equity Fund (7/1/03) 6.36 10.38 105.07 124.21 1.11 1.11 600 — 7.10 100.51 126.51 0.44 0.35 1,343 9.55 7.60 8.15 95.12 120.74 0.21 0.17 2,602 12.25 11.62 8.84 8.59 84.66 89.27 1.09 0.99 554 14.72 12.38 8.55 11.12 105.67 117.70 1.17 1.17 1,010 11.76 9.41 10.50 85.73 68.39 0.92 0.92 6,396 13.69 10.47 8.60 93.87 68.54 1.01 1.01 943 — — 10.77 72.35 84.04 1.01 0.89 78 11.94 9.73 7.15 11.46 90.44 106.40 0.72 0.72 4,972 0.00 13.96 10.33 6.41 11.72 92.92 93.43 1.20 1.20 283 -0.63 12.48 9.42 8.64 8.91 91.45 103.77 1.32 1.22 256 -6.09 11.25 6.96 5.35 9.29 79.45 85.89 1.21 1.21 339 SSCVX -9.52 12.21 8.12 6.85 8.49 109.29 128.97 1.36 1.36 454 LRSCX -6.85 8.27 6.01 7.24 11.75 86.79 112.00 1.20 1.20 1,212 CCASX 8.03 14.03 11.47 8.83 11.14 93.39 93.98 1.24 1.10 661 WGROX 3.92 12.80 12.45 7.50 12.03 88.98 94.66 1.18 1.18 1,220 8.17 9.07 89.87 109.36 1.51 1.25 45 6.79 10.38 97.08 102.86 0.83 0.83 2,864 10.20 17.97 111.85 83.76 1.59 1.59 282 7.58 12.04 85.16 105.95 0.81 0.81 1,330 7.56 9.24 94.00 114.69 1.31 1.31 2,797 6.08 10.14 86.20 118.95 1.45 1.27 681 12.34 92.38 108.29 1.83 1.28 21 FUNDAMENTAL INDEX FUNDS Schwab Fundamental U.S. Small Co Index Fund (4/2/07) MARKET CAP-WEIGHTED INDEX FUNDS Schwab Small-Cap Index Fund (5/19/97) LEADING 3RD PARTY FUNDS PERFORMANCE BENCHMARK Russell 2000 Index® (Dividends Reinvested) — New to the Select List this quarter Asset Class and Performance Benchmark Definitions Mid-cap U.S. stock funds invest primarily in stocks that fall in the next 20% of the U.S.
market capitalization range following large-cap stocks. Small-cap U.S. stock funds generally invest in stocks falling in the bottom 10% of the range.
Definitions based on Morningstar, Inc. Growth funds invest in companies that may be experiencing rapid growth in earnings, sales or return on equity. Value funds invest in companies that may have share prices below estimated fair market value, undervalued assets, an opportunity to “turnaround” or lower price-to-earnings or price-to-book ratios. Blend funds invest in a combination of value and growth stocks.
The Russell 2000® Index consists of the 2,000 smallest companies in the Russell 3000® Index, which represents approximately 98% of the total market value of publicly available domestic equities. Small-cap funds are subject to greater volatility than those in other asset categories. If an expense waiver was in place during the period, the net expense ratio was used to calculate fund performance. A net expense ratio lower than the gross expense ratio may reflect a cap on or contractual waiver of fund expenses. Please read the fund prospectus for details on limits or expiration dates for any such waivers. Performance quoted is past performance and is no guarantee of future results. Mutual Fund OneSource Select List — First Quarter 2016 6 .
INTERNATIONAL STOCK FUNDS Perspectives and Fourth Quarter 2015 Summary Some of the most attractive global stock markets in 2016 may be found among non-U.S. developed markets, such as Europe and Japan, where profit growth momentum and the central bank impact on valuations may be more favorable. Emerging market stocks, including China, may modestly underperform developed international due to weak earnings growth and currency volatility. The MSCI EAFE Index, a broad representation of non-U.S developed market equities, was up by 4.8%, amid a seesaw fourth quarter of monetary stimulus and sluggish economic growth. Japanese stocks gained 8% in the backdrop of a mild recession and corporate governance reforms.
The Europe category returned 2.6% helped by the European Central Bank’s stimulus measures and improving exports. Emerging Markets posted a modest gain of 0.7%, mostly helped by the China category which returned 5.7% as China’s central bank cut interest rates for the sixth time in a year, while investors battled persistent fears of a slowing Chinese economy. The Latin America category lost 2.7% dragged down by a weakening Brazilian real and declining Brazilian and Mexican stocks. Foreign fund investors experienced positive returns across all categories with Foreign Small/Mid Growth (5.2%) and Foreign Large Growth (4.6%) posting top performance while Foreign Small/Mid Value (3.5%) and Foreign Large Value (2.7%) trailed their growth counterparts. FOR THE QUARTER ENDED DECEMBER 31, 2015 FUND NAME (FUND INCEPTION DATE) All perspectives are as of January 11, 2016 For the latest up-to-date perspectives, please visit schwab.com MORNINGSTAR CATEGORY LEADING SCHWAB AFFILIATE FUNDSd Schwab ® International Core Equity Fund (5/30/08) Foreign Large Blend Laudus Mondrian International Equity Fund—Select (6/17/08)b,* Foreign Large Value FUNDAMENTAL INDEX FUNDS Schwab Fundamental Emerg Mkts Lg Co Index (1/31/08) Diversified Emerging Mkts Schwab Fundamental Intl Large Co Index (4/2/07) Foreign Large Value Schwab Fundamental Intl Small Co Index (1/31/08) Foreign Small/Mid Blend MARKET CAP-WEIGHTED INDEX FUNDS Schwab International Index Fund (5/19/97) Foreign Large Blend LEADING 3RD PARTY FUNDS Matthews China Dividend Investor (11/30/09) China Region Columbia Greater China A (5/16/97)b,e China Region Seafarer Overseas Gr and Income Investor (2/15/12) Diversified Emerging Mkts Manning & Napier Emerging Markets S (11/16/11) Diversified Emerging Mkts Matthews Asia Dividend Investor (10/31/06) Diversified Pacific/Asia Matthews Asia Growth Investor (10/31/03) Diversified Pacific/Asia Henderson European Focus A (8/31/01)e Europe Stock FMI International (12/31/10) Foreign Large Blend INTECH International Mgd Volatility T (7/6/09)b Foreign Large Blend TIAA-CREF International Eq Retail (3/31/06) Foreign Large Blend Henderson International Opportunities A (8/31/01) e Foreign Large Blend Lazard International Strategic Eq Open (2/3/06) Foreign Large Blend Buffalo International (9/28/07) Foreign Large Growth WCM Focused International Growth Inv (8/31/11) Foreign Large Growth Henderson Global Equity Income A (11/30/06)e Foreign Large Value SSgA International Stock Selection N (3/7/95) Foreign Large Value Oppenheimer International Small-Mid Co A (11/17/97) e Foreign Small/Mid Growth AllianzGI International Small-Cap A (4/12/10) e Foreign Small/Mid Growth Brandes International Small Cap Equity A (1/31/12)e Foreign Small/Mid Value Matthews Japan Investor (12/31/98) Japan Stock Matthews Pacific Tiger Investor (9/12/94) Pacific/Asia ex-Japan Stk Matthews Asia Small Companies Inv (9/15/08) Pacific/Asia ex-Japan Stk Perkins Global Value T (6/29/01)b World Stock BlackRock Global Dividend Inv A (4/7/08)e World Stock PERFORMANCE BENCHMARKS MSCI EAFE Index (Dividends Reinvested) New to the Select List this quarter *$50,000 initial minimum investment AVERAGE ANNUALIZED TOTAL RETURN UPSIDE DOWNSIDE GROSS NET 3 5 10 SINCE MARKET MARKET EXPENSE EXPENSE YEARS YEARS YEARS INCEPTION CAPTURE CAPTURE RATIO a RATIO a TOTAL ASSETS ($M) QUOTE SYMBOL 1 YEAR SICNX LIEFX 3.40 -1.86 6.97 5.26 5.89 4.02 — — 1.53 -0.38 107.72 110.99 75.46 89.00 0.98 1.12 0.86 1.02 713 101 SFENX SFNNX SFILX -19.59 -4.93 5.09 -11.54 3.78 7.82 -8.43 2.02 4.80 — — — -3.57 -0.01 4.79 84.62 168.37 114.27 101.31 100.35 62.66 0.85 0.48 0.82 0.49 0.35 0.51 280 1,113 405 SWISX -0.88 4.36 3.60 3.07 3.91 104.96 87.98 0.23 0.19 2,922 MCDFX NGCAX SFGIX MNEMX MAPIX MPACX HFEAX FMIJX JRMTX TIERX HFOAX LISOX BUFIX WCMRX HFQAX SSAIX OSMAX AOPAX BISAX MJFOX MAPTX MSMLX JGVAX BABDX 9.54 -6.29 -4.32 -10.18 3.86 -0.05 -3.18 3.22 4.35 -1.47 -3.91 -1.89 -0.45 5.51 -6.19 0.81 8.30 9.10 1.71 20.83 -1.30 -9.43 -2.08 -2.90 7.81 3.71 -0.04 -4.96 4.83 6.58 7.42 10.41 7.35 3.75 6.08 6.32 5.17 8.44 3.59 6.23 16.24 9.76 8.09 16.41 4.57 2.64 7.69 5.80 6.51 0.71 — — 4.74 4.42 4.41 9.34 4.52 2.17 4.21 6.17 3.59 — 4.68 3.46 8.91 5.75 5.96 9.53 4.15 1.39 7.25 7.07 — 9.72 — — — 6.48 7.84 — — 3.32 4.61 5.17 — — — 2.52 10.15 6.84 5.79 2.16 9.19 — 4.90 — 9.21 9.04 3.55 0.95 8.74 8.87 14.28 9.34 8.14 2.24 8.63 4.55 2.07 7.09 2.68 4.21 12.59 8.38 10.06 5.88 8.52 12.29 6.28 4.51 98.11 96.81 79.16 84.48 85.25 84.08 108.26 82.45 94.03 103.62 97.03 106.42 93.78 102.39 93.55 106.69 108.38 96.47 106.60 96.84 88.49 84.72 90.29 103.44 60.25 70.82 87.24 124.18 64.03 52.36 61.09 28.29 58.60 90.18 56.90 77.89 71.16 61.25 68.06 78.72 11.34 35.36 55.38 10.41 69.08 76.67 52.53 66.51 1.19 1.56 1.25 1.27 1.06 1.11 1.31 0.98 1.16 0.83 1.37 1.09 1.06 1.30 1.19 1.22 1.21 1.76 1.38 1.03 1.09 1.47 1.01 1.02 1.19 1.56 1.15 1.16 1.05 1.11 1.31 0.98 1.16 0.83 1.37 1.09 1.06 1.30 1.19 1.00 1.20 1.45 1.40 1.03 1.08 1.47 1.01 1.02 181 141 791 89 4,791 777 3,675 2,799 66 4,320 4,852 6,792 253 1,884 3,478 317 6,040 132 1,042 1,941 6,693 611 237 2,245 -0.81 5.01 3.60 3.03 — Asset Class and Performance Benchmark Definitions Foreign stock funds typically have less than 20% of assets invested in the United States. Funds that do not have a specific growth or value orientation compared to a benchmark are classified as blend funds. World Stock funds invest primarily in equity securities of issuers located throughout the world and generally invest at least 20% of assets in the United States.
Regional funds generally hold high concentrations of securities from one specific geographic region. Emerging markets funds generally invest in securities from less developed countries. International investments are subject to risks such as currency fluctuations and political instability. Investing in emerging markets can accentuate these risks. If an expense waiver was in place during the period, the net expense ratio was used to calculate fund performance.
A net expense ratio lower than the gross expense ratio may reflect a cap on or contractual waiver of fund expenses. Please read the fund prospectus for details on limits or expiration dates for any such waivers. Performance quoted is past performance and is no guarantee of future results. Mutual Fund OneSource Select List — First Quarter 2016 7 . SECTOR FUNDS Perspectives and Fourth Quarter 2015 Summary We believe the information technology and financial sectors will outperform the market in 2016. The technology sector benefits from the need for businesses to upgrade equipment to boost efficiency and productivity. Also, the high level of consumer interest in technology supports the outlook for retail sales and the sector consistently has been a top-performer in the six months following an initial rate increase by the Federal Reserve. Meanwhile, U.S.
consumers have been improving their finances and fewer are defaulting on their loans. Signs of a leveling off in reduced consumer debt and a rising number of loans being issued by banks could lead to greater loan demand. We expect underperformance in the utilities and telecommunications sectors in 2016, with the former likely being negatively affected by the Fed’s move toward higher rates and the latter likely being hurt by fierce competition, falling consumer spending on telecom and rising capital expenditures. •The Specialty Category saw divergent performances for the fourth quarter.
Energy MLPs (-9.1%), Equity Energy (-3%) and Precious Metals (-0.6%) were plagued by continued weakness in oil prices and the strengthening dollar. Meanwhile, Health Care (8.3%), Real Estate (6.6%), and Financials (3.4%) finished the year with positive returns. All perspectives are as of January 11, 2016 For the latest up-to-date perspectives, please visit schwab.com FOR THE QUARTER ENDED DECEMBER 31, 2015 AVERAGE ANNUALIZED TOTAL RETURN MORNINGSTAR CATEGORY Financial SWFFX Health SWHFX Global Real Estate FUND NAME (FUND INCEPTION DATE) QUOTE SYMBOL SWASX Equity Energy Equity Energy MDGRX CGAEX 1 YEAR 3 YEARS 5 YEARS 10 YEARS -0.87 -1.94 8.05 8.42 -0.92 3.02 12.05 13.65 26.77 22.62 4.21 5.64 8.46 9.40 21.20 19.64 6.09 6.27 2.05 2.11 11.99 10.61 3.91 — -27.39 -28.48 -7.71 -34.75 -25.72 -39.70 -0.87 14.40 -3.09 8.05 8.24 5.17 -22.16 -16.60 -25.42 -23.25 -17.79 -27.56 -0.92 0.09 2.41 5.00 4.14 5.21 4.49 1.09 -9.86 -6.54 -13.37 -10.08 -10.49 3.21 -4.76 -1.07 -4.85 12.05 19.87 12.91 26.77 31.48 25.01 -8.58 3.25 -9.01 -29.35 -26.62 -31.62 4.21 5.96 10.14 12.11 11.07 17.00 15.58 18.52 7.62 9.89 5.99 -7.58 -7.94 -4.67 0.49 1.17 — 8.46 13.75 9.12 21.20 24.88 19.64 -6.82 1.71 -7.51 -23.88 -20.72 -26.40 6.09 7.44 11.10 11.60 11.96 10.68 10.99 13.88 7.93 8.98 8.55 -0.75 -0.53 — — — — 2.05 7.09 4.39 11.99 13.50 13.38 -0.34 4.91 -0.60 -4.54 -2.70 -3.76 3.91 5.38 6.61 7.80 — 8.35 9.44 9.59 6.47 7.09 6.95 UPSIDE DOWNSIDE GROSS NET SINCE MARKET MARKET EXPENSE EXPENSE INCEPTION CAPTURE CAPTURE RATIOa RATIOa TOTAL ASSETS ($M) LEADING SCHWAB AFFILIATE FUNDSd FINANCIAL FUNDS (CATEGORY AVERAGE) † Schwab Financial Services Fund (7/3/00) HEALTH FUNDS (CATEGORY AVERAGE) † Schwab Health Care Fund (7/3/00) GLOBAL REAL ESTATE FUNDS (CATEGORY AVERAGE) † Schwab Global Real Estate Fund (5/31/07) LEADING 3RD PARTY FUNDS EQUITY ENERGY FUNDS (CATEGORY AVERAGE) † BlackRock Natural Resources Inv A (10/21/94)e Calvert Global Energy Solutions A (5/31/07)e ENERGY LIMITED PARTNERSHIP FUNDS (CATEGORY AVERAGE) † Oppenheimer SteelPath MLP Select 40 A (3/30/10) e Tortoise MLP & Pipeline Investor (5/31/11)e Energy Limited Partnership MLPFX Energy Limited Partnership TORTX FINANCIAL FUNDS (CATEGORY AVERAGE) † Burnham Financial Services A (6/7/99) e Davis Financial A (5/1/91)e Financial Financial BURKX RPFGX Health Health JAGLX SHSAX Natural Resources Natural Resources ICBMX EENAX Equity Precious Metals Equity Precious Metals GOLDX OPGSX Global Real Estate PURZX Real Estate Real Estate CSRSX MNREX Technology Technology JAGTX ROGSX HEALTH FUNDS (CATEGORY AVERAGE) † Janus Global Life Sciences T (12/31/98)b BlackRock Health Sciences Opps Inv A (12/21/99)e NATURAL RESOURCES FUNDS (CATEGORY AVERAGE) † ICON Natural Resources S (5/5/97) Columbia Global Energy & Natural Res A (9/28/07)b,e PRECIOUS METALS FUNDS (CATEGORY AVERAGE) † Gabelli Gold AAA (7/11/94) Oppenheimer Gold & Special Minerals A (7/19/83)e GLOBAL REAL ESTATE FUNDS (CATEGORY AVERAGE) † Prudential Global Real Estate Z (5/5/98) REAL ESTATE FUNDS (CATEGORY AVERAGE) † Cohen & Steers Realty Shares (7/2/91) Manning & Napier Real Estate S (11/10/09) TECHNOLOGY FUNDS (CATEGORY AVERAGE) † Janus Global Technology T (12/31/98)b Red Oak Technology Select (12/31/98) UTILITY FUNDS (CATEGORY AVERAGE) † 5.06 104.70 61.65 0.90 0.90 76 9.63 124.59 28.42 0.80 0.80 1,091 0.65 78.17 81.32 1.15 1.05 260 6.17 -9.59 58.57 93.06 174.42 111.15 1.11 2.13 1.11 1.85 270 99 3.42 1.91 69.12 106.16 105.76 196.95 6.44 1.25 6.32 1.25 2,540 1,232 12.67 11.41 84.34 115.66 -32.26 70.92 1.64 0.86 1.80 0.86 249 914 12.24 15.64 133.59 124.69 -17.43 -3.62 0.93 1.19 0.93 1.19 4,679 6,185 3.83 -4.79 96.45 77.01 129.90 188.44 1.36 1.30 1.36 1.30 66 209 2.49 4.03 -71.76 -73.58 144.26 183.72 1.58 1.23 1.58 1.17 141 697 9.01 80.82 83.06 0.97 0.97 3,380 12.22 14.75 83.14 86.41 38.54 51.86 0.97 1.11 0.97 1.11 5,743 267 6.67 3.28 115.77 123.09 65.01 55.23 0.95 1.15 0.95 1.15 1,119 129 American Century Utilities Inv (3/1/93)b Utilities BULIX 7.70 90.75 67.96 0.67 0.67 350 Wells Fargo Util and Telecomms A (1/4/94)e Utilities EVUAX 8.06 86.79 75.60 1.18 1.15 369 New to the Select List this quarter † Reflects load-adjusted returns Asset Class and Performance Benchmark Definitions Sector funds concentrate investments in firms that fall into specific industries that produce related products or services. Sector funds, in general, have a low correlation to market indices, such as the S&P 500 Index, so they tend to perform differently than broader market measures.
Because of their unique investment objectives, it’s unfair to compare sector funds with broader market indices as they will seldom correlate. When evaluating sector fund performance, it’s more appropriate to compare an individual fund’s returns with the average performance of funds in its category. Due to the concentrated nature of sector funds, they can be more volatile than broadly diversified equity funds. If an expense waiver was in place during the period, the net expense ratio was used to calculate fund performance. A net expense ratio lower than the gross expense ratio may reflect a cap on or contractual waiver of fund expenses.
Please read the fund prospectus for details on limits or expiration dates for any such waivers. MLP funds invest in the equity securities of master limited partnerships (“MLPs”). Investments in securities of MLPs involve risks that differ from investments in common stock, including risks related to cash flow, dilution and voting rights. MLP funds also may carry heightened risks including industry concentration, volatility, limited liquidity, issuer-specific risks, valuation and taxation.
Many MLP funds are classified for federal tax purposes as a taxable regular corporation (“C corporation”), and are subject to US federal income tax on taxable income at corporate income tax rates, as well as state and local income taxes. These corporate taxes and accruals for deferred tax liabilities could substantially reduce a fund’s net assets (reflected in the fund’s NAV), the amount of income available for distribution and the amount of a fund’s distributions. If an MLP fund is classified for tax purposes as a C corporation, all distributions from a fund’s current or accumulated earnings and profits will be taxable to shareholders as ordinary income. Performance quoted is past performance and is no guarantee of future results. Mutual Fund OneSource Select List — First Quarter 2016 8 .
TAXABLE BOND FUNDS Perspectives and Fourth Quarter 2015 Summary In the fourth quarter of 2015, taxable bonds were mostly negative as an abundance of macroeconomic concerns weighed on performance, including uneasiness around high yield liquidity and low commodity prices. Most notably, the Fed finally increased the Federal Funds rate above zero, pushing Treasury yields higher. Short-term yields increased more than long-term bond yields, however, resulting in a flatter yield curve. We expect this trend to continue in 2016. The Barclays US Aggregate Bond Index is a common proxy for the taxable bond market and the index finished the quarter down 0.57%.
The majority of categories followed the index lower with most returns between -0.5 to -1%, with the exception of three particularly weak performers – Long Government (-1.64%), High Yield Bond (-2.01%) and Bank Loan (-2.15%). However, there was at least one shining star as the Emerging Markets Bond category went from the worst performer in the third quarter to the only positive category in the fourth quarter with a 0.49% return. The next best was Ultrashort Bond funds, which ended the quarter basically flat at -0.03%. All perspectives are as of January 11, 2016 For the latest up-to-date perspectives, please visit schwab.com FOR THE QUARTER ENDED DECEMBER 31, 2015 AVG. UPSIDE DOWNSIDE GROSS NET WEIGHTED TOTAL SINCE MARKET MARKET EXPENSE EXPENSE MATURITY ASSETS a a INCEPTION CAPTURE CAPTURE RATIO RATIO (YRS) ($M) AVERAGE ANNUALIZED TOTAL RETURN QUOTE SYMBOL 1 YEAR 3 YEARS Schwab GNMA Fund (3/3/03) Intermediate Government SWGSX 1.28 Schwab Intermediate-Term Bond Fund (10/31/07) Intermediate-Term Bond SWIIX 0.74 Intermediate-Term Bond SWLBX 0.31 RidgeWorth Seix Floating Rate Hi Inc I (3/1/06) Bank Loan SAMBX -1.17 Lord Abbett Floating Rate A (12/31/07) e Bank Loan LFRAX -1.91 PIMCO Investment Grade Corp Bd D (7/30/04) Corporate Bond PBDDX -0.12 1.94 Lord Abbett Income A (1/4/82) e Corporate Bond LAGVX -5.27 DoubleLine Emerging Markets Fixed Inc N (4/6/10) Emerging Markets Bond DLENX -5.04 TCW Emerging Markets Income N (3/1/04) Emerging Markets Bond TGINX -2.83 TIAA-CREF High-Yield Retail (3/31/06) High Yield Bond TIYRX RidgeWorth Seix High Yield I (12/29/00) High Yield Bond SAMHX American Century Infl-Adj Bond Inv (2/10/97)b Inflation-Protected Bond ACITX American Century Ginnie Mae Inv (9/23/85)b Intermediate Government BGNMX 0.77 1.06 Columbia US Government Mortgage A (2/14/02)b,e Intermediate Government AUGAX -1.97 0.61 Western Asset Core Bond I (9/4/90) Intermediate-Term Bond WATFX 1.21 2.17 Prudential Total Return Bond Z (9/16/96) Intermediate-Term Bond PDBZX -0.04 1.98 Northern Fixed Income (3/31/94) Intermediate-Term Bond NOFIX -0.12 1.47 3.72 4.39 5.24 Baird Core Plus Bond Inv (9/29/00) Intermediate-Term Bond BCOSX -0.11 1.46 3.91 5.34 5.84 Metropolitan West Total Return Bond M (3/31/97) Intermediate-Term Bond MWTRX -0.05 1.96 4.43 6.15 6.65 PIMCO Income D (3/30/07) Multisector Bond PONDX 2.28 4.56 8.12 — 8.76 Western Asset Global Strategic Income I (10/10/95) Multisector Bond SDSYX 0.79 2.20 5.30 5.41 5.70 Putnam Absolute Return 300 A (12/23/08) e Nontraditional Bond PTRNX -2.89 0.95 0.78 — Western Asset Total Return Uncons I (7/6/06) Nontraditional Bond WAARX 0.25 1.34 2.69 Northern Short-Intermediate US Govt (10/1/99) Short Government NSIUX 0.87 -0.11 Loomis Sayles Ltd Term Govt and Agency A (1/3/89)b,e Short Government NEFLX -1.95 -0.41 Prudential Short-Term Corporate Bd Z (12/16/96) Short-Term Bond PIFZX 1.07 1.30 Lord Abbett Short Duration Income A (11/4/93)e Short-Term Bond LALDX -1.83 0.49 Payden Limited Maturity (4/29/94) Ultrashort Bond PYLMX 0.30 0.46 Putnam Short Duration Income A (10/17/11) Ultrashort Bond PSDTX 0.27 0.45 PIMCO Foreign Bond (USD-Hedged) D (4/8/98) World Bond PFODX 0.00 Dreyfus/Standish Global Fixed Income A (12/2/09)e World Bond DHGAX -5.08 0.55 1.44 FUND NAME (FUND INCEPTION DATE) MORNINGSTAR CATEGORY 5 YEARS 10 YEARS 1.34 2.76 4.27 3.90 84.65 81.13 0.64 0.56 5.50 296 1.09 2.42 — 4.17 72.66 71.61 0.62 0.45 4.68 342 1.19 2.93 2.96 4.77 98.05 104.58 0.54 0.29 7.31 1,355 1.57 3.13 — 3.74 37.67 7.36 0.61 0.61 — 4,895 1.58 3.21 — 3.51 39.04 -14.05 0.80 0.80 — 6,070 5.25 6.69 6.43 148.93 154.58 0.91 0.90 11.59 6,352 0.61 4.07 5.70 7.80 113.45 120.96 0.88 0.78 — 1,857 -0.61 3.04 — 4.17 69.12 117.37 1.15 1.15 6.87 859 -2.45 2.91 7.03 7.53 56.47 155.24 1.13 1.13 6.42 2,762 -4.04 1.30 4.64 — 6.22 102.83 108.37 0.64 0.64 6.63 3,134 -4.91 1.00 4.12 5.26 6.41 88.06 96.03 0.58 0.58 6.17 560 -2.15 -2.99 1.94 3.50 4.91 88.66 217.08 0.47 0.47 9.24 2,811 2.55 4.21 6.33 74.97 75.60 0.55 0.55 5.29 1,163 3.45 4.55 4.46 58.41 34.95 0.97 0.90 6.72 1,970 4.18 5.08 6.98 110.95 94.05 0.49 0.45 10.89 4,716 4.65 5.88 5.93 128.58 124.78 0.62 0.58 — 11,986 112.82 117.51 0.49 0.47 8.56 1,380 105.86 107.78 0.55 0.55 6.98 9,373 97.90 81.83 0.69 0.69 7.84 69,596 105.84 17.53 0.79 0.79 5.39 52,104 93.31 68.32 0.85 0.85 11.80 382 2.14 -9.49 -52.44 0.81 0.81 6.60 847 — 4.52 32.63 6.89 0.91 0.91 6.35 1,181 0.91 2.56 3.20 33.47 51.31 0.48 0.41 2.85 169 0.89 3.07 4.81 31.68 35.04 0.81 0.80 3.17 870 2.47 4.22 4.71 50.42 33.47 0.53 0.53 — 8,881 2.23 4.18 4.19 36.85 15.27 0.59 0.59 — 33,635 0.73 1.39 2.98 9.30 -0.33 0.57 0.29 0.89 474 — — 0.55 6.67 -4.06 0.54 0.40 1.15 2,087 3.62 5.55 5.70 5.77 129.15 77.76 0.92 0.90 11.66 7,653 0.63 2.85 5.17 3.29 105.00 85.34 0.89 0.89 7.96 2,019 3.25 4.51 — LEADING SCHWAB AFFILIATE FUNDS d MARKET CAP-WEIGHTED INDEX FUNDS Schwab Total Bond Market Fund (3/5/93) LEADING 3RD PARTY FUNDS PERFORMANCE BENCHMARKS Barclays U.S. Aggregate Bond Index (Dividends Reinvested) New to the Select List this quarter Asset Class and Performance Benchmark Definitions Bond funds invest in corporate, municipal or government debt obligations of different maturities and interest rates.
Taxable bond funds generally invest in the debt obligations issued by the U.S. Treasury, other U.S. government agencies and U.S.
corporations. They also may invest in high-yield and foreign (non-U.S.) bonds. The Barclays U.S. Aggregate Bond Index tracks the total U.S.
bond market, which includes U.S. Treasury, government agency, investment-grade corporate bond and mortgage-backed securities with maturities of at least one year. The index includes reinvestment of interest. If an expense waiver was in place during the period, the net expense ratio was used to calculate fund performance.
A net expense ratio lower than the gross expense ratio may reflect a cap on or contractual waiver of fund expenses. Please read the fund prospectus for details on limits or expiration dates for any such waivers. Performance quoted is past performance and is no guarantee of future results. Mutual Fund OneSource Select List — First Quarter 2016 9 . TAX-FREE BOND FUNDS Perspectives and Fourth Quarter 2015 Summary Returns for municipal bonds were positive for every major category during the fourth quarter of 2015 and most outperformed the Barclays Aggregate Bond Index, a common proxy for the taxable bond market. We believe that limited supply and favorable demand helped total returns and expect this trend to continue into 2016. Puerto Rico, one of the largest municipal bond issuers, defaulted on some of their debt in December. We believe Puerto Rico’s widely publicized issues are not representative of the rest of the muni market and we have a favorable view of munis for 2016. High Yield Muni funds outperformed all other categories with a total return of 2.16%.
The runner-up was Muni California Long at 1.96% but a few other categories were close behind with returns above the Barclays Municipal Index’s return of 1.5% — Muni New Jersey, Muni National Long and Muni New York Long. Muni National Interm returned 1.37%. While still positive, shorter duration categories returned the least for the second quarter in a row. Muni National Short only gained 0.33% and Muni Single State Short was only slightly better with a return of 0.5%. All perspectives are as of January 11, 2016 For the latest up-to-date perspectives, please visit schwab.com FOR THE QUARTER ENDED DECEMBER 31, 2015 AVG. UPSIDE DOWNSIDE GROSS NET WEIGHTED TOTAL SINCE MARKET MARKET EXPENSE EXPENSE MATURITY ASSETS a a INCEPTION CAPTURE CAPTURE RATIO RATIO (YRS) ($M) AVERAGE ANNUALIZED TOTAL RETURN MORNINGSTAR CATEGORY QUOTE SYMBOL 3 YEARS 5 YEARS 10 YEARS Muni National Interm SWNTX 2.66 2.58 4.53 4.33 American Century High-Yield Muni Inv (3/31/98)b High Yield Muni Nuveen High Yield Municipal Bond A (6/7/99)e High Yield Muni ABHYX 5.02 3.86 7.05 3.93 4.87 127.51 NHMAX 0.43 4.47 8.98 3.34 5.04 174.40 American Century IntermTrm Tx-Fr Bd Inv (3/2/87)b Muni National Interm TWTIX 2.47 1.95 3.99 3.99 4.98 73.89 Northern Intermediate Tax-Exempt (3/31/94) Muni National Interm NOITX 2.80 2.40 4.42 3.96 4.41 Muni National Interm USATX 2.63 2.93 5.19 4.46 6.77 FUND NAME (FUND INCEPTION DATE) 1 YEAR LEADING SCHWAB AFFILIATE FUNDSd Schwab Tax-Free Bond Fund (9/11/92) 5.14 78.60 75.56 0.57 0.49 5.14 650 132.91 0.60 0.60 19.31 446 160.57 0.83 0.78 22.13 11,426 86.02 0.47 0.47 9.22 3,430 89.62 103.03 0.50 0.46 9.43 3,079 84.24 75.77 0.55 0.55 8.91 4,070 LEADING 3RD PARTY FUNDS USAA Tax Exempt Intermediate-Term (3/19/82) b Baird Quality Intermediate Muni Bd Inv (3/30/01) Muni National Interm BMBSX 1.89 1.55 3.14 3.78 4.13 61.42 73.62 0.55 0.55 4.86 1,148 Nuveen Intermediate Duration Muni Bd A (6/13/95)e Muni National Interm NMBAX -0.25 1.68 3.70 3.61 4.36 88.06 89.87 0.69 0.69 9.50 4,486 Northern Tax-Exempt (3/31/94) Muni National Long NOTEX 3.74 3.35 5.92 4.69 5.27 117.27 128.25 0.49 0.45 16.31 993 Muni National Long USTEX 3.34 3.55 6.52 4.58 7.45 111.24 110.00 0.55 0.55 15.45 2,368 Federated Shrt-Interm Dur Muni Instl (8/20/81) Muni National Short FSHIX 0.58 1.05 2.13 2.53 4.24 28.39 23.26 0.79 0.46 3.00 1,151 Wells Fargo Short-Term Municipal Bd A (7/18/08)e Muni National Short WSMAX -1.47 0.26 1.26 2.29 2.17 17.39 4.85 0.75 0.63 2.11 5,967 3.30 3.16 5.35 4.72 — USAA Tax Exempt Long-Term (3/19/82) b PERFORMANCE BENCHMARKS Barclays Municipal Bond Index (Dividends Reinvested) New to the Select List this quarter Asset Class and Performance Benchmark Definitions Tax-exempt bond funds primarily invest in municipal bonds generally issued by state and local governments to fund general expenditures and public projects.
Investment income may be subject to certain state and local income taxes and a portion of income may be subject to the alternative minimum tax (AMT). Capital gains are not exempt from federal income tax. The Barclays Municipal Bond Index is a total-return performance benchmark for the investment-grade tax-exempt bond market. The index includes reinvestment of interest. If an expense waiver was in place during the period, the net expense ratio was used to calculate fund performance.
A net expense ratio lower than the gross expense ratio may reflect a cap on or contractual waiver of fund expenses. Please read the fund prospectus for details on limits or expiration dates for any such waivers. Performance quoted is past performance and is no guarantee of future results. NOTES: ALL DATA SHOWN IS AS OF DECEMBER 31, 2015 a. Definitions: Gross Expense Ratio—actual expense as stated in the fund’s prospectus. Net Expense Ratio—net amount after any expenses are waived and/or partially absorbed by fund management. b. Fund has an initial minimum investment greater than $100. c. Investor Shares™ are available at a lower minimum but with higher operating expenses than Select Shares® . d. Schwab Affiliate Funds include Schwab Funds and Laudus Funds.
Schwab Funds and Laudus Funds are advised by Charles Schwab Investment Management, Inc. Schwab Funds and the Laudus MarketMasters Funds are distributed by Charles Schwab & Co., Inc. Laudus Funds, except the Laudus MarketMasters Funds, are distributed by ALPS Distributors, Inc. e. This fund is available without a load through Schwab.
The performance figures shown reflect the performance with the load. Please see the Fund Summary on schwab.com for performance without load. Mutual Fund OneSource Select List — First Quarter 2016 10 . ADDITIONAL FUND CATEGORIES FOR THE QUARTER ENDED DECEMBER 31, 2015 AVERAGE ANNUALIZED TOTAL RETURN FUND NAME (FUND INCEPTION DATE) MORNINGSTAR CATEGORY QUOTE SYMBOL 1 YEAR 3 YEARS 5 YEARS 10 YEARS UPSIDE DOWNSIDE GROSS NET SINCE MARKET MARKET EXPENSE EXPENSE INCEPTION CAPTURE CAPTURE RATIO a RATIO a TOTAL ASSETS ($M) BALANCED FUNDS—LEADING SCHWAB AFFILIATE FUNDSd Schwab® Monthly Income Fund—Enhanced Payout (3/28/08) Conservative Allocation SWKRX 0.02 3.66 4.47 — 4.21 59.21 54.30 0.72 0.57 Schwab® Monthly Income Fund—Moderate Payout (3/28/08) Conservative Allocation SWJRX -0.24 4.91 5.29 — 4.62 79.52 73.14 0.91 0.66 97 48 Schwab Balanced Fund (11/18/96) Moderate Allocation SWOBX 0.92 9.14 8.19 5.39 6.44 110.57 70.69 0.71 0.62 287 Putnam Dynamic Asset Allocation Gr A (2/8/94)e Aggressive Allocation PAEAX -6.01 8.54 7.43 5.34 7.26 148.48 116.73 1.07 1.07 2,215 American Century One Choice Agrsv Inv (9/30/04)b Aggressive Allocation AOGIX -1.26 8.52 7.72 6.21 7.09 133.81 119.94 0.98 0.98 1,043 JPMorgan Income Builder A (5/31/07)e Conservative Allocation JNBAX -5.40 2.35 4.56 — 4.31 93.09 110.92 1.11 0.75 12,074 American Century One Choice VryCnsrv Inv (9/30/04)b Conservative Allocation AONIX -1.12 2.86 4.03 4.33 4.41 53.25 55.04 0.68 0.68 369 Villere Balanced Inv (9/30/99) Moderate Allocation VILLX -8.24 3.00 7.56 6.00 7.54 100.65 137.22 0.89 0.89 521 Oakmark Equity & Income I (11/1/95)b Moderate Allocation OAKBX -4.60 8.22 6.82 6.62 10.16 119.53 98.79 0.74 0.74 17,670 BlackRock Global Allocation Inv A (10/21/94)e World Allocation MDLOX -6.25 3.01 2.97 5.22 8.61 94.56 100.34 1.13 1.13 48,537 Loomis Sayles Global Equity and Income A (2/1/06)b,e World Allocation LGMAX -4.32 4.62 5.49 6.69 6.33 121.92 123.42 1.16 1.16 1,402 Schwab Target 2015 Fund (3/12/08) Target Date 2011-2015 SWGRX 0.32 5.81 5.99 — 4.85 83.31 67.44 0.64 0.53 112 Schwab Target 2020 Fund (7/1/05) Target Date 2016-2020 SWCRX 0.20 7.18 6.99 5.23 5.65 103.42 84.44 0.65 0.61 531 Schwab Target 2025 Fund (3/12/08) Target Date 2021-2025 SWHRX 0.17 8.21 7.67 — 6.50 118.38 96.88 0.73 0.67 409 Schwab Target 2030 Fund (7/1/05) Target Date 2026-2030 SWDRX 0.04 8.99 8.10 5.97 6.40 129.80 106.65 0.75 0.72 784 Schwab Target 2035 Fund (3/12/08) Target Date 2031-2035 SWIRX -0.10 9.69 8.55 — 6.99 140.14 115.50 0.82 0.75 337 Schwab Target 2040 Fund (7/1/05) Target Date 2036-2040 SWERX -0.18 10.21 8.89 6.40 6.89 147.94 122.25 0.82 0.78 824 Schwab Target 2045 Fund (1/23/13) Target Date 2041-2045 SWMRX -0.21 — — — 9.19 — — 1.12 0.80 67 Schwab Target 2050 Fund (1/23/13) Target Date 2046-2050 SWNRX -0.21 — — — 9.46 — — 1.20 0.81 54 Schwab Target 2055 Fund (1/23/13) Target Date 2051+ SWORX -0.40 — — — 9.51 — — 1.50 0.82 30 American Century One Choice 2025 Inv (8/31/04)b Target Date 2021-2025 ARWIX -1.52 6.27 6.49 5.53 6.31 99.19 89.28 0.83 0.83 2,547 American Century One Choice 2030 Inv (5/30/08)b Target Date 2026-2030 ARCVX -1.37 7.00 6.90 — 4.77 107.22 93.51 0.85 0.85 1,745 American Century One Choice 2035 Inv (8/31/04)b Target Date 2031-2035 ARYIX -1.23 7.80 7.40 5.85 6.83 116.18 98.54 0.87 0.87 2,033 American Century One Choice 2040 Inv (5/30/08)b Target Date 2036-2040 ARDVX -1.32 8.46 7.82 — 5.23 125.34 105.82 0.90 0.90 1,315 American Century One Choice 2045 Inv (8/31/04)b Target Date 2041-2045 AROIX -1.38 8.98 8.11 6.14 7.18 133.32 112.90 0.94 0.94 1,461 American Century One Choice 2050 Inv (5/30/08)b Target Date 2046-2050 ARFVX -1.59 9.12 8.23 — 5.10 136.27 116.25 0.96 0.96 773 American Century One Choice 2055 Inv (3/31/11)b Target Date 2051+ AREVX -1.64 9.36 — — 7.79 139.10 118.05 0.97 0.97 265 Long/Short Equity SWHEX -0.39 8.15 6.76 3.96 6.44 63.80 77.28 2.02 1.33 210 -16.94 -10.24 -8.18 -2.96 -1.34 48.88 51.56 1.17 0.99 1,854 -22.36 -16.08 — — -12.40 62.38 76.75 1.24 0.95 107 Glenmede Secured Options (6/30/10) Commodities Broad Basket SKIRX Commodities Broad EAPCX Basket Long/Short Equity GTSOX 6.98 8.39 8.45 — 11.52 49.11 38.03 0.87 0.87 384 Glenmede Long/Short (9/29/06) Long/Short Equity GTAPX 0.27 6.21 5.66 — 1.76 36.91 29.06 2.48 1.22 209 JPMorgan Multi-Cap Market Neutral A (5/23/03)e Market Neutral OGNAX -4.12 0.40 0.16 -0.06 0.84 36.04 -14.36 3.26 1.25 272 AC Alternatives™ Market Neutral Val Inv (10/31/11)b Market Neutral ACVVX 3.68 2.79 — — 3.22 21.91 -51.48 4.20 1.62 213 S&P 500 Index® (Dividends Reinvested) 1.38 15.13 12.57 7.31 — Barclays U.S. Aggregate Bond Index (Dividends Reinvested) 0.55 1.44 3.25 4.51 — BALANCED FUNDS—LEADING 3RD PARTY FUNDS TARGET DATE FUNDS—LEADING SCHWAB AFFILIATE FUNDSd TARGET DATE FUNDS—LEADING 3RD PARTY FUNDS ALTERNATIVE FUNDS—LEADING SCHWAB AFFILIATE FUNDSd Schwab Hedged Equity Fund (9/3/02) ALTERNATIVE FUNDS—LEADING 3RD PARTY FUNDS Deutsche Enhanced Commodity Strat Instl (2/14/05) Parametric Commodity Strategy Investor (1/3/12) PERFORMANCE BENCHMARKS New to the Select List this quarter Asset Class Definitions Balanced funds invest in a mix of stocks, bonds and cash within one fund and are classified into two categories. Conservative Allocation funds may invest 20% to 50% of assets in equities and 50% to 80% of assets in fixed income and cash. Moderate Allocation funds may invest 50% to 70% of assets in equities, with the balance invested in fixed income and cash.
Convertible funds invest primarily in bonds and preferred stocks that can be converted into common stocks. Target maturity or “Lifecycle” funds are managed for investors planning to retire (or to begin withdrawing substantial portions of their investments) in a particular year. These funds provide both asset allocation and rebalancing for investors following an investment strategy that grows more conservative as the target date approaches. Commodity-related products, including futures, carry a high level of risk and are not suitable for all investors.
Commodity-related products may be extremely volatile, illiquid and can be significantly affected by underlying commodity prices, world events, import controls, worldwide competition, government regulations, and economic conditions, regardless of the length of time shares are held. Investments in commodity-related products may subject the fund to significantly greater volatility than investments in traditional securities and involve substantial risks, including risk of loss of a significant portion of their principal value. If an expense waiver was in place during the period, the net expense ratio was used to calculate fund performance. A net expense ratio lower than the gross expense ratio may reflect a cap on or contractual waiver of fund expenses.
Please read the fund prospectus for details on limits or expiration dates for any such waivers. Performance quoted is past performance and is no guarantee of future results. Data provided by Morningstar, Inc. ©2015 by Morningstar, Inc. All rights reserved.
The information contained herein is the proprietary information of Morningstar, Inc., and may not be copied or redistributed for any purpose and may only be used for noncommercial, personal purposes. The information contained herein is not represented or warranted to be accurate, correct, complete or timely. Morningstar, Inc., shall not be responsible for investment decisions, damages or other losses resulting from use of this information.
Morningstar, Inc., has not granted consent for it to be considered or deemed an “expert” under the Securities Act of 1933. Mutual Fund OneSource Select List — First Quarter 2016 11 . INCOME MUTUAL FUND SELECT LIST ® Schwab’s Income Mutual Fund Select List was developed and is managed by the Charles Schwab Investment Advisory, Inc. (CSIA) experts and includes mutual funds that have met their rigorous criteria, including both quantitative and qualitative factors. All are no-load and no-transaction fee and are selected based on their ability to generate income in their respective asset classes. The list is designed to help you achieve income and growth.
For more information on how funds are selected, see pages 4 and 14. FOR THE QUARTER ENDED DECEMBER 31, 2015 AVERAGE ANNUALIZED TOTAL RETURN MORNINGSTAR CATEGORY Large Blend FUND NAME (FUND INCEPTION DATE) QUOTE SYMBOL 1 YEAR 3 YEARS 5 YEARS 10 YEARS 6.80 SINCE INCEPTION UPSIDE MARKET CAPTURE DOWNSIDE MARKET CAPTURE LEADING SCHWAB AFFILIATE FUNDSd Schwab Core Equity Fund (7/1/96) SWANX 0.55 14.92 11.90 Laudus Mondrian International Equity Fund — Select Shares (6/17/08)b,* Foreign Large Value LIEFX -1.86 5.26 4.02 — 8.14 101.33 105.14 -0.38 110.99 Schwab GNMA Fund (3/3/03) Intermediate Government SWGSX 1.28 1.34 2.76 89.00 4.27 3.90 84.65 Schwab Intermediate-Term Bond Fund (10/31/07) Intermediate-Term Bond SWIIX 0.74 1.09 81.13 2.42 — 4.17 72.66 71.61 Schwab Tax-Free Bond Fund (9/11/92) Muni National Interm SWNTX 2.66 Schwab Global Real Estate Fund (5/31/07) Global Real Estate SWASX 3.02 2.58 4.53 4.33 5.14 78.60 75.56 5.64 6.27 — 0.65 78.17 Schwab ® Monthly Income Fund — Enhanced Payout (3/28/08) Conservative Allocation SWKRX 0.02 81.32 3.66 4.47 — 4.21 59.21 54.30 Schwab ® Monthly Income Fund — Moderate Payout (3/28/08) Conservative Allocation SWJRX Schwab Balanced Fund (11/18/96) Moderate Allocation SWOBX -0.24 4.91 5.29 — 4.62 79.52 73.14 0.92 9.14 8.19 5.39 6.44 110.57 70.69 Parnassus Core Equity Investor (8/31/92) Large Blend PRBLX -0.55 15.12 TIAA-CREF Social Choice Eq Retail (3/31/06) Large Blend TICRX -2.70 13.08 12.68 9.89 10.50 97.83 94.77 10.39 6.62 6.27 96.10 109.57 American Century Equity Income Inv (8/1/94)b Large Value TWEIX 0.60 10.57 JPMorgan Equity Income A (2/18/92)e Large Value OIEIX -7.63 11.21 9.32 6.79 10.38 72.28 74.73 10.81 7.10 8.30 92.42 99.16 Tocqueville International Value (8/1/94) Foreign Large Blend TIVFX 7.27 7.78 Henderson Global Equity Income A (11/30/06)e Foreign Large Value HFQAX -6.19 3.59 4.78 4.50 5.69 100.81 63.35 4.68 — 2.68 93.55 68.06 Perkins Global Value T (6/29/01)b World Stock JGVAX -2.08 7.69 7.25 4.90 6.28 90.29 52.53 Oppenheimer SteelPath MLP Select 40 A (3/30/10) e Energy Limited Partnership MLPFX -25.72 -1.07 Prudential Global Real Estate Z (5/5/98) Global Real Estate PURZX 0.09 5.96 1.17 — 3.42 69.12 105.76 7.44 5.38 9.01 80.82 Cohen & Steers Real Estate Securities A (9/2/97)e Real Estate CSEIX 2.52 12.26 11.92 83.06 7.29 9.53 90.02 35.35 RidgeWorth Seix Floating Rate Hi Inc I (3/1/06) Bank Loan SAMBX -1.17 1.57 3.13 — 3.74 37.67 7.36 Lord Abbett Income A (1/4/82)e Corporate Bond LAGVX -5.27 0.61 4.07 5.70 7.80 113.45 120.96 TCW Emerging Markets Income N (3/1/04) Emerging Markets Bond TGINX -2.83 -2.45 2.91 7.03 7.53 56.47 155.24 RidgeWorth Seix High Yield I (12/29/00) High Yield Bond SAMHX -4.91 1.00 4.12 5.26 6.41 88.06 96.03 American Century Ginnie Mae Inv (9/23/85)b Intermediate Government BGNMX 0.77 1.06 2.55 4.21 6.33 74.97 75.60 DoubleLine Total Return Bond N (4/6/10) Intermediate-Term Bond DLTNX 2.07 2.73 5.22 — 7.34 96.41 57.07 USAA Income (3/4/74)b Intermediate-Term Bond USAIX -1.11 1.49 3.63 4.86 8.13 100.51 99.47 PIMCO Income D (3/30/07) Multisector Bond PONDX 2.28 4.56 8.12 — 8.76 105.84 17.53 Loomis Sayles Ltd Term Govt and Agency A (1/3/89)b,e Short Government NEFLX -1.95 -0.41 0.89 3.07 4.81 31.68 35.04 Lord Abbett Short Duration Income A (11/4/93)e Short-Term Bond LALDX -1.83 0.49 2.23 4.18 4.19 36.85 15.27 PIMCO Foreign Bond (USD-Hedged) D (4/8/98) World Bond PFODX 0.00 3.62 5.55 5.70 5.77 129.15 77.76 American Century IntermTrm Tx-Fr Bd Inv (3/2/87)b Muni National Interm TWTIX 2.47 1.95 3.99 3.99 4.98 73.89 86.02 USAA Tax Exempt Intermediate-Term (3/19/82)b Muni National Interm USATX 2.63 2.93 5.19 4.46 6.77 84.24 75.77 Northern Tax-Exempt (3/31/94) Muni National Long NOTEX 3.74 3.35 5.92 4.69 5.27 117.27 128.25 Federated Shrt-Interm Dur Muni Instl (8/20/81) Muni National Short FSHIX 0.58 1.05 2.13 2.53 4.24 28.39 23.26 JPMorgan Income Builder A (5/31/07)e Conservative Allocation JNBAX -5.40 2.35 4.56 — 4.31 93.09 110.92 Villere Balanced Inv (9/30/99) Moderate Allocation VILLX -8.24 3.00 7.56 6.00 7.54 100.65 137.22 BlackRock Global Allocation Inv A (10/21/94)e World Allocation MDLOX -6.25 3.01 2.97 5.22 8.61 94.56 100.34 LEADING 3RD PARTY FUNDS DOMESTIC INTERNATIONAL SECTOR TAXABLE BOND TAX-FREE BOND BALANCED FUNDS New to the Select List this quarter *$50,000 initial minimum investment Definitions 30-day SEC Yield: Based on a fund’s most recently reported portfolio holdings, this measure shows the income an investor would earn if invested in that fund for the subsequent 12 months. Although a fund’s holdings are likely to change over that time, the SEC yield provides a yardstick for comparing the income potential across funds within the same category. Annual Distribution Yield: This measure looks back at the actual payouts of a mutual fund over the past 12 months. It provides an accurate picture of the fund’s recent short-term distributions without any forward anticipation.
The Income Select List shows the 12-month dividend and interest return for each fund in the form of a percentage of its share price (also known as “payout ratio”). The yield does not include long- or short-term capital gains distributions. Income Mutual Fund Select List — First Quarter 2016 12 . INCOME MUTUAL FUND SELECT LIST ® (CONTINUED) Whether you need income monthly, quarterly or annually, you have a number of fund choices. The funds on the Income Select List provide different types of income: fixed-income funds generally pay interest measured by yield; equity funds pay dividends measured by dividend return or payout ratio. FOR THE QUARTER ENDED DECEMBER 31, 2015 GROSS EXPENSE RATIOa NET EXPENSE RATIOa AVG. WEIGHTED MATURITY (YRS) TOTAL ASSETS ($M) PAYMENT DATE FREQUENCY ANNUAL MOST RECENT DISTRIBUTION DIVIDEND YIELD PAYMENT 30-DAY SEC YIELD 0.72 0.72 — 2,273 12/10/15 Annually 1.63 0.36 1.12 1.02 — 101 12/15/15 Annually 2.42 0.14 — — 0.64 0.56 5.50 296 12/31/15 Monthly 2.38 0.02 2.22 0.62 0.45 4.68 342 12/31/15 Monthly 1.92 0.02 1.83 0.57 0.49 5.14 650 12/31/15 Monthly 2.21 0.02 1.37 1.15 1.05 — 260 12/15/15 Quarterly 3.00 0.07 2.00 0.72 0.57 6.27 97 1/15/16 Monthly 2.41 0.02 2.08 0.91 0.66 6.27 48 1/15/16 Monthly 2.57 0.02 2.17 0.71 0.62 6.46 287 12/30/15 Annually 2.18 0.32 — — 0.87 0.87 — 11,920 12/30/15 Quarterly 2.02 0.50 0.46 0.46 — 2,604 12/11/15 Annually 1.76 0.26 — 0.93 0.93 — 8,655 12/28/15 Quarterly 2.36 0.07 2.34 1.09 1.04 — 10,566 12/29/15 Monthly 1.72 0.03 1.71 1.54 1.25 — 367 12/15/15 Annually 1.74 0.25 — 1.19 1.19 — 3,478 12/30/15 Monthly 6.60 0.03 3.35 1.01 1.01 — 237 12/21/15 Annually 2.06 0.27 — 6.44 6.32 — — 1/8/16 Quarterly 7.84 0.06 — 0.97 0.97 — 3,380 12/16/15 Quarterly 1.81 0.08 2.18 1.22 1.22 — 1,437 12/10/15 Quarterly 2.01 0.11 — 0.61 0.61 — 4,895 12/31/15 Monthly 4.84 0.03 4.58 0.88 0.78 — 1,857 12/31/15 Monthly 4.70 0.01 4.48 1.13 1.13 6.42 2,762 12/30/15 Monthly 5.14 0.03 5.21 0.58 0.58 6.17 560 12/31/15 Monthly 6.08 0.04 7.04 0.55 0.55 5.29 1,163 12/31/15 Monthly 2.37 0.02 1.79 0.72 0.72 5.14 51,638 12/31/15 Monthly 3.85 0.04 3.53 0.53 0.53 8.26 5,861 12/15/15 Monthly 3.65 0.06 3.57 0.79 0.79 5.39 52,104 12/31/15 Monthly 7.41 0.05 3.32 0.81 0.80 3.17 870 12/31/15 Monthly 1.54 0.02 0.96 0.59 0.59 — 33,635 12/31/15 Monthly 3.95 0.01 3.01 0.92 0.90 11.66 7,653 12/31/15 Monthly 6.84 0.01 1.11 0.47 0.47 9.22 3,430 12/31/15 Monthly 2.61 0.02 1.31 0.55 0.55 8.91 4,070 12/31/15 Monthly 3.26 0.04 1.65 0.49 0.45 16.31 993 12/17/15 Monthly 3.42 0.02 2.90 0.79 0.46 3.00 1,151 12/31/15 Monthly 1.35 0.01 1.04 1.11 0.75 11.10 12,074 12/29/15 Monthly 4.06 0.04 4.26 0.89 0.89 4.62 521 12/22/15 Annually 0.94 0.20 1.13 — 48,537 12/15/15 Semi-Annually 0.98 0.11 — Schwab developed the Income Mutual Fund Select List to help investors in or approaching retirement build or modify an investment portfolio that addresses their growth and income needs. Here are some things to consider as you develop or fine-tune your portfolio: Asset Allocation: As always, your portfolio’s asset allocation should be driven by your investment goals, time horizon and risk tolerance. As your goals shift from accumulation to income, you can use the funds on this list to help address your income and growth needs from both bond and equity funds. Diversification: Investors in or nearing retirement often believe that they should be exclusively in bonds and other fixed income assets.
While for some investors this might be an appropriate strategy, you may want to consider keeping some percentage of your portfolio in equities for the capital appreciation potential they provide. Risk vs. Return: Evaluate yields within the context of risk: different categories or asset classes will reflect differing risk/reward trade-offs. Consider a mix of bond funds: government, municipal and corporate. Also, a fund’s exposure to below-investment grade bonds is important to keep in mind.
One of the selection criteria for fixed-income funds on the Income Select List is relatively low exposure to these types of securities, except for the high yield, multisector and emerging bond categories. (To see a fixed-income fund’s credit rating, click on the fund name, then the Portfolio tab.) Maturity: Bond funds with longer maturities can leave investors exposed to greater inflation and credit risk, so consider a balance of maturities, from ultrashort to long. Distribution Frequency: Different funds provide payouts on different schedules. Check the frequency of distributions to determine when you’ll receive income, if any, from the fund. Taxes: Remember tax implications.
Income on investments in nonretirement accounts is generally taxable; in tax-protected retirement accounts, such as IRAs and 401(k)s, it’s less of a concern. Where appropriate, consider tax-free bond funds. — 1.13 A smart approach to help you generate income from your investments If an expense waiver was in place during the period, the net expense ratio was used to calculate fund performance. A net expense ratio lower than the gross expense ratio may reflect a cap or contractual waiver of fund expenses.
Please read the fund prospectus for details on limits or expiration dates for any such waivers. Schwab provides a range of easy-to-use tools, resources and guidance at schwab.com for investors in or nearing retirement. Performance quoted is past performance and is no guarantee of future results. For asset class and performance benchmark definitions, please see footnotes on pages 5–11. Please see page 10 for information on items a–e cited above. Income Mutual Fund Select List — First Quarter 2016 13 . (continued from page 4) For the Income Select List, CSIA generally includes no more than the two most favorably evaluated funds in each asset category, except for the intermediate-term bond category, which may feature up to five funds. Upside and downside capture ratios: a measure of how much a fund moves in comparison to the broad market when the market goes up or down. Upside capture ratio: For the months in which the market return was positive, what was the ratio of the fund’s returns to the market’s returns? Upside capture of 110% means that in up markets, the fund went up 10% more than the market did. For investors who are concerned with growth in rising markets, looking for a fund with a high upside capture ratio (above 100%) can be useful. Downside capture ratio: For the months in which the market return was negative, what was the ratio of the fund’s returns to the market’s returns? Downside capture of 110% means that in down markets, the fund went down 10% more than the market did. For investors who are concerned with minimizing losses, looking for a fund with a low downside capture ratio (below 100%) can be helpful. Generally speaking, it’s good for a fund to have an upside capture ratio at least as high as its downside capture ratio, and preferably higher. A fund delivering 110% of the market’s positive returns but only 105% of the negative returns means that the fund has delivered more of the market’s upside than downside (which is desirable). The “holy grail” for many investors is a fund with a low downside capture ratio that has an upside capture ratio of 100% or more. The absolute level of upside capture and downside capture can be important as well, providing an overall indication of the fund’s risk relative to the market. If both ratios are around 120%, it means that the fund has been more volatile than the market (even if upside is higher than downside).
If both ratios are around 80%, it means that the fund has been less volatile than the market. As with most metrics, these ratios are backward looking (in this case, over the past three years). Just because a fund has delivered a certain percentage of the market’s returns in past up markets and down markets doesn’t mean that it is guaranteed to do the same in future up or down markets. In a three-year period with very few up months or very few down months, the upside or downside capture ratio can be hard to measure. These ratios provide no information about the fund’s overall returns and are simply a measure of performance relative to the market in up periods and in down periods. Additional Important Information More than 3,500 funds participate in the Mutual Fund OneSource® service. Only these funds, including Schwab Affiliate Funds, are eligible for the Select Lists. Schwab receives remuneration from fund companies, and/or their affiliates, in the Mutual Fund OneSource service, including Schwab Affiliate Funds, for record keeping, shareholder services and other administrative services.
Schwab and its affiliates also receive fees from Schwab Affiliate Funds for investment advisory and fund administration services. The aggregate fees Schwab or its affiliates receive from Schwab Affiliate Funds (see fund prospectuses for more details) are greater than the remuneration Schwab receives from other fund companies participating in Schwab’s Mutual Fund OneSource service. The amount of fees Schwab or its affiliates receive from funds participating in the Mutual Fund OneSource service is not considered in the Select Lists selection, nor does any fund pay Schwab to be included in the Select Lists.
Eligible funds are selected based solely on the quantitative and qualitative criteria described on pages 4 and 14. Schwab Affiliate Funds include Schwab Funds and Laudus Funds. Schwab Funds and Laudus Funds are advised by Charles Schwab Investment Management, Inc. Schwab Funds and the Laudus MarketMasters Funds are distributed by Charles Schwab & Co., Inc.
and Laudus Funds (except Laudus MarketMasters Funds) are distributed by ALPS Distributors, Inc. Investing in Mutual Funds at Schwab Investors should consider carefully information contained in the prospectus, including investment objectives, risks, charges and expenses. You can obtain a prospectus by calling Schwab at 800-435-4000. Please read the prospectus carefully before investing. Investment value will fluctuate and shares, when redeemed, may be worth more or less than original cost. Trades in no-load mutual funds participating in the Mutual Fund OneSource service (including Schwab Funds), as well as certain other funds, are available without loads or transaction fees when placed through schwab.com or one of our automated phone channels.
However, for each of these trades placed through a broker, a $25 service charge applies. Additionally, Schwab will charge a short-term redemption fee (STR) if you sell shares of OneSource funds held for 90 days or less. Schwab reserves the right to exempt some funds from the STR fee, including certain Schwab Funds, which may charge a separate redemption fee, and funds that accommodate short-term trading. Certain funds may charge a redemption fee separate, and in addition to, the OneSource STR.
All other funds available at Schwab are subject to a transaction fee when bought and sold and may be subject to fees assessed by the fund itself. Schwab reserves the right to change the funds it makes available without transaction fees and reinstate fees on any funds. Information on the Mutual Fund OneSource Select List® No mention of particular funds or fund families here should be construed as a recommendation, or considered an offer to sell, or a solicitation to buy any securities. This information is provided for general information purposes only and should not be considered an individualized recommendation or personalized investment advice.
The securities listed may not be suitable for everyone. Each investor needs to review a security transaction for his or her own particular situation. Schwab or its employees may sometimes hold positions in the securities listed here.
Charles Schwab & Co. Inc. is the underwriter and distributor of Schwab Funds®. Except as noted below, all data provided by Morningstar, Inc.
©2016 by Morningstar, Inc. All rights reserved. The information contained herein is the proprietary information of Morningstar, Inc., and may not be copied or redistributed for any purpose and may only be used for noncommercial, personal purposes.
The information contained herein is not represented or warranted to be accurate, correct, complete, or timely. Morningstar, Inc., shall not be responsible for investment decisions, damages, or other losses resulting from use of the information. Morningstar, Inc., has not granted consent for it to be considered or deemed an “expert” under the Securities Act of 1933.
With respect to SchwabFunds, Charles Schwab Investment Management, Inc. provides the following data: total net assets, actual and average annual total returns, after-tax returns, annualized quarter-end performance, top ten holdings, portfolio breakdowns, expense ratios, and, for Schwab bond funds, credit ratings, average maturity, and 30-day SEC yield. Charles Schwab Investment Advisory (CSIA) is a separately registered investment advisor and an affiliate of Charles Schwab & Co., Inc. Among other functions, CSIA oversees the selection of investments and ongoing monitoring of the Select List and produces market commentary and other investment advice for Schwab clients and financial consultants.
(0114-0381) Brokerage Products: Not FDIC-Insured • No Bank Guarantee • May Lose Value ©2016 Charles Schwab & Co., Inc. All rights reserved. Member SIPC.
REF (0115-0934) MKT10884FM-93 (01/16) Mutual Fund OneSource Select List — First Quarter 2016 14 .