


Description
Annual report dated December 31, 2015, enclosed.
Schwab® Monthly Income Funds
Schwab® Monthly Income Fund Moderate Payout
Schwab® Monthly Income Fund Enhanced Payout
Schwab® Monthly Income Fund Maximum Payout
Go paperless today.
Simplify your financial life
by viewing these documents online.
Sign up at schwab.com/paperless
Current performance may be substantially
different from what is contained in this report.
Please click here for more current fund
performance and other information.
This report is not authorized for distribution to
prospective investors unless preceded or
accompanied by a current prospectus.
. This wrapper is not part of the shareholder report.
. Schwab® Monthly Income Funds
Annual Report
December 31, 2015
Schwab® Monthly Income Fund Moderate Payout
Schwab® Monthly Income Fund Enhanced Payout
Schwab® Monthly Income Fund Maximum Payout
. This page is intentionally left blank.
. Schwab Monthly Income Funds
In This Report
Performance at a Glance . . . .
. . .
. . .
. . .
. . .
. . .
. . .
. . .
. . .
. . .
. . .
. . .
. . .
. . .
. . .
. . . From the President .
. . .
. . .
. . .
. . .
. . .
. . .
. . .
. . .
. . .
. . .
. . .
. . .
. . .
. . .
. . .
. . .
. . .
. . . Fund Management .
. . .
. . .
. . .
. . .
. . .
. . .
. . .
. . .
. . .
. . .
. . .
. . .
. . .
. . .
. . .
. . .
. . .
. . . Performance and Fund Facts Schwab Monthly Income Fund – Moderate Payout .
. . .
. . .
. . .
. . .
. . Schwab Monthly Income Fund – Enhanced Payout . .
. . .
. . .
. . .
. . .
. Schwab Monthly Income Fund – Maximum Payout . . .
. . .
. . .
. . .
. . Fund Expenses . .
. . .
. . .
. . .
. . .
. . .
. . .
. . .
. . .
. . .
. . .
. . .
. . .
. . .
. . .
. . .
. . .
. . .
. . .
. . .
. Financial Statements and Portfolio Holdings Schwab Monthly Income Fund - Moderate Payout. . .
. . .
. . .
. . .
. . .
. Schwab Monthly Income Fund - Enhanced Payout . . .
. . .
. . .
. . .
. . . Schwab Monthly Income Fund - Maximum Payout .
. . .
. . .
. . .
. . .
. Financial Notes. . .
. . .
. . .
. . .
. . .
. . .
. . .
. . .
. . .
. . .
. . .
. . .
. . .
. . .
. . .
. . .
. . .
. . .
. . .
. . . Report of Independent Registered Public Accounting Firm.
. . .
. . .
. . Other Federal Tax Information . .
. . .
. . .
. . .
. . .
. . .
. . .
. . .
. . .
. . .
. . .
. . .
. . .
. . . Shareholder Vote Results (Unaudited) .
. . .
. . .
. . .
. . .
. . .
. . .
. . .
. . .
. . .
. . .
. . Trustees and Officers . .
. . .
. . .
. . .
. . .
. . .
. . .
. . .
. . .
. . .
. . .
. . .
. . .
. . .
. . .
. . .
. . .
. . . Glossary .
. . .
. . .
. . .
. . .
. . .
. . .
. . .
. . .
. . .
. . .
. . .
. . .
. . .
. . .
. . .
. . .
. . .
. . .
. . .
. . .
. . .
. . .
. Fund investment adviser: Charles Schwab Investment Management, Inc. (CSIM). Distributor: Charles Schwab & Co., Inc. (Schwab). 2 3 5 6 8 10 12 13 18 23 28 37 38 39 40 44 .
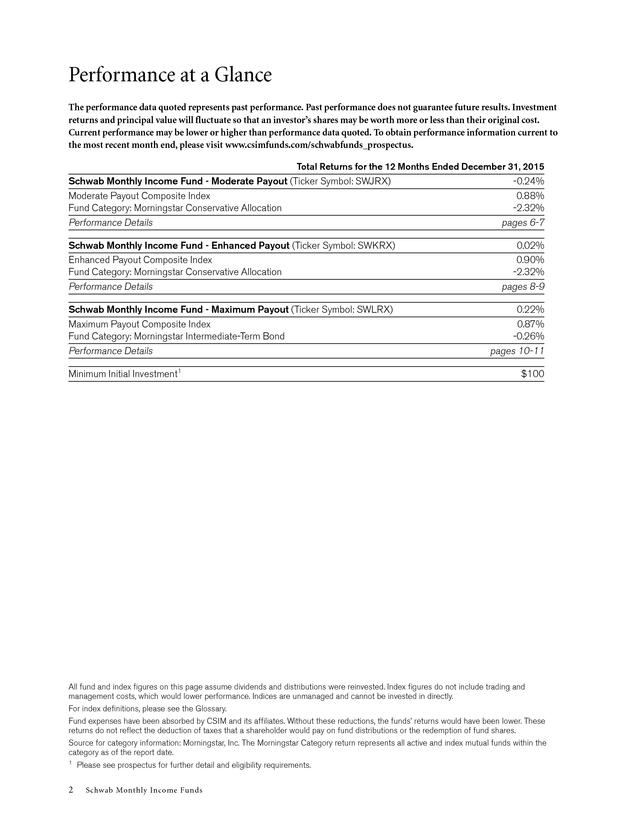
Performance at a Glance The performance data quoted represents past performance. Past performance does not guarantee future results. Investment returns and principal value will fluctuate so that an investor’s shares may be worth more or less than their original cost. Current performance may be lower or higher than performance data quoted. To obtain performance information current to the most recent month end, please visit www.csimfunds.com/schwabfunds_prospectus. Total Returns for the 12 Months Ended December 31, 2015 Schwab Monthly Income Fund - Moderate Payout (Ticker Symbol: SWJRX) Moderate Payout Composite Index Fund Category: Morningstar Conservative Allocation Performance Details -0.24% 0.88% -2.32% pages 6-7 Schwab Monthly Income Fund - Enhanced Payout (Ticker Symbol: SWKRX) Enhanced Payout Composite Index Fund Category: Morningstar Conservative Allocation Performance Details 0.02% 0.90% -2.32% pages 8-9 Schwab Monthly Income Fund - Maximum Payout (Ticker Symbol: SWLRX) Maximum Payout Composite Index Fund Category: Morningstar Intermediate-Term Bond Performance Details 0.22% 0.87% -0.26% pages 10-11 Minimum Initial Investment1 $100 All fund and index figures on this page assume dividends and distributions were reinvested.
Index figures do not include trading and management costs, which would lower performance. Indices are unmanaged and cannot be invested in directly. For index definitions, please see the Glossary. Fund expenses have been absorbed by CSIM and its affiliates. Without these reductions, the funds’ returns would have been lower.
These returns do not reflect the deduction of taxes that a shareholder would pay on fund distributions or the redemption of fund shares. Source for category information: Morningstar, Inc. The Morningstar Category return represents all active and index mutual funds within the category as of the report date. 1 Please see prospectus for further detail and eligibility requirements. 2 Schwab Monthly Income Funds . From the President Dear Shareholder, At Charles Schwab Investment Management, we aim to make investing straightforward for our investors. Our goal is to provide foundational products with consistent performance that enable investors to build diversified portfolios. Marie Chandoha is President and CEO of Charles Schwab Investment Management, Inc. and the funds covered in this report. Looking at year-end results, 2015 might have seemed a relatively quiet and calm year in many investment sectors. However, 2015 was actually quite unpredictable.
The S&P 500 Index eked out a 1.4% gain while its counterpart benchmark bond index, the Barclays U.S. Aggregate Bond Index, returned only 0.6%. And the MSCI EAFE Index (Net), which broadly represents the performance of international stocks, returned -0.8%.
However, China’s slowing economy, speculation regarding a rise in U.S. short-term interest rates, commodity price decreases, and the surging U.S dollar created uncertainty and volatility, though many indices ultimately ended the year close to their starting points. It was within this environment that Charles Schwab Investment Management’s professional portfolio managers monitored markets and adjusted the portfolios that comprise the Schwab Monthly Income Funds. These funds seek to provide investors with current income and, as a secondary investment objective, capital appreciation. Each fund provides a payout generated from its allocation to fixed-income funds, equity funds, and money market funds. For the 12-month reporting period ended December 31, 2015, the funds generated mixed returns as short-term interest rates remained historically low.
These low rates, combined with dividends and short-term capital gains received, caused the funds’ investments in stock funds to generate more income through dividends than the funds’ investments in fixed-income funds. As a result, the Schwab Monthly Income Fund—Moderate Payout had the highest annual income payout of the three funds, reflecting its larger allocation to stock funds. Asset Class Performance Comparison % returns during the 12 months ended 12/31/2015 This graph compares the performance of various asset classes during the report period. Final performance figures for the period are in the key below. 15% 10% 1.38% S&P 500® Index: measures U.S.
large-cap stocks –4.41% Russell 2000® Index: measures U.S. small-cap stocks –0.81% MSCI EAFE® Index (Net): measures (in U.S. dollars) large-cap stocks in Europe, Australasia and the Far East 5% 0% -5% 0.55% Barclays U.S.
Aggregate Bond Index: measures the U.S. bond market -10% 0.03% Barclays U.S. Treasury Bills 1-3 Months Index: measures short-term U.S. Treasury obligations 12/31/14 2/25 4/29 6/24 8/26 10/28 12/31/15 These figures assume dividends and distributions were reinvested.
Index figures do not include trading and management costs, which would lower performance. Indices are unmanaged and you cannot invest in them directly. Remember that past performance is not a guarantee of future results. Data source: Index provider websites and CSIM. Nothing in this report represents a recommendation of a security by the investment adviser. Management views and portfolio holdings may have changed since the report date. Schwab Monthly Income Funds 3 .
From the President continued For the 12-month reporting period ended December 31, 2015, the funds generated mixed returns as short-term interest rates remained historically low. 4 Schwab Monthly Income Funds Thank you for investing with Charles Schwab Investment Management, and for trusting us to help you achieve your financial goals. For more information about the Schwab Monthly Income Funds, please continue reading this report or visit our website at www.csimfunds.com. We are also happy to hear from you at 1-800-435-4000. Sincerely, . Fund Management Zifan Tang, Ph.D., CFA, Managing Director and Head of Asset Allocation Strategies, leads the portfolio management team and has overall responsibility for all aspects of the management of the funds. She was appointed portfolio manager of the funds in February 2012. Prior to joining CSIM in 2012, Ms. Tang was a product manager at Thomson Reuters and, from 1997 to 2009, worked as a portfolio manager at Barclays Global Investors, which was subsequently acquired by BlackRock. Schwab Monthly Income Funds 5 .
Schwab Monthly Income Fund – Moderate Payout The Schwab Monthly Income Funds (the funds) seek to provide current income, with capital appreciation as a secondary investment objective. The funds primarily invest in a fund-of-funds structure that involves holding equity, fixed income, and money market funds selected from within the Schwab Funds and Laudus Funds complex, but they may buy individual securities and unaffiliated funds to accomplish these objectives. Holdings are based on each fund’s target asset allocation, with returns reflecting the combined performance and respective weightings of the underlying investments. The Schwab Monthly Income Fund—Moderate Payout (the fund) is designed to offer investors a targeted annual payout of 3% to 4%1 and an increase in capital over the long term. However, during a low interest rate environment (such as the one experienced during the reporting period), the fund’s anticipated annual payout is generally expected to be 1% to 3%.
The fund uses the internally calculated, custom-blended Moderate Payout Composite Index (the composite index) as a performance gauge. Market Highlights. U.S. stocks produced mixed returns for the 12-month reporting period.
Large-cap stocks, represented by the S&P 500 Index, returned 1.38%, while small-cap stocks, represented by the Russell 2000 Index, fell 4.41%. Over the reporting period, the U.S. economy showed steady, albeit slow, gains, and in December, after months of anticipation, the Federal Reserve commenced its long-awaited interest-rate hike.
Internationally, both developed and emerging markets struggled amid weak global commodity prices, slowing growth in China, and economic concerns in Europe, among other impacts. Performance. The fund’s distribution yield (payout) was 2.68% for the year ended December 31, 2015, generally in line with the investment adviser’s expectations in the low interest rate environment. For the 12-month reporting period, the fund’s total return was -0.24%, while the composite index returned 0.88%. Positioning and Strategies.
Although the fund’s allocations to equities and fixed income vary within certain established parameters, they were broadly aligned with those of the composite index. The fund’s U.S. large-cap equity exposure detracted the most from both the fund’s total return and relative performance. The fund’s position in the Schwab Dividend Equity FundTM returned -3.52% for the 12-month reporting period, underperforming the composite index’s U.S.
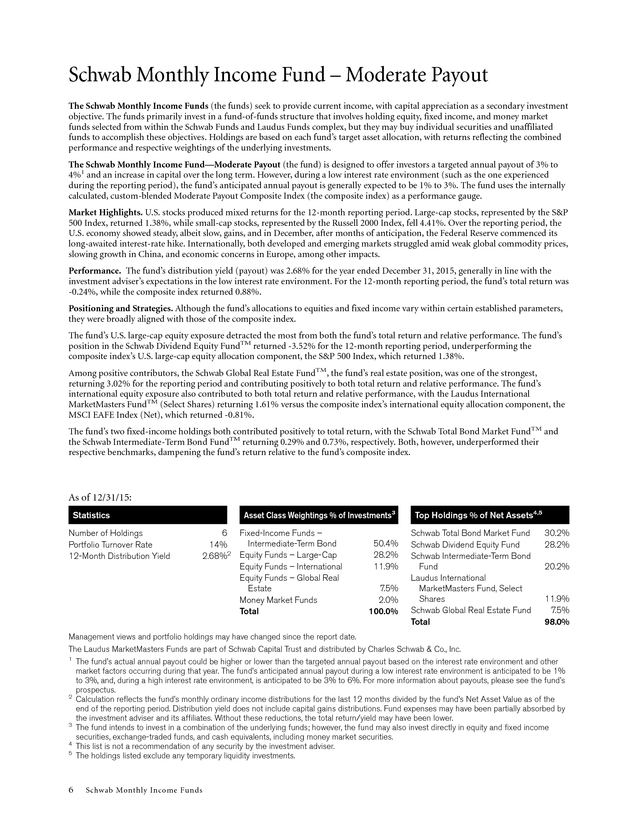
large-cap equity allocation component, the S&P 500 Index, which returned 1.38%. Among positive contributors, the Schwab Global Real Estate FundTM, the fund’s real estate position, was one of the strongest, returning 3.02% for the reporting period and contributing positively to both total return and relative performance. The fund’s international equity exposure also contributed to both total return and relative performance, with the Laudus International MarketMasters FundTM (Select Shares) returning 1.61% versus the composite index’s international equity allocation component, the MSCI EAFE Index (Net), which returned -0.81%. The fund’s two fixed-income holdings both contributed positively to total return, with the Schwab Total Bond Market FundTM and the Schwab Intermediate-Term Bond FundTM returning 0.29% and 0.73%, respectively. Both, however, underperformed their respective benchmarks, dampening the fund’s return relative to the fund’s composite index. As of 12/31/15: Asset Class Weightings % of Investments3 Statistics Number of Holdings Portfolio Turnover Rate 12-Month Distribution Yield 6 Fixed-Income Funds – Intermediate-Term Bond 14% 2.68%2 Equity Funds – Large-Cap Equity Funds – International Equity Funds – Global Real Estate Money Market Funds Total 50.4% 28.2% 11.9% 7.5% 2.0% 100.0% Top Holdings % of Net Assets4,5 Schwab Total Bond Market Fund Schwab Dividend Equity Fund Schwab Intermediate-Term Bond Fund Laudus International MarketMasters Fund, Select Shares Schwab Global Real Estate Fund Total 30.2% 28.2% 20.2% 11.9% 7.5% 98.0% Management views and portfolio holdings may have changed since the report date. The Laudus MarketMasters Funds are part of Schwab Capital Trust and distributed by Charles Schwab & Co., Inc. 1 The fund’s actual annual payout could be higher or lower than the targeted annual payout based on the interest rate environment and other market factors occurring during that year.
The fund’s anticipated annual payout during a low interest rate environment is anticipated to be 1% to 3%, and, during a high interest rate environment, is anticipated to be 3% to 6%. For more information about payouts, please see the fund’s prospectus. 2 Calculation reflects the fund’s monthly ordinary income distributions for the last 12 months divided by the fund’s Net Asset Value as of the end of the reporting period. Distribution yield does not include capital gains distributions.
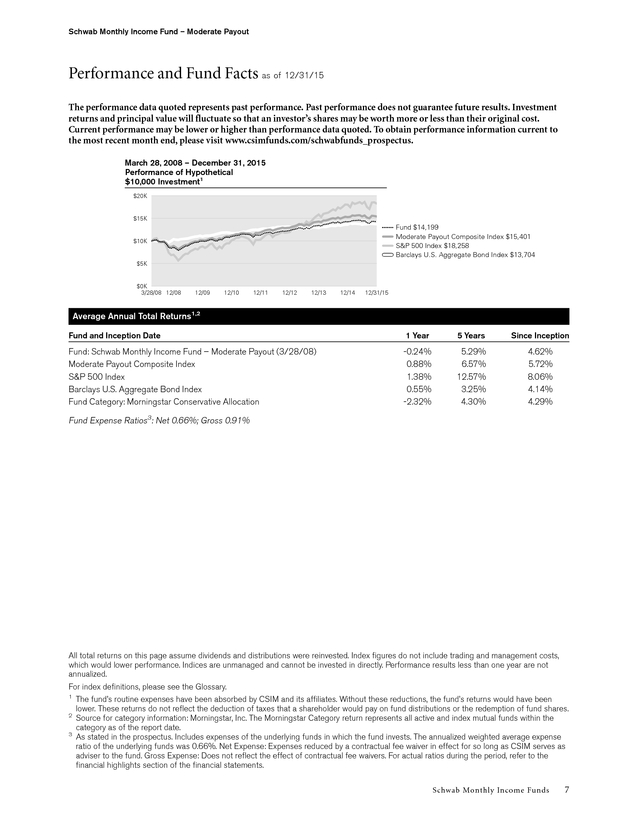
Fund expenses may have been partially absorbed by the investment adviser and its affiliates. Without these reductions, the total return/yield may have been lower. 3 The fund intends to invest in a combination of the underlying funds; however, the fund may also invest directly in equity and fixed income securities, exchange-traded funds, and cash equivalents, including money market securities. 4 This list is not a recommendation of any security by the investment adviser. 5 The holdings listed exclude any temporary liquidity investments. 6 Schwab Monthly Income Funds . Schwab Monthly Income Fund – Moderate Payout Performance and Fund Facts as of 12/31/15 The performance data quoted represents past performance. Past performance does not guarantee future results. Investment returns and principal value will fluctuate so that an investor’s shares may be worth more or less than their original cost. Current performance may be lower or higher than performance data quoted. To obtain performance information current to the most recent month end, please visit www.csimfunds.com/schwabfunds_prospectus. March 28, 2008 – December 31, 2015 Performance of Hypothetical $10,000 Investment1 $20K $15K Fund $14,199 Moderate Payout Composite Index $15,401 S&P 500 Index $18,258 Barclays U.S.
Aggregate Bond Index $13,704 $10K $5K $0K 3/28/08 12/08 12/09 12/10 12/11 12/12 12/13 12/14 12/31/15 Average Annual Total Returns1,2 Fund and Inception Date 1 Year 5 Years Since Inception Fund: Schwab Monthly Income Fund – Moderate Payout (3/28/08) Moderate Payout Composite Index S&P 500 Index Barclays U.S. Aggregate Bond Index Fund Category: Morningstar Conservative Allocation -0.24% 0.88% 1.38% 0.55% -2.32% 5.29% 6.57% 12.57% 3.25% 4.30% 4.62% 5.72% 8.06% 4.14% 4.29% Fund Expense Ratios3: Net 0.66%; Gross 0.91% All total returns on this page assume dividends and distributions were reinvested. Index figures do not include trading and management costs, which would lower performance.
Indices are unmanaged and cannot be invested in directly. Performance results less than one year are not annualized. For index definitions, please see the Glossary. 1 The fund’s routine expenses have been absorbed by CSIM and its affiliates. Without these reductions, the fund’s returns would have been lower.
These returns do not reflect the deduction of taxes that a shareholder would pay on fund distributions or the redemption of fund shares. 2 Source for category information: Morningstar, Inc. The Morningstar Category return represents all active and index mutual funds within the category as of the report date. 3 As stated in the prospectus. Includes expenses of the underlying funds in which the fund invests.
The annualized weighted average expense ratio of the underlying funds was 0.66%. Net Expense: Expenses reduced by a contractual fee waiver in effect for so long as CSIM serves as adviser to the fund. Gross Expense: Does not reflect the effect of contractual fee waivers.
For actual ratios during the period, refer to the financial highlights section of the financial statements. Schwab Monthly Income Funds 7 . Schwab Monthly Income Fund – Enhanced Payout The Schwab Monthly Income Funds (the funds) seek to provide current income, with capital appreciation as a secondary investment objective. The funds primarily invest in a fund-of-funds structure that involves holding equity, fixed income, and money market funds selected from within the Schwab Funds and Laudus Funds complex, but they may buy individual securities and unaffiliated funds to accomplish these objectives. Holdings are based on each fund’s target asset allocation, with returns reflecting the combined performance and respective weightings of the underlying investments. The Schwab Monthly Income Fund—Enhanced Payout (the fund) is designed to offer investors a targeted annual payout of 4% to 5%1 and an increase in capital over the long term. However, during a low interest rate environment (such as the one experienced during the reporting period), the fund’s anticipated annual payout is generally expected to be 1% to 4%.
The fund uses the internally calculated Enhanced Payout Composite Index (the composite index) as a performance gauge. Market Highlights. U.S. stocks produced mixed returns for the 12-month reporting period.
Large-cap stocks, represented by the S&P 500 Index, returned 1.38%, while small-cap stocks, represented by the Russell 2000 Index, fell 4.41%. Over the reporting period, the U.S. economy showed steady, albeit slow, gains, and in December, after months of anticipation, the Federal Reserve commenced its long-awaited interest-rate hike.
Internationally, both developed and emerging markets struggled amid weak global commodity prices, slowing growth in China, and economic concerns in Europe, among other impacts. Performance. The fund’s distribution yield (payout) was 2.41% for the year ended December 31, 2015, generally in line with the investment adviser’s expectations in the low interest rate environment. For the 12-month reporting period, the fund’s total return was 0.02%, with the composite index returning 0.90%. Positioning and Strategies.
Although the fund’s allocations to equities and fixed income vary within certain established parameters, they were broadly aligned with those of the composite index. The fund’s U.S. large-cap equity exposure detracted the most from both the fund’s total return and its relative performance. The fund’s position in the Schwab Dividend Equity FundTM returned -3.52% for the 12-month reporting period, underperforming the composite index’s U.S.
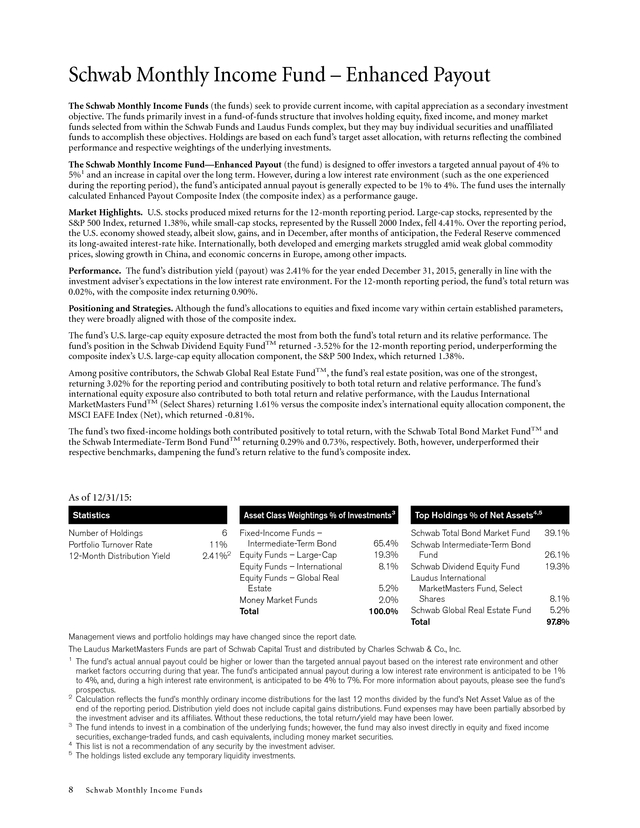
large-cap equity allocation component, the S&P 500 Index, which returned 1.38%. Among positive contributors, the Schwab Global Real Estate FundTM, the fund’s real estate position, was one of the strongest, returning 3.02% for the reporting period and contributing positively to both total return and relative performance. The fund’s international equity exposure also contributed to both total return and relative performance, with the Laudus International MarketMasters FundTM (Select Shares) returning 1.61% versus the composite index’s international equity allocation component, the MSCI EAFE Index (Net), which returned -0.81%. The fund’s two fixed-income holdings both contributed positively to total return, with the Schwab Total Bond Market FundTM and the Schwab Intermediate-Term Bond FundTM returning 0.29% and 0.73%, respectively. Both, however, underperformed their respective benchmarks, dampening the fund’s return relative to the fund’s composite index. As of 12/31/15: Statistics Number of Holdings Portfolio Turnover Rate 12-Month Distribution Yield Asset Class Weightings % of Investments3 6 Fixed-Income Funds – Intermediate-Term Bond 11% 2.41%2 Equity Funds – Large-Cap Equity Funds – International Equity Funds – Global Real Estate Money Market Funds Total 65.4% 19.3% 8.1% 5.2% 2.0% 100.0% Top Holdings % of Net Assets4,5 Schwab Total Bond Market Fund Schwab Intermediate-Term Bond Fund Schwab Dividend Equity Fund Laudus International MarketMasters Fund, Select Shares Schwab Global Real Estate Fund Total 39.1% 26.1% 19.3% 8.1% 5.2% 97.8% Management views and portfolio holdings may have changed since the report date. The Laudus MarketMasters Funds are part of Schwab Capital Trust and distributed by Charles Schwab & Co., Inc. 1 The fund’s actual annual payout could be higher or lower than the targeted annual payout based on the interest rate environment and other market factors occurring during that year.
The fund’s anticipated annual payout during a low interest rate environment is anticipated to be 1% to 4%, and, during a high interest rate environment, is anticipated to be 4% to 7%. For more information about payouts, please see the fund’s prospectus. 2 Calculation reflects the fund’s monthly ordinary income distributions for the last 12 months divided by the fund’s Net Asset Value as of the end of the reporting period. Distribution yield does not include capital gains distributions.
Fund expenses may have been partially absorbed by the investment adviser and its affiliates. Without these reductions, the total return/yield may have been lower. 3 The fund intends to invest in a combination of the underlying funds; however, the fund may also invest directly in equity and fixed income securities, exchange-traded funds, and cash equivalents, including money market securities. 4 This list is not a recommendation of any security by the investment adviser. 5 The holdings listed exclude any temporary liquidity investments. 8 Schwab Monthly Income Funds . Schwab Monthly Income Fund – Enhanced Payout Performance and Fund Facts as of 12/31/15 The performance data quoted represents past performance. Past performance does not guarantee future results. Investment returns and principal value will fluctuate so that an investor’s shares may be worth more or less than their original cost. Current performance may be lower or higher than performance data quoted. To obtain performance information current to the most recent month end, please visit www.csimfunds.com/schwabfunds_prospectus. March 28, 2008 – December 31, 2015 Performance of Hypothetical $10,000 Investment1,2 $20K $15K Fund $13,775 Enhanced Payout Composite Index $14,870 S&P 500 Index $18,258 Barclays U.S.
Aggregate Bond Index $13,704 $10K $5K $0K 3/28/08 12/08 12/09 12/10 12/11 12/12 12/13 12/14 12/31/15 Average Annual Total Returns1,2,3 Fund and Inception Date 1 Year 5 Years Since Inception Fund: Schwab Monthly Income Fund – Enhanced Payout (3/28/08) Enhanced Payout Composite Index S&P 500 Index Barclays U.S. Aggregate Bond Index Fund Category: Morningstar Conservative Allocation 0.02% 0.90% 1.38% 0.55% -2.32% 4.47% 5.44% 12.57% 3.25% 4.30% 4.21% 5.24% 8.06% 4.14% 4.29% Fund Expense Ratios4: Net 0.57%; Gross 0.72% All total returns on this page assume dividends and distributions were reinvested. Index figures do not include trading and management costs, which would lower performance.
Indices are unmanaged and cannot be invested in directly. Performance results less than one year are not annualized. For index definitions, please see the Glossary. 1 The fund’s routine expenses have been absorbed by CSIM and its affiliates. Without these reductions, the fund’s returns would have been lower.
These returns do not reflect the deduction of taxes that a shareholder would pay on fund distributions or the redemption of fund shares. 2 On June 16, 2009, the Schwab Retirement Income Fund merged into the fund. 3 Source for category information: Morningstar, Inc. The Morningstar Category return represents all active and index mutual funds within the category as of the report date. 4 As stated in the prospectus. Includes expenses of the underlying funds in which the fund invests.
The annualized weighted average expense ratio of the underlying funds was 0.57%. Net Expense: Expenses reduced by a contractual fee waiver for so long as CSIM serves as the adviser to the fund. Gross Expense: Does not reflect the effect of contractual fee waivers.
For actual ratios during the period, refer to the financial highlights section in the financial statements. Schwab Monthly Income Funds 9 . Schwab Monthly Income Fund – Maximum Payout The Schwab Monthly Income Funds (the funds) seek to provide current income, with capital appreciation as a secondary investment objective. The funds primarily invest in a fund-of-funds structure that involves holding equity, fixed income, and money market funds selected from within the Schwab Funds and Laudus Funds complex, but they may buy individual securities and unaffiliated funds to accomplish these objectives. Holdings are based on each fund’s target asset allocation, with returns reflecting the combined performance and respective weightings of the underlying investments. The Schwab Monthly Income Fund—Maximum Payout (the fund) is designed to offer investors a targeted annual payout of 5% to 6%1 and an increase in capital over the long term. However, during a low interest rate environment (such as the one experienced during the reporting period), the fund’s anticipated annual payout is generally expected to be 1% to 5%.
The fund uses the internally calculated Maximum Payout Composite Index (the composite index) as a performance gauge. Market Highlights. U.S. stocks produced mixed returns for the 12-month reporting period.
Large-cap stocks, represented by the S&P 500 Index, returned 1.38%, while small-cap stocks, represented by the Russell 2000 Index, fell 4.41%. Over the reporting period, the U.S. economy showed steady, albeit slow, gains, and in December, after months of anticipation, the Federal Reserve commenced its long-awaited interest-rate hike.
Internationally, both developed and emerging markets struggled amid weak global commodity prices, slowing growth in China, and economic concerns in Europe, among other impacts. Performance. The fund’s distribution yield (payout) was 2.30% for the year ended December 31, 2015, generally in line with the investment adviser’s expectations in the low interest rate environment. For the 12-month reporting period, the fund’s total return was 0.22%, with the composite index returning 0.87%. Positioning and Strategies.
Although the fund’s allocations to equities and fixed income vary within certain established parameters, they were broadly aligned with those of the composite index. The fund’s U.S. large-cap equity exposure detracted the most from both the fund’s total return and its relative performance. The fund’s position in the Schwab Dividend Equity FundTM returned -3.52% for the 12-month reporting period, underperforming the composite index’s U.S.
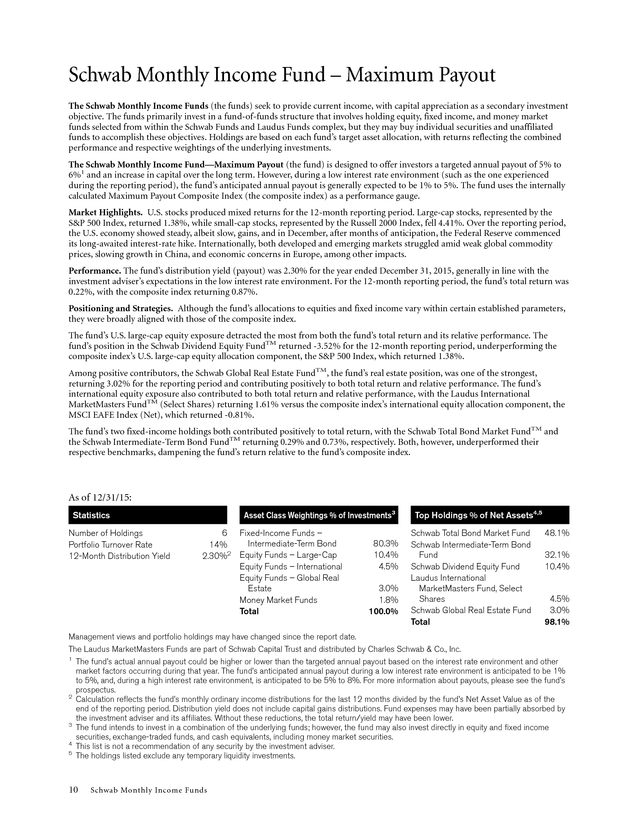
large-cap equity allocation component, the S&P 500 Index, which returned 1.38%. Among positive contributors, the Schwab Global Real Estate FundTM, the fund’s real estate position, was one of the strongest, returning 3.02% for the reporting period and contributing positively to both total return and relative performance. The fund’s international equity exposure also contributed to both total return and relative performance, with the Laudus International MarketMasters FundTM (Select Shares) returning 1.61% versus the composite index’s international equity allocation component, the MSCI EAFE Index (Net), which returned -0.81%. The fund’s two fixed-income holdings both contributed positively to total return, with the Schwab Total Bond Market FundTM and the Schwab Intermediate-Term Bond FundTM returning 0.29% and 0.73%, respectively. Both, however, underperformed their respective benchmarks, dampening the fund’s return relative to the fund’s composite index. As of 12/31/15: Asset Class Weightings % of Investments3 Statistics Number of Holdings Portfolio Turnover Rate 12-Month Distribution Yield 6 Fixed-Income Funds – Intermediate-Term Bond 14% 2.30%2 Equity Funds – Large-Cap Equity Funds – International Equity Funds – Global Real Estate Money Market Funds Total 80.3% 10.4% 4.5% 3.0% 1.8% 100.0% Top Holdings % of Net Assets4,5 Schwab Total Bond Market Fund Schwab Intermediate-Term Bond Fund Schwab Dividend Equity Fund Laudus International MarketMasters Fund, Select Shares Schwab Global Real Estate Fund Total 48.1% 32.1% 10.4% 4.5% 3.0% 98.1% Management views and portfolio holdings may have changed since the report date. The Laudus MarketMasters Funds are part of Schwab Capital Trust and distributed by Charles Schwab & Co., Inc. 1 The fund’s actual annual payout could be higher or lower than the targeted annual payout based on the interest rate environment and other market factors occurring during that year.
The fund’s anticipated annual payout during a low interest rate environment is anticipated to be 1% to 5%, and, during a high interest rate environment, is anticipated to be 5% to 8%. For more information about payouts, please see the fund’s prospectus. 2 Calculation reflects the fund’s monthly ordinary income distributions for the last 12 months divided by the fund’s Net Asset Value as of the end of the reporting period. Distribution yield does not include capital gains distributions.
Fund expenses may have been partially absorbed by the investment adviser and its affiliates. Without these reductions, the total return/yield may have been lower. 3 The fund intends to invest in a combination of the underlying funds; however, the fund may also invest directly in equity and fixed income securities, exchange-traded funds, and cash equivalents, including money market securities. 4 This list is not a recommendation of any security by the investment adviser. 5 The holdings listed exclude any temporary liquidity investments. 10 Schwab Monthly Income Funds . Schwab Monthly Income Fund – Maximum Payout Performance and Fund Facts as of 12/31/15 The performance data quoted represents past performance. Past performance does not guarantee future results. Investment returns and principal value will fluctuate so that an investor’s shares may be worth more or less than their original cost. Current performance may be lower or higher than performance data quoted. To obtain performance information current to the most recent month end, please visit www.csimfunds.com/schwabfunds_prospectus. March 28, 2008 – December 31, 2015 Performance of Hypothetical $10,000 Investment1 $20K $15K Fund $13,019 Maximum Payout Composite Index $14,292 S&P 500 Index $18,258 Barclays U.S.
Aggregate Bond Index $13,704 $10K $5K $0K 3/28/08 12/08 12/09 12/10 12/11 12/12 12/13 12/14 12/31/15 Average Annual Total Returns1,2 Fund and Inception Date 1 Year 5 Years Since Inception Fund: Schwab Monthly Income Fund – Maximum Payout (3/28/08) Maximum Payout Composite Index S&P 500 Index Barclays U.S. Aggregate Bond Index Fund Category: Morningstar Intermediate-Term Bond 0.22% 0.87% 1.38% 0.55% -0.26% 3.24% 4.29% 12.57% 3.25% 3.22% 3.45% 4.71% 8.06% 4.14% 4.20% Fund Expense Ratios3: Net 0.47%; Gross 0.69% All total returns on this page assume dividends and distributions were reinvested. Index figures do not include trading and management costs, which would lower performance.
Indices are unmanaged and cannot be invested in directly. Performance results less than one year are not annualized. For index definitions, please see the Glossary. 1 The fund’s routine expenses have been absorbed by CSIM and its affiliates. Without these reductions, the fund’s returns would have been lower.
These returns do not reflect the deduction of taxes that a shareholder would pay on fund distributions or the redemption of fund shares. 2 Source for category information: Morningstar, Inc. The Morningstar Category return represents all active and index mutual funds within the category as of the report date. 3 As stated in the prospectus. Includes expenses of the underlying funds in which the fund invests.
The annualized weighted average expense ratio of the underlying funds was 0.47%. Net Expense: Expenses reduced by a contractual fee waiver for so long as CSIM serves as the adviser to the fund. Gross Expense: Does not reflect the effect of contractual fee waivers.
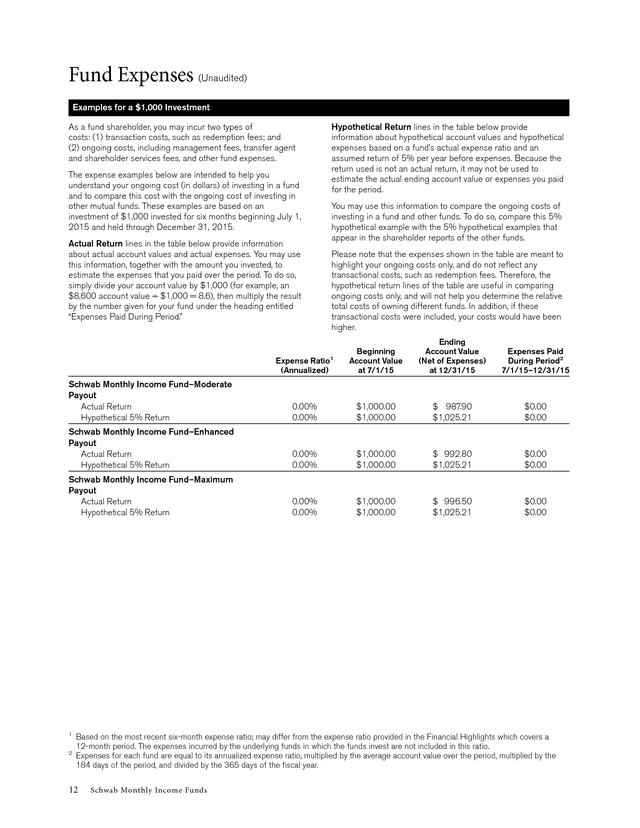
For actual ratios during the period, refer to the financial highlights section in the financial statements. Schwab Monthly Income Funds 11 . Fund Expenses (Unaudited) Examples for a $1,000 Investment As a fund shareholder, you may incur two types of costs: (1) transaction costs, such as redemption fees; and (2) ongoing costs, including management fees, transfer agent and shareholder services fees, and other fund expenses. The expense examples below are intended to help you understand your ongoing cost (in dollars) of investing in a fund and to compare this cost with the ongoing cost of investing in other mutual funds. These examples are based on an investment of $1,000 invested for six months beginning July 1, 2015 and held through December 31, 2015. Actual Return lines in the table below provide information about actual account values and actual expenses. You may use this information, together with the amount you invested, to estimate the expenses that you paid over the period. To do so, simply divide your account value by $1,000 (for example, an $8,600 account value ÷ $1,000 = 8.6), then multiply the result by the number given for your fund under the heading entitled “Expenses Paid During Period.” Hypothetical Return lines in the table below provide information about hypothetical account values and hypothetical expenses based on a fund’s actual expense ratio and an assumed return of 5% per year before expenses.
Because the return used is not an actual return, it may not be used to estimate the actual ending account value or expenses you paid for the period. You may use this information to compare the ongoing costs of investing in a fund and other funds. To do so, compare this 5% hypothetical example with the 5% hypothetical examples that appear in the shareholder reports of the other funds. Please note that the expenses shown in the table are meant to highlight your ongoing costs only, and do not reflect any transactional costs, such as redemption fees. Therefore, the hypothetical return lines of the table are useful in comparing ongoing costs only, and will not help you determine the relative total costs of owning different funds.
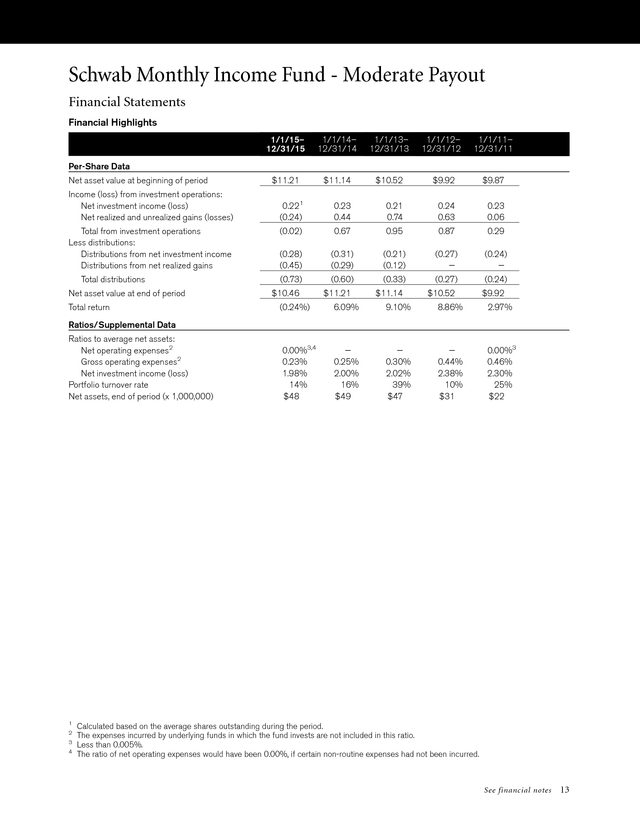
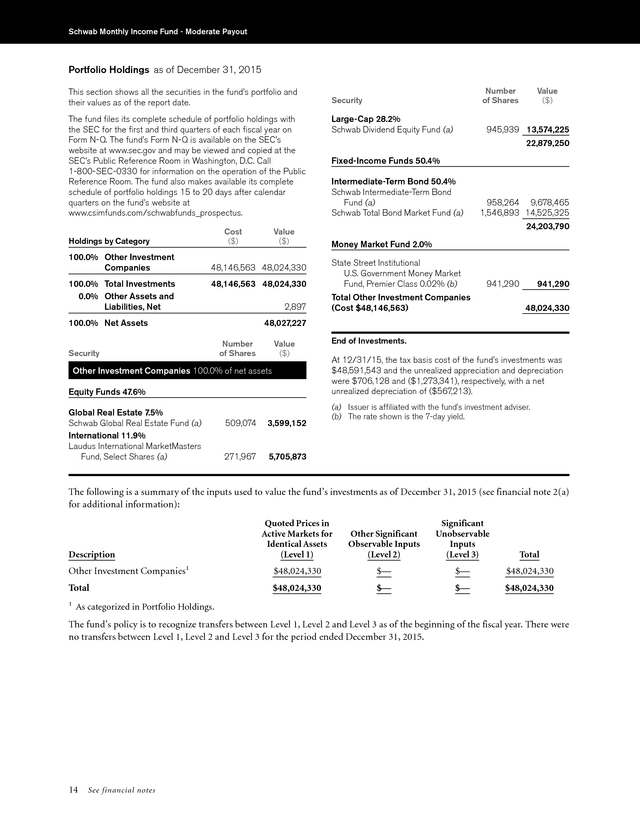
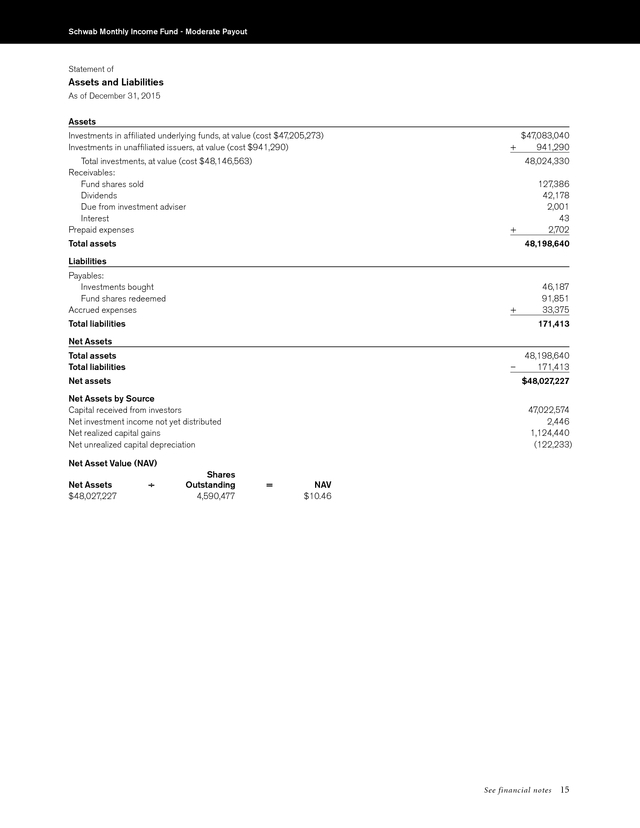
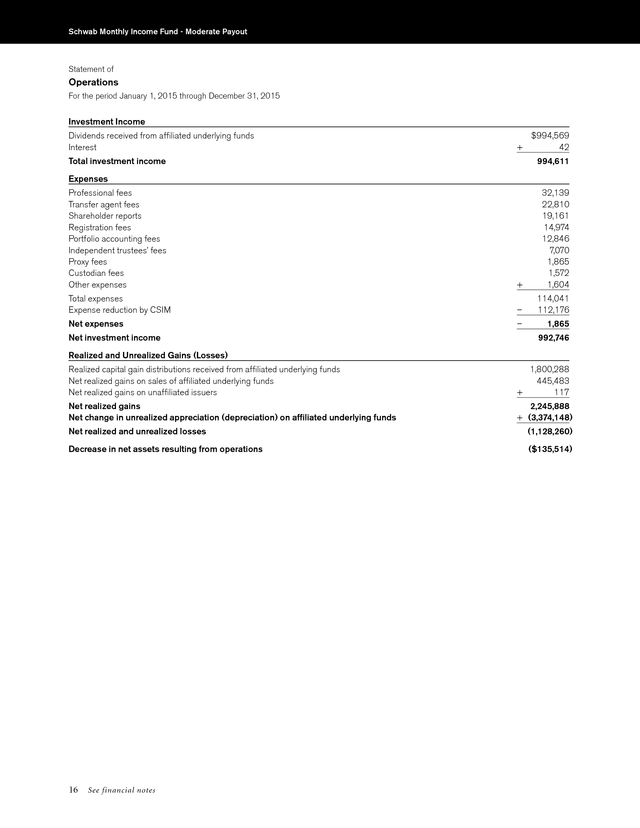
In addition, if these transactional costs were included, your costs would have been higher. Expense Ratio1 (Annualized) Beginning Account Value at 7/1/15 Ending Account Value (Net of Expenses) at 12/31/15 Expenses Paid During Period2 7/1/15–12/31/15 Schwab Monthly Income Fund–Moderate Payout Actual Return Hypothetical 5% Return 0.00% 0.00% $1,000.00 $1,000.00 $ 987.90 $1,025.21 $0.00 $0.00 Schwab Monthly Income Fund–Enhanced Payout Actual Return Hypothetical 5% Return 0.00% 0.00% $1,000.00 $1,000.00 $ 992.80 $1,025.21 $0.00 $0.00 Schwab Monthly Income Fund–Maximum Payout Actual Return Hypothetical 5% Return 0.00% 0.00% $1,000.00 $1,000.00 $ 996.50 $1,025.21 $0.00 $0.00 1 2 Based on the most recent six-month expense ratio; may differ from the expense ratio provided in the Financial Highlights which covers a 12-month period. The expenses incurred by the underlying funds in which the funds invest are not included in this ratio. Expenses for each fund are equal to its annualized expense ratio, multiplied by the average account value over the period, multiplied by the 184 days of the period, and divided by the 365 days of the fiscal year. 12 Schwab Monthly Income Funds . Schwab Monthly Income Fund - Moderate Payout Financial Statements Financial Highlights 1/1/15– 12/31/15 1/1/14– 12/31/14 1/1/13– 12/31/13 1/1/12– 12/31/12 1/1/11– 12/31/11 $11.21 $11.14 $10.52 $9.92 $9.87 0.221 (0.24) 0.23 0.44 0.21 0.74 0.24 0.63 0.23 0.06 (0.02) 0.67 0.95 0.87 0.29 (0.28) (0.45) (0.31) (0.29) (0.21) (0.12) (0.27) — (0.24) — Per-Share Data Net asset value at beginning of period Income (loss) from investment operations: Net investment income (loss) Net realized and unrealized gains (losses) Total from investment operations Less distributions: Distributions from net investment income Distributions from net realized gains Total distributions Net asset value at end of period Total return (0.73) $10.46 (0.60) $11.21 (0.33) $11.14 (0.27) $10.52 (0.24) $9.92 (0.24%) 6.09% 9.10% 8.86% 2.97% 0.00%3,4 0.23% 1.98% 14% $48 — 0.25% 2.00% 16% $49 — 0.30% 2.02% 39% $47 — 0.44% 2.38% 10% $31 0.00%3 0.46% 2.30% 25% $22 Ratios/Supplemental Data Ratios to average net assets: Net operating expenses2 Gross operating expenses2 Net investment income (loss) Portfolio turnover rate Net assets, end of period (x 1,000,000) 1 2 3 4 Calculated based on the average shares outstanding during the period. The expenses incurred by underlying funds in which the fund invests are not included in this ratio. Less than 0.005%. The ratio of net operating expenses would have been 0.00%, if certain non-routine expenses had not been incurred. See financial notes 13 . Schwab Monthly Income Fund - Moderate Payout Portfolio Holdings as of December 31, 2015 This section shows all the securities in the fund’s portfolio and their values as of the report date. The fund files its complete schedule of portfolio holdings with the SEC for the first and third quarters of each fiscal year on Form N-Q. The fund’s Form N-Q is available on the SEC’s website at www.sec.gov and may be viewed and copied at the SEC’s Public Reference Room in Washington, D.C. Call 1-800-SEC-0330 for information on the operation of the Public Reference Room. The fund also makes available its complete schedule of portfolio holdings 15 to 20 days after calendar quarters on the fund’s website at www.csimfunds.com/schwabfunds_prospectus. Cost ($) Holdings by Category 100.0% Other Investment Companies Value ($) 48,146,563 48,024,330 100.0% Total Investments 0.0% Other Assets and Liabilities, Net 48,146,563 48,024,330 2,897 100.0% Net Assets Number of Shares Security Large-Cap 28.2% Schwab Dividend Equity Fund (a) Value ($) 945,939 13,574,225 22,879,250 Fixed-Income Funds 50.4% Intermediate-Term Bond 50.4% Schwab Intermediate-Term Bond Fund (a) Schwab Total Bond Market Fund (a) 958,264 9,678,465 1,546,893 14,525,325 24,203,790 Money Market Fund 2.0% State Street Institutional U.S.
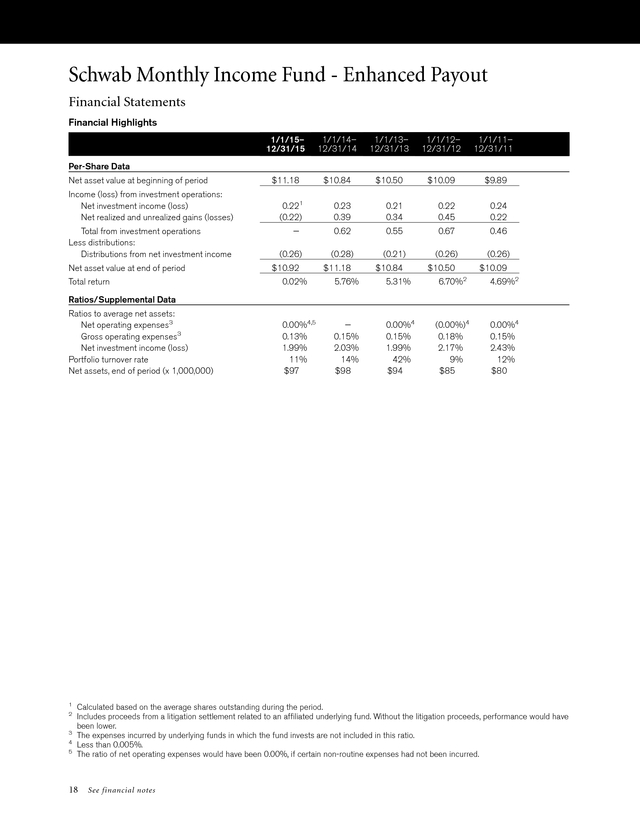
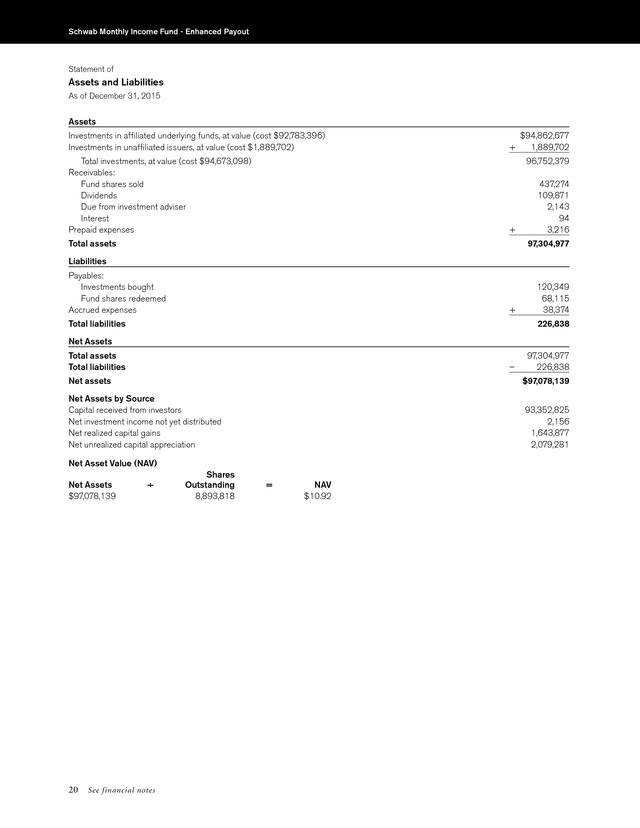
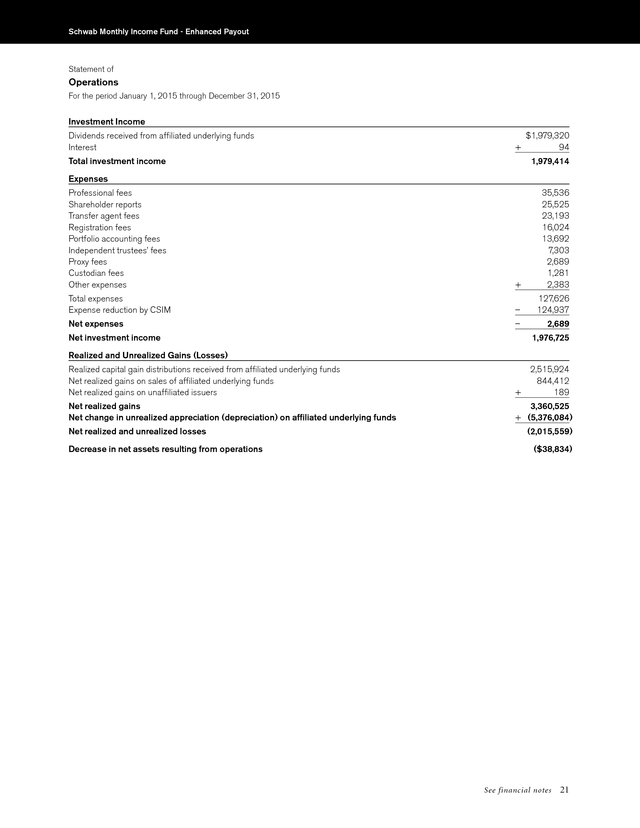
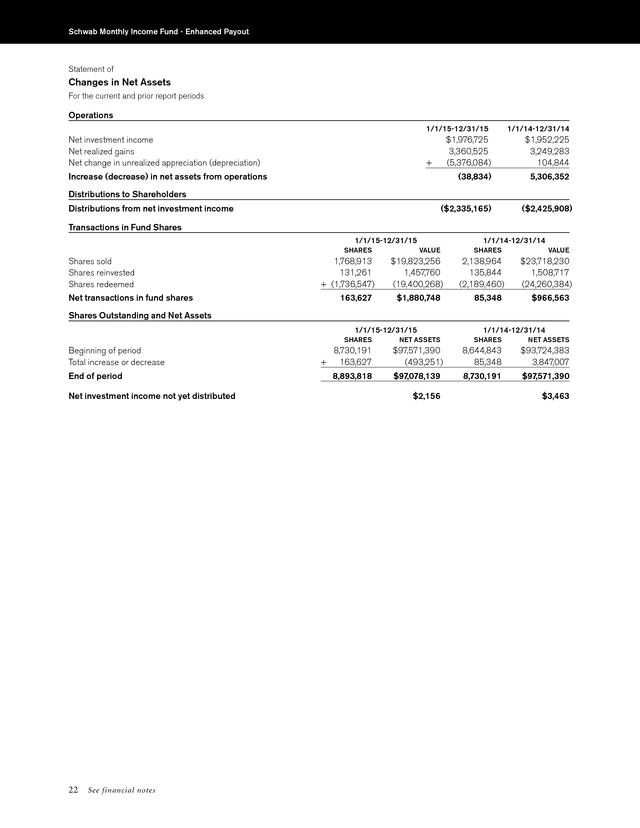
Government Money Market Fund, Premier Class 0.02% (b) 941,290 941,290 Total Other Investment Companies (Cost $48,146,563) 48,024,330 48,027,227 Number of Shares Security Value ($) Other Investment Companies 100.0% of net assets Equity Funds 47.6% Global Real Estate 7.5% Schwab Global Real Estate Fund (a) International 11.9% Laudus International MarketMasters Fund, Select Shares (a) 509,074 3,599,152 271,967 End of Investments. At 12/31/15, the tax basis cost of the fund’s investments was $48,591,543 and the unrealized appreciation and depreciation were $706,128 and ($1,273,341), respectively, with a net unrealized depreciation of ($567,213). (a) Issuer is affiliated with the fund’s investment adviser. (b) The rate shown is the 7-day yield. 5,705,873 The following is a summary of the inputs used to value the fund’s investments as of December 31, 2015 (see financial note 2(a) for additional information): Quoted Prices in Active Markets for Identical Assets (Level 1) Description Other Investment Companies 1 Total 1 Other Significant Observable Inputs (Level 2) Significant Unobservable Inputs (Level 3) Total $48,024,330 $— $— $48,024,330 $48,024,330 $— $— $48,024,330 As categorized in Portfolio Holdings. The fund’s policy is to recognize transfers between Level 1, Level 2 and Level 3 as of the beginning of the fiscal year. There were no transfers between Level 1, Level 2 and Level 3 for the period ended December 31, 2015. 14 See financial notes . Schwab Monthly Income Fund - Moderate Payout Statement of Assets and Liabilities As of December 31, 2015 Assets Investments in affiliated underlying funds, at value (cost $47,205,273) Investments in unaffiliated issuers, at value (cost $941,290) Total investments, at value (cost $48,146,563) Receivables: Fund shares sold Dividends Due from investment adviser Interest Prepaid expenses + $47,083,040 941,290 48,024,330 + Total assets 127,386 42,178 2,001 43 2,702 48,198,640 Liabilities Payables: Investments bought Fund shares redeemed Accrued expenses + Total liabilities 46,187 91,851 33,375 171,413 Net Assets Total assets Total liabilities – Net assets 48,198,640 171,413 $48,027,227 Net Assets by Source Capital received from investors Net investment income not yet distributed Net realized capital gains Net unrealized capital depreciation 47,022,574 2,446 1,124,440 (122,233) Net Asset Value (NAV) Net Assets $48,027,227 ÷ Shares Outstanding 4,590,477 = NAV $10.46 See financial notes 15 . Schwab Monthly Income Fund - Moderate Payout Statement of Operations For the period January 1, 2015 through December 31, 2015 Investment Income Dividends received from affiliated underlying funds Interest + Total investment income $994,569 42 994,611 Expenses Professional fees Transfer agent fees Shareholder reports Registration fees Portfolio accounting fees Independent trustees’ fees Proxy fees Custodian fees Other expenses + 32,139 22,810 19,161 14,974 12,846 7,070 1,865 1,572 1,604 Total expenses Expense reduction by CSIM – 114,041 112,176 Net expenses – Net investment income 1,865 992,746 Realized and Unrealized Gains (Losses) Realized capital gain distributions received from affiliated underlying funds Net realized gains on sales of affiliated underlying funds Net realized gains on unaffiliated issuers 1,800,288 445,483 + 117 Net realized gains Net change in unrealized appreciation (depreciation) on affiliated underlying funds 2,245,888 + (3,374,148) Net realized and unrealized losses (1,128,260) Decrease in net assets resulting from operations ($135,514) 16 See financial notes . Schwab Monthly Income Fund - Moderate Payout Statement of Changes in Net Assets For the current and prior report periods Operations 1/1/15-12/31/15 Net investment income Net realized gains Net change in unrealized appreciation (depreciation) $992,746 2,245,888 (3,374,148) + Increase (decrease) in net assets from operations (135,514) 1/1/14-12/31/14 $966,013 2,288,004 (455,302) 2,798,715 Distributions to Shareholders Distributions from net investment income Distributions from net realized gains (1,248,331) (1,982,552) (1,307,174) (1,249,978) ($3,230,883) ($2,557,152) + Total distributions Transactions in Fund Shares 1/1/15-12/31/15 SHARES Shares sold Shares reinvested Shares redeemed 1,279,695 208,157 + (1,244,496) Net transactions in fund shares 243,356 1/1/14-12/31/14 VALUE $14,409,270 2,219,724 (13,957,122) $2,671,872 SHARES 1,143,611 155,071 (1,165,942) 132,740 VALUE $13,072,822 1,750,261 (13,293,779) $1,529,304 Shares Outstanding and Net Assets 1/1/15-12/31/15 SHARES Beginning of period Total increase or decrease End of period Net investment income not yet distributed + NET ASSETS 1/1/14-12/31/14 SHARES NET ASSETS 4,347,121 243,356 $48,721,752 (694,525) 4,214,381 132,740 $46,950,885 1,770,867 4,590,477 $48,027,227 4,347,121 $48,721,752 $2,446 $1,084 See financial notes 17 . Schwab Monthly Income Fund - Enhanced Payout Financial Statements Financial Highlights 1/1/15– 12/31/15 1/1/14– 12/31/14 1/1/13– 12/31/13 1/1/12– 12/31/12 1/1/11– 12/31/11 $11.18 $10.84 $10.50 $10.09 $9.89 0.23 0.39 0.21 0.34 0.22 0.45 0.24 0.22 0.62 0.55 0.67 0.46 Per-Share Data Net asset value at beginning of period Income (loss) from investment operations: Net investment income (loss) Net realized and unrealized gains (losses) Total from investment operations Less distributions: Distributions from net investment income Net asset value at end of period Total return 0.221 (0.22) — (0.26) $10.92 (0.28) $11.18 (0.21) $10.84 (0.26) $10.50 (0.26) $10.09 0.02% 5.76% 5.31% 6.70%2 4.69%2 0.00%4,5 0.13% 1.99% 11% $97 — 0.15% 2.03% 14% $98 0.00%4 0.15% 1.99% 42% $94 (0.00%)4 0.18% 2.17% 9% $85 0.00%4 0.15% 2.43% 12% $80 Ratios/Supplemental Data Ratios to average net assets: Net operating expenses3 Gross operating expenses3 Net investment income (loss) Portfolio turnover rate Net assets, end of period (x 1,000,000) 1 2 3 4 5 Calculated based on the average shares outstanding during the period. Includes proceeds from a litigation settlement related to an affiliated underlying fund. Without the litigation proceeds, performance would have been lower. The expenses incurred by underlying funds in which the fund invests are not included in this ratio. Less than 0.005%. The ratio of net operating expenses would have been 0.00%, if certain non-routine expenses had not been incurred. 18 See financial notes . Schwab Monthly Income Fund - Enhanced Payout Portfolio Holdings as of December 31, 2015 This section shows all the securities in the fund’s portfolio and their values as of the report date. The fund files its complete schedule of portfolio holdings with the SEC for the first and third quarters of each fiscal year on Form N-Q. The fund’s Form N-Q is available on the SEC’s website at www.sec.gov and may be viewed and copied at the SEC’s Public Reference Room in Washington, D.C. Call 1-800-SEC-0330 for information on the operation of the Public Reference Room. The fund also makes available its complete schedule of portfolio holdings 15 to 20 days after calendar quarters on the fund’s website at www.csimfunds.com/schwabfunds_prospectus. Cost ($) Holdings by Category 99.7% Other Investment Companies Value ($) 94,673,098 96,752,379 99.7% Total Investments 0.3% Other Assets and Liabilities, Net 94,673,098 96,752,379 325,760 100.0% Net Assets Security Number of Shares Value ($) Large-Cap 19.3% Schwab Dividend Equity Fund (a) 1,301,005 18,669,416 31,618,600 Fixed-Income Funds 65.2% Intermediate-Term Bond 65.2% Schwab Intermediate-Term Bond Fund (a) Schwab Total Bond Market Fund (a) 2,503,887 25,289,254 4,042,047 37,954,823 63,244,077 Money Market Fund 1.9% State Street Institutional U.S.
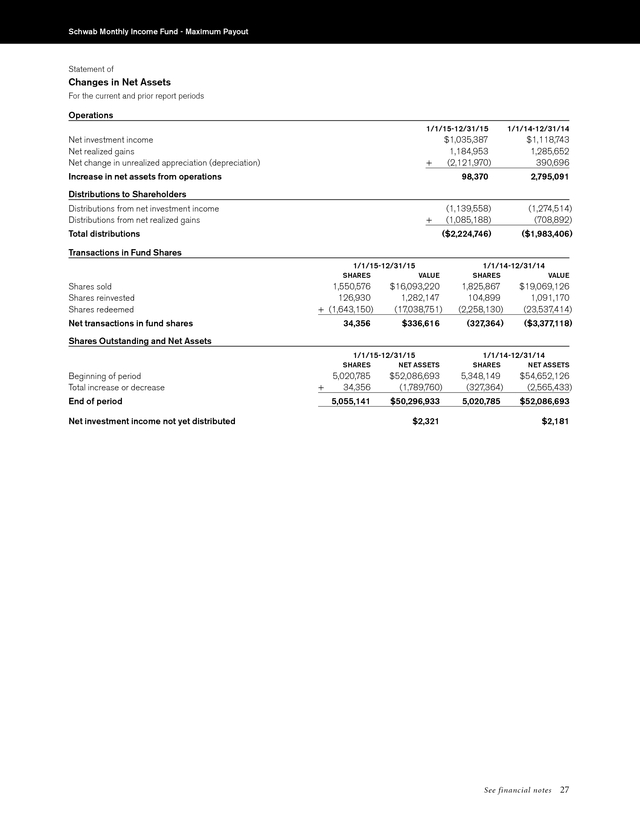
Government Money Market Fund, Premier Class 0.02% (b) 1,889,702 1,889,702 Total Other Investment Companies (Cost $94,673,098) 96,752,379 97,078,139 Number of Shares Security Value ($) Other Investment Companies 99.7% of net assets Equity Funds 32.6% Global Real Estate 5.2% Schwab Global Real Estate Fund (a) International 8.1% Laudus International MarketMasters Fund, Select Shares (a) 717,615 5,073,540 375,388 End of Investments. At 12/31/15, the tax basis cost of the fund’s investments was $95,052,679 and the unrealized appreciation and depreciation were $2,129,538 and ($429,838), respectively, with a net unrealized appreciation of $1,699,700. (a) Issuer is affiliated with the fund’s investment adviser. (b) The rate shown is the 7-day yield. 7,875,644 The following is a summary of the inputs used to value the fund’s investments as of December 31, 2015 (see financial note 2(a) for additional information): Quoted Prices in Active Markets for Identical Assets (Level 1) Description Other Investment Companies 1 Total 1 Other Significant Observable Inputs (Level 2) Significant Unobservable Inputs (Level 3) Total $96,752,379 $— $— $96,752,379 $96,752,379 $— $— $96,752,379 As categorized in Portfolio Holdings. The fund’s policy is to recognize transfers between Level 1, Level 2 and Level 3 as of the beginning of the fiscal year. There were no transfers between Level 1, Level 2 and Level 3 for the period ended December 31, 2015. See financial notes 19 . Schwab Monthly Income Fund - Enhanced Payout Statement of Assets and Liabilities As of December 31, 2015 Assets Investments in affiliated underlying funds, at value (cost $92,783,396) Investments in unaffiliated issuers, at value (cost $1,889,702) Total investments, at value (cost $94,673,098) Receivables: Fund shares sold Dividends Due from investment adviser Interest Prepaid expenses + $94,862,677 1,889,702 96,752,379 + Total assets 437,274 109,871 2,143 94 3,216 97,304,977 Liabilities Payables: Investments bought Fund shares redeemed Accrued expenses + Total liabilities 120,349 68,115 38,374 226,838 Net Assets Total assets Total liabilities – Net assets $97,078,139 Net Assets by Source Capital received from investors Net investment income not yet distributed Net realized capital gains Net unrealized capital appreciation 93,352,825 2,156 1,643,877 2,079,281 Net Asset Value (NAV) Net Assets $97,078,139 20 97,304,977 226,838 ÷ See financial notes Shares Outstanding 8,893,818 = NAV $10.92 . Schwab Monthly Income Fund - Enhanced Payout Statement of Operations For the period January 1, 2015 through December 31, 2015 Investment Income Dividends received from affiliated underlying funds Interest + Total investment income $1,979,320 94 1,979,414 Expenses Professional fees Shareholder reports Transfer agent fees Registration fees Portfolio accounting fees Independent trustees’ fees Proxy fees Custodian fees Other expenses + 35,536 25,525 23,193 16,024 13,692 7,303 2,689 1,281 2,383 Total expenses Expense reduction by CSIM – 127,626 124,937 Net expenses – Net investment income 2,689 1,976,725 Realized and Unrealized Gains (Losses) Realized capital gain distributions received from affiliated underlying funds Net realized gains on sales of affiliated underlying funds Net realized gains on unaffiliated issuers + Net realized gains Net change in unrealized appreciation (depreciation) on affiliated underlying funds 3,360,525 + (5,376,084) Net realized and unrealized losses Decrease in net assets resulting from operations 2,515,924 844,412 189 (2,015,559) ($38,834) See financial notes 21 . Schwab Monthly Income Fund - Enhanced Payout Statement of Changes in Net Assets For the current and prior report periods Operations 1/1/15-12/31/15 Net investment income Net realized gains Net change in unrealized appreciation (depreciation) 1/1/14-12/31/14 $1,976,725 3,360,525 (5,376,084) (38,834) + Increase (decrease) in net assets from operations $1,952,225 3,249,283 104,844 5,306,352 Distributions to Shareholders Distributions from net investment income ($2,335,165) ($2,425,908) Transactions in Fund Shares 1/1/15-12/31/15 SHARES Shares sold Shares reinvested Shares redeemed Net transactions in fund shares 1,768,913 131,261 + (1,736,547) 163,627 1/1/14-12/31/14 VALUE $19,823,256 1,457,760 (19,400,268) $1,880,748 SHARES 2,138,964 135,844 (2,189,460) 85,348 VALUE $23,718,230 1,508,717 (24,260,384) $966,563 Shares Outstanding and Net Assets 1/1/15-12/31/15 SHARES Beginning of period Total increase or decrease End of period Net investment income not yet distributed 22 See financial notes 8,730,191 + 163,627 8,893,818 NET ASSETS 1/1/14-12/31/14 SHARES NET ASSETS $97,571,390 (493,251) 8,644,843 85,348 $93,724,383 3,847,007 $97,078,139 8,730,191 $97,571,390 $2,156 $3,463 . Schwab Monthly Income Fund - Maximum Payout Financial Statements Financial Highlights 1/1/15– 12/31/15 1/1/14– 12/31/14 1/1/13– 12/31/13 1/1/12– 12/31/12 1/1/11– 12/31/11 $10.37 $10.22 $10.29 $10.09 $9.90 Per-Share Data Net asset value at beginning of period Income (loss) from investment operations: Net investment income (loss) Net realized and unrealized gains (losses) Total from investment operations Less distributions: Distributions from net investment income Distributions from net realized gains Total distributions Net asset value at end of period Total return 0.211 (0.18) 0.21 0.33 0.20 (0.03) 0.20 0.24 0.25 0.21 0.03 0.54 0.17 0.44 0.46 (0.23) (0.22) (0.25) (0.14) (0.20) (0.04) (0.24) — (0.27) — (0.45) $9.95 (0.39) $10.37 (0.24) $10.22 (0.24) $10.29 (0.27) $10.09 0.22% 5.29% 1.66% 4.43% 4.70% 0.00%3,4 0.23% 2.01% 14% $50 — 0.22% 2.05% 16% $52 — 0.21% 1.96% 46% $55 0.00%4 0.19% 1.99% 19% $73 0.00%4 0.17% 2.53% 10% $78 Ratios/Supplemental Data Ratios to average net assets: Net operating expenses2 Gross operating expenses2 Net investment income (loss) Portfolio turnover rate Net assets, end of period (x 1,000,000) 1 2 3 4 Calculated based on the average shares outstanding during the period. The expenses incurred by underlying funds in which the fund invests are not included in this ratio. The ratio of net operating expenses would have been 0.00%, if certain non-routine expenses had not been incurred. Less than 0.005%. See financial notes 23 . Schwab Monthly Income Fund - Maximum Payout Portfolio Holdings as of December 31, 2015 This section shows all the securities in the fund’s portfolio and their values as of the report date. The fund files its complete schedule of portfolio holdings with the SEC for the first and third quarters of each fiscal year on Form N-Q. The fund’s Form N-Q is available on the SEC’s website at www.sec.gov and may be viewed and copied at the SEC’s Public Reference Room in Washington, D.C. Call 1-800-SEC-0330 for information on the operation of the Public Reference Room. The fund also makes available its complete schedule of portfolio holdings 15 to 20 days after calendar quarters on the fund’s website at www.csimfunds.com/schwabfunds_prospectus. Cost ($) Holdings by Category 99.9% Other Investment Companies Value ($) 49,307,339 50,239,088 99.9% Total Investments 0.1% Other Assets and Liabilities, Net 49,307,339 50,239,088 57,845 100.0% Net Assets Number of Shares Large-Cap 10.4% Schwab Dividend Equity Fund (a) Value ($) 365,623 Security 5,246,685 9,002,031 Fixed-Income Funds 80.2% Intermediate-Term Bond 80.2% Schwab Intermediate-Term Bond Fund (a) Schwab Total Bond Market Fund (a) 1,595,729 16,116,866 2,578,670 24,213,707 40,330,573 Money Market Fund 1.8% State Street Institutional U.S.
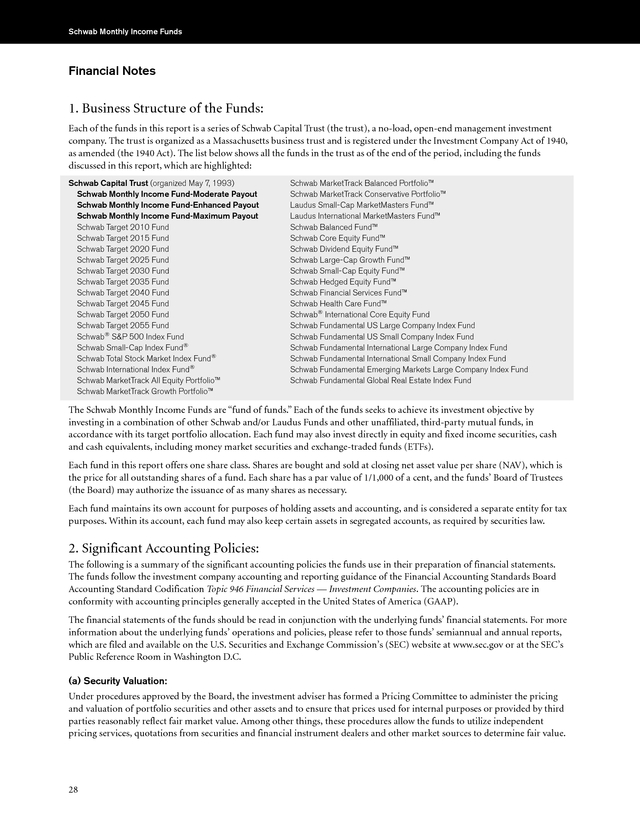
Government Money Market Fund, Premier Class 0.02% (b) 906,484 Total Other Investment Companies (Cost $49,307,339) 906,484 50,239,088 50,296,933 Number of Shares Security Value ($) Other Investment Companies 99.9% of net assets Equity Funds 17.9% Global Real Estate 3.0% Schwab Global Real Estate Fund (a) International 4.5% Laudus International MarketMasters Fund, Select Shares (a) 214,934 1,519,583 106,566 End of Investments. At 12/31/15, the tax basis cost of the fund’s investments was $49,549,096 and the unrealized appreciation and depreciation were $779,090 and ($89,098), respectively, with a net unrealized appreciation of $689,992. (a) Issuer is affiliated with the fund’s adviser. (b) The rate shown is the 7-day yield. 2,235,763 The following is a summary of the inputs used to value the fund’s investments as of December 31, 2015 (see financial note 2(a) for additional information): Quoted Prices in Active Markets for Identical Assets (Level 1) Description Other Investment Companies 1 Total 1 Other Significant Observable Inputs (Level 2) Significant Unobservable Inputs (Level 3) Total $50,239,088 $— $— $50,239,088 $50,239,088 $— $— $50,239,088 As categorized in Portfolio Holdings. The fund’s policy is to recognize transfers between Level 1, Level 2 and Level 3 as of the beginning of the fiscal year. There were no transfers between Level 1, Level 2 and Level 3 for the period ended December 31, 2015. 24 See financial notes . Schwab Monthly Income Fund - Maximum Payout Statement of Assets and Liabilities As of December 31, 2015 Assets Investments in affiliated underlying funds, at value (cost $48,400,855) Investments in unaffiliated issuers, at value (cost $906,484) Total investments, at value (cost $49,307,339) Receivables: Investments sold Fund shares sold Dividends Due from investment adviser Interest Prepaid expenses + $49,332,604 906,484 50,239,088 + Total assets 300,000 123,299 71,678 2,037 45 2,426 50,738,573 Liabilities Payables: Investments bought Fund shares redeemed Accrued expenses + Total liabilities 78,403 329,166 34,071 441,640 Net Assets Total assets Total liabilities – Net assets 50,738,573 441,640 $50,296,933 Net Assets by Source Capital received from investors Net investment income not yet distributed Net realized capital gains Net unrealized capital appreciation 48,902,156 2,321 460,707 931,749 Net Asset Value (NAV) Net Assets $50,296,933 ÷ Shares Outstanding 5,055,141 = NAV $9.95 See financial notes 25 . Schwab Monthly Income Fund - Maximum Payout Statement of Operations For the period January 1, 2015 through December 31, 2015 Investment Income Dividends received from affiliated underlying funds Interest + Total investment income $1,037,241 45 1,037,286 Expenses Professional fees Transfer agent fees Shareholder reports Registration fees Portfolio accounting fees Independent trustees’ fees Proxy fees Custodian fees Other expenses + 32,207 22,680 19,687 16,861 12,858 7,079 1,899 1,330 1,649 Total expenses Expense reduction by CSIM – 116,250 114,351 Net expenses – Net investment income 1,899 1,035,387 Realized and Unrealized Gains (Losses) Realized capital gain distributions received from affiliated underlying funds Net realized gains on sales of affiliated underlying funds + 749,643 435,310 Net realized gains Net change in unrealized appreciation (depreciation) on affiliated underlying funds 1,184,953 + (2,121,970) Net realized and unrealized losses (937,017) Increase in net assets resulting from operations $98,370 26 See financial notes . Schwab Monthly Income Fund - Maximum Payout Statement of Changes in Net Assets For the current and prior report periods Operations 1/1/15-12/31/15 Net investment income Net realized gains Net change in unrealized appreciation (depreciation) $1,035,387 1,184,953 (2,121,970) + Increase in net assets from operations 98,370 1/1/14-12/31/14 $1,118,743 1,285,652 390,696 2,795,091 Distributions to Shareholders Distributions from net investment income Distributions from net realized gains (1,139,558) (1,085,188) (1,274,514) (708,892) ($2,224,746) ($1,983,406) + Total distributions Transactions in Fund Shares 1/1/15-12/31/15 SHARES Shares sold Shares reinvested Shares redeemed Net transactions in fund shares 1,550,576 126,930 + (1,643,150) 34,356 1/1/14-12/31/14 VALUE $16,093,220 1,282,147 (17,038,751) $336,616 SHARES VALUE 1,825,867 104,899 (2,258,130) $19,069,126 1,091,170 (23,537,414) (327,364) ($3,377,118) Shares Outstanding and Net Assets 1/1/15-12/31/15 SHARES Beginning of period Total increase or decrease End of period Net investment income not yet distributed 5,020,785 + 34,356 5,055,141 NET ASSETS 1/1/14-12/31/14 SHARES NET ASSETS $52,086,693 (1,789,760) 5,348,149 (327,364) $54,652,126 (2,565,433) $50,296,933 5,020,785 $52,086,693 $2,321 $2,181 See financial notes 27 . Schwab Monthly Income Funds Financial Notes 1. Business Structure of the Funds: Each of the funds in this report is a series of Schwab Capital Trust (the trust), a no-load, open-end management investment company. The trust is organized as a Massachusetts business trust and is registered under the Investment Company Act of 1940, as amended (the 1940 Act). The list below shows all the funds in the trust as of the end of the period, including the funds discussed in this report, which are highlighted: Schwab Capital Trust (organized May 7, 1993) Schwab Monthly Income Fund-Moderate Payout Schwab Monthly Income Fund-Enhanced Payout Schwab Monthly Income Fund-Maximum Payout Schwab Target 2010 Fund Schwab Target 2015 Fund Schwab Target 2020 Fund Schwab Target 2025 Fund Schwab Target 2030 Fund Schwab Target 2035 Fund Schwab Target 2040 Fund Schwab Target 2045 Fund Schwab Target 2050 Fund Schwab Target 2055 Fund Schwab® S&P 500 Index Fund Schwab Small-Cap Index Fund® Schwab Total Stock Market Index Fund® Schwab International Index Fund® Schwab MarketTrack All Equity Portfolio™ Schwab MarketTrack Growth Portfolio™ Schwab MarketTrack Balanced Portfolio™ Schwab MarketTrack Conservative Portfolio™ Laudus Small-Cap MarketMasters Fund™ Laudus International MarketMasters Fund™ Schwab Balanced Fund™ Schwab Core Equity Fund™ Schwab Dividend Equity Fund™ Schwab Large-Cap Growth Fund™ Schwab Small-Cap Equity Fund™ Schwab Hedged Equity Fund™ Schwab Financial Services Fund™ Schwab Health Care Fund™ Schwab® International Core Equity Fund Schwab Fundamental US Large Company Index Fund Schwab Fundamental US Small Company Index Fund Schwab Fundamental International Large Company Index Fund Schwab Fundamental International Small Company Index Fund Schwab Fundamental Emerging Markets Large Company Index Fund Schwab Fundamental Global Real Estate Index Fund The Schwab Monthly Income Funds are “fund of funds.” Each of the funds seeks to achieve its investment objective by investing in a combination of other Schwab and/or Laudus Funds and other unaffiliated, third-party mutual funds, in accordance with its target portfolio allocation.
Each fund may also invest directly in equity and fixed income securities, cash and cash equivalents, including money market securities and exchange-traded funds (ETFs). Each fund in this report offers one share class. Shares are bought and sold at closing net asset value per share (NAV), which is the price for all outstanding shares of a fund. Each share has a par value of 1/1,000 of a cent, and the funds’ Board of Trustees (the Board) may authorize the issuance of as many shares as necessary. Each fund maintains its own account for purposes of holding assets and accounting, and is considered a separate entity for tax purposes.
Within its account, each fund may also keep certain assets in segregated accounts, as required by securities law. 2. Significant Accounting Policies: The following is a summary of the significant accounting policies the funds use in their preparation of financial statements. The funds follow the investment company accounting and reporting guidance of the Financial Accounting Standards Board Accounting Standard Codification Topic 946 Financial Services — Investment Companies. The accounting policies are in conformity with accounting principles generally accepted in the United States of America (GAAP). The financial statements of the funds should be read in conjunction with the underlying funds’ financial statements.
For more information about the underlying funds’ operations and policies, please refer to those funds’ semiannual and annual reports, which are filed and available on the U.S. Securities and Exchange Commission’s (SEC) website at www.sec.gov or at the SEC’s Public Reference Room in Washington D.C. (a) Security Valuation: Under procedures approved by the Board, the investment adviser has formed a Pricing Committee to administer the pricing and valuation of portfolio securities and other assets and to ensure that prices used for internal purposes or provided by third parties reasonably reflect fair market value. Among other things, these procedures allow the funds to utilize independent pricing services, quotations from securities and financial instrument dealers and other market sources to determine fair value. 28 .
Schwab Monthly Income Funds Financial Notes (continued) 2. Significant Accounting Policies (continued): The funds value the securities in their portfolios every business day. The funds use the following policies to value various types of securities: • Underlying funds: Mutual funds are valued at their respective NAVs. • Securities for which no quoted value is available: The Board has adopted procedures to fair value each fund’s securities when market prices are not “readily available” or are unreliable. For example, a fund may fair value a security when it is de-listed or its trading is halted or suspended; when a security’s primary pricing source is unable or unwilling to provide a price; or when a security’s primary trading market is closed during regular market hours.
Each fund makes fair value determinations in good faith in accordance with the fund’s valuation procedures. The Pricing Committee considers a number of factors, including unobservable market inputs when arriving at fair value. The Pricing Committee may employ techniques such as the review of related or comparable assets or liabilities, related market activities, recent transactions, market multiples, book values, transactional back-testing, disposition analysis and other relevant information.
The Pricing Committee regularly reviews these inputs and assumptions to calibrate the valuations. Due to the subjective and variable nature of fair value pricing, there can be no assurance that a fund could obtain the fair value assigned to the security upon the sale of such security. The Board convenes on a regular basis to review fair value determinations made by the funds pursuant to the valuation procedures. • Short-term securities (60 days or less to maturity): A short-term security may be valued at its amortized cost when it approximates the security’s market value. In accordance with the authoritative guidance on fair value measurements and disclosures under GAAP, the funds disclose the fair value of their investments in a hierarchy that prioritizes the significant inputs to valuation techniques used to measure the fair value.
The hierarchy gives the highest priority to valuations based upon unadjusted quoted prices in active markets for identical assets or liabilities (Level 1 measurements) and the lowest priority to valuations based upon unobservable inputs that are significant to the valuation (Level 3 measurements). If inputs used to measure the financial instruments fall within different levels of the hierarchy, the categorization is based on the lowest level input that is significant to the valuation. If the funds determine that either the volume and/or level of activity for an asset or liability has significantly decreased (from normal conditions for that asset or liability) or price quotations or observable inputs are not associated with orderly transactions, increased analysis and management judgment will be required to estimate fair value. The three levels of the fair value hierarchy are as follows: • Level 1 — quoted prices in active markets for identical securities — Investments whose values are based on quoted market prices in active markets, and whose values are therefore classified as Level 1 prices, include active listed equities. Investments in mutual funds are valued daily at their NAVs, which are classified as Level 1 prices, without consideration to the classification level of the specific investments held by an underlying fund. • Level 2 — other significant observable inputs (including quoted prices for similar securities, interest rates, prepayment speeds, credit risk, etc.) — Investments that trade in markets that are not considered to be active, but whose values are based on quoted market prices, dealer quotations or valuations provided by alternative pricing sources supported by observable inputs are classified as Level 2 prices.
These generally include U.S. government and sovereign obligations, most government agency securities, investment-grade corporate bonds, certain mortgage products, less liquid listed equities, and state, municipal and provincial obligations. • Level 3 — significant unobservable inputs (including the funds’ own assumptions in determining the fair value of investments) — Investments whose values are classified as Level 3 prices have significant unobservable inputs, as they may trade infrequently or not at all. When observable prices are not available for these securities, the funds use one or more valuation techniques for which sufficient and reliable data is available.
The inputs used by the funds in estimating the value of Level 3 prices may include the original transaction price, quoted prices for similar securities or assets in active markets, completed or pending third-party transactions in the underlying investment or comparable issuers, and changes in financial ratios or cash flows. Level 3 prices may also be adjusted to reflect illiquidity and/or non-transferability, with the amount of such discount estimated by the funds in the absence of market information. Assumptions used by the funds due to the lack of observable inputs may significantly impact the resulting fair value and therefore the funds’ results of operations. 29 . Schwab Monthly Income Funds Financial Notes (continued) 2. Significant Accounting Policies (continued): The inputs or methodology used for valuing securities are not necessarily an indication of the risk associated with investing in those securities. The levels associated with valuing the funds’ investments as of December 31, 2015 are disclosed in the Portfolio Holdings. (b) Security Transactions: Security transactions are recorded as of the date the order to buy or sell the security is executed. Realized gains and losses from security transactions are based on the identified costs of the securities involved. (c) Investment Income: Interest income is recorded as it accrues. Dividends and distributions from portfolio securities and underlying funds are recorded on the date they are effective (the ex-dividend date), although the funds record certain foreign security dividends on the day they learn of the ex-dividend date.
Any distributions from underlying funds are recorded in accordance with the character of the distributions as designated by the underlying funds. (d) Expenses: Expenses that are specific to a fund are charged directly to the fund. Expenses that are common to all funds within the trust generally are allocated among the funds in proportion to their average daily net assets. Each fund bears its share of the allocable expenses of the underlying funds in which it invests.
Such expenses are reflected in the net asset values of the underlying funds. (e) Distributions to Shareholders: The funds make distributions from net investment income monthly and from net realized capital gains, if any, once a year. (f) Accounting Estimates: The accounting policies described in this report conform to GAAP. Notwithstanding this, shareholders should understand that in order to follow these principles, fund management has to make estimates and assumptions that affect the information reported in the financial statements. It’s possible that once the results are known, they may turn out to be different from these estimates and these differences may be material. (g) Federal Income Taxes: The funds intend to meet federal income and excise tax requirements for regulated investment companies.
Accordingly, the funds distribute substantially all of their net investment income and net realized capital gains, if any, to their respective shareholders each year. As long as a fund meets the tax requirements, it is not required to pay federal income tax. (h) Indemnification: Under the funds’ organizational documents, the officers and trustees are indemnified against certain liabilities arising out of the performance of their duties to the funds. In addition, in the normal course of business the funds enter into contracts with their vendors and others that provide general indemnifications.
The funds’ maximum exposure under these arrangements is unknown as this would involve future claims that may be made against the funds. However, based on experience, the funds expect the risk of loss attributable to these arrangements to be remote. 3. Risk Factors: Investing in the funds may involve certain risks, as discussed in the funds’ prospectus, including, but not limited to, those described below.
Any of these risks could cause an investor to lose money. Asset Allocation Risk. The funds are subject to asset allocation risk, which is the risk that the selection of the underlying funds and the allocation of a fund’s assets among the various asset classes and market segments will cause the fund to underperform other funds with a similar investment objective. 30 . Schwab Monthly Income Funds Financial Notes (continued) 3. Risk Factors (continued): Affiliated Fund Risk. The investment adviser’s authority to select and substitute underlying funds from a variety of affiliated and unaffiliated mutual funds may create a conflict of interest because the fees paid to it by some underlying funds are higher than the fees paid by other underlying funds. However, the portfolio manager is a fiduciary to the fund and is legally obligated to act in the fund’s best interests when selecting underlying funds, without taking fees into consideration. Market Risk.
Equity and fixed income markets rise and fall daily. As with any investment whose performance is tied to these markets, the value of an investment in the fund will fluctuate, which means that an investor could lose money. Structural Risk. The funds’ monthly income payments will be made from fund assets and will reduce the amount of assets available for investment by the fund.
Even if a fund’s capital grows over time, such growth may be insufficient to enable the fund to maintain the amount of its targeted annual payout and targeted monthly income payments. A fund’s investment losses may reduce the amount of future cash income payments an investor will receive from the fund. The dollar amount of a fund’s monthly income payments could vary substantially from one year to the next and over time depending on several factors, including the performance of the financial markets in which the fund invests, the allocation of fund assets across different asset classes and investments, the performance of the fund’s investment strategies, and the amount and timing of prior distributions by the fund.
It is also possible for payments to go down substantially from one year to the next and over time depending on the timing of an investor’s investments in the fund. Any redemptions will proportionately reduce the amount of future cash income payments to be received from the fund. There is no guarantee that the fund will make monthly income payments to its shareholders or, if made, that the fund’s monthly income payments to shareholders will remain at a fixed amount. Underlying Fund Investment Risk.
The value of an investment in the funds is based primarily on the prices of the underlying funds that the funds purchase. In turn, the price of each underlying fund is based on the value of its securities. The funds are subject to the performance and expenses of the underlying funds in which they invest.
Before investing in the funds, investors should assess the risks associated with the underlying funds in which the fund may invest and the types of investments made by those underlying funds. These risks include any combination of the risks described below, although the fund’s exposure to a particular risk will be proportionate to the fund’s overall asset allocation and underlying fund allocation. • Investment Risk. The funds may experience losses with respect to their investment in an underlying fund.
Further, there is no guarantee that an underlying fund will be able to achieve its objective. • Management Risk. Generally, the underlying funds are actively managed mutual funds. An underlying fund’s adviser applies its own investment techniques and risk analyses in making investment decisions for the fund, but there can be no guarantee that they will produce the desired results or cause the underlying fund to meet its objectives. • Equity Risk.
The prices of equity securities rise and fall daily. These price movements may result from factors affecting individual companies, industries or the securities market as a whole. In addition, equity markets tend to move in cycles, which may cause stock prices to fall over short or extended periods of time. • Large-, Mid- and Small-Cap Risk.
Stocks of different market capitalizations tend to go in and out of favor based on market and economic conditions. Historically, small- and mid-cap stocks tend to be more volatile than large-cap stocks. • Fixed Income Risk. Interest rates rise and fall over time, which will affect an underlying fund’s yield and share price. Because interest rates in the United States and other countries are at, or near, historically low levels, a change in a central bank’s monetary policy or improving economic conditions may result in an increase in interest rates.
A sharp rise in interest rates could cause an underlying fund to lose value. The credit quality of a portfolio investment could also cause an underlying fund’s share price to fall. An underlying fund could lose money if the issuer or guarantor of a portfolio investment or the counterparty to a derivatives contract fails to make timely principal or interest payments or otherwise honor its obligations.
Fixed income securities may be paid off earlier or later than expected. Either situation could cause an underlying fund to hold securities paying lower-than-market rates of interest, which could hurt the fund’s yield or share price. Below investment-grade bonds (junk bonds) involve greater credit risk than investment-grade securities. • Foreign Investment Risk.
An underlying fund’s investments in securities of foreign issuers may involve certain risks that are greater than those associated with investments in securities of U.S. issuers. These include risks of adverse changes in foreign economic, political, regulatory and other conditions; changes in currency exchange rates or exchange control 31 .
Schwab Monthly Income Funds Financial Notes (continued) 3. Risk Factors (continued): regulations (including limitations on currency movements and exchanges); the imposition of economic sanctions or other government restrictions; differing accounting, auditing, financial reporting and legal standards and practices; differing securities market structures; and higher transaction costs. These risks may be heightened in connection with investments in emerging markets. • Derivatives Risk. An underlying fund’s use of derivative instruments involves risks different from, or possibly greater than, the risks associated with investing directly in securities and other traditional investments.
An underlying fund’s use of derivatives could reduce the underlying fund’s performance, increase volatility, and could cause the underlying fund to lose more than the initial amount invested. In addition, investments in derivatives may involve leverage, which means a small percentage of assets invested in derivatives can have a disproportionately large impact on an underlying fund. • Leverage Risk. Certain underlying fund transactions, such as derivatives, short sales, reverse repurchase agreements, and mortgage dollar rolls, may give rise to a form of leverage and may expose an underlying fund to greater risk.
Leverage tends to magnify the effect of any decrease or increase in the value of an underlying fund’s portfolio securities, which means even a small amount of leverage can have a disproportionately large impact on the fund. • Money Market Risk. Although an underlying money market fund seeks to maintain a stable $1 net asset value, it is possible to lose money by investing in a money market fund. • Liquidity Risk. An underlying fund may be unable to sell illiquid securities at an advantageous time or price. • ETF Risk.
When an underlying fund invests in an ETF, it will bear a proportionate share of the ETF’s expenses. In addition, lack of liquidity in the market for an ETF’s shares can result in its value being more volatile than the underlying portfolio of securities. • Securities Lending Risk. Certain underlying funds engage in securities lending, which involves the risk of loss of rights in the collateral or delay in recovery of the collateral if the borrower fails to return the security loaned or becomes insolvent. • Real Estate Investment Trust (REITs) Risk.
An underlying fund’s investments in REITs will be subject to the risks associated with the direct ownership of real estate, including fluctuations in the value of underlying properties, defaults by borrowers or tenants, access to capital, changes in interest rates and risks related to general or local economic conditions. REITs are also subject to certain additional risks, for example, REITs may have their investments in relatively few properties, a small geographic area or a single property type. In addition, REITs have their own expenses, and an underlying fund will bear a proportionate share of those expenses. • Mortgage-Backed and Mortgage Pass-Through Securities Risk.
Certain of the mortgage-backed securities in which an underlying fund may invest are not backed by the full faith and credit of the U.S. government and there can be no assurance that the U.S. government would provide financial support where it was not obligated to do so. Mortgage-backed securities tend to increase in value less than other debt securities when interest rates decline, but are subject to similar risk of decline in market value during periods of rising interest rates.
Transactions in mortgage pass-through securities primarily occur through to be announced (TBA) transactions. Default by or bankruptcy of a counterparty to a TBA transaction would expose an underlying fund to possible losses. • Portfolio Turnover Risk. Certain of the underlying funds may buy and sell portfolio securities actively.
If they do, their portfolio turnover rate and transaction costs will rise, which may lower the underlying fund’s performance and may increase the likelihood of capital gain distributions. Direct Investment Risk. The funds may invest a portion of their assets directly in equity and fixed income securities, ETFs, cash and cash equivalents, including money market securities. A fund’s direct investment in these securities is subject to the same or similar risks as an underlying fund’s investment in the same security. Please refer to the funds’ prospectus for a more complete description of the principal risks of investing in the funds. 32 .
Schwab Monthly Income Funds Financial Notes (continued) 4. Affiliates and Affiliated Transactions: Charles Schwab Investment Management, Inc. (CSIM or the investment adviser), a wholly owned subsidiary of The Charles Schwab Corporation, serves as each fund’s investment adviser and administrator pursuant to an Investment Advisory and Administration Agreement between CSIM and the trust. The Board has adopted a Shareholder Servicing Plan (the Plan) on behalf of the funds. The plan enables each fund to bear expenses relating to the provision by services providers, including Charles Schwab & Co., Inc.
(a broker-dealer affiliate of CSIM, Schwab), of certain account maintenance, customer liaison and shareholder services to the current shareholders of the funds. The funds are not subject to any fees under the Plan. CSIM and its affiliates have agreed with the funds, for so long as CSIM serves as the investment adviser to the funds, which may only be amended or terminated with approval of the Board, to limit the total annual fund operating expenses charged, excluding interest, taxes and certain non-routine expenses to 0.00%. The agreement to limit the funds’ total expenses charged is limited to each fund’s direct operating expenses and, therefore, does not apply to acquired fund fees and expenses, which are indirect expenses incurred by a fund through its investments in the underlying funds. The funds may engage in certain transactions involving related parties. Pursuant to an exemptive order issued by the SEC, the funds may invest in other related funds.
As of December 31, 2015, each Schwab Monthly Income Fund’s ownership percentages of other related funds’ shares are: Underlying Funds Schwab Monthly Income Fund Moderate Payout Schwab Global Real Estate Fund Laudus International MarketMasters Fund, Select Shares Schwab Dividend Equity Fund Schwab Intermediate-Term Bond Fund Schwab Total Bond Market Fund Schwab Monthly Income Fund Enhanced Payout Schwab Monthly Income Fund Maximum Payout 1.4% 1.9% 0.6% 0.3% 0.8% 2.8% 1.1% 0.4% 1.0% 7.4% 2.8% 0.1% 0.3% 4.7% 1.8% Below is a summary of the funds’ transactions with their affiliated underlying funds during the period ended December 31, 2015: Schwab Monthly Income Fund - Moderate Payout: Underlying Funds Schwab Global Real Estate Fund Laudus International MarketMasters Fund, Select Shares Schwab Dividend Equity Fund Schwab Intermediate-Term Bond Fund Schwab Total Bond Market Fund Total Balance of Shares Held at Gross 12/31/14 Purchases Gross Sales Balance of Shares Held at 12/31/15 Market Value at 12/31/15 Realized Distributions Gains (Losses) Received* 01/01/15 01/01/15 to 12/31/15 to 12/31/15 486,429 91,869 (69,224) 509,074 $3,599,152 $64,073 $110,013 260,785 838,758 55,708 226,719 (44,526) 271,967 (119,538) 945,939 5,705,873 13,574,225 102,674 125,851 404,098 1,744,405 967,225 1,500,179 138,701 264,149 (147,662) 958,264 (217,435) 1,546,893 9,678,465 14,525,325 63,140 89,745 209,848 326,493 $47,083,040 $445,483 $2,794,857 33 . Schwab Monthly Income Funds Financial Notes (continued) 4. Affiliates and Affiliated Transactions (continued): Schwab Monthly Income Fund - Enhanced Payout: Underlying Funds Schwab Global Real Estate Fund Laudus International MarketMasters Fund, Select Shares Schwab Dividend Equity Fund Schwab Intermediate-Term Bond Fund Schwab Total Bond Market Fund Balance of Shares Held at Gross 12/31/14 Purchases Gross Sales Balance of Shares Held at 12/31/15 Market Value at 12/31/15 Realized Distributions Gains (Losses) Received* 01/01/15 01/01/15 to 12/31/15 to 12/31/15 665,588 140,001 (87,974) 717,615 $5,073,540 $93,468 $150,353 356,639 1,165,335 84,749 325,271 (66,000) 375,388 (189,601) 1,301,005 7,875,644 18,669,416 126,420 312,956 560,006 2,404,145 2,505,461 3,920,352 249,852 463,789 (251,426) 2,503,887 (342,094) 4,042,047 25,289,254 37,954,823 124,593 186,975 540,190 840,550 $94,862,677 $844,412 $4,495,244 Total Schwab Monthly Income Fund - Maximum Payout: Underlying Funds Schwab Global Real Estate Fund Laudus International MarketMasters Fund, Select Shares Schwab Dividend Equity Fund Schwab Intermediate-Term Bond Fund Schwab Total Bond Market Fund Total Balance of Shares Held at Gross 12/31/14 Purchases Gross Sales Balance of Shares Held at 12/31/15 Market Value at 12/31/15 Realized Distributions Gains (Losses) Received* 01/01/15 01/01/15 to 12/31/15 to 12/31/15 191,157 68,103 (44,326) 214,934 $1,519,583 $66,354 $43,777 101,732 348,334 36,874 105,590 (32,040) 106,566 (88,301) 365,623 2,235,763 5,246,685 28,906 141,055 167,787 689,005 1,642,903 2,580,539 149,109 267,641 (196,283) 1,595,729 (269,510) 2,578,670 16,116,866 24,213,707 90,733 108,262 346,792 539,523 $49,332,604 $435,310 $1,786,884 * Distributions received include distributions from net investment income and capital gains, if any, from the underlying funds. Pursuant to an exemptive order issued by the SEC, the funds may enter into interfund borrowing and lending transactions with other funds in the Fund Complex (for definition refer to Trustees and Officers section). All loans are for temporary or emergency purposes and the interest rate to be charged will be the average of the overnight repurchase agreement rate and the short-term bank loan rate. All loans are subject to numerous conditions designed to ensure fair and equitable treatment of all participating funds/portfolios.
The interfund lending facility is subject to the oversight and periodic review by the Board. The funds had no interfund borrowing or lending activity during the period. 5. Board of Trustees: At a Special Meeting of Shareholders on December 11, 2015, twelve individuals were elected to serve as trustees of all trusts constituting the Schwab Funds, Laudus Funds and Schwab ETFs effective January 1, 2016.
The twelve individuals elected to the Board of Trustees consist of current Schwab Funds and Laudus Funds trustees, current Schwab ETFs trustees and three new nominees. The trustees believe that combining the composition of the Board of Trustees and adding the new nominees will further align oversight of the Schwab Funds, Laudus Funds and Schwab ETFs, among other benefits. The Board may include people who are officers and/or directors of CSIM or its affiliates. Federal securities law limits the percentage of such “interested persons” who may serve on a trust’s board, and the trust was in compliance with these limitations throughout the report period.
The trust did not pay any of these interested persons for their services as trustees, but it did pay non-interested persons (independent trustees), as noted on each fund’s Statement of Operations. For information regarding the trustees, please refer to the Trustees and Officers table at the end of this report. 34 . Schwab Monthly Income Funds Financial Notes (continued) 6. Borrowing from Banks: Prior to October 8, 2015, the funds had access to a committed line of credit of $150 million with State Street Bank and Trust Company (State Street), an uncommitted line of credit of $100 million with Bank of America, N.A., and an uncommitted line of credit of $50 million with Brown Brothers Harriman & Co. The funds paid an annual fee to State Street for the committed line of credit. Effective October 8, 2015, the previous lines of credit were terminated and the funds became participants with other U.S.
registered investment companies managed by CSIM in a joint, syndicated, committed $530 million line of credit (the Credit Facility), with State Street as agent, which matures on October 6, 2016. Under the terms of the Credit Facility, in addition to the interest charged on any borrowings by a fund, each fund pays a commitment fee of 0.125% per annum on its proportionate share of the unused portion of the Credit Facility. There were no borrowings from any of the lines of credit during the period. The funds also have access to custodian overdraft facilities.
A fund may have utilized the overdraft facility and incurred an interest expense, which is disclosed on the fund’s Statement of Operations, if any. The interest expense is determined based on a negotiated rate above the current Federal Funds Rate. 7. Purchases and Sales/Maturities of Investment Securities: For the period ended December 31, 2015, purchases and sales/maturities of securities (excluding short-term obligations) were as follows: Purchases of Securities Sales/Maturities of Securities $9,316,907 14,866,824 7,031,678 $7,060,000 11,089,000 7,066,000 Schwab Monthly Income Fund - Moderate Payout Schwab Monthly Income Fund - Enhanced Payout Schwab Monthly Income Fund - Maximum Payout 8.
Federal Income Taxes: As of December 31, 2015, the components of distributable earnings on a tax-basis were as follows: Schwab Monthly Income Fund Moderate Payout Undistributed ordinary income Undistributed long-term capital gains Unrealized appreciation on investments Unrealized depreciation on investments $21,645 1,550,221 706,128 (1,273,341) Net unrealized appreciation (depreciation) ($567,213) Schwab Monthly Income Fund Enhanced Payout $2,156 2,023,458 2,129,538 (429,838) $1,699,700 Schwab Monthly Income Fund Maximum Payout $15,412 689,373 779,090 (89,098) $689,992 The primary difference between book-basis and tax-basis unrealized appreciation or unrealized depreciation of investments is the tax deferral of losses on wash sales. Capital loss carryforwards may be used to offset future realized capital gains for federal income tax purposes. As of December 31, 2015, the funds had no capital loss carryforwards. For tax purposes, net realized capital losses and late-year ordinary losses incurred after October 31 may be deferred and treated as occurring on the first day of the following fiscal year. For the year ended December 31, 2015, the funds had no capital losses deferred and had capital loss carryforwards utilized as follows: Schwab Monthly Income Fund Moderate Payout Capital loss carryforwards utilized Schwab Monthly Income Fund Enhanced Payout Schwab Monthly Income Fund Maximum Payout $— $890,822 $— 35 .
Schwab Monthly Income Funds Financial Notes (continued) 8. Federal Income Taxes (continued): The tax-basis components of distributions paid during the current and prior fiscal years were as follows: Schwab Monthly Income Fund Moderate Payout Schwab Monthly Income Fund Enhanced Payout Schwab Monthly Income Fund Maximum Payout Current period distributions Ordinary income Long-term capital gains Return of capital $1,417,238 1,813,645 — $2,335,165 — — $1,200,377 1,024,369 — Prior period distributions Ordinary income Long-term capital gains Return of capital $1,640,304 916,848 — $2,425,908 — — $1,420,817 562,589 — Distributions paid to shareholders are based on net investment income and net realized gains determined on a tax basis, which may differ from net investment income and net realized gains for financial reporting purposes. These differences reflect the differing character of certain income items and net realized gains and losses for financial statement and tax purposes, and may result in reclassification among certain capital accounts on the financial statements. Permanent book and tax basis differences may result in reclassifications between components of net assets as required. The adjustments will have no impact on net assets or the results of operations.
As of December 31, 2015, the funds made the following reclassifications: Schwab Monthly Income Fund Moderate Payout Capital shares Undistributed net investment income Net realized capital gains (losses) Schwab Monthly Income Fund Enhanced Payout Schwab Monthly Income Fund Maximum Payout $— 256,947 (256,947) $— 357,133 (357,133) $— 104,311 (104,311) As of December 31, 2015, management has reviewed the tax positions for open periods (for federal purposes, three years from the date of filing and for state purposes, four years from the date of filing) as applicable to the funds, and has determined that no provision for income tax is required in the funds’ financial statements. The funds recognize interest and penalties, if any, related to unrecognized tax benefits as income tax expense in the Statement of Operations. During the period ended December 31, 2015, the funds did not incur any interest or penalties. 9.
Subsequent Events: Management has determined there are no subsequent events or transactions through the date the financial statements were issued that would have materially impacted the financial statements as presented. 36 . Report of Independent Registered Public Accounting Firm To the Board of Trustees and Shareholders of: Schwab Monthly Income Fund—Moderate Payout Schwab Monthly Income Fund—Enhanced Payout Schwab Monthly Income Fund—Maximum Payout In our opinion, the accompanying statements of assets and liabilities, including the portfolio holdings, and the related statements of operations and of changes in net assets and the financial highlights present fairly, in all material respects, the financial position of Schwab Monthly Income Fund - Moderate Payout, Schwab Monthly Income Fund Enhanced Payout and Schwab Monthly Income Fund - Maximum Payout (three of the funds constituting Schwab Capital Trust, hereafter referred to as the “Funds”) at December 31, 2015, the results of each of their operations for the year then ended, the changes in each of their net assets for each of the two years in the period then ended and the financial highlights for each of the five years in the period then ended, in conformity with accounting principles generally accepted in the United States of America. These financial statements and financial highlights (hereafter referred to as “financial statements”) are the responsibility of the Funds’ management. Our responsibility is to express an opinion on these financial statements based on our audits. We conducted our audits of these financial statements in accordance with the standards of the Public Company Accounting Oversight Board (United States).
Those standards require that we plan and perform the audit to obtain reasonable assurance about whether the financial statements are free of material misstatement. An audit includes examining, on a test basis, evidence supporting the amounts and disclosures in the financial statements, assessing the accounting principles used and significant estimates made by management, and evaluating the overall financial statement presentation. We believe that our audits, which included confirmation of securities and investments held in the underlying funds at December 31, 2015 by correspondence with the custodian and transfer agent of the underlying funds, respectively, provide a reasonable basis for our opinion. PricewaterhouseCoopers LLP San Francisco, California February 16, 2016 37 .
Other Federal Tax Information (unaudited) For corporate shareholders, the following percentage of the funds’ dividend distributions paid during the fiscal year ended December 31, 2015, qualify for the corporate dividends received deduction: Percentage Schwab Monthly Income Fund - Moderate Payout Schwab Monthly Income Fund - Enhanced Payout Schwab Monthly Income Fund - Maximum Payout 28.07 23.31 12.88 For the fiscal year ended December 31, 2015, the funds designate the following amounts of the dividend distributions as qualified dividends for the purpose of the maximum rate under section 1(h)(11) of the Internal Revenue Code. Shareholders will be notified in January 2016 via IRS form 1099 of the amounts for use in preparing their 2015 income tax return. Schwab Monthly Income Fund - Moderate Payout Schwab Monthly Income Fund - Enhanced Payout Schwab Monthly Income Fund - Maximum Payout $504,407 692,124 198,573 Under Section 852 (b)(3)(C) of the Internal Revenue Code, the funds hereby designate the following amounts as long-term capital gain dividends for the fiscal year ended December 31, 2015: Schwab Monthly Income Fund - Moderate Payout Schwab Monthly Income Fund - Enhanced Payout Schwab Monthly Income Fund - Maximum Payout 38 $1,813,645 — 1,024,369 . Shareholder Vote Results (Unaudited) A Special Meeting of Shareholders of Schwab Capital Trust (the “Trust”) was held on December 11, 2015, for the purpose of seeking shareholder approval to elect the following individuals as trustees of the Trust: Walter W. Bettinger II, Marie A. Chandoha, Joseph R. Martinetto, Robert W. Burns, John F.
Cogan, Stephen T. Kochis, David L. Mahoney, Kiran M.
Patel, Kimberly S. Patmore, Charles A. Ruffel, Gerald B.
Smith, and Joseph H. Wender. The number of votes necessary to conduct the Special Meeting and approve the proposal was obtained.
The results of the shareholder vote are listed below: Proposal – To elect each of the following individuals as trustees of the Trust: For Withheld Walter W. Bettinger II 1,781,628,338.445 341,201,457.803 Marie A. Chandoha 2,069,741,484.184 53,088,312.064 Joseph R.
Martinetto 2,070,394,888.403 52,434,907.845 Robert W. Burns 2,070,083,106.758 52,746,689.490 John F. Cogan 1,909,915,620.213 212,914,176.035 Stephen T.
Kochis 2,067,778,859.342 55,050,936.906 David L. Mahoney 2,068,011,019.030 54,818,777.218 Kiran M. Patel 2,066,263,491.520 56,566,304.728 Kimberly S.
Patmore 2,069,034,220.641 53,795,575.607 Charles A. Ruffel 2,070,448,922.775 52,380,873.473 Gerald B. Smith 2,069,060,923.296 53,768,872.952 Joseph H.
Wender 2,065,502,834.216 57,326,962.032 39 . Trustees and Officers The tables below give information about the trustees and officers of Schwab Capital Trust, which includes the funds covered in this report. The “Fund Complex” includes The Charles Schwab Family of Funds, Schwab Capital Trust, Schwab Investments, Schwab Annuity Portfolios, Schwab Strategic Trust, Laudus Trust and Laudus Institutional Trust. The Fund Complex includes 96 funds. The address for all trustees and officers is 211 Main Street, San Francisco, CA 94105. You can find more information about the trustees and officers in the funds’ Statement of Additional Information, which is available free by calling 1-800-435-4000. Independent Trustees Name, Year of Birth, and Position(s) with the trust (Terms of office, and length of Time Served1) Principal Occupations During the Past Five Years Number of Portfolios in Fund Complex Overseen by the Trustee Other Directorships Robert W.
Burns 1959 Trustee (Trustee of Schwab Strategic Trust since 2009;The Charles Schwab Family of Funds, Schwab Investments, Schwab Capital Trust, Schwab Annuity Portfolios and Laudus Trust since 2016) Retired/Private Investor (Jan. 2009 – present); Formerly, Managing Director, Pacific Investment Management Company, LLC (PIMCO) and President, PIMCO Funds. 96 Director, PS Business Parks, Inc. (2005 – 2012). John F. Cogan 1947 Trustee (Trustee of The Charles Schwab Family of Funds, Schwab Investments, Schwab Capital Trust and Schwab Annuity Portfolios since 2008; Laudus Trust and Laudus Institutional Trust since 2010; Schwab Strategic Trust since 2016) Senior Fellow, The Hoover Institution at Stanford University (Oct.
1979 – present); Senior Fellow Stanford Institute for Economic Policy Research (2000 – present); Professor of Public Policy, Stanford University (1994 – 2015). 96 Director, Gilead Sciences, Inc. (2005 – present) Stephen Timothy Kochis 1946 Trustee (Trustee of Schwab Strategic Trust since 2012; The Charles Schwab Family of Funds, Schwab Investments, Schwab Capital Trust, Schwab Annuity Portfolios and Laudus Trust since 2016) CEO and Owner, Kochis Global (wealth management consulting) (May 2012 – present); Chairman and CEO, Aspiriant, LLC (wealth management) (Jan. 2008 – April 2012). 96 None David L. Mahoney 1954 Trustee (Trustee of The Charles Schwab Family of Funds, Schwab Investments, Schwab Capital Trust, Schwab Annuity Portfolios, Laudus Trust and Laudus Institutional Trust since 2011; Schwab Strategic Trust since 2016) Private Investor. 96 Director, Symantec Corporation (2003 – present) Director, Corcept Therapeutics Incorporated (2004 – present) Director, Adamas Pharmaceuticals, Inc. (2009 – present) Kiran M.
Patel 1948 Trustee (Trustee of The Charles Schwab Family of Funds, Schwab Investments, Schwab Capital Trust, Schwab Annuity Portfolios, Laudus Trust and Laudus Institutional Trust since 2011; Schwab Strategic Trust since 2016) Retired. Executive Vice President and General Manager of Small Business Group, Intuit, Inc. (financial software and services firm for consumers and small businesses) (Dec. 2008 – Sept.
2013) 96 Director, KLA-Tencor Corporation (2008 – present) 40 . Independent Trustees (continued) Name, Year of Birth, and Position(s) with the trust (Terms of office, and length of Time Served1) Principal Occupations During the Past Five Years Number of Portfolios in Fund Complex Overseen by the Trustee Other Directorships Kimberly S. Patmore 1956 Trustee (Trustee of The Charles Schwab Family of Funds, Schwab Investments, Schwab Capital Trust, Schwab Annuity Portfolios, Schwab Strategic Trust, and Laudus Trust since 2016) Consultant, Patmore Management Consulting (management consulting) (2008 – present). 96 None Charles A. Ruffel 1956 Trustee (Trustee of Schwab Strategic Trust since 2009; The Charles Schwab Family of Funds, Schwab Investments, Schwab Capital Trust, Schwab Annuity Portfolios, Laudus Trust and Laudus Institutional Trust since 2015) Co-Chief Executive Officer, Kudu Investment Management, LLC (financial services) (Jan. 2015 – present); Partner, Kudu Advisors, LLC (financial services) (June 2008 – Jan.
2015); Advisor, Asset International, Inc. (publisher of financial services information) (Aug. 2008 – Jan.
2015). 96 None Gerald B. Smith 1950 Trustee (Trustee of The Charles Schwab Family of Funds, Schwab Investments, Schwab Capital Trust and Schwab Annuity Portfolios since 2000; Laudus Trust and Laudus Institutional Trust since 2010; Schwab Strategic Trust since 2016) Chairman, Chief Executive Officer and Founder of Smith Graham & Co. (investment advisors) (Mar.
1990 – present). 96 Director, Eaton (2012 – present) Director and Chairman of the Audit Committee, Oneok Partners LP (2003 – 2013) Director, Oneok, Inc. (2009 – 2013) Lead Independent Director, Board of Cooper Industries (2002 – 2012) Joseph H. Wender 1944 Trustee (Trustee of The Charles Schwab Family of Funds, Schwab Investments, Schwab Capital Trust and Schwab Annuity Portfolios since 2008; Laudus Trust and Laudus Institutional Trust since 2010; Schwab Strategic Trust since 2016) Senior Consultant, Goldman Sachs & Co., Inc. (investment banking and securities firm) (Jan.
2008 – present); Partner, Colgin Partners, LLC (vineyards) (Feb. 1998 – present). 96 Board Member and Chairman of the Audit Committee, Isis Pharmaceuticals (1994 – present) Lead Independent Director and Chair of Audit Committee, OUTFRONT Media Inc. (2014 – present) Interested Trustees Name, Year of Birth, and Position(s) with the trust (Terms of office, and length of Time Served1) Walter W. Bettinger II2 1960 Chairman and Trustee (Trustee of The Charles Schwab Family of Funds, Schwab Investments, Schwab Capital Trust and Schwab Annuity Portfolios since 2008; Schwab Strategic Trust since 2009; Laudus Trust and Laudus Institutional Trust since 2010) Principal Occupations During the Past Five Years Director, President and Chief Executive Officer, The Charles Schwab Corporation (Oct.
2008 – present); President and Chief Executive Officer (Oct. 2008 – present), Director (May 2008 – present), Charles Schwab & Co., Inc.; Director, Charles Schwab Bank (Apr. 2006 – present); and Director, Schwab Holdings, Inc.
(May 2008 – present). Number of Portfolios in Fund Complex Overseen by the Trustee Other Directorships 96 Director, The Charles Schwab Corporation (2008 – present) 41 . Interested Trustees (continued) Name, Year of Birth, and Position(s) with the trust (Terms of office, and length of Time Served1) Principal Occupations During the Past Five Years Number of Portfolios in Fund Complex Overseen by the Trustee Other Directorships Marie A. Chandoha2 1961 Trustee (Trustee of The Charles Schwab Family of Funds, Schwab Investments, Schwab Capital Trust, Schwab Annuity Portfolios, Schwab Strategic Trust, and Laudus Trust since 2016) Director, President and Chief Executive Officer (Dec. 2010 – present), Chief Investment Officer (Sept. 2010 – Oct.
2011), Charles Schwab Investment Management, Inc.; Trustee (Jan. 2016 – present), President, Chief Executive Officer (Dec. 2010 – present), and Chief Investment Officer (Sept.
2010 – Oct. 2011), Schwab Funds, Laudus Funds and Schwab ETFs; Director, Charles Schwab Worldwide Funds plc and Charles Schwab Asset Management (Ireland) Limited (Jan. 2011 – present); Global Head of Fixed Income Business Division, BlackRock, Inc.
(formerly Barclays Global Investors) (March 2007 – Aug. 2010). 96 None Joseph R. Martinetto2 1962 Trustee (Trustee of The Charles Schwab Family of Funds, Schwab Investments, Schwab Capital Trust, Schwab Annuity Portfolios, Schwab Strategic Trust, and Laudus Trust since 2016) Senior Executive Vice President and Chief Financial Officer, The Charles Schwab Corporation and Charles Schwab & Co., Inc. (July 2015 – present); Executive Vice President and Chief Financial Officer of The Charles Schwab Corporation and Charles Schwab & Co., Inc.
(May 2007 – July 2015); Director, Charles Schwab & Co., Inc. (May 2007 – present); Director (Apr. 2010 – present) and Chief Executive Officer (July 2013 – Apr. 2015), Charles Schwab Bank; Director, Executive Vice President and Chief Financial Officer, Schwab Holdings, Inc.
(May 2007 – present). 96 None Officers of the Trust Name, Year of Birth, and Position(s) with the trust (Terms of office, and length of Time Served3) Principal Occupations During the Past Five Years Marie Chandoha 1961 President and Chief Executive Officer (Officer of The Charles Schwab Family of Funds, Schwab Investments, Schwab Capital Trust, Schwab Annuity Portfolios, Schwab Strategic Trust, Laudus Trust and Laudus Institutional Trust since 2010) Director, President and Chief Executive Officer (Dec. 2010 – present), Chief Investment Officer (Sept. 2010 – Oct.
2011), Charles Schwab Investment Management, Inc.; Trustee (Jan. 2016 – present), President, Chief Executive Officer (Dec. 2010 – present), and Chief Investment Officer (Sept.
2010 – Oct. 2011), Schwab Funds, Laudus Funds and Schwab ETFs; Director, Charles Schwab Worldwide Funds plc and Charles Schwab Asset Management (Ireland) Limited (Jan. 2011 – present); Global Head of Fixed Income Business Division, BlackRock, Inc.
(formerly Barclays Global Investors) (March 2007 – Aug. 2010). Mark Fischer 1970 Treasurer and Chief Financial Officer (Officer of The Charles Schwab Family of Funds, Schwab Investments, Schwab Capital Trust, Schwab Annuity Portfolios, Schwab Strategic Trust, Laudus Trust and Laudus Institutional Trust since 2013) Treasurer and Chief Financial Officer, Schwab Funds, Laudus Funds and Schwab ETFs (Jan. 2016 – present); Assistant Treasurer, Schwab Funds and Laudus Funds (Dec.
2013 – Dec. 2015), Schwab ETFs (Nov. 2013 – Dec.
2015); Vice President, Charles Schwab Investment Management, Inc. (Oct. 2013 – present); Executive Director, J.P.
Morgan Investor Services (Apr. 2011 – Sept. 2013); Assistant Treasurer, Massachusetts Financial Service Investment Management (May 2005 – Mar.
2011). 42 . Officers of the Trust (continued) Name, Year of Birth, and Position(s) with the trust (Terms of office, and length of Time Served3) Principal Occupations During the Past Five Years George Pereira 1964 Senior Vice President and Chief Operating Officer (Officer of The Charles Schwab Family of Funds, Schwab Investments, Schwab Capital Trust and Schwab Annuity Portfolios since 2004; Laudus Trust and Laudus Institutional Trust since 2006; Schwab Strategic Trust since 2009) Senior Vice President and Chief Financial Officer (Nov. 2004 – present), Chief Operating Officer (Jan. 2011 – present), Charles Schwab Investment Management, Inc.; Senior Vice President and Chief Operating Officer (Jan. 2016 – present), Treasurer and Chief Financial Officer, Laudus Funds (June 2006 – Dec.
2015); Treasurer and Principal Financial Officer, Schwab Funds (Nov. 2004 – Dec. 2015) and Schwab ETFs (Oct.
2009 – Dec. 2015); Director, Charles Schwab Worldwide Funds, plc and Charles Schwab Asset Management (Ireland) Limited (April 2005 – present). Omar Aguilar 1970 Senior Vice President and Chief Investment Officer – Equities (Officer of The Charles Schwab Family of Funds, Schwab Investments, Schwab Capital Trust, Schwab Annuity Portfolios, Schwab Strategic Trust, Laudus Trust and Laudus Institutional Trust since 2011) Senior Vice President and Chief Investment Officer – Equities, Charles Schwab Investment Management, Inc. (April 2011 – present); Senior Vice President and Chief Investment Officer – Equities, Schwab Funds, Laudus Funds and Schwab ETFs (June 2011 – present); Head of the Portfolio Management Group and Vice President of Portfolio Management, Financial Engines, Inc. (May 2009 – April 2011); Head of Quantitative Equity, ING Investment Management (July 2004 – Jan.
2009). Brett Wander 1961 Senior Vice President and Chief Investment Officer – Fixed Income (Officer of The Charles Schwab Family of Funds, Schwab Investments, Schwab Capital Trust, Schwab Annuity Portfolios, Schwab Strategic Trust, Laudus Trust and Laudus Institutional Trust since 2011) Senior Vice President and Chief Investment Officer – Fixed Income, Charles Schwab Investment Management, Inc. (April 2011 – present); Senior Vice President and Chief Investment Officer – Fixed Income, Schwab Funds, Laudus Funds and Schwab ETFs (June 2011 – present); Senior Managing Director, Global Head of Active Fixed-Income Strategies, State Street Global Advisors (Jan. 2008 – Oct.
2010); Director of Alpha Strategies Loomis, Sayles & Company (April 2006 – Jan. 2008). David Lekich 1964 Chief Legal Officer and Secretary, Schwab Funds and Schwab ETFs Vice President and Assistant Clerk, Laudus Funds (Officer of The Charles Schwab Family of Funds, Schwab Investments, Schwab Capital Trust, Schwab Annuity Portfolios, Schwab Strategic Trust, Laudus Trust and Laudus Institutional Trust since 2011) Senior Vice President (Sept. 2011 – present), Vice President (March 2004 – Sept.
2011), Charles Schwab & Co., Inc.; Senior Vice President and Chief Counsel (Sept. 2011 – present), Vice President (Jan. 2011 – Sept.
2011), Charles Schwab Investment Management, Inc.; Secretary (April 2011 – present) and Chief Legal Officer (Dec. 2011 – present), Schwab Funds; Vice President and Assistant Clerk, Laudus Funds (April 2011 – present); Secretary (May 2011 – present) and Chief Legal Officer (Nov. 2011 – present), Schwab ETFs. Catherine MacGregor 1964 Vice President and Assistant Secretary, Schwab Funds and Schwab ETFs Chief Legal Officer, Vice President and Clerk, Laudus Funds (Officer of The Charles Schwab Family of Funds, Schwab Investments, Schwab Capital Trust, Schwab Annuity Portfolios, Laudus Trust and Laudus Institutional Trust since 2005; Schwab Strategic Trust since 2009) Vice President, Charles Schwab & Co., Inc., Charles Schwab Investment Management, Inc.
(July 2005 – present); Vice President (Dec. 2005 – present), Chief Legal Officer and Clerk (Mar. 2007 – present), Laudus Funds; Vice President (Nov.
2005 – present) and Assistant Secretary (June 2007 – present), Schwab Funds; Vice President and Assistant Secretary, Schwab ETFs (Oct. 2009 – present). 1 2 3 Each Trustee shall hold office until the election and qualification of his or her successor, or until he or she dies, resigns or is removed. The retirement policy requires that each independent trustee retire by December 31 of the year in which the Trustee turns 74 or the Trustee’s twentieth year of service as an independent trustee on any trust in the Fund Complex, whichever occurs first. Mr.
Bettinger, Ms. Chandoha, and Mr. Martinetto are Interested Trustees because they own stock of The Charles Schwab Corporation, the parent company of the investment adviser. The President, Treasurer and Secretary/Clerk hold office until their respective successors are chosen and qualified or until he or she sooner dies, resigns, is removed or becomes disqualified.
Each of the other officers serves at the pleasure of the Board. 43 . Glossary asset allocation The practice of dividing a portfolio among different asset classes, with each asset class assigned a particular percentage. asset class A group of securities with similar structure and basic characteristics. Stocks, bonds and cash are the three main examples of asset classes. Barclays U.S. Aggregate Bond Index A broad-based benchmark that measures the investment grade, U.S. dollar-denominated, fixed-rate taxable bond market, including Treasuries, government-related and corporate securities, mortgage-backed securities (agency fixed-rate and hybrid ARM pass-throughs), asset-backed securities, and commercial mortgage-backed securities. Barclays U.S.
Aggregate Intermediate Bond Index An index that represents securities that are SEC-registered, taxable, and dollar denominated. The index covers the U.S. investment grade fixed rate bond market, with index components for government and corporate securities, mortgage pass-through securities, and asset-backed securities. Barclays U.S.
Treasury Bills 1 – 3 Months Index An index that includes all publicly issued zero-coupon U.S. Treasury Bills that have a remaining maturity of less than 3 months and more than 1 month, are rated investment grade, and have $250 million or more of outstanding face value. bond A security representing a loan from the investor to the issuer. A bond typically pays interest at a fixed rate (the coupon rate) until a specified date (the maturity date), at which time the issuer returns the money borrowed (principal or face value) to the bondholder.
Because of their structure, bonds are sometimes called “fixed income securities” or “debt securities.” An individual bond is subject to the credit risk of the issuer. Changes in interest rates can affect a bond’s market value prior to call or maturity. There is no guarantee that a bond’s yield to call or maturity will provide a positive return over the rate of inflation. bond fund A bond fund is subject to the same credit, interest rate, and inflation risks as bonds. In addition, a bond fund incurs ongoing fees and expenses.
A bond fund’s net asset value will fluctuate with the price of the underlying bonds and the portfolio turnover activity; return of principal is not guaranteed. cap, capitalization See “market cap.” capital gain, capital loss The difference between the amount paid for an investment and its value at a later time. If the investment has been sold, the capital gain or loss is considered a realized gain or loss. If the investment is still held, the gain or loss is still “on paper” and is considered unrealized. Enhanced Payout Composite Index A custom blended index developed by CSIM based on a comparable portfolio asset allocation.
Effective April 1, 2013, the Enhanced Payout Composite Index is composed of 19.50% S&P 500 Index, 8.12% MSCI EAFE (Net) Index, 4.88% FTSE EPRA/NAREIT Global Index (Net), 39.30% Barclays U.S. Aggregate Bond 44 Index, 26.20% Barclays U.S. Aggregate Intermediate Bond Index, and 2.00% Barclays U.S.
Treasury Bills: 1 – 3 Months Index. Prior to April 1, 2013, the Enhanced Payout Composite Index was composed of 25% S&P 500 Index and 75% Barclays U.S. Aggregate Bond Index. expense ratio The amount that is taken from a mutual fund’s assets each year to cover the fund’s operating expenses.
An expense ratio of 0.50% means that a fund’s expenses amount to half of one percent of its average net assets a year. FTSE EPRA/NAREIT Global Index An index that is designed to provide a diverse representation of publicly traded equity real estate investment trusts (REITs) and listed property companies worldwide. market cap, market capitalization The value of a company as determined by the total value of all shares of its stock outstanding. Maximum Payout Composite Index A custom blended index developed by CSIM based on a comparable portfolio asset allocation. Effective April 1, 2013, the Maximum Payout Composite Index is composed of 10.50% S&P 500 Index, 4.37% MSCI EAFE (Net) Index, 2.63% FTSE EPRA/NAREIT Global Index (Net), 48.30% Barclays U.S. Aggregate Bond Index, 32.20% Barclays U.S.
Aggregate Intermediate Bond Index, and 2.00% Barclays U.S. Treasury Bills: 1 – 3 Months Index. Prior to April 1, 2013, the Maximum Payout Composite Index was composed of 10% S&P 500 Index and 90% Barclays U.S.
Aggregate Bond Index. Moderate Payout Composite Index A custom blended index developed by CSIM based on a comparable portfolio asset allocation. Effective April 1, 2013, the Moderate Payout Composite Index is composed of 28.50% S&P 500 Index, 11.87% MSCI EAFE (Net) Index, 7.13% FTSE EPRA/NAREIT Global Index (Net), 30.30% Barclays U.S. Aggregate Bond Index, 20.20% Barclays U.S.
Aggregate Intermediate Bond Index, and 2.00% Barclays U.S. Treasury Bills: 1 – 3 Months Index. Prior to April 1, 2013, the Moderate Payout Composite Index was composed of 40% S&P 500 Index and 60% Barclays U.S.
Aggregate Bond Index. MSCI EAFE (Europe, Australasia, Far East) Index A free float-adjusted market capitalization index that is designed to measure the equity market performance of developed markets, excluding the U.S. & Canada. The Net version of the index reflects reinvested dividends net of withholding taxes, but reflects no deductions for expenses or other taxes; returns are calculated applying dividend withholding rates applicable to non-resident persons who do not benefit from double taxation treaties. net asset value (NAV) The value of one share of a mutual fund.
NAV is calculated by taking the fund’s total assets, subtracting liabilities, and dividing by the number of shares outstanding. outstanding shares, shares outstanding When speaking of a company or mutual fund, indicates all shares currently held by investors. price-to-book ratio (P/B) The market price of a company’s stock compared with its “book value.” A mutual fund’s P/B is the weighted average of the P/B of all stocks in the fund’s portfolio. . price-to-earnings ratio (P/E) The market price of a company’s stock compared with earnings over the past year. A mutual fund’s P/E is the weighted average of the P/E of all stocks in the fund’s portfolio. return on equity (ROE) The average yearly rate of return for each dollar of investors’ money, measured over the past five years. Russell 2000 Index An index that measures the performance of the small-cap segment of the U.S. equity universe. S&P 500 Index A market capitalization index that is designed to measure the performance of 500 leading publicly held companies in leading industries of the U.S. economy. total return The percentage that an investor would have earned or lost on an investment in the fund assuming dividends and distributions were reinvested. 12-Month Distribution Yield reflects the fund’s monthly ordinary income distributions for the last 12 months divided by the fund’s Net Asset Value as of the end of the reporting period. Distribution yield does not include capital gains distributions. weighted average For mutual funds, an average that gives the same weight to each security as the security represents in the fund’s portfolio. yield The income paid out by an investment, expressed as a percentage of the investment’s market value. stock A share of ownership, or equity, in the issuing company. 45 .
A Commitment to Your Privacy tools help us to recognize you, maintain your web session, and provide a more personalized experience. To learn more, please go to www.schwab.com/privacy. Your Privacy Is Not for Sale How We Share and Use Your Information We do not and will not sell your personal information to anyone, for any reason. We provide access to information about you to our affiliated companies, outside companies and other third parties in certain limited circumstances, including: PRIVACY NOTICE THIS IS NOT PART OF THE SHAREHOLDER REPORT We are committed to protecting the privacy of information we maintain about you. Below are details about our commitment, including the types of information we collect and how we use and share that information. This Privacy Notice applies to you only if you are an individual who invests directly in the funds by placing orders through the funds’ transfer agent.
If you place orders through your brokerage account at Charles Schwab & Co., Inc. or an account with another broker-dealer, investment advisor, 401(k) plan, employee benefit plan, administrator, bank or other financial intermediary, you are covered by the privacy policies of that financial institution and should consult those policies. • to help us process transactions for your account; • when we use other companies to provide services for us, such as printing and mailing your account statements; • when we believe that disclosure is required or permitted under law (for example, to cooperate with regulators or law enforcement, resolve consumer disputes, perform credit/authentication checks, or for risk control). State Laws We will comply with state laws that apply to the disclosure or use of information about you. How We Collect Information About You We collect personal information about you in a number of ways. • APPLICATION AND REGISTRATION INFORMATION. We collect personal information from you when you open an account or utilize one of our services. We may also collect information about you from third parties such as consumer reporting agencies to verify your identity.
The information we collect may include personal information, including your Social Security number, as well as details about your interests, investments and investment experience. • TRANSACTION AND EXPERIENCE INFORMATION. Once your account has been opened, we collect and maintain personal information about your account activity, including your transactions, balances, positions and history. This information allows us to administer your account and provide the services you have requested. • WEBSITE USAGE. When you visit our websites, we may use devices known as “cookies,” graphic interchange format files (GIFs), or other similar web tools to enhance your web experience. These 46 Safeguarding Your Information — Security Is a Partnership We take precautions to ensure the information we collect about you is protected and is accessed only by authorized individuals or organizations. Companies we use to provide support services are not allowed to use information about our shareholders for their own purposes and are contractually obligated to maintain strict confidentiality. We limit their use of information to the performance of the specific services we have requested. We restrict access to personal information by our employees and agents.
Our employees are trained about privacy and are required to safeguard personal information. We maintain physical, electronic and procedural safeguards that comply with federal standards to guard your nonpublic personal information. Contact Us To provide us with updated information, report suspected fraud or identity theft, or for any other questions, please call the number below. Schwab Funds® direct investors: 1-800-407-0256 © 2016 Schwab Funds. All rights reserved. . Notes . Notes . Schwab Funds® offers you an extensive family of mutual funds, each one based on a clearly defined investment approach and using disciplined management strategies. The list at right shows all currently available Schwab Funds. Whether you are an experienced investor or just starting out, Schwab Funds can help you achieve your financial goals. An investor should consider a fund’s investment objectives, risks, charges and expenses carefully before investing or sending money. This and other important information can be found in the fund’s prospectus. Please call 1-800-435-4000 for a prospectus and brochure for any Schwab Fund.
Please read the prospectus carefully before you invest. This report must be preceded or accompanied by a current prospectus. Proxy Voting Policies, Procedures and Results A description of the proxy voting policies and procedures used to determine how to vote proxies on behalf of the funds is available without charge, upon request, by visiting the Schwab Funds’ website at www.csimfunds.com/schwabfunds_prospectus, the SEC’s website at www.sec.gov, or by contacting Schwab Funds at 1-800-435-4000. Information regarding how a fund voted proxies relating to portfolio securities during the most recent twelve-month period ended June 30 is available, without charge, by visiting the fund’s website at www.csimfunds.com/schwabfunds_prospectus or the SEC’s website at www.sec.gov. The Schwab Funds Family® Stock Funds Schwab Core Equity Fund™ Schwab Dividend Equity Fund™ Schwab Large-Cap Growth Fund™ Schwab Small-Cap Equity Fund™ Schwab Hedged Equity Fund™ Schwab Financial Services Fund™ Schwab Health Care Fund™ Schwab® International Core Equity Fund Schwab Fundamental US Large Company Index Fund Schwab Fundamental US Small Company Index Fund Schwab Fundamental International Large Company Index Fund Schwab Fundamental International Small Company Index Fund Schwab Fundamental Emerging Markets Large Company Index Fund Schwab Fundamental Global Real Estate Index Fund Schwab Global Real Estate Fund™ Schwab® S&P 500 Index Fund Schwab 1000 Index® Fund Schwab Small-Cap Index Fund® Schwab Total Stock Market Index Fund® Schwab International Index Fund® Asset Allocation Funds Schwab Balanced Fund™ Schwab MarketTrack All Equity Portfolio™ Schwab MarketTrack Growth Portfolio™ Schwab MarketTrack Balanced Portfolio™ Schwab MarketTrack Conservative Portfolio™ Schwab Target 2010 Fund Schwab Target 2015 Fund Schwab Target 2020 Fund Schwab Target 2025 Fund Schwab Target 2030 Fund Schwab Target 2035 Fund Schwab Target 2040 Fund Schwab Target 2045 Fund Schwab Target 2050 Fund Schwab Target 2055 Fund Schwab® Monthly Income Fund – Moderate Payout Schwab® Monthly Income Fund – Enhanced Payout Schwab® Monthly Income Fund – Maximum Payout Bond Funds Schwab Short-Term Bond Market Fund™ Schwab Intermediate-Term Bond Fund™ Schwab Total Bond Market Fund™ Schwab GNMA Fund™ Schwab® Treasury Inflation Protected Securities Index Fund Schwab Tax-Free Bond Fund™ Schwab California Tax-Free Bond Fund™ Schwab Money Funds Schwab offers an array of money market funds1. Choose from taxable or tax-advantaged alternatives.
Many can be linked to your eligible Schwab account to “sweep” cash balances automatically, subject to availability, when you’re between investments. Or, for your larger cash reserves, choose one of our Value Advantage Investments®. 1 Investments in money market funds are neither insured nor guaranteed by the Federal Deposit Insurance Corporation (FDIC) or any other government agency and, although many seek to preserve the value of your investment at $1 per share, it is possible to lose money. . This report is not authorized for distribution to prospective investors unless preceded or accompanied by a current prospectus. © 2016 Charles Schwab & Co., Inc. All rights reserved. Member SIPC® Printed on recycled paper. MFR43716-09 00160185 Funds Schwab Funds® 1-800-435-4000 Investment Adviser Charles Schwab Investment Management, Inc. 211 Main Street, San Francisco, CA 94105 . . .
. . .
. . .
. . .
. . .
. . .
. . .
. . .
. . .
. . .
. . .
. . .
. . .
. . .
. . .
. . . From the President .
. . .
. . .
. . .
. . .
. . .
. . .
. . .
. . .
. . .
. . .
. . .
. . .
. . .
. . .
. . .
. . .
. . .
. . . Fund Management .
. . .
. . .
. . .
. . .
. . .
. . .
. . .
. . .
. . .
. . .
. . .
. . .
. . .
. . .
. . .
. . .
. . .
. . . Performance and Fund Facts Schwab Monthly Income Fund – Moderate Payout .
. . .
. . .
. . .
. . .
. . Schwab Monthly Income Fund – Enhanced Payout . .
. . .
. . .
. . .
. . .
. Schwab Monthly Income Fund – Maximum Payout . . .
. . .
. . .
. . .
. . Fund Expenses . .
. . .
. . .
. . .
. . .
. . .
. . .
. . .
. . .
. . .
. . .
. . .
. . .
. . .
. . .
. . .
. . .
. . .
. . .
. . .
. Financial Statements and Portfolio Holdings Schwab Monthly Income Fund - Moderate Payout. . .
. . .
. . .
. . .
. . .
. Schwab Monthly Income Fund - Enhanced Payout . . .
. . .
. . .
. . .
. . . Schwab Monthly Income Fund - Maximum Payout .
. . .
. . .
. . .
. . .
. Financial Notes. . .
. . .
. . .
. . .
. . .
. . .
. . .
. . .
. . .
. . .
. . .
. . .
. . .
. . .
. . .
. . .
. . .
. . .
. . .
. . . Report of Independent Registered Public Accounting Firm.
. . .
. . .
. . Other Federal Tax Information . .
. . .
. . .
. . .
. . .
. . .
. . .
. . .
. . .
. . .
. . .
. . .
. . .
. . . Shareholder Vote Results (Unaudited) .
. . .
. . .
. . .
. . .
. . .
. . .
. . .
. . .
. . .
. . .
. . Trustees and Officers . .
. . .
. . .
. . .
. . .
. . .
. . .
. . .
. . .
. . .
. . .
. . .
. . .
. . .
. . .
. . .
. . .
. . . Glossary .
. . .
. . .
. . .
. . .
. . .
. . .
. . .
. . .
. . .
. . .
. . .
. . .
. . .
. . .
. . .
. . .
. . .
. . .
. . .
. . .
. . .
. . .
. Fund investment adviser: Charles Schwab Investment Management, Inc. (CSIM). Distributor: Charles Schwab & Co., Inc. (Schwab). 2 3 5 6 8 10 12 13 18 23 28 37 38 39 40 44 .
Performance at a Glance The performance data quoted represents past performance. Past performance does not guarantee future results. Investment returns and principal value will fluctuate so that an investor’s shares may be worth more or less than their original cost. Current performance may be lower or higher than performance data quoted. To obtain performance information current to the most recent month end, please visit www.csimfunds.com/schwabfunds_prospectus. Total Returns for the 12 Months Ended December 31, 2015 Schwab Monthly Income Fund - Moderate Payout (Ticker Symbol: SWJRX) Moderate Payout Composite Index Fund Category: Morningstar Conservative Allocation Performance Details -0.24% 0.88% -2.32% pages 6-7 Schwab Monthly Income Fund - Enhanced Payout (Ticker Symbol: SWKRX) Enhanced Payout Composite Index Fund Category: Morningstar Conservative Allocation Performance Details 0.02% 0.90% -2.32% pages 8-9 Schwab Monthly Income Fund - Maximum Payout (Ticker Symbol: SWLRX) Maximum Payout Composite Index Fund Category: Morningstar Intermediate-Term Bond Performance Details 0.22% 0.87% -0.26% pages 10-11 Minimum Initial Investment1 $100 All fund and index figures on this page assume dividends and distributions were reinvested.
Index figures do not include trading and management costs, which would lower performance. Indices are unmanaged and cannot be invested in directly. For index definitions, please see the Glossary. Fund expenses have been absorbed by CSIM and its affiliates. Without these reductions, the funds’ returns would have been lower.
These returns do not reflect the deduction of taxes that a shareholder would pay on fund distributions or the redemption of fund shares. Source for category information: Morningstar, Inc. The Morningstar Category return represents all active and index mutual funds within the category as of the report date. 1 Please see prospectus for further detail and eligibility requirements. 2 Schwab Monthly Income Funds . From the President Dear Shareholder, At Charles Schwab Investment Management, we aim to make investing straightforward for our investors. Our goal is to provide foundational products with consistent performance that enable investors to build diversified portfolios. Marie Chandoha is President and CEO of Charles Schwab Investment Management, Inc. and the funds covered in this report. Looking at year-end results, 2015 might have seemed a relatively quiet and calm year in many investment sectors. However, 2015 was actually quite unpredictable.
The S&P 500 Index eked out a 1.4% gain while its counterpart benchmark bond index, the Barclays U.S. Aggregate Bond Index, returned only 0.6%. And the MSCI EAFE Index (Net), which broadly represents the performance of international stocks, returned -0.8%.
However, China’s slowing economy, speculation regarding a rise in U.S. short-term interest rates, commodity price decreases, and the surging U.S dollar created uncertainty and volatility, though many indices ultimately ended the year close to their starting points. It was within this environment that Charles Schwab Investment Management’s professional portfolio managers monitored markets and adjusted the portfolios that comprise the Schwab Monthly Income Funds. These funds seek to provide investors with current income and, as a secondary investment objective, capital appreciation. Each fund provides a payout generated from its allocation to fixed-income funds, equity funds, and money market funds. For the 12-month reporting period ended December 31, 2015, the funds generated mixed returns as short-term interest rates remained historically low.
These low rates, combined with dividends and short-term capital gains received, caused the funds’ investments in stock funds to generate more income through dividends than the funds’ investments in fixed-income funds. As a result, the Schwab Monthly Income Fund—Moderate Payout had the highest annual income payout of the three funds, reflecting its larger allocation to stock funds. Asset Class Performance Comparison % returns during the 12 months ended 12/31/2015 This graph compares the performance of various asset classes during the report period. Final performance figures for the period are in the key below. 15% 10% 1.38% S&P 500® Index: measures U.S.
large-cap stocks –4.41% Russell 2000® Index: measures U.S. small-cap stocks –0.81% MSCI EAFE® Index (Net): measures (in U.S. dollars) large-cap stocks in Europe, Australasia and the Far East 5% 0% -5% 0.55% Barclays U.S.
Aggregate Bond Index: measures the U.S. bond market -10% 0.03% Barclays U.S. Treasury Bills 1-3 Months Index: measures short-term U.S. Treasury obligations 12/31/14 2/25 4/29 6/24 8/26 10/28 12/31/15 These figures assume dividends and distributions were reinvested.
Index figures do not include trading and management costs, which would lower performance. Indices are unmanaged and you cannot invest in them directly. Remember that past performance is not a guarantee of future results. Data source: Index provider websites and CSIM. Nothing in this report represents a recommendation of a security by the investment adviser. Management views and portfolio holdings may have changed since the report date. Schwab Monthly Income Funds 3 .
From the President continued For the 12-month reporting period ended December 31, 2015, the funds generated mixed returns as short-term interest rates remained historically low. 4 Schwab Monthly Income Funds Thank you for investing with Charles Schwab Investment Management, and for trusting us to help you achieve your financial goals. For more information about the Schwab Monthly Income Funds, please continue reading this report or visit our website at www.csimfunds.com. We are also happy to hear from you at 1-800-435-4000. Sincerely, . Fund Management Zifan Tang, Ph.D., CFA, Managing Director and Head of Asset Allocation Strategies, leads the portfolio management team and has overall responsibility for all aspects of the management of the funds. She was appointed portfolio manager of the funds in February 2012. Prior to joining CSIM in 2012, Ms. Tang was a product manager at Thomson Reuters and, from 1997 to 2009, worked as a portfolio manager at Barclays Global Investors, which was subsequently acquired by BlackRock. Schwab Monthly Income Funds 5 .
Schwab Monthly Income Fund – Moderate Payout The Schwab Monthly Income Funds (the funds) seek to provide current income, with capital appreciation as a secondary investment objective. The funds primarily invest in a fund-of-funds structure that involves holding equity, fixed income, and money market funds selected from within the Schwab Funds and Laudus Funds complex, but they may buy individual securities and unaffiliated funds to accomplish these objectives. Holdings are based on each fund’s target asset allocation, with returns reflecting the combined performance and respective weightings of the underlying investments. The Schwab Monthly Income Fund—Moderate Payout (the fund) is designed to offer investors a targeted annual payout of 3% to 4%1 and an increase in capital over the long term. However, during a low interest rate environment (such as the one experienced during the reporting period), the fund’s anticipated annual payout is generally expected to be 1% to 3%.
The fund uses the internally calculated, custom-blended Moderate Payout Composite Index (the composite index) as a performance gauge. Market Highlights. U.S. stocks produced mixed returns for the 12-month reporting period.
Large-cap stocks, represented by the S&P 500 Index, returned 1.38%, while small-cap stocks, represented by the Russell 2000 Index, fell 4.41%. Over the reporting period, the U.S. economy showed steady, albeit slow, gains, and in December, after months of anticipation, the Federal Reserve commenced its long-awaited interest-rate hike.
Internationally, both developed and emerging markets struggled amid weak global commodity prices, slowing growth in China, and economic concerns in Europe, among other impacts. Performance. The fund’s distribution yield (payout) was 2.68% for the year ended December 31, 2015, generally in line with the investment adviser’s expectations in the low interest rate environment. For the 12-month reporting period, the fund’s total return was -0.24%, while the composite index returned 0.88%. Positioning and Strategies.
Although the fund’s allocations to equities and fixed income vary within certain established parameters, they were broadly aligned with those of the composite index. The fund’s U.S. large-cap equity exposure detracted the most from both the fund’s total return and relative performance. The fund’s position in the Schwab Dividend Equity FundTM returned -3.52% for the 12-month reporting period, underperforming the composite index’s U.S.
large-cap equity allocation component, the S&P 500 Index, which returned 1.38%. Among positive contributors, the Schwab Global Real Estate FundTM, the fund’s real estate position, was one of the strongest, returning 3.02% for the reporting period and contributing positively to both total return and relative performance. The fund’s international equity exposure also contributed to both total return and relative performance, with the Laudus International MarketMasters FundTM (Select Shares) returning 1.61% versus the composite index’s international equity allocation component, the MSCI EAFE Index (Net), which returned -0.81%. The fund’s two fixed-income holdings both contributed positively to total return, with the Schwab Total Bond Market FundTM and the Schwab Intermediate-Term Bond FundTM returning 0.29% and 0.73%, respectively. Both, however, underperformed their respective benchmarks, dampening the fund’s return relative to the fund’s composite index. As of 12/31/15: Asset Class Weightings % of Investments3 Statistics Number of Holdings Portfolio Turnover Rate 12-Month Distribution Yield 6 Fixed-Income Funds – Intermediate-Term Bond 14% 2.68%2 Equity Funds – Large-Cap Equity Funds – International Equity Funds – Global Real Estate Money Market Funds Total 50.4% 28.2% 11.9% 7.5% 2.0% 100.0% Top Holdings % of Net Assets4,5 Schwab Total Bond Market Fund Schwab Dividend Equity Fund Schwab Intermediate-Term Bond Fund Laudus International MarketMasters Fund, Select Shares Schwab Global Real Estate Fund Total 30.2% 28.2% 20.2% 11.9% 7.5% 98.0% Management views and portfolio holdings may have changed since the report date. The Laudus MarketMasters Funds are part of Schwab Capital Trust and distributed by Charles Schwab & Co., Inc. 1 The fund’s actual annual payout could be higher or lower than the targeted annual payout based on the interest rate environment and other market factors occurring during that year.
The fund’s anticipated annual payout during a low interest rate environment is anticipated to be 1% to 3%, and, during a high interest rate environment, is anticipated to be 3% to 6%. For more information about payouts, please see the fund’s prospectus. 2 Calculation reflects the fund’s monthly ordinary income distributions for the last 12 months divided by the fund’s Net Asset Value as of the end of the reporting period. Distribution yield does not include capital gains distributions.
Fund expenses may have been partially absorbed by the investment adviser and its affiliates. Without these reductions, the total return/yield may have been lower. 3 The fund intends to invest in a combination of the underlying funds; however, the fund may also invest directly in equity and fixed income securities, exchange-traded funds, and cash equivalents, including money market securities. 4 This list is not a recommendation of any security by the investment adviser. 5 The holdings listed exclude any temporary liquidity investments. 6 Schwab Monthly Income Funds . Schwab Monthly Income Fund – Moderate Payout Performance and Fund Facts as of 12/31/15 The performance data quoted represents past performance. Past performance does not guarantee future results. Investment returns and principal value will fluctuate so that an investor’s shares may be worth more or less than their original cost. Current performance may be lower or higher than performance data quoted. To obtain performance information current to the most recent month end, please visit www.csimfunds.com/schwabfunds_prospectus. March 28, 2008 – December 31, 2015 Performance of Hypothetical $10,000 Investment1 $20K $15K Fund $14,199 Moderate Payout Composite Index $15,401 S&P 500 Index $18,258 Barclays U.S.
Aggregate Bond Index $13,704 $10K $5K $0K 3/28/08 12/08 12/09 12/10 12/11 12/12 12/13 12/14 12/31/15 Average Annual Total Returns1,2 Fund and Inception Date 1 Year 5 Years Since Inception Fund: Schwab Monthly Income Fund – Moderate Payout (3/28/08) Moderate Payout Composite Index S&P 500 Index Barclays U.S. Aggregate Bond Index Fund Category: Morningstar Conservative Allocation -0.24% 0.88% 1.38% 0.55% -2.32% 5.29% 6.57% 12.57% 3.25% 4.30% 4.62% 5.72% 8.06% 4.14% 4.29% Fund Expense Ratios3: Net 0.66%; Gross 0.91% All total returns on this page assume dividends and distributions were reinvested. Index figures do not include trading and management costs, which would lower performance.
Indices are unmanaged and cannot be invested in directly. Performance results less than one year are not annualized. For index definitions, please see the Glossary. 1 The fund’s routine expenses have been absorbed by CSIM and its affiliates. Without these reductions, the fund’s returns would have been lower.
These returns do not reflect the deduction of taxes that a shareholder would pay on fund distributions or the redemption of fund shares. 2 Source for category information: Morningstar, Inc. The Morningstar Category return represents all active and index mutual funds within the category as of the report date. 3 As stated in the prospectus. Includes expenses of the underlying funds in which the fund invests.
The annualized weighted average expense ratio of the underlying funds was 0.66%. Net Expense: Expenses reduced by a contractual fee waiver in effect for so long as CSIM serves as adviser to the fund. Gross Expense: Does not reflect the effect of contractual fee waivers.
For actual ratios during the period, refer to the financial highlights section of the financial statements. Schwab Monthly Income Funds 7 . Schwab Monthly Income Fund – Enhanced Payout The Schwab Monthly Income Funds (the funds) seek to provide current income, with capital appreciation as a secondary investment objective. The funds primarily invest in a fund-of-funds structure that involves holding equity, fixed income, and money market funds selected from within the Schwab Funds and Laudus Funds complex, but they may buy individual securities and unaffiliated funds to accomplish these objectives. Holdings are based on each fund’s target asset allocation, with returns reflecting the combined performance and respective weightings of the underlying investments. The Schwab Monthly Income Fund—Enhanced Payout (the fund) is designed to offer investors a targeted annual payout of 4% to 5%1 and an increase in capital over the long term. However, during a low interest rate environment (such as the one experienced during the reporting period), the fund’s anticipated annual payout is generally expected to be 1% to 4%.
The fund uses the internally calculated Enhanced Payout Composite Index (the composite index) as a performance gauge. Market Highlights. U.S. stocks produced mixed returns for the 12-month reporting period.
Large-cap stocks, represented by the S&P 500 Index, returned 1.38%, while small-cap stocks, represented by the Russell 2000 Index, fell 4.41%. Over the reporting period, the U.S. economy showed steady, albeit slow, gains, and in December, after months of anticipation, the Federal Reserve commenced its long-awaited interest-rate hike.
Internationally, both developed and emerging markets struggled amid weak global commodity prices, slowing growth in China, and economic concerns in Europe, among other impacts. Performance. The fund’s distribution yield (payout) was 2.41% for the year ended December 31, 2015, generally in line with the investment adviser’s expectations in the low interest rate environment. For the 12-month reporting period, the fund’s total return was 0.02%, with the composite index returning 0.90%. Positioning and Strategies.
Although the fund’s allocations to equities and fixed income vary within certain established parameters, they were broadly aligned with those of the composite index. The fund’s U.S. large-cap equity exposure detracted the most from both the fund’s total return and its relative performance. The fund’s position in the Schwab Dividend Equity FundTM returned -3.52% for the 12-month reporting period, underperforming the composite index’s U.S.
large-cap equity allocation component, the S&P 500 Index, which returned 1.38%. Among positive contributors, the Schwab Global Real Estate FundTM, the fund’s real estate position, was one of the strongest, returning 3.02% for the reporting period and contributing positively to both total return and relative performance. The fund’s international equity exposure also contributed to both total return and relative performance, with the Laudus International MarketMasters FundTM (Select Shares) returning 1.61% versus the composite index’s international equity allocation component, the MSCI EAFE Index (Net), which returned -0.81%. The fund’s two fixed-income holdings both contributed positively to total return, with the Schwab Total Bond Market FundTM and the Schwab Intermediate-Term Bond FundTM returning 0.29% and 0.73%, respectively. Both, however, underperformed their respective benchmarks, dampening the fund’s return relative to the fund’s composite index. As of 12/31/15: Statistics Number of Holdings Portfolio Turnover Rate 12-Month Distribution Yield Asset Class Weightings % of Investments3 6 Fixed-Income Funds – Intermediate-Term Bond 11% 2.41%2 Equity Funds – Large-Cap Equity Funds – International Equity Funds – Global Real Estate Money Market Funds Total 65.4% 19.3% 8.1% 5.2% 2.0% 100.0% Top Holdings % of Net Assets4,5 Schwab Total Bond Market Fund Schwab Intermediate-Term Bond Fund Schwab Dividend Equity Fund Laudus International MarketMasters Fund, Select Shares Schwab Global Real Estate Fund Total 39.1% 26.1% 19.3% 8.1% 5.2% 97.8% Management views and portfolio holdings may have changed since the report date. The Laudus MarketMasters Funds are part of Schwab Capital Trust and distributed by Charles Schwab & Co., Inc. 1 The fund’s actual annual payout could be higher or lower than the targeted annual payout based on the interest rate environment and other market factors occurring during that year.
The fund’s anticipated annual payout during a low interest rate environment is anticipated to be 1% to 4%, and, during a high interest rate environment, is anticipated to be 4% to 7%. For more information about payouts, please see the fund’s prospectus. 2 Calculation reflects the fund’s monthly ordinary income distributions for the last 12 months divided by the fund’s Net Asset Value as of the end of the reporting period. Distribution yield does not include capital gains distributions.
Fund expenses may have been partially absorbed by the investment adviser and its affiliates. Without these reductions, the total return/yield may have been lower. 3 The fund intends to invest in a combination of the underlying funds; however, the fund may also invest directly in equity and fixed income securities, exchange-traded funds, and cash equivalents, including money market securities. 4 This list is not a recommendation of any security by the investment adviser. 5 The holdings listed exclude any temporary liquidity investments. 8 Schwab Monthly Income Funds . Schwab Monthly Income Fund – Enhanced Payout Performance and Fund Facts as of 12/31/15 The performance data quoted represents past performance. Past performance does not guarantee future results. Investment returns and principal value will fluctuate so that an investor’s shares may be worth more or less than their original cost. Current performance may be lower or higher than performance data quoted. To obtain performance information current to the most recent month end, please visit www.csimfunds.com/schwabfunds_prospectus. March 28, 2008 – December 31, 2015 Performance of Hypothetical $10,000 Investment1,2 $20K $15K Fund $13,775 Enhanced Payout Composite Index $14,870 S&P 500 Index $18,258 Barclays U.S.
Aggregate Bond Index $13,704 $10K $5K $0K 3/28/08 12/08 12/09 12/10 12/11 12/12 12/13 12/14 12/31/15 Average Annual Total Returns1,2,3 Fund and Inception Date 1 Year 5 Years Since Inception Fund: Schwab Monthly Income Fund – Enhanced Payout (3/28/08) Enhanced Payout Composite Index S&P 500 Index Barclays U.S. Aggregate Bond Index Fund Category: Morningstar Conservative Allocation 0.02% 0.90% 1.38% 0.55% -2.32% 4.47% 5.44% 12.57% 3.25% 4.30% 4.21% 5.24% 8.06% 4.14% 4.29% Fund Expense Ratios4: Net 0.57%; Gross 0.72% All total returns on this page assume dividends and distributions were reinvested. Index figures do not include trading and management costs, which would lower performance.
Indices are unmanaged and cannot be invested in directly. Performance results less than one year are not annualized. For index definitions, please see the Glossary. 1 The fund’s routine expenses have been absorbed by CSIM and its affiliates. Without these reductions, the fund’s returns would have been lower.
These returns do not reflect the deduction of taxes that a shareholder would pay on fund distributions or the redemption of fund shares. 2 On June 16, 2009, the Schwab Retirement Income Fund merged into the fund. 3 Source for category information: Morningstar, Inc. The Morningstar Category return represents all active and index mutual funds within the category as of the report date. 4 As stated in the prospectus. Includes expenses of the underlying funds in which the fund invests.
The annualized weighted average expense ratio of the underlying funds was 0.57%. Net Expense: Expenses reduced by a contractual fee waiver for so long as CSIM serves as the adviser to the fund. Gross Expense: Does not reflect the effect of contractual fee waivers.
For actual ratios during the period, refer to the financial highlights section in the financial statements. Schwab Monthly Income Funds 9 . Schwab Monthly Income Fund – Maximum Payout The Schwab Monthly Income Funds (the funds) seek to provide current income, with capital appreciation as a secondary investment objective. The funds primarily invest in a fund-of-funds structure that involves holding equity, fixed income, and money market funds selected from within the Schwab Funds and Laudus Funds complex, but they may buy individual securities and unaffiliated funds to accomplish these objectives. Holdings are based on each fund’s target asset allocation, with returns reflecting the combined performance and respective weightings of the underlying investments. The Schwab Monthly Income Fund—Maximum Payout (the fund) is designed to offer investors a targeted annual payout of 5% to 6%1 and an increase in capital over the long term. However, during a low interest rate environment (such as the one experienced during the reporting period), the fund’s anticipated annual payout is generally expected to be 1% to 5%.
The fund uses the internally calculated Maximum Payout Composite Index (the composite index) as a performance gauge. Market Highlights. U.S. stocks produced mixed returns for the 12-month reporting period.
Large-cap stocks, represented by the S&P 500 Index, returned 1.38%, while small-cap stocks, represented by the Russell 2000 Index, fell 4.41%. Over the reporting period, the U.S. economy showed steady, albeit slow, gains, and in December, after months of anticipation, the Federal Reserve commenced its long-awaited interest-rate hike.
Internationally, both developed and emerging markets struggled amid weak global commodity prices, slowing growth in China, and economic concerns in Europe, among other impacts. Performance. The fund’s distribution yield (payout) was 2.30% for the year ended December 31, 2015, generally in line with the investment adviser’s expectations in the low interest rate environment. For the 12-month reporting period, the fund’s total return was 0.22%, with the composite index returning 0.87%. Positioning and Strategies.
Although the fund’s allocations to equities and fixed income vary within certain established parameters, they were broadly aligned with those of the composite index. The fund’s U.S. large-cap equity exposure detracted the most from both the fund’s total return and its relative performance. The fund’s position in the Schwab Dividend Equity FundTM returned -3.52% for the 12-month reporting period, underperforming the composite index’s U.S.
large-cap equity allocation component, the S&P 500 Index, which returned 1.38%. Among positive contributors, the Schwab Global Real Estate FundTM, the fund’s real estate position, was one of the strongest, returning 3.02% for the reporting period and contributing positively to both total return and relative performance. The fund’s international equity exposure also contributed to both total return and relative performance, with the Laudus International MarketMasters FundTM (Select Shares) returning 1.61% versus the composite index’s international equity allocation component, the MSCI EAFE Index (Net), which returned -0.81%. The fund’s two fixed-income holdings both contributed positively to total return, with the Schwab Total Bond Market FundTM and the Schwab Intermediate-Term Bond FundTM returning 0.29% and 0.73%, respectively. Both, however, underperformed their respective benchmarks, dampening the fund’s return relative to the fund’s composite index. As of 12/31/15: Asset Class Weightings % of Investments3 Statistics Number of Holdings Portfolio Turnover Rate 12-Month Distribution Yield 6 Fixed-Income Funds – Intermediate-Term Bond 14% 2.30%2 Equity Funds – Large-Cap Equity Funds – International Equity Funds – Global Real Estate Money Market Funds Total 80.3% 10.4% 4.5% 3.0% 1.8% 100.0% Top Holdings % of Net Assets4,5 Schwab Total Bond Market Fund Schwab Intermediate-Term Bond Fund Schwab Dividend Equity Fund Laudus International MarketMasters Fund, Select Shares Schwab Global Real Estate Fund Total 48.1% 32.1% 10.4% 4.5% 3.0% 98.1% Management views and portfolio holdings may have changed since the report date. The Laudus MarketMasters Funds are part of Schwab Capital Trust and distributed by Charles Schwab & Co., Inc. 1 The fund’s actual annual payout could be higher or lower than the targeted annual payout based on the interest rate environment and other market factors occurring during that year.
The fund’s anticipated annual payout during a low interest rate environment is anticipated to be 1% to 5%, and, during a high interest rate environment, is anticipated to be 5% to 8%. For more information about payouts, please see the fund’s prospectus. 2 Calculation reflects the fund’s monthly ordinary income distributions for the last 12 months divided by the fund’s Net Asset Value as of the end of the reporting period. Distribution yield does not include capital gains distributions.
Fund expenses may have been partially absorbed by the investment adviser and its affiliates. Without these reductions, the total return/yield may have been lower. 3 The fund intends to invest in a combination of the underlying funds; however, the fund may also invest directly in equity and fixed income securities, exchange-traded funds, and cash equivalents, including money market securities. 4 This list is not a recommendation of any security by the investment adviser. 5 The holdings listed exclude any temporary liquidity investments. 10 Schwab Monthly Income Funds . Schwab Monthly Income Fund – Maximum Payout Performance and Fund Facts as of 12/31/15 The performance data quoted represents past performance. Past performance does not guarantee future results. Investment returns and principal value will fluctuate so that an investor’s shares may be worth more or less than their original cost. Current performance may be lower or higher than performance data quoted. To obtain performance information current to the most recent month end, please visit www.csimfunds.com/schwabfunds_prospectus. March 28, 2008 – December 31, 2015 Performance of Hypothetical $10,000 Investment1 $20K $15K Fund $13,019 Maximum Payout Composite Index $14,292 S&P 500 Index $18,258 Barclays U.S.
Aggregate Bond Index $13,704 $10K $5K $0K 3/28/08 12/08 12/09 12/10 12/11 12/12 12/13 12/14 12/31/15 Average Annual Total Returns1,2 Fund and Inception Date 1 Year 5 Years Since Inception Fund: Schwab Monthly Income Fund – Maximum Payout (3/28/08) Maximum Payout Composite Index S&P 500 Index Barclays U.S. Aggregate Bond Index Fund Category: Morningstar Intermediate-Term Bond 0.22% 0.87% 1.38% 0.55% -0.26% 3.24% 4.29% 12.57% 3.25% 3.22% 3.45% 4.71% 8.06% 4.14% 4.20% Fund Expense Ratios3: Net 0.47%; Gross 0.69% All total returns on this page assume dividends and distributions were reinvested. Index figures do not include trading and management costs, which would lower performance.
Indices are unmanaged and cannot be invested in directly. Performance results less than one year are not annualized. For index definitions, please see the Glossary. 1 The fund’s routine expenses have been absorbed by CSIM and its affiliates. Without these reductions, the fund’s returns would have been lower.
These returns do not reflect the deduction of taxes that a shareholder would pay on fund distributions or the redemption of fund shares. 2 Source for category information: Morningstar, Inc. The Morningstar Category return represents all active and index mutual funds within the category as of the report date. 3 As stated in the prospectus. Includes expenses of the underlying funds in which the fund invests.
The annualized weighted average expense ratio of the underlying funds was 0.47%. Net Expense: Expenses reduced by a contractual fee waiver for so long as CSIM serves as the adviser to the fund. Gross Expense: Does not reflect the effect of contractual fee waivers.
For actual ratios during the period, refer to the financial highlights section in the financial statements. Schwab Monthly Income Funds 11 . Fund Expenses (Unaudited) Examples for a $1,000 Investment As a fund shareholder, you may incur two types of costs: (1) transaction costs, such as redemption fees; and (2) ongoing costs, including management fees, transfer agent and shareholder services fees, and other fund expenses. The expense examples below are intended to help you understand your ongoing cost (in dollars) of investing in a fund and to compare this cost with the ongoing cost of investing in other mutual funds. These examples are based on an investment of $1,000 invested for six months beginning July 1, 2015 and held through December 31, 2015. Actual Return lines in the table below provide information about actual account values and actual expenses. You may use this information, together with the amount you invested, to estimate the expenses that you paid over the period. To do so, simply divide your account value by $1,000 (for example, an $8,600 account value ÷ $1,000 = 8.6), then multiply the result by the number given for your fund under the heading entitled “Expenses Paid During Period.” Hypothetical Return lines in the table below provide information about hypothetical account values and hypothetical expenses based on a fund’s actual expense ratio and an assumed return of 5% per year before expenses.
Because the return used is not an actual return, it may not be used to estimate the actual ending account value or expenses you paid for the period. You may use this information to compare the ongoing costs of investing in a fund and other funds. To do so, compare this 5% hypothetical example with the 5% hypothetical examples that appear in the shareholder reports of the other funds. Please note that the expenses shown in the table are meant to highlight your ongoing costs only, and do not reflect any transactional costs, such as redemption fees. Therefore, the hypothetical return lines of the table are useful in comparing ongoing costs only, and will not help you determine the relative total costs of owning different funds.
In addition, if these transactional costs were included, your costs would have been higher. Expense Ratio1 (Annualized) Beginning Account Value at 7/1/15 Ending Account Value (Net of Expenses) at 12/31/15 Expenses Paid During Period2 7/1/15–12/31/15 Schwab Monthly Income Fund–Moderate Payout Actual Return Hypothetical 5% Return 0.00% 0.00% $1,000.00 $1,000.00 $ 987.90 $1,025.21 $0.00 $0.00 Schwab Monthly Income Fund–Enhanced Payout Actual Return Hypothetical 5% Return 0.00% 0.00% $1,000.00 $1,000.00 $ 992.80 $1,025.21 $0.00 $0.00 Schwab Monthly Income Fund–Maximum Payout Actual Return Hypothetical 5% Return 0.00% 0.00% $1,000.00 $1,000.00 $ 996.50 $1,025.21 $0.00 $0.00 1 2 Based on the most recent six-month expense ratio; may differ from the expense ratio provided in the Financial Highlights which covers a 12-month period. The expenses incurred by the underlying funds in which the funds invest are not included in this ratio. Expenses for each fund are equal to its annualized expense ratio, multiplied by the average account value over the period, multiplied by the 184 days of the period, and divided by the 365 days of the fiscal year. 12 Schwab Monthly Income Funds . Schwab Monthly Income Fund - Moderate Payout Financial Statements Financial Highlights 1/1/15– 12/31/15 1/1/14– 12/31/14 1/1/13– 12/31/13 1/1/12– 12/31/12 1/1/11– 12/31/11 $11.21 $11.14 $10.52 $9.92 $9.87 0.221 (0.24) 0.23 0.44 0.21 0.74 0.24 0.63 0.23 0.06 (0.02) 0.67 0.95 0.87 0.29 (0.28) (0.45) (0.31) (0.29) (0.21) (0.12) (0.27) — (0.24) — Per-Share Data Net asset value at beginning of period Income (loss) from investment operations: Net investment income (loss) Net realized and unrealized gains (losses) Total from investment operations Less distributions: Distributions from net investment income Distributions from net realized gains Total distributions Net asset value at end of period Total return (0.73) $10.46 (0.60) $11.21 (0.33) $11.14 (0.27) $10.52 (0.24) $9.92 (0.24%) 6.09% 9.10% 8.86% 2.97% 0.00%3,4 0.23% 1.98% 14% $48 — 0.25% 2.00% 16% $49 — 0.30% 2.02% 39% $47 — 0.44% 2.38% 10% $31 0.00%3 0.46% 2.30% 25% $22 Ratios/Supplemental Data Ratios to average net assets: Net operating expenses2 Gross operating expenses2 Net investment income (loss) Portfolio turnover rate Net assets, end of period (x 1,000,000) 1 2 3 4 Calculated based on the average shares outstanding during the period. The expenses incurred by underlying funds in which the fund invests are not included in this ratio. Less than 0.005%. The ratio of net operating expenses would have been 0.00%, if certain non-routine expenses had not been incurred. See financial notes 13 . Schwab Monthly Income Fund - Moderate Payout Portfolio Holdings as of December 31, 2015 This section shows all the securities in the fund’s portfolio and their values as of the report date. The fund files its complete schedule of portfolio holdings with the SEC for the first and third quarters of each fiscal year on Form N-Q. The fund’s Form N-Q is available on the SEC’s website at www.sec.gov and may be viewed and copied at the SEC’s Public Reference Room in Washington, D.C. Call 1-800-SEC-0330 for information on the operation of the Public Reference Room. The fund also makes available its complete schedule of portfolio holdings 15 to 20 days after calendar quarters on the fund’s website at www.csimfunds.com/schwabfunds_prospectus. Cost ($) Holdings by Category 100.0% Other Investment Companies Value ($) 48,146,563 48,024,330 100.0% Total Investments 0.0% Other Assets and Liabilities, Net 48,146,563 48,024,330 2,897 100.0% Net Assets Number of Shares Security Large-Cap 28.2% Schwab Dividend Equity Fund (a) Value ($) 945,939 13,574,225 22,879,250 Fixed-Income Funds 50.4% Intermediate-Term Bond 50.4% Schwab Intermediate-Term Bond Fund (a) Schwab Total Bond Market Fund (a) 958,264 9,678,465 1,546,893 14,525,325 24,203,790 Money Market Fund 2.0% State Street Institutional U.S.
Government Money Market Fund, Premier Class 0.02% (b) 941,290 941,290 Total Other Investment Companies (Cost $48,146,563) 48,024,330 48,027,227 Number of Shares Security Value ($) Other Investment Companies 100.0% of net assets Equity Funds 47.6% Global Real Estate 7.5% Schwab Global Real Estate Fund (a) International 11.9% Laudus International MarketMasters Fund, Select Shares (a) 509,074 3,599,152 271,967 End of Investments. At 12/31/15, the tax basis cost of the fund’s investments was $48,591,543 and the unrealized appreciation and depreciation were $706,128 and ($1,273,341), respectively, with a net unrealized depreciation of ($567,213). (a) Issuer is affiliated with the fund’s investment adviser. (b) The rate shown is the 7-day yield. 5,705,873 The following is a summary of the inputs used to value the fund’s investments as of December 31, 2015 (see financial note 2(a) for additional information): Quoted Prices in Active Markets for Identical Assets (Level 1) Description Other Investment Companies 1 Total 1 Other Significant Observable Inputs (Level 2) Significant Unobservable Inputs (Level 3) Total $48,024,330 $— $— $48,024,330 $48,024,330 $— $— $48,024,330 As categorized in Portfolio Holdings. The fund’s policy is to recognize transfers between Level 1, Level 2 and Level 3 as of the beginning of the fiscal year. There were no transfers between Level 1, Level 2 and Level 3 for the period ended December 31, 2015. 14 See financial notes . Schwab Monthly Income Fund - Moderate Payout Statement of Assets and Liabilities As of December 31, 2015 Assets Investments in affiliated underlying funds, at value (cost $47,205,273) Investments in unaffiliated issuers, at value (cost $941,290) Total investments, at value (cost $48,146,563) Receivables: Fund shares sold Dividends Due from investment adviser Interest Prepaid expenses + $47,083,040 941,290 48,024,330 + Total assets 127,386 42,178 2,001 43 2,702 48,198,640 Liabilities Payables: Investments bought Fund shares redeemed Accrued expenses + Total liabilities 46,187 91,851 33,375 171,413 Net Assets Total assets Total liabilities – Net assets 48,198,640 171,413 $48,027,227 Net Assets by Source Capital received from investors Net investment income not yet distributed Net realized capital gains Net unrealized capital depreciation 47,022,574 2,446 1,124,440 (122,233) Net Asset Value (NAV) Net Assets $48,027,227 ÷ Shares Outstanding 4,590,477 = NAV $10.46 See financial notes 15 . Schwab Monthly Income Fund - Moderate Payout Statement of Operations For the period January 1, 2015 through December 31, 2015 Investment Income Dividends received from affiliated underlying funds Interest + Total investment income $994,569 42 994,611 Expenses Professional fees Transfer agent fees Shareholder reports Registration fees Portfolio accounting fees Independent trustees’ fees Proxy fees Custodian fees Other expenses + 32,139 22,810 19,161 14,974 12,846 7,070 1,865 1,572 1,604 Total expenses Expense reduction by CSIM – 114,041 112,176 Net expenses – Net investment income 1,865 992,746 Realized and Unrealized Gains (Losses) Realized capital gain distributions received from affiliated underlying funds Net realized gains on sales of affiliated underlying funds Net realized gains on unaffiliated issuers 1,800,288 445,483 + 117 Net realized gains Net change in unrealized appreciation (depreciation) on affiliated underlying funds 2,245,888 + (3,374,148) Net realized and unrealized losses (1,128,260) Decrease in net assets resulting from operations ($135,514) 16 See financial notes . Schwab Monthly Income Fund - Moderate Payout Statement of Changes in Net Assets For the current and prior report periods Operations 1/1/15-12/31/15 Net investment income Net realized gains Net change in unrealized appreciation (depreciation) $992,746 2,245,888 (3,374,148) + Increase (decrease) in net assets from operations (135,514) 1/1/14-12/31/14 $966,013 2,288,004 (455,302) 2,798,715 Distributions to Shareholders Distributions from net investment income Distributions from net realized gains (1,248,331) (1,982,552) (1,307,174) (1,249,978) ($3,230,883) ($2,557,152) + Total distributions Transactions in Fund Shares 1/1/15-12/31/15 SHARES Shares sold Shares reinvested Shares redeemed 1,279,695 208,157 + (1,244,496) Net transactions in fund shares 243,356 1/1/14-12/31/14 VALUE $14,409,270 2,219,724 (13,957,122) $2,671,872 SHARES 1,143,611 155,071 (1,165,942) 132,740 VALUE $13,072,822 1,750,261 (13,293,779) $1,529,304 Shares Outstanding and Net Assets 1/1/15-12/31/15 SHARES Beginning of period Total increase or decrease End of period Net investment income not yet distributed + NET ASSETS 1/1/14-12/31/14 SHARES NET ASSETS 4,347,121 243,356 $48,721,752 (694,525) 4,214,381 132,740 $46,950,885 1,770,867 4,590,477 $48,027,227 4,347,121 $48,721,752 $2,446 $1,084 See financial notes 17 . Schwab Monthly Income Fund - Enhanced Payout Financial Statements Financial Highlights 1/1/15– 12/31/15 1/1/14– 12/31/14 1/1/13– 12/31/13 1/1/12– 12/31/12 1/1/11– 12/31/11 $11.18 $10.84 $10.50 $10.09 $9.89 0.23 0.39 0.21 0.34 0.22 0.45 0.24 0.22 0.62 0.55 0.67 0.46 Per-Share Data Net asset value at beginning of period Income (loss) from investment operations: Net investment income (loss) Net realized and unrealized gains (losses) Total from investment operations Less distributions: Distributions from net investment income Net asset value at end of period Total return 0.221 (0.22) — (0.26) $10.92 (0.28) $11.18 (0.21) $10.84 (0.26) $10.50 (0.26) $10.09 0.02% 5.76% 5.31% 6.70%2 4.69%2 0.00%4,5 0.13% 1.99% 11% $97 — 0.15% 2.03% 14% $98 0.00%4 0.15% 1.99% 42% $94 (0.00%)4 0.18% 2.17% 9% $85 0.00%4 0.15% 2.43% 12% $80 Ratios/Supplemental Data Ratios to average net assets: Net operating expenses3 Gross operating expenses3 Net investment income (loss) Portfolio turnover rate Net assets, end of period (x 1,000,000) 1 2 3 4 5 Calculated based on the average shares outstanding during the period. Includes proceeds from a litigation settlement related to an affiliated underlying fund. Without the litigation proceeds, performance would have been lower. The expenses incurred by underlying funds in which the fund invests are not included in this ratio. Less than 0.005%. The ratio of net operating expenses would have been 0.00%, if certain non-routine expenses had not been incurred. 18 See financial notes . Schwab Monthly Income Fund - Enhanced Payout Portfolio Holdings as of December 31, 2015 This section shows all the securities in the fund’s portfolio and their values as of the report date. The fund files its complete schedule of portfolio holdings with the SEC for the first and third quarters of each fiscal year on Form N-Q. The fund’s Form N-Q is available on the SEC’s website at www.sec.gov and may be viewed and copied at the SEC’s Public Reference Room in Washington, D.C. Call 1-800-SEC-0330 for information on the operation of the Public Reference Room. The fund also makes available its complete schedule of portfolio holdings 15 to 20 days after calendar quarters on the fund’s website at www.csimfunds.com/schwabfunds_prospectus. Cost ($) Holdings by Category 99.7% Other Investment Companies Value ($) 94,673,098 96,752,379 99.7% Total Investments 0.3% Other Assets and Liabilities, Net 94,673,098 96,752,379 325,760 100.0% Net Assets Security Number of Shares Value ($) Large-Cap 19.3% Schwab Dividend Equity Fund (a) 1,301,005 18,669,416 31,618,600 Fixed-Income Funds 65.2% Intermediate-Term Bond 65.2% Schwab Intermediate-Term Bond Fund (a) Schwab Total Bond Market Fund (a) 2,503,887 25,289,254 4,042,047 37,954,823 63,244,077 Money Market Fund 1.9% State Street Institutional U.S.
Government Money Market Fund, Premier Class 0.02% (b) 1,889,702 1,889,702 Total Other Investment Companies (Cost $94,673,098) 96,752,379 97,078,139 Number of Shares Security Value ($) Other Investment Companies 99.7% of net assets Equity Funds 32.6% Global Real Estate 5.2% Schwab Global Real Estate Fund (a) International 8.1% Laudus International MarketMasters Fund, Select Shares (a) 717,615 5,073,540 375,388 End of Investments. At 12/31/15, the tax basis cost of the fund’s investments was $95,052,679 and the unrealized appreciation and depreciation were $2,129,538 and ($429,838), respectively, with a net unrealized appreciation of $1,699,700. (a) Issuer is affiliated with the fund’s investment adviser. (b) The rate shown is the 7-day yield. 7,875,644 The following is a summary of the inputs used to value the fund’s investments as of December 31, 2015 (see financial note 2(a) for additional information): Quoted Prices in Active Markets for Identical Assets (Level 1) Description Other Investment Companies 1 Total 1 Other Significant Observable Inputs (Level 2) Significant Unobservable Inputs (Level 3) Total $96,752,379 $— $— $96,752,379 $96,752,379 $— $— $96,752,379 As categorized in Portfolio Holdings. The fund’s policy is to recognize transfers between Level 1, Level 2 and Level 3 as of the beginning of the fiscal year. There were no transfers between Level 1, Level 2 and Level 3 for the period ended December 31, 2015. See financial notes 19 . Schwab Monthly Income Fund - Enhanced Payout Statement of Assets and Liabilities As of December 31, 2015 Assets Investments in affiliated underlying funds, at value (cost $92,783,396) Investments in unaffiliated issuers, at value (cost $1,889,702) Total investments, at value (cost $94,673,098) Receivables: Fund shares sold Dividends Due from investment adviser Interest Prepaid expenses + $94,862,677 1,889,702 96,752,379 + Total assets 437,274 109,871 2,143 94 3,216 97,304,977 Liabilities Payables: Investments bought Fund shares redeemed Accrued expenses + Total liabilities 120,349 68,115 38,374 226,838 Net Assets Total assets Total liabilities – Net assets $97,078,139 Net Assets by Source Capital received from investors Net investment income not yet distributed Net realized capital gains Net unrealized capital appreciation 93,352,825 2,156 1,643,877 2,079,281 Net Asset Value (NAV) Net Assets $97,078,139 20 97,304,977 226,838 ÷ See financial notes Shares Outstanding 8,893,818 = NAV $10.92 . Schwab Monthly Income Fund - Enhanced Payout Statement of Operations For the period January 1, 2015 through December 31, 2015 Investment Income Dividends received from affiliated underlying funds Interest + Total investment income $1,979,320 94 1,979,414 Expenses Professional fees Shareholder reports Transfer agent fees Registration fees Portfolio accounting fees Independent trustees’ fees Proxy fees Custodian fees Other expenses + 35,536 25,525 23,193 16,024 13,692 7,303 2,689 1,281 2,383 Total expenses Expense reduction by CSIM – 127,626 124,937 Net expenses – Net investment income 2,689 1,976,725 Realized and Unrealized Gains (Losses) Realized capital gain distributions received from affiliated underlying funds Net realized gains on sales of affiliated underlying funds Net realized gains on unaffiliated issuers + Net realized gains Net change in unrealized appreciation (depreciation) on affiliated underlying funds 3,360,525 + (5,376,084) Net realized and unrealized losses Decrease in net assets resulting from operations 2,515,924 844,412 189 (2,015,559) ($38,834) See financial notes 21 . Schwab Monthly Income Fund - Enhanced Payout Statement of Changes in Net Assets For the current and prior report periods Operations 1/1/15-12/31/15 Net investment income Net realized gains Net change in unrealized appreciation (depreciation) 1/1/14-12/31/14 $1,976,725 3,360,525 (5,376,084) (38,834) + Increase (decrease) in net assets from operations $1,952,225 3,249,283 104,844 5,306,352 Distributions to Shareholders Distributions from net investment income ($2,335,165) ($2,425,908) Transactions in Fund Shares 1/1/15-12/31/15 SHARES Shares sold Shares reinvested Shares redeemed Net transactions in fund shares 1,768,913 131,261 + (1,736,547) 163,627 1/1/14-12/31/14 VALUE $19,823,256 1,457,760 (19,400,268) $1,880,748 SHARES 2,138,964 135,844 (2,189,460) 85,348 VALUE $23,718,230 1,508,717 (24,260,384) $966,563 Shares Outstanding and Net Assets 1/1/15-12/31/15 SHARES Beginning of period Total increase or decrease End of period Net investment income not yet distributed 22 See financial notes 8,730,191 + 163,627 8,893,818 NET ASSETS 1/1/14-12/31/14 SHARES NET ASSETS $97,571,390 (493,251) 8,644,843 85,348 $93,724,383 3,847,007 $97,078,139 8,730,191 $97,571,390 $2,156 $3,463 . Schwab Monthly Income Fund - Maximum Payout Financial Statements Financial Highlights 1/1/15– 12/31/15 1/1/14– 12/31/14 1/1/13– 12/31/13 1/1/12– 12/31/12 1/1/11– 12/31/11 $10.37 $10.22 $10.29 $10.09 $9.90 Per-Share Data Net asset value at beginning of period Income (loss) from investment operations: Net investment income (loss) Net realized and unrealized gains (losses) Total from investment operations Less distributions: Distributions from net investment income Distributions from net realized gains Total distributions Net asset value at end of period Total return 0.211 (0.18) 0.21 0.33 0.20 (0.03) 0.20 0.24 0.25 0.21 0.03 0.54 0.17 0.44 0.46 (0.23) (0.22) (0.25) (0.14) (0.20) (0.04) (0.24) — (0.27) — (0.45) $9.95 (0.39) $10.37 (0.24) $10.22 (0.24) $10.29 (0.27) $10.09 0.22% 5.29% 1.66% 4.43% 4.70% 0.00%3,4 0.23% 2.01% 14% $50 — 0.22% 2.05% 16% $52 — 0.21% 1.96% 46% $55 0.00%4 0.19% 1.99% 19% $73 0.00%4 0.17% 2.53% 10% $78 Ratios/Supplemental Data Ratios to average net assets: Net operating expenses2 Gross operating expenses2 Net investment income (loss) Portfolio turnover rate Net assets, end of period (x 1,000,000) 1 2 3 4 Calculated based on the average shares outstanding during the period. The expenses incurred by underlying funds in which the fund invests are not included in this ratio. The ratio of net operating expenses would have been 0.00%, if certain non-routine expenses had not been incurred. Less than 0.005%. See financial notes 23 . Schwab Monthly Income Fund - Maximum Payout Portfolio Holdings as of December 31, 2015 This section shows all the securities in the fund’s portfolio and their values as of the report date. The fund files its complete schedule of portfolio holdings with the SEC for the first and third quarters of each fiscal year on Form N-Q. The fund’s Form N-Q is available on the SEC’s website at www.sec.gov and may be viewed and copied at the SEC’s Public Reference Room in Washington, D.C. Call 1-800-SEC-0330 for information on the operation of the Public Reference Room. The fund also makes available its complete schedule of portfolio holdings 15 to 20 days after calendar quarters on the fund’s website at www.csimfunds.com/schwabfunds_prospectus. Cost ($) Holdings by Category 99.9% Other Investment Companies Value ($) 49,307,339 50,239,088 99.9% Total Investments 0.1% Other Assets and Liabilities, Net 49,307,339 50,239,088 57,845 100.0% Net Assets Number of Shares Large-Cap 10.4% Schwab Dividend Equity Fund (a) Value ($) 365,623 Security 5,246,685 9,002,031 Fixed-Income Funds 80.2% Intermediate-Term Bond 80.2% Schwab Intermediate-Term Bond Fund (a) Schwab Total Bond Market Fund (a) 1,595,729 16,116,866 2,578,670 24,213,707 40,330,573 Money Market Fund 1.8% State Street Institutional U.S.
Government Money Market Fund, Premier Class 0.02% (b) 906,484 Total Other Investment Companies (Cost $49,307,339) 906,484 50,239,088 50,296,933 Number of Shares Security Value ($) Other Investment Companies 99.9% of net assets Equity Funds 17.9% Global Real Estate 3.0% Schwab Global Real Estate Fund (a) International 4.5% Laudus International MarketMasters Fund, Select Shares (a) 214,934 1,519,583 106,566 End of Investments. At 12/31/15, the tax basis cost of the fund’s investments was $49,549,096 and the unrealized appreciation and depreciation were $779,090 and ($89,098), respectively, with a net unrealized appreciation of $689,992. (a) Issuer is affiliated with the fund’s adviser. (b) The rate shown is the 7-day yield. 2,235,763 The following is a summary of the inputs used to value the fund’s investments as of December 31, 2015 (see financial note 2(a) for additional information): Quoted Prices in Active Markets for Identical Assets (Level 1) Description Other Investment Companies 1 Total 1 Other Significant Observable Inputs (Level 2) Significant Unobservable Inputs (Level 3) Total $50,239,088 $— $— $50,239,088 $50,239,088 $— $— $50,239,088 As categorized in Portfolio Holdings. The fund’s policy is to recognize transfers between Level 1, Level 2 and Level 3 as of the beginning of the fiscal year. There were no transfers between Level 1, Level 2 and Level 3 for the period ended December 31, 2015. 24 See financial notes . Schwab Monthly Income Fund - Maximum Payout Statement of Assets and Liabilities As of December 31, 2015 Assets Investments in affiliated underlying funds, at value (cost $48,400,855) Investments in unaffiliated issuers, at value (cost $906,484) Total investments, at value (cost $49,307,339) Receivables: Investments sold Fund shares sold Dividends Due from investment adviser Interest Prepaid expenses + $49,332,604 906,484 50,239,088 + Total assets 300,000 123,299 71,678 2,037 45 2,426 50,738,573 Liabilities Payables: Investments bought Fund shares redeemed Accrued expenses + Total liabilities 78,403 329,166 34,071 441,640 Net Assets Total assets Total liabilities – Net assets 50,738,573 441,640 $50,296,933 Net Assets by Source Capital received from investors Net investment income not yet distributed Net realized capital gains Net unrealized capital appreciation 48,902,156 2,321 460,707 931,749 Net Asset Value (NAV) Net Assets $50,296,933 ÷ Shares Outstanding 5,055,141 = NAV $9.95 See financial notes 25 . Schwab Monthly Income Fund - Maximum Payout Statement of Operations For the period January 1, 2015 through December 31, 2015 Investment Income Dividends received from affiliated underlying funds Interest + Total investment income $1,037,241 45 1,037,286 Expenses Professional fees Transfer agent fees Shareholder reports Registration fees Portfolio accounting fees Independent trustees’ fees Proxy fees Custodian fees Other expenses + 32,207 22,680 19,687 16,861 12,858 7,079 1,899 1,330 1,649 Total expenses Expense reduction by CSIM – 116,250 114,351 Net expenses – Net investment income 1,899 1,035,387 Realized and Unrealized Gains (Losses) Realized capital gain distributions received from affiliated underlying funds Net realized gains on sales of affiliated underlying funds + 749,643 435,310 Net realized gains Net change in unrealized appreciation (depreciation) on affiliated underlying funds 1,184,953 + (2,121,970) Net realized and unrealized losses (937,017) Increase in net assets resulting from operations $98,370 26 See financial notes . Schwab Monthly Income Fund - Maximum Payout Statement of Changes in Net Assets For the current and prior report periods Operations 1/1/15-12/31/15 Net investment income Net realized gains Net change in unrealized appreciation (depreciation) $1,035,387 1,184,953 (2,121,970) + Increase in net assets from operations 98,370 1/1/14-12/31/14 $1,118,743 1,285,652 390,696 2,795,091 Distributions to Shareholders Distributions from net investment income Distributions from net realized gains (1,139,558) (1,085,188) (1,274,514) (708,892) ($2,224,746) ($1,983,406) + Total distributions Transactions in Fund Shares 1/1/15-12/31/15 SHARES Shares sold Shares reinvested Shares redeemed Net transactions in fund shares 1,550,576 126,930 + (1,643,150) 34,356 1/1/14-12/31/14 VALUE $16,093,220 1,282,147 (17,038,751) $336,616 SHARES VALUE 1,825,867 104,899 (2,258,130) $19,069,126 1,091,170 (23,537,414) (327,364) ($3,377,118) Shares Outstanding and Net Assets 1/1/15-12/31/15 SHARES Beginning of period Total increase or decrease End of period Net investment income not yet distributed 5,020,785 + 34,356 5,055,141 NET ASSETS 1/1/14-12/31/14 SHARES NET ASSETS $52,086,693 (1,789,760) 5,348,149 (327,364) $54,652,126 (2,565,433) $50,296,933 5,020,785 $52,086,693 $2,321 $2,181 See financial notes 27 . Schwab Monthly Income Funds Financial Notes 1. Business Structure of the Funds: Each of the funds in this report is a series of Schwab Capital Trust (the trust), a no-load, open-end management investment company. The trust is organized as a Massachusetts business trust and is registered under the Investment Company Act of 1940, as amended (the 1940 Act). The list below shows all the funds in the trust as of the end of the period, including the funds discussed in this report, which are highlighted: Schwab Capital Trust (organized May 7, 1993) Schwab Monthly Income Fund-Moderate Payout Schwab Monthly Income Fund-Enhanced Payout Schwab Monthly Income Fund-Maximum Payout Schwab Target 2010 Fund Schwab Target 2015 Fund Schwab Target 2020 Fund Schwab Target 2025 Fund Schwab Target 2030 Fund Schwab Target 2035 Fund Schwab Target 2040 Fund Schwab Target 2045 Fund Schwab Target 2050 Fund Schwab Target 2055 Fund Schwab® S&P 500 Index Fund Schwab Small-Cap Index Fund® Schwab Total Stock Market Index Fund® Schwab International Index Fund® Schwab MarketTrack All Equity Portfolio™ Schwab MarketTrack Growth Portfolio™ Schwab MarketTrack Balanced Portfolio™ Schwab MarketTrack Conservative Portfolio™ Laudus Small-Cap MarketMasters Fund™ Laudus International MarketMasters Fund™ Schwab Balanced Fund™ Schwab Core Equity Fund™ Schwab Dividend Equity Fund™ Schwab Large-Cap Growth Fund™ Schwab Small-Cap Equity Fund™ Schwab Hedged Equity Fund™ Schwab Financial Services Fund™ Schwab Health Care Fund™ Schwab® International Core Equity Fund Schwab Fundamental US Large Company Index Fund Schwab Fundamental US Small Company Index Fund Schwab Fundamental International Large Company Index Fund Schwab Fundamental International Small Company Index Fund Schwab Fundamental Emerging Markets Large Company Index Fund Schwab Fundamental Global Real Estate Index Fund The Schwab Monthly Income Funds are “fund of funds.” Each of the funds seeks to achieve its investment objective by investing in a combination of other Schwab and/or Laudus Funds and other unaffiliated, third-party mutual funds, in accordance with its target portfolio allocation.
Each fund may also invest directly in equity and fixed income securities, cash and cash equivalents, including money market securities and exchange-traded funds (ETFs). Each fund in this report offers one share class. Shares are bought and sold at closing net asset value per share (NAV), which is the price for all outstanding shares of a fund. Each share has a par value of 1/1,000 of a cent, and the funds’ Board of Trustees (the Board) may authorize the issuance of as many shares as necessary. Each fund maintains its own account for purposes of holding assets and accounting, and is considered a separate entity for tax purposes.
Within its account, each fund may also keep certain assets in segregated accounts, as required by securities law. 2. Significant Accounting Policies: The following is a summary of the significant accounting policies the funds use in their preparation of financial statements. The funds follow the investment company accounting and reporting guidance of the Financial Accounting Standards Board Accounting Standard Codification Topic 946 Financial Services — Investment Companies. The accounting policies are in conformity with accounting principles generally accepted in the United States of America (GAAP). The financial statements of the funds should be read in conjunction with the underlying funds’ financial statements.
For more information about the underlying funds’ operations and policies, please refer to those funds’ semiannual and annual reports, which are filed and available on the U.S. Securities and Exchange Commission’s (SEC) website at www.sec.gov or at the SEC’s Public Reference Room in Washington D.C. (a) Security Valuation: Under procedures approved by the Board, the investment adviser has formed a Pricing Committee to administer the pricing and valuation of portfolio securities and other assets and to ensure that prices used for internal purposes or provided by third parties reasonably reflect fair market value. Among other things, these procedures allow the funds to utilize independent pricing services, quotations from securities and financial instrument dealers and other market sources to determine fair value. 28 .
Schwab Monthly Income Funds Financial Notes (continued) 2. Significant Accounting Policies (continued): The funds value the securities in their portfolios every business day. The funds use the following policies to value various types of securities: • Underlying funds: Mutual funds are valued at their respective NAVs. • Securities for which no quoted value is available: The Board has adopted procedures to fair value each fund’s securities when market prices are not “readily available” or are unreliable. For example, a fund may fair value a security when it is de-listed or its trading is halted or suspended; when a security’s primary pricing source is unable or unwilling to provide a price; or when a security’s primary trading market is closed during regular market hours.
Each fund makes fair value determinations in good faith in accordance with the fund’s valuation procedures. The Pricing Committee considers a number of factors, including unobservable market inputs when arriving at fair value. The Pricing Committee may employ techniques such as the review of related or comparable assets or liabilities, related market activities, recent transactions, market multiples, book values, transactional back-testing, disposition analysis and other relevant information.
The Pricing Committee regularly reviews these inputs and assumptions to calibrate the valuations. Due to the subjective and variable nature of fair value pricing, there can be no assurance that a fund could obtain the fair value assigned to the security upon the sale of such security. The Board convenes on a regular basis to review fair value determinations made by the funds pursuant to the valuation procedures. • Short-term securities (60 days or less to maturity): A short-term security may be valued at its amortized cost when it approximates the security’s market value. In accordance with the authoritative guidance on fair value measurements and disclosures under GAAP, the funds disclose the fair value of their investments in a hierarchy that prioritizes the significant inputs to valuation techniques used to measure the fair value.
The hierarchy gives the highest priority to valuations based upon unadjusted quoted prices in active markets for identical assets or liabilities (Level 1 measurements) and the lowest priority to valuations based upon unobservable inputs that are significant to the valuation (Level 3 measurements). If inputs used to measure the financial instruments fall within different levels of the hierarchy, the categorization is based on the lowest level input that is significant to the valuation. If the funds determine that either the volume and/or level of activity for an asset or liability has significantly decreased (from normal conditions for that asset or liability) or price quotations or observable inputs are not associated with orderly transactions, increased analysis and management judgment will be required to estimate fair value. The three levels of the fair value hierarchy are as follows: • Level 1 — quoted prices in active markets for identical securities — Investments whose values are based on quoted market prices in active markets, and whose values are therefore classified as Level 1 prices, include active listed equities. Investments in mutual funds are valued daily at their NAVs, which are classified as Level 1 prices, without consideration to the classification level of the specific investments held by an underlying fund. • Level 2 — other significant observable inputs (including quoted prices for similar securities, interest rates, prepayment speeds, credit risk, etc.) — Investments that trade in markets that are not considered to be active, but whose values are based on quoted market prices, dealer quotations or valuations provided by alternative pricing sources supported by observable inputs are classified as Level 2 prices.
These generally include U.S. government and sovereign obligations, most government agency securities, investment-grade corporate bonds, certain mortgage products, less liquid listed equities, and state, municipal and provincial obligations. • Level 3 — significant unobservable inputs (including the funds’ own assumptions in determining the fair value of investments) — Investments whose values are classified as Level 3 prices have significant unobservable inputs, as they may trade infrequently or not at all. When observable prices are not available for these securities, the funds use one or more valuation techniques for which sufficient and reliable data is available.
The inputs used by the funds in estimating the value of Level 3 prices may include the original transaction price, quoted prices for similar securities or assets in active markets, completed or pending third-party transactions in the underlying investment or comparable issuers, and changes in financial ratios or cash flows. Level 3 prices may also be adjusted to reflect illiquidity and/or non-transferability, with the amount of such discount estimated by the funds in the absence of market information. Assumptions used by the funds due to the lack of observable inputs may significantly impact the resulting fair value and therefore the funds’ results of operations. 29 . Schwab Monthly Income Funds Financial Notes (continued) 2. Significant Accounting Policies (continued): The inputs or methodology used for valuing securities are not necessarily an indication of the risk associated with investing in those securities. The levels associated with valuing the funds’ investments as of December 31, 2015 are disclosed in the Portfolio Holdings. (b) Security Transactions: Security transactions are recorded as of the date the order to buy or sell the security is executed. Realized gains and losses from security transactions are based on the identified costs of the securities involved. (c) Investment Income: Interest income is recorded as it accrues. Dividends and distributions from portfolio securities and underlying funds are recorded on the date they are effective (the ex-dividend date), although the funds record certain foreign security dividends on the day they learn of the ex-dividend date.
Any distributions from underlying funds are recorded in accordance with the character of the distributions as designated by the underlying funds. (d) Expenses: Expenses that are specific to a fund are charged directly to the fund. Expenses that are common to all funds within the trust generally are allocated among the funds in proportion to their average daily net assets. Each fund bears its share of the allocable expenses of the underlying funds in which it invests.
Such expenses are reflected in the net asset values of the underlying funds. (e) Distributions to Shareholders: The funds make distributions from net investment income monthly and from net realized capital gains, if any, once a year. (f) Accounting Estimates: The accounting policies described in this report conform to GAAP. Notwithstanding this, shareholders should understand that in order to follow these principles, fund management has to make estimates and assumptions that affect the information reported in the financial statements. It’s possible that once the results are known, they may turn out to be different from these estimates and these differences may be material. (g) Federal Income Taxes: The funds intend to meet federal income and excise tax requirements for regulated investment companies.
Accordingly, the funds distribute substantially all of their net investment income and net realized capital gains, if any, to their respective shareholders each year. As long as a fund meets the tax requirements, it is not required to pay federal income tax. (h) Indemnification: Under the funds’ organizational documents, the officers and trustees are indemnified against certain liabilities arising out of the performance of their duties to the funds. In addition, in the normal course of business the funds enter into contracts with their vendors and others that provide general indemnifications.
The funds’ maximum exposure under these arrangements is unknown as this would involve future claims that may be made against the funds. However, based on experience, the funds expect the risk of loss attributable to these arrangements to be remote. 3. Risk Factors: Investing in the funds may involve certain risks, as discussed in the funds’ prospectus, including, but not limited to, those described below.
Any of these risks could cause an investor to lose money. Asset Allocation Risk. The funds are subject to asset allocation risk, which is the risk that the selection of the underlying funds and the allocation of a fund’s assets among the various asset classes and market segments will cause the fund to underperform other funds with a similar investment objective. 30 . Schwab Monthly Income Funds Financial Notes (continued) 3. Risk Factors (continued): Affiliated Fund Risk. The investment adviser’s authority to select and substitute underlying funds from a variety of affiliated and unaffiliated mutual funds may create a conflict of interest because the fees paid to it by some underlying funds are higher than the fees paid by other underlying funds. However, the portfolio manager is a fiduciary to the fund and is legally obligated to act in the fund’s best interests when selecting underlying funds, without taking fees into consideration. Market Risk.
Equity and fixed income markets rise and fall daily. As with any investment whose performance is tied to these markets, the value of an investment in the fund will fluctuate, which means that an investor could lose money. Structural Risk. The funds’ monthly income payments will be made from fund assets and will reduce the amount of assets available for investment by the fund.
Even if a fund’s capital grows over time, such growth may be insufficient to enable the fund to maintain the amount of its targeted annual payout and targeted monthly income payments. A fund’s investment losses may reduce the amount of future cash income payments an investor will receive from the fund. The dollar amount of a fund’s monthly income payments could vary substantially from one year to the next and over time depending on several factors, including the performance of the financial markets in which the fund invests, the allocation of fund assets across different asset classes and investments, the performance of the fund’s investment strategies, and the amount and timing of prior distributions by the fund.
It is also possible for payments to go down substantially from one year to the next and over time depending on the timing of an investor’s investments in the fund. Any redemptions will proportionately reduce the amount of future cash income payments to be received from the fund. There is no guarantee that the fund will make monthly income payments to its shareholders or, if made, that the fund’s monthly income payments to shareholders will remain at a fixed amount. Underlying Fund Investment Risk.
The value of an investment in the funds is based primarily on the prices of the underlying funds that the funds purchase. In turn, the price of each underlying fund is based on the value of its securities. The funds are subject to the performance and expenses of the underlying funds in which they invest.
Before investing in the funds, investors should assess the risks associated with the underlying funds in which the fund may invest and the types of investments made by those underlying funds. These risks include any combination of the risks described below, although the fund’s exposure to a particular risk will be proportionate to the fund’s overall asset allocation and underlying fund allocation. • Investment Risk. The funds may experience losses with respect to their investment in an underlying fund.
Further, there is no guarantee that an underlying fund will be able to achieve its objective. • Management Risk. Generally, the underlying funds are actively managed mutual funds. An underlying fund’s adviser applies its own investment techniques and risk analyses in making investment decisions for the fund, but there can be no guarantee that they will produce the desired results or cause the underlying fund to meet its objectives. • Equity Risk.
The prices of equity securities rise and fall daily. These price movements may result from factors affecting individual companies, industries or the securities market as a whole. In addition, equity markets tend to move in cycles, which may cause stock prices to fall over short or extended periods of time. • Large-, Mid- and Small-Cap Risk.
Stocks of different market capitalizations tend to go in and out of favor based on market and economic conditions. Historically, small- and mid-cap stocks tend to be more volatile than large-cap stocks. • Fixed Income Risk. Interest rates rise and fall over time, which will affect an underlying fund’s yield and share price. Because interest rates in the United States and other countries are at, or near, historically low levels, a change in a central bank’s monetary policy or improving economic conditions may result in an increase in interest rates.
A sharp rise in interest rates could cause an underlying fund to lose value. The credit quality of a portfolio investment could also cause an underlying fund’s share price to fall. An underlying fund could lose money if the issuer or guarantor of a portfolio investment or the counterparty to a derivatives contract fails to make timely principal or interest payments or otherwise honor its obligations.
Fixed income securities may be paid off earlier or later than expected. Either situation could cause an underlying fund to hold securities paying lower-than-market rates of interest, which could hurt the fund’s yield or share price. Below investment-grade bonds (junk bonds) involve greater credit risk than investment-grade securities. • Foreign Investment Risk.
An underlying fund’s investments in securities of foreign issuers may involve certain risks that are greater than those associated with investments in securities of U.S. issuers. These include risks of adverse changes in foreign economic, political, regulatory and other conditions; changes in currency exchange rates or exchange control 31 .
Schwab Monthly Income Funds Financial Notes (continued) 3. Risk Factors (continued): regulations (including limitations on currency movements and exchanges); the imposition of economic sanctions or other government restrictions; differing accounting, auditing, financial reporting and legal standards and practices; differing securities market structures; and higher transaction costs. These risks may be heightened in connection with investments in emerging markets. • Derivatives Risk. An underlying fund’s use of derivative instruments involves risks different from, or possibly greater than, the risks associated with investing directly in securities and other traditional investments.
An underlying fund’s use of derivatives could reduce the underlying fund’s performance, increase volatility, and could cause the underlying fund to lose more than the initial amount invested. In addition, investments in derivatives may involve leverage, which means a small percentage of assets invested in derivatives can have a disproportionately large impact on an underlying fund. • Leverage Risk. Certain underlying fund transactions, such as derivatives, short sales, reverse repurchase agreements, and mortgage dollar rolls, may give rise to a form of leverage and may expose an underlying fund to greater risk.
Leverage tends to magnify the effect of any decrease or increase in the value of an underlying fund’s portfolio securities, which means even a small amount of leverage can have a disproportionately large impact on the fund. • Money Market Risk. Although an underlying money market fund seeks to maintain a stable $1 net asset value, it is possible to lose money by investing in a money market fund. • Liquidity Risk. An underlying fund may be unable to sell illiquid securities at an advantageous time or price. • ETF Risk.
When an underlying fund invests in an ETF, it will bear a proportionate share of the ETF’s expenses. In addition, lack of liquidity in the market for an ETF’s shares can result in its value being more volatile than the underlying portfolio of securities. • Securities Lending Risk. Certain underlying funds engage in securities lending, which involves the risk of loss of rights in the collateral or delay in recovery of the collateral if the borrower fails to return the security loaned or becomes insolvent. • Real Estate Investment Trust (REITs) Risk.
An underlying fund’s investments in REITs will be subject to the risks associated with the direct ownership of real estate, including fluctuations in the value of underlying properties, defaults by borrowers or tenants, access to capital, changes in interest rates and risks related to general or local economic conditions. REITs are also subject to certain additional risks, for example, REITs may have their investments in relatively few properties, a small geographic area or a single property type. In addition, REITs have their own expenses, and an underlying fund will bear a proportionate share of those expenses. • Mortgage-Backed and Mortgage Pass-Through Securities Risk.
Certain of the mortgage-backed securities in which an underlying fund may invest are not backed by the full faith and credit of the U.S. government and there can be no assurance that the U.S. government would provide financial support where it was not obligated to do so. Mortgage-backed securities tend to increase in value less than other debt securities when interest rates decline, but are subject to similar risk of decline in market value during periods of rising interest rates.
Transactions in mortgage pass-through securities primarily occur through to be announced (TBA) transactions. Default by or bankruptcy of a counterparty to a TBA transaction would expose an underlying fund to possible losses. • Portfolio Turnover Risk. Certain of the underlying funds may buy and sell portfolio securities actively.
If they do, their portfolio turnover rate and transaction costs will rise, which may lower the underlying fund’s performance and may increase the likelihood of capital gain distributions. Direct Investment Risk. The funds may invest a portion of their assets directly in equity and fixed income securities, ETFs, cash and cash equivalents, including money market securities. A fund’s direct investment in these securities is subject to the same or similar risks as an underlying fund’s investment in the same security. Please refer to the funds’ prospectus for a more complete description of the principal risks of investing in the funds. 32 .
Schwab Monthly Income Funds Financial Notes (continued) 4. Affiliates and Affiliated Transactions: Charles Schwab Investment Management, Inc. (CSIM or the investment adviser), a wholly owned subsidiary of The Charles Schwab Corporation, serves as each fund’s investment adviser and administrator pursuant to an Investment Advisory and Administration Agreement between CSIM and the trust. The Board has adopted a Shareholder Servicing Plan (the Plan) on behalf of the funds. The plan enables each fund to bear expenses relating to the provision by services providers, including Charles Schwab & Co., Inc.
(a broker-dealer affiliate of CSIM, Schwab), of certain account maintenance, customer liaison and shareholder services to the current shareholders of the funds. The funds are not subject to any fees under the Plan. CSIM and its affiliates have agreed with the funds, for so long as CSIM serves as the investment adviser to the funds, which may only be amended or terminated with approval of the Board, to limit the total annual fund operating expenses charged, excluding interest, taxes and certain non-routine expenses to 0.00%. The agreement to limit the funds’ total expenses charged is limited to each fund’s direct operating expenses and, therefore, does not apply to acquired fund fees and expenses, which are indirect expenses incurred by a fund through its investments in the underlying funds. The funds may engage in certain transactions involving related parties. Pursuant to an exemptive order issued by the SEC, the funds may invest in other related funds.
As of December 31, 2015, each Schwab Monthly Income Fund’s ownership percentages of other related funds’ shares are: Underlying Funds Schwab Monthly Income Fund Moderate Payout Schwab Global Real Estate Fund Laudus International MarketMasters Fund, Select Shares Schwab Dividend Equity Fund Schwab Intermediate-Term Bond Fund Schwab Total Bond Market Fund Schwab Monthly Income Fund Enhanced Payout Schwab Monthly Income Fund Maximum Payout 1.4% 1.9% 0.6% 0.3% 0.8% 2.8% 1.1% 0.4% 1.0% 7.4% 2.8% 0.1% 0.3% 4.7% 1.8% Below is a summary of the funds’ transactions with their affiliated underlying funds during the period ended December 31, 2015: Schwab Monthly Income Fund - Moderate Payout: Underlying Funds Schwab Global Real Estate Fund Laudus International MarketMasters Fund, Select Shares Schwab Dividend Equity Fund Schwab Intermediate-Term Bond Fund Schwab Total Bond Market Fund Total Balance of Shares Held at Gross 12/31/14 Purchases Gross Sales Balance of Shares Held at 12/31/15 Market Value at 12/31/15 Realized Distributions Gains (Losses) Received* 01/01/15 01/01/15 to 12/31/15 to 12/31/15 486,429 91,869 (69,224) 509,074 $3,599,152 $64,073 $110,013 260,785 838,758 55,708 226,719 (44,526) 271,967 (119,538) 945,939 5,705,873 13,574,225 102,674 125,851 404,098 1,744,405 967,225 1,500,179 138,701 264,149 (147,662) 958,264 (217,435) 1,546,893 9,678,465 14,525,325 63,140 89,745 209,848 326,493 $47,083,040 $445,483 $2,794,857 33 . Schwab Monthly Income Funds Financial Notes (continued) 4. Affiliates and Affiliated Transactions (continued): Schwab Monthly Income Fund - Enhanced Payout: Underlying Funds Schwab Global Real Estate Fund Laudus International MarketMasters Fund, Select Shares Schwab Dividend Equity Fund Schwab Intermediate-Term Bond Fund Schwab Total Bond Market Fund Balance of Shares Held at Gross 12/31/14 Purchases Gross Sales Balance of Shares Held at 12/31/15 Market Value at 12/31/15 Realized Distributions Gains (Losses) Received* 01/01/15 01/01/15 to 12/31/15 to 12/31/15 665,588 140,001 (87,974) 717,615 $5,073,540 $93,468 $150,353 356,639 1,165,335 84,749 325,271 (66,000) 375,388 (189,601) 1,301,005 7,875,644 18,669,416 126,420 312,956 560,006 2,404,145 2,505,461 3,920,352 249,852 463,789 (251,426) 2,503,887 (342,094) 4,042,047 25,289,254 37,954,823 124,593 186,975 540,190 840,550 $94,862,677 $844,412 $4,495,244 Total Schwab Monthly Income Fund - Maximum Payout: Underlying Funds Schwab Global Real Estate Fund Laudus International MarketMasters Fund, Select Shares Schwab Dividend Equity Fund Schwab Intermediate-Term Bond Fund Schwab Total Bond Market Fund Total Balance of Shares Held at Gross 12/31/14 Purchases Gross Sales Balance of Shares Held at 12/31/15 Market Value at 12/31/15 Realized Distributions Gains (Losses) Received* 01/01/15 01/01/15 to 12/31/15 to 12/31/15 191,157 68,103 (44,326) 214,934 $1,519,583 $66,354 $43,777 101,732 348,334 36,874 105,590 (32,040) 106,566 (88,301) 365,623 2,235,763 5,246,685 28,906 141,055 167,787 689,005 1,642,903 2,580,539 149,109 267,641 (196,283) 1,595,729 (269,510) 2,578,670 16,116,866 24,213,707 90,733 108,262 346,792 539,523 $49,332,604 $435,310 $1,786,884 * Distributions received include distributions from net investment income and capital gains, if any, from the underlying funds. Pursuant to an exemptive order issued by the SEC, the funds may enter into interfund borrowing and lending transactions with other funds in the Fund Complex (for definition refer to Trustees and Officers section). All loans are for temporary or emergency purposes and the interest rate to be charged will be the average of the overnight repurchase agreement rate and the short-term bank loan rate. All loans are subject to numerous conditions designed to ensure fair and equitable treatment of all participating funds/portfolios.
The interfund lending facility is subject to the oversight and periodic review by the Board. The funds had no interfund borrowing or lending activity during the period. 5. Board of Trustees: At a Special Meeting of Shareholders on December 11, 2015, twelve individuals were elected to serve as trustees of all trusts constituting the Schwab Funds, Laudus Funds and Schwab ETFs effective January 1, 2016.
The twelve individuals elected to the Board of Trustees consist of current Schwab Funds and Laudus Funds trustees, current Schwab ETFs trustees and three new nominees. The trustees believe that combining the composition of the Board of Trustees and adding the new nominees will further align oversight of the Schwab Funds, Laudus Funds and Schwab ETFs, among other benefits. The Board may include people who are officers and/or directors of CSIM or its affiliates. Federal securities law limits the percentage of such “interested persons” who may serve on a trust’s board, and the trust was in compliance with these limitations throughout the report period.
The trust did not pay any of these interested persons for their services as trustees, but it did pay non-interested persons (independent trustees), as noted on each fund’s Statement of Operations. For information regarding the trustees, please refer to the Trustees and Officers table at the end of this report. 34 . Schwab Monthly Income Funds Financial Notes (continued) 6. Borrowing from Banks: Prior to October 8, 2015, the funds had access to a committed line of credit of $150 million with State Street Bank and Trust Company (State Street), an uncommitted line of credit of $100 million with Bank of America, N.A., and an uncommitted line of credit of $50 million with Brown Brothers Harriman & Co. The funds paid an annual fee to State Street for the committed line of credit. Effective October 8, 2015, the previous lines of credit were terminated and the funds became participants with other U.S.
registered investment companies managed by CSIM in a joint, syndicated, committed $530 million line of credit (the Credit Facility), with State Street as agent, which matures on October 6, 2016. Under the terms of the Credit Facility, in addition to the interest charged on any borrowings by a fund, each fund pays a commitment fee of 0.125% per annum on its proportionate share of the unused portion of the Credit Facility. There were no borrowings from any of the lines of credit during the period. The funds also have access to custodian overdraft facilities.
A fund may have utilized the overdraft facility and incurred an interest expense, which is disclosed on the fund’s Statement of Operations, if any. The interest expense is determined based on a negotiated rate above the current Federal Funds Rate. 7. Purchases and Sales/Maturities of Investment Securities: For the period ended December 31, 2015, purchases and sales/maturities of securities (excluding short-term obligations) were as follows: Purchases of Securities Sales/Maturities of Securities $9,316,907 14,866,824 7,031,678 $7,060,000 11,089,000 7,066,000 Schwab Monthly Income Fund - Moderate Payout Schwab Monthly Income Fund - Enhanced Payout Schwab Monthly Income Fund - Maximum Payout 8.
Federal Income Taxes: As of December 31, 2015, the components of distributable earnings on a tax-basis were as follows: Schwab Monthly Income Fund Moderate Payout Undistributed ordinary income Undistributed long-term capital gains Unrealized appreciation on investments Unrealized depreciation on investments $21,645 1,550,221 706,128 (1,273,341) Net unrealized appreciation (depreciation) ($567,213) Schwab Monthly Income Fund Enhanced Payout $2,156 2,023,458 2,129,538 (429,838) $1,699,700 Schwab Monthly Income Fund Maximum Payout $15,412 689,373 779,090 (89,098) $689,992 The primary difference between book-basis and tax-basis unrealized appreciation or unrealized depreciation of investments is the tax deferral of losses on wash sales. Capital loss carryforwards may be used to offset future realized capital gains for federal income tax purposes. As of December 31, 2015, the funds had no capital loss carryforwards. For tax purposes, net realized capital losses and late-year ordinary losses incurred after October 31 may be deferred and treated as occurring on the first day of the following fiscal year. For the year ended December 31, 2015, the funds had no capital losses deferred and had capital loss carryforwards utilized as follows: Schwab Monthly Income Fund Moderate Payout Capital loss carryforwards utilized Schwab Monthly Income Fund Enhanced Payout Schwab Monthly Income Fund Maximum Payout $— $890,822 $— 35 .
Schwab Monthly Income Funds Financial Notes (continued) 8. Federal Income Taxes (continued): The tax-basis components of distributions paid during the current and prior fiscal years were as follows: Schwab Monthly Income Fund Moderate Payout Schwab Monthly Income Fund Enhanced Payout Schwab Monthly Income Fund Maximum Payout Current period distributions Ordinary income Long-term capital gains Return of capital $1,417,238 1,813,645 — $2,335,165 — — $1,200,377 1,024,369 — Prior period distributions Ordinary income Long-term capital gains Return of capital $1,640,304 916,848 — $2,425,908 — — $1,420,817 562,589 — Distributions paid to shareholders are based on net investment income and net realized gains determined on a tax basis, which may differ from net investment income and net realized gains for financial reporting purposes. These differences reflect the differing character of certain income items and net realized gains and losses for financial statement and tax purposes, and may result in reclassification among certain capital accounts on the financial statements. Permanent book and tax basis differences may result in reclassifications between components of net assets as required. The adjustments will have no impact on net assets or the results of operations.
As of December 31, 2015, the funds made the following reclassifications: Schwab Monthly Income Fund Moderate Payout Capital shares Undistributed net investment income Net realized capital gains (losses) Schwab Monthly Income Fund Enhanced Payout Schwab Monthly Income Fund Maximum Payout $— 256,947 (256,947) $— 357,133 (357,133) $— 104,311 (104,311) As of December 31, 2015, management has reviewed the tax positions for open periods (for federal purposes, three years from the date of filing and for state purposes, four years from the date of filing) as applicable to the funds, and has determined that no provision for income tax is required in the funds’ financial statements. The funds recognize interest and penalties, if any, related to unrecognized tax benefits as income tax expense in the Statement of Operations. During the period ended December 31, 2015, the funds did not incur any interest or penalties. 9.
Subsequent Events: Management has determined there are no subsequent events or transactions through the date the financial statements were issued that would have materially impacted the financial statements as presented. 36 . Report of Independent Registered Public Accounting Firm To the Board of Trustees and Shareholders of: Schwab Monthly Income Fund—Moderate Payout Schwab Monthly Income Fund—Enhanced Payout Schwab Monthly Income Fund—Maximum Payout In our opinion, the accompanying statements of assets and liabilities, including the portfolio holdings, and the related statements of operations and of changes in net assets and the financial highlights present fairly, in all material respects, the financial position of Schwab Monthly Income Fund - Moderate Payout, Schwab Monthly Income Fund Enhanced Payout and Schwab Monthly Income Fund - Maximum Payout (three of the funds constituting Schwab Capital Trust, hereafter referred to as the “Funds”) at December 31, 2015, the results of each of their operations for the year then ended, the changes in each of their net assets for each of the two years in the period then ended and the financial highlights for each of the five years in the period then ended, in conformity with accounting principles generally accepted in the United States of America. These financial statements and financial highlights (hereafter referred to as “financial statements”) are the responsibility of the Funds’ management. Our responsibility is to express an opinion on these financial statements based on our audits. We conducted our audits of these financial statements in accordance with the standards of the Public Company Accounting Oversight Board (United States).
Those standards require that we plan and perform the audit to obtain reasonable assurance about whether the financial statements are free of material misstatement. An audit includes examining, on a test basis, evidence supporting the amounts and disclosures in the financial statements, assessing the accounting principles used and significant estimates made by management, and evaluating the overall financial statement presentation. We believe that our audits, which included confirmation of securities and investments held in the underlying funds at December 31, 2015 by correspondence with the custodian and transfer agent of the underlying funds, respectively, provide a reasonable basis for our opinion. PricewaterhouseCoopers LLP San Francisco, California February 16, 2016 37 .
Other Federal Tax Information (unaudited) For corporate shareholders, the following percentage of the funds’ dividend distributions paid during the fiscal year ended December 31, 2015, qualify for the corporate dividends received deduction: Percentage Schwab Monthly Income Fund - Moderate Payout Schwab Monthly Income Fund - Enhanced Payout Schwab Monthly Income Fund - Maximum Payout 28.07 23.31 12.88 For the fiscal year ended December 31, 2015, the funds designate the following amounts of the dividend distributions as qualified dividends for the purpose of the maximum rate under section 1(h)(11) of the Internal Revenue Code. Shareholders will be notified in January 2016 via IRS form 1099 of the amounts for use in preparing their 2015 income tax return. Schwab Monthly Income Fund - Moderate Payout Schwab Monthly Income Fund - Enhanced Payout Schwab Monthly Income Fund - Maximum Payout $504,407 692,124 198,573 Under Section 852 (b)(3)(C) of the Internal Revenue Code, the funds hereby designate the following amounts as long-term capital gain dividends for the fiscal year ended December 31, 2015: Schwab Monthly Income Fund - Moderate Payout Schwab Monthly Income Fund - Enhanced Payout Schwab Monthly Income Fund - Maximum Payout 38 $1,813,645 — 1,024,369 . Shareholder Vote Results (Unaudited) A Special Meeting of Shareholders of Schwab Capital Trust (the “Trust”) was held on December 11, 2015, for the purpose of seeking shareholder approval to elect the following individuals as trustees of the Trust: Walter W. Bettinger II, Marie A. Chandoha, Joseph R. Martinetto, Robert W. Burns, John F.
Cogan, Stephen T. Kochis, David L. Mahoney, Kiran M.
Patel, Kimberly S. Patmore, Charles A. Ruffel, Gerald B.
Smith, and Joseph H. Wender. The number of votes necessary to conduct the Special Meeting and approve the proposal was obtained.
The results of the shareholder vote are listed below: Proposal – To elect each of the following individuals as trustees of the Trust: For Withheld Walter W. Bettinger II 1,781,628,338.445 341,201,457.803 Marie A. Chandoha 2,069,741,484.184 53,088,312.064 Joseph R.
Martinetto 2,070,394,888.403 52,434,907.845 Robert W. Burns 2,070,083,106.758 52,746,689.490 John F. Cogan 1,909,915,620.213 212,914,176.035 Stephen T.
Kochis 2,067,778,859.342 55,050,936.906 David L. Mahoney 2,068,011,019.030 54,818,777.218 Kiran M. Patel 2,066,263,491.520 56,566,304.728 Kimberly S.
Patmore 2,069,034,220.641 53,795,575.607 Charles A. Ruffel 2,070,448,922.775 52,380,873.473 Gerald B. Smith 2,069,060,923.296 53,768,872.952 Joseph H.
Wender 2,065,502,834.216 57,326,962.032 39 . Trustees and Officers The tables below give information about the trustees and officers of Schwab Capital Trust, which includes the funds covered in this report. The “Fund Complex” includes The Charles Schwab Family of Funds, Schwab Capital Trust, Schwab Investments, Schwab Annuity Portfolios, Schwab Strategic Trust, Laudus Trust and Laudus Institutional Trust. The Fund Complex includes 96 funds. The address for all trustees and officers is 211 Main Street, San Francisco, CA 94105. You can find more information about the trustees and officers in the funds’ Statement of Additional Information, which is available free by calling 1-800-435-4000. Independent Trustees Name, Year of Birth, and Position(s) with the trust (Terms of office, and length of Time Served1) Principal Occupations During the Past Five Years Number of Portfolios in Fund Complex Overseen by the Trustee Other Directorships Robert W.
Burns 1959 Trustee (Trustee of Schwab Strategic Trust since 2009;The Charles Schwab Family of Funds, Schwab Investments, Schwab Capital Trust, Schwab Annuity Portfolios and Laudus Trust since 2016) Retired/Private Investor (Jan. 2009 – present); Formerly, Managing Director, Pacific Investment Management Company, LLC (PIMCO) and President, PIMCO Funds. 96 Director, PS Business Parks, Inc. (2005 – 2012). John F. Cogan 1947 Trustee (Trustee of The Charles Schwab Family of Funds, Schwab Investments, Schwab Capital Trust and Schwab Annuity Portfolios since 2008; Laudus Trust and Laudus Institutional Trust since 2010; Schwab Strategic Trust since 2016) Senior Fellow, The Hoover Institution at Stanford University (Oct.
1979 – present); Senior Fellow Stanford Institute for Economic Policy Research (2000 – present); Professor of Public Policy, Stanford University (1994 – 2015). 96 Director, Gilead Sciences, Inc. (2005 – present) Stephen Timothy Kochis 1946 Trustee (Trustee of Schwab Strategic Trust since 2012; The Charles Schwab Family of Funds, Schwab Investments, Schwab Capital Trust, Schwab Annuity Portfolios and Laudus Trust since 2016) CEO and Owner, Kochis Global (wealth management consulting) (May 2012 – present); Chairman and CEO, Aspiriant, LLC (wealth management) (Jan. 2008 – April 2012). 96 None David L. Mahoney 1954 Trustee (Trustee of The Charles Schwab Family of Funds, Schwab Investments, Schwab Capital Trust, Schwab Annuity Portfolios, Laudus Trust and Laudus Institutional Trust since 2011; Schwab Strategic Trust since 2016) Private Investor. 96 Director, Symantec Corporation (2003 – present) Director, Corcept Therapeutics Incorporated (2004 – present) Director, Adamas Pharmaceuticals, Inc. (2009 – present) Kiran M.
Patel 1948 Trustee (Trustee of The Charles Schwab Family of Funds, Schwab Investments, Schwab Capital Trust, Schwab Annuity Portfolios, Laudus Trust and Laudus Institutional Trust since 2011; Schwab Strategic Trust since 2016) Retired. Executive Vice President and General Manager of Small Business Group, Intuit, Inc. (financial software and services firm for consumers and small businesses) (Dec. 2008 – Sept.
2013) 96 Director, KLA-Tencor Corporation (2008 – present) 40 . Independent Trustees (continued) Name, Year of Birth, and Position(s) with the trust (Terms of office, and length of Time Served1) Principal Occupations During the Past Five Years Number of Portfolios in Fund Complex Overseen by the Trustee Other Directorships Kimberly S. Patmore 1956 Trustee (Trustee of The Charles Schwab Family of Funds, Schwab Investments, Schwab Capital Trust, Schwab Annuity Portfolios, Schwab Strategic Trust, and Laudus Trust since 2016) Consultant, Patmore Management Consulting (management consulting) (2008 – present). 96 None Charles A. Ruffel 1956 Trustee (Trustee of Schwab Strategic Trust since 2009; The Charles Schwab Family of Funds, Schwab Investments, Schwab Capital Trust, Schwab Annuity Portfolios, Laudus Trust and Laudus Institutional Trust since 2015) Co-Chief Executive Officer, Kudu Investment Management, LLC (financial services) (Jan. 2015 – present); Partner, Kudu Advisors, LLC (financial services) (June 2008 – Jan.
2015); Advisor, Asset International, Inc. (publisher of financial services information) (Aug. 2008 – Jan.
2015). 96 None Gerald B. Smith 1950 Trustee (Trustee of The Charles Schwab Family of Funds, Schwab Investments, Schwab Capital Trust and Schwab Annuity Portfolios since 2000; Laudus Trust and Laudus Institutional Trust since 2010; Schwab Strategic Trust since 2016) Chairman, Chief Executive Officer and Founder of Smith Graham & Co. (investment advisors) (Mar.
1990 – present). 96 Director, Eaton (2012 – present) Director and Chairman of the Audit Committee, Oneok Partners LP (2003 – 2013) Director, Oneok, Inc. (2009 – 2013) Lead Independent Director, Board of Cooper Industries (2002 – 2012) Joseph H. Wender 1944 Trustee (Trustee of The Charles Schwab Family of Funds, Schwab Investments, Schwab Capital Trust and Schwab Annuity Portfolios since 2008; Laudus Trust and Laudus Institutional Trust since 2010; Schwab Strategic Trust since 2016) Senior Consultant, Goldman Sachs & Co., Inc. (investment banking and securities firm) (Jan.
2008 – present); Partner, Colgin Partners, LLC (vineyards) (Feb. 1998 – present). 96 Board Member and Chairman of the Audit Committee, Isis Pharmaceuticals (1994 – present) Lead Independent Director and Chair of Audit Committee, OUTFRONT Media Inc. (2014 – present) Interested Trustees Name, Year of Birth, and Position(s) with the trust (Terms of office, and length of Time Served1) Walter W. Bettinger II2 1960 Chairman and Trustee (Trustee of The Charles Schwab Family of Funds, Schwab Investments, Schwab Capital Trust and Schwab Annuity Portfolios since 2008; Schwab Strategic Trust since 2009; Laudus Trust and Laudus Institutional Trust since 2010) Principal Occupations During the Past Five Years Director, President and Chief Executive Officer, The Charles Schwab Corporation (Oct.
2008 – present); President and Chief Executive Officer (Oct. 2008 – present), Director (May 2008 – present), Charles Schwab & Co., Inc.; Director, Charles Schwab Bank (Apr. 2006 – present); and Director, Schwab Holdings, Inc.
(May 2008 – present). Number of Portfolios in Fund Complex Overseen by the Trustee Other Directorships 96 Director, The Charles Schwab Corporation (2008 – present) 41 . Interested Trustees (continued) Name, Year of Birth, and Position(s) with the trust (Terms of office, and length of Time Served1) Principal Occupations During the Past Five Years Number of Portfolios in Fund Complex Overseen by the Trustee Other Directorships Marie A. Chandoha2 1961 Trustee (Trustee of The Charles Schwab Family of Funds, Schwab Investments, Schwab Capital Trust, Schwab Annuity Portfolios, Schwab Strategic Trust, and Laudus Trust since 2016) Director, President and Chief Executive Officer (Dec. 2010 – present), Chief Investment Officer (Sept. 2010 – Oct.
2011), Charles Schwab Investment Management, Inc.; Trustee (Jan. 2016 – present), President, Chief Executive Officer (Dec. 2010 – present), and Chief Investment Officer (Sept.
2010 – Oct. 2011), Schwab Funds, Laudus Funds and Schwab ETFs; Director, Charles Schwab Worldwide Funds plc and Charles Schwab Asset Management (Ireland) Limited (Jan. 2011 – present); Global Head of Fixed Income Business Division, BlackRock, Inc.
(formerly Barclays Global Investors) (March 2007 – Aug. 2010). 96 None Joseph R. Martinetto2 1962 Trustee (Trustee of The Charles Schwab Family of Funds, Schwab Investments, Schwab Capital Trust, Schwab Annuity Portfolios, Schwab Strategic Trust, and Laudus Trust since 2016) Senior Executive Vice President and Chief Financial Officer, The Charles Schwab Corporation and Charles Schwab & Co., Inc. (July 2015 – present); Executive Vice President and Chief Financial Officer of The Charles Schwab Corporation and Charles Schwab & Co., Inc.
(May 2007 – July 2015); Director, Charles Schwab & Co., Inc. (May 2007 – present); Director (Apr. 2010 – present) and Chief Executive Officer (July 2013 – Apr. 2015), Charles Schwab Bank; Director, Executive Vice President and Chief Financial Officer, Schwab Holdings, Inc.
(May 2007 – present). 96 None Officers of the Trust Name, Year of Birth, and Position(s) with the trust (Terms of office, and length of Time Served3) Principal Occupations During the Past Five Years Marie Chandoha 1961 President and Chief Executive Officer (Officer of The Charles Schwab Family of Funds, Schwab Investments, Schwab Capital Trust, Schwab Annuity Portfolios, Schwab Strategic Trust, Laudus Trust and Laudus Institutional Trust since 2010) Director, President and Chief Executive Officer (Dec. 2010 – present), Chief Investment Officer (Sept. 2010 – Oct.
2011), Charles Schwab Investment Management, Inc.; Trustee (Jan. 2016 – present), President, Chief Executive Officer (Dec. 2010 – present), and Chief Investment Officer (Sept.
2010 – Oct. 2011), Schwab Funds, Laudus Funds and Schwab ETFs; Director, Charles Schwab Worldwide Funds plc and Charles Schwab Asset Management (Ireland) Limited (Jan. 2011 – present); Global Head of Fixed Income Business Division, BlackRock, Inc.
(formerly Barclays Global Investors) (March 2007 – Aug. 2010). Mark Fischer 1970 Treasurer and Chief Financial Officer (Officer of The Charles Schwab Family of Funds, Schwab Investments, Schwab Capital Trust, Schwab Annuity Portfolios, Schwab Strategic Trust, Laudus Trust and Laudus Institutional Trust since 2013) Treasurer and Chief Financial Officer, Schwab Funds, Laudus Funds and Schwab ETFs (Jan. 2016 – present); Assistant Treasurer, Schwab Funds and Laudus Funds (Dec.
2013 – Dec. 2015), Schwab ETFs (Nov. 2013 – Dec.
2015); Vice President, Charles Schwab Investment Management, Inc. (Oct. 2013 – present); Executive Director, J.P.
Morgan Investor Services (Apr. 2011 – Sept. 2013); Assistant Treasurer, Massachusetts Financial Service Investment Management (May 2005 – Mar.
2011). 42 . Officers of the Trust (continued) Name, Year of Birth, and Position(s) with the trust (Terms of office, and length of Time Served3) Principal Occupations During the Past Five Years George Pereira 1964 Senior Vice President and Chief Operating Officer (Officer of The Charles Schwab Family of Funds, Schwab Investments, Schwab Capital Trust and Schwab Annuity Portfolios since 2004; Laudus Trust and Laudus Institutional Trust since 2006; Schwab Strategic Trust since 2009) Senior Vice President and Chief Financial Officer (Nov. 2004 – present), Chief Operating Officer (Jan. 2011 – present), Charles Schwab Investment Management, Inc.; Senior Vice President and Chief Operating Officer (Jan. 2016 – present), Treasurer and Chief Financial Officer, Laudus Funds (June 2006 – Dec.
2015); Treasurer and Principal Financial Officer, Schwab Funds (Nov. 2004 – Dec. 2015) and Schwab ETFs (Oct.
2009 – Dec. 2015); Director, Charles Schwab Worldwide Funds, plc and Charles Schwab Asset Management (Ireland) Limited (April 2005 – present). Omar Aguilar 1970 Senior Vice President and Chief Investment Officer – Equities (Officer of The Charles Schwab Family of Funds, Schwab Investments, Schwab Capital Trust, Schwab Annuity Portfolios, Schwab Strategic Trust, Laudus Trust and Laudus Institutional Trust since 2011) Senior Vice President and Chief Investment Officer – Equities, Charles Schwab Investment Management, Inc. (April 2011 – present); Senior Vice President and Chief Investment Officer – Equities, Schwab Funds, Laudus Funds and Schwab ETFs (June 2011 – present); Head of the Portfolio Management Group and Vice President of Portfolio Management, Financial Engines, Inc. (May 2009 – April 2011); Head of Quantitative Equity, ING Investment Management (July 2004 – Jan.
2009). Brett Wander 1961 Senior Vice President and Chief Investment Officer – Fixed Income (Officer of The Charles Schwab Family of Funds, Schwab Investments, Schwab Capital Trust, Schwab Annuity Portfolios, Schwab Strategic Trust, Laudus Trust and Laudus Institutional Trust since 2011) Senior Vice President and Chief Investment Officer – Fixed Income, Charles Schwab Investment Management, Inc. (April 2011 – present); Senior Vice President and Chief Investment Officer – Fixed Income, Schwab Funds, Laudus Funds and Schwab ETFs (June 2011 – present); Senior Managing Director, Global Head of Active Fixed-Income Strategies, State Street Global Advisors (Jan. 2008 – Oct.
2010); Director of Alpha Strategies Loomis, Sayles & Company (April 2006 – Jan. 2008). David Lekich 1964 Chief Legal Officer and Secretary, Schwab Funds and Schwab ETFs Vice President and Assistant Clerk, Laudus Funds (Officer of The Charles Schwab Family of Funds, Schwab Investments, Schwab Capital Trust, Schwab Annuity Portfolios, Schwab Strategic Trust, Laudus Trust and Laudus Institutional Trust since 2011) Senior Vice President (Sept. 2011 – present), Vice President (March 2004 – Sept.
2011), Charles Schwab & Co., Inc.; Senior Vice President and Chief Counsel (Sept. 2011 – present), Vice President (Jan. 2011 – Sept.
2011), Charles Schwab Investment Management, Inc.; Secretary (April 2011 – present) and Chief Legal Officer (Dec. 2011 – present), Schwab Funds; Vice President and Assistant Clerk, Laudus Funds (April 2011 – present); Secretary (May 2011 – present) and Chief Legal Officer (Nov. 2011 – present), Schwab ETFs. Catherine MacGregor 1964 Vice President and Assistant Secretary, Schwab Funds and Schwab ETFs Chief Legal Officer, Vice President and Clerk, Laudus Funds (Officer of The Charles Schwab Family of Funds, Schwab Investments, Schwab Capital Trust, Schwab Annuity Portfolios, Laudus Trust and Laudus Institutional Trust since 2005; Schwab Strategic Trust since 2009) Vice President, Charles Schwab & Co., Inc., Charles Schwab Investment Management, Inc.
(July 2005 – present); Vice President (Dec. 2005 – present), Chief Legal Officer and Clerk (Mar. 2007 – present), Laudus Funds; Vice President (Nov.
2005 – present) and Assistant Secretary (June 2007 – present), Schwab Funds; Vice President and Assistant Secretary, Schwab ETFs (Oct. 2009 – present). 1 2 3 Each Trustee shall hold office until the election and qualification of his or her successor, or until he or she dies, resigns or is removed. The retirement policy requires that each independent trustee retire by December 31 of the year in which the Trustee turns 74 or the Trustee’s twentieth year of service as an independent trustee on any trust in the Fund Complex, whichever occurs first. Mr.
Bettinger, Ms. Chandoha, and Mr. Martinetto are Interested Trustees because they own stock of The Charles Schwab Corporation, the parent company of the investment adviser. The President, Treasurer and Secretary/Clerk hold office until their respective successors are chosen and qualified or until he or she sooner dies, resigns, is removed or becomes disqualified.
Each of the other officers serves at the pleasure of the Board. 43 . Glossary asset allocation The practice of dividing a portfolio among different asset classes, with each asset class assigned a particular percentage. asset class A group of securities with similar structure and basic characteristics. Stocks, bonds and cash are the three main examples of asset classes. Barclays U.S. Aggregate Bond Index A broad-based benchmark that measures the investment grade, U.S. dollar-denominated, fixed-rate taxable bond market, including Treasuries, government-related and corporate securities, mortgage-backed securities (agency fixed-rate and hybrid ARM pass-throughs), asset-backed securities, and commercial mortgage-backed securities. Barclays U.S.
Aggregate Intermediate Bond Index An index that represents securities that are SEC-registered, taxable, and dollar denominated. The index covers the U.S. investment grade fixed rate bond market, with index components for government and corporate securities, mortgage pass-through securities, and asset-backed securities. Barclays U.S.
Treasury Bills 1 – 3 Months Index An index that includes all publicly issued zero-coupon U.S. Treasury Bills that have a remaining maturity of less than 3 months and more than 1 month, are rated investment grade, and have $250 million or more of outstanding face value. bond A security representing a loan from the investor to the issuer. A bond typically pays interest at a fixed rate (the coupon rate) until a specified date (the maturity date), at which time the issuer returns the money borrowed (principal or face value) to the bondholder.
Because of their structure, bonds are sometimes called “fixed income securities” or “debt securities.” An individual bond is subject to the credit risk of the issuer. Changes in interest rates can affect a bond’s market value prior to call or maturity. There is no guarantee that a bond’s yield to call or maturity will provide a positive return over the rate of inflation. bond fund A bond fund is subject to the same credit, interest rate, and inflation risks as bonds. In addition, a bond fund incurs ongoing fees and expenses.
A bond fund’s net asset value will fluctuate with the price of the underlying bonds and the portfolio turnover activity; return of principal is not guaranteed. cap, capitalization See “market cap.” capital gain, capital loss The difference between the amount paid for an investment and its value at a later time. If the investment has been sold, the capital gain or loss is considered a realized gain or loss. If the investment is still held, the gain or loss is still “on paper” and is considered unrealized. Enhanced Payout Composite Index A custom blended index developed by CSIM based on a comparable portfolio asset allocation.
Effective April 1, 2013, the Enhanced Payout Composite Index is composed of 19.50% S&P 500 Index, 8.12% MSCI EAFE (Net) Index, 4.88% FTSE EPRA/NAREIT Global Index (Net), 39.30% Barclays U.S. Aggregate Bond 44 Index, 26.20% Barclays U.S. Aggregate Intermediate Bond Index, and 2.00% Barclays U.S.
Treasury Bills: 1 – 3 Months Index. Prior to April 1, 2013, the Enhanced Payout Composite Index was composed of 25% S&P 500 Index and 75% Barclays U.S. Aggregate Bond Index. expense ratio The amount that is taken from a mutual fund’s assets each year to cover the fund’s operating expenses.
An expense ratio of 0.50% means that a fund’s expenses amount to half of one percent of its average net assets a year. FTSE EPRA/NAREIT Global Index An index that is designed to provide a diverse representation of publicly traded equity real estate investment trusts (REITs) and listed property companies worldwide. market cap, market capitalization The value of a company as determined by the total value of all shares of its stock outstanding. Maximum Payout Composite Index A custom blended index developed by CSIM based on a comparable portfolio asset allocation. Effective April 1, 2013, the Maximum Payout Composite Index is composed of 10.50% S&P 500 Index, 4.37% MSCI EAFE (Net) Index, 2.63% FTSE EPRA/NAREIT Global Index (Net), 48.30% Barclays U.S. Aggregate Bond Index, 32.20% Barclays U.S.
Aggregate Intermediate Bond Index, and 2.00% Barclays U.S. Treasury Bills: 1 – 3 Months Index. Prior to April 1, 2013, the Maximum Payout Composite Index was composed of 10% S&P 500 Index and 90% Barclays U.S.
Aggregate Bond Index. Moderate Payout Composite Index A custom blended index developed by CSIM based on a comparable portfolio asset allocation. Effective April 1, 2013, the Moderate Payout Composite Index is composed of 28.50% S&P 500 Index, 11.87% MSCI EAFE (Net) Index, 7.13% FTSE EPRA/NAREIT Global Index (Net), 30.30% Barclays U.S. Aggregate Bond Index, 20.20% Barclays U.S.
Aggregate Intermediate Bond Index, and 2.00% Barclays U.S. Treasury Bills: 1 – 3 Months Index. Prior to April 1, 2013, the Moderate Payout Composite Index was composed of 40% S&P 500 Index and 60% Barclays U.S.
Aggregate Bond Index. MSCI EAFE (Europe, Australasia, Far East) Index A free float-adjusted market capitalization index that is designed to measure the equity market performance of developed markets, excluding the U.S. & Canada. The Net version of the index reflects reinvested dividends net of withholding taxes, but reflects no deductions for expenses or other taxes; returns are calculated applying dividend withholding rates applicable to non-resident persons who do not benefit from double taxation treaties. net asset value (NAV) The value of one share of a mutual fund.
NAV is calculated by taking the fund’s total assets, subtracting liabilities, and dividing by the number of shares outstanding. outstanding shares, shares outstanding When speaking of a company or mutual fund, indicates all shares currently held by investors. price-to-book ratio (P/B) The market price of a company’s stock compared with its “book value.” A mutual fund’s P/B is the weighted average of the P/B of all stocks in the fund’s portfolio. . price-to-earnings ratio (P/E) The market price of a company’s stock compared with earnings over the past year. A mutual fund’s P/E is the weighted average of the P/E of all stocks in the fund’s portfolio. return on equity (ROE) The average yearly rate of return for each dollar of investors’ money, measured over the past five years. Russell 2000 Index An index that measures the performance of the small-cap segment of the U.S. equity universe. S&P 500 Index A market capitalization index that is designed to measure the performance of 500 leading publicly held companies in leading industries of the U.S. economy. total return The percentage that an investor would have earned or lost on an investment in the fund assuming dividends and distributions were reinvested. 12-Month Distribution Yield reflects the fund’s monthly ordinary income distributions for the last 12 months divided by the fund’s Net Asset Value as of the end of the reporting period. Distribution yield does not include capital gains distributions. weighted average For mutual funds, an average that gives the same weight to each security as the security represents in the fund’s portfolio. yield The income paid out by an investment, expressed as a percentage of the investment’s market value. stock A share of ownership, or equity, in the issuing company. 45 .
A Commitment to Your Privacy tools help us to recognize you, maintain your web session, and provide a more personalized experience. To learn more, please go to www.schwab.com/privacy. Your Privacy Is Not for Sale How We Share and Use Your Information We do not and will not sell your personal information to anyone, for any reason. We provide access to information about you to our affiliated companies, outside companies and other third parties in certain limited circumstances, including: PRIVACY NOTICE THIS IS NOT PART OF THE SHAREHOLDER REPORT We are committed to protecting the privacy of information we maintain about you. Below are details about our commitment, including the types of information we collect and how we use and share that information. This Privacy Notice applies to you only if you are an individual who invests directly in the funds by placing orders through the funds’ transfer agent.
If you place orders through your brokerage account at Charles Schwab & Co., Inc. or an account with another broker-dealer, investment advisor, 401(k) plan, employee benefit plan, administrator, bank or other financial intermediary, you are covered by the privacy policies of that financial institution and should consult those policies. • to help us process transactions for your account; • when we use other companies to provide services for us, such as printing and mailing your account statements; • when we believe that disclosure is required or permitted under law (for example, to cooperate with regulators or law enforcement, resolve consumer disputes, perform credit/authentication checks, or for risk control). State Laws We will comply with state laws that apply to the disclosure or use of information about you. How We Collect Information About You We collect personal information about you in a number of ways. • APPLICATION AND REGISTRATION INFORMATION. We collect personal information from you when you open an account or utilize one of our services. We may also collect information about you from third parties such as consumer reporting agencies to verify your identity.
The information we collect may include personal information, including your Social Security number, as well as details about your interests, investments and investment experience. • TRANSACTION AND EXPERIENCE INFORMATION. Once your account has been opened, we collect and maintain personal information about your account activity, including your transactions, balances, positions and history. This information allows us to administer your account and provide the services you have requested. • WEBSITE USAGE. When you visit our websites, we may use devices known as “cookies,” graphic interchange format files (GIFs), or other similar web tools to enhance your web experience. These 46 Safeguarding Your Information — Security Is a Partnership We take precautions to ensure the information we collect about you is protected and is accessed only by authorized individuals or organizations. Companies we use to provide support services are not allowed to use information about our shareholders for their own purposes and are contractually obligated to maintain strict confidentiality. We limit their use of information to the performance of the specific services we have requested. We restrict access to personal information by our employees and agents.
Our employees are trained about privacy and are required to safeguard personal information. We maintain physical, electronic and procedural safeguards that comply with federal standards to guard your nonpublic personal information. Contact Us To provide us with updated information, report suspected fraud or identity theft, or for any other questions, please call the number below. Schwab Funds® direct investors: 1-800-407-0256 © 2016 Schwab Funds. All rights reserved. . Notes . Notes . Schwab Funds® offers you an extensive family of mutual funds, each one based on a clearly defined investment approach and using disciplined management strategies. The list at right shows all currently available Schwab Funds. Whether you are an experienced investor or just starting out, Schwab Funds can help you achieve your financial goals. An investor should consider a fund’s investment objectives, risks, charges and expenses carefully before investing or sending money. This and other important information can be found in the fund’s prospectus. Please call 1-800-435-4000 for a prospectus and brochure for any Schwab Fund.
Please read the prospectus carefully before you invest. This report must be preceded or accompanied by a current prospectus. Proxy Voting Policies, Procedures and Results A description of the proxy voting policies and procedures used to determine how to vote proxies on behalf of the funds is available without charge, upon request, by visiting the Schwab Funds’ website at www.csimfunds.com/schwabfunds_prospectus, the SEC’s website at www.sec.gov, or by contacting Schwab Funds at 1-800-435-4000. Information regarding how a fund voted proxies relating to portfolio securities during the most recent twelve-month period ended June 30 is available, without charge, by visiting the fund’s website at www.csimfunds.com/schwabfunds_prospectus or the SEC’s website at www.sec.gov. The Schwab Funds Family® Stock Funds Schwab Core Equity Fund™ Schwab Dividend Equity Fund™ Schwab Large-Cap Growth Fund™ Schwab Small-Cap Equity Fund™ Schwab Hedged Equity Fund™ Schwab Financial Services Fund™ Schwab Health Care Fund™ Schwab® International Core Equity Fund Schwab Fundamental US Large Company Index Fund Schwab Fundamental US Small Company Index Fund Schwab Fundamental International Large Company Index Fund Schwab Fundamental International Small Company Index Fund Schwab Fundamental Emerging Markets Large Company Index Fund Schwab Fundamental Global Real Estate Index Fund Schwab Global Real Estate Fund™ Schwab® S&P 500 Index Fund Schwab 1000 Index® Fund Schwab Small-Cap Index Fund® Schwab Total Stock Market Index Fund® Schwab International Index Fund® Asset Allocation Funds Schwab Balanced Fund™ Schwab MarketTrack All Equity Portfolio™ Schwab MarketTrack Growth Portfolio™ Schwab MarketTrack Balanced Portfolio™ Schwab MarketTrack Conservative Portfolio™ Schwab Target 2010 Fund Schwab Target 2015 Fund Schwab Target 2020 Fund Schwab Target 2025 Fund Schwab Target 2030 Fund Schwab Target 2035 Fund Schwab Target 2040 Fund Schwab Target 2045 Fund Schwab Target 2050 Fund Schwab Target 2055 Fund Schwab® Monthly Income Fund – Moderate Payout Schwab® Monthly Income Fund – Enhanced Payout Schwab® Monthly Income Fund – Maximum Payout Bond Funds Schwab Short-Term Bond Market Fund™ Schwab Intermediate-Term Bond Fund™ Schwab Total Bond Market Fund™ Schwab GNMA Fund™ Schwab® Treasury Inflation Protected Securities Index Fund Schwab Tax-Free Bond Fund™ Schwab California Tax-Free Bond Fund™ Schwab Money Funds Schwab offers an array of money market funds1. Choose from taxable or tax-advantaged alternatives.
Many can be linked to your eligible Schwab account to “sweep” cash balances automatically, subject to availability, when you’re between investments. Or, for your larger cash reserves, choose one of our Value Advantage Investments®. 1 Investments in money market funds are neither insured nor guaranteed by the Federal Deposit Insurance Corporation (FDIC) or any other government agency and, although many seek to preserve the value of your investment at $1 per share, it is possible to lose money. . This report is not authorized for distribution to prospective investors unless preceded or accompanied by a current prospectus. © 2016 Charles Schwab & Co., Inc. All rights reserved. Member SIPC® Printed on recycled paper. MFR43716-09 00160185 Funds Schwab Funds® 1-800-435-4000 Investment Adviser Charles Schwab Investment Management, Inc. 211 Main Street, San Francisco, CA 94105 . . .