


Description
FAST FACTS
Fiscal Year Ended June 30, 2015
Executive Staff*
Jack Ehnes Chief Executive Officer
Cassandra Lichnock Chief Operating Officer
Christopher J. Ailman Chief Investment Officer
Brian Bartow General Counsel
Lisa Blatnick Chief of Administrative Services
Ed Derman Deputy Chief Executive Officer,
Plan Design and Communication
Ashish Jain Chief Technology Officer
Robin Madsen Chief Financial Officer
Andrew Roth Executive Officer,
Benefits and Services
CalSTRS Resources
WEB
CalSTRS.com
Click Contact Us to email
myCalSTRS.com
403bCompare.com
Pension2.com
CALL
800-228-5453
7 a.m. to 6 p.m.
Monday through Friday
916-414-1099
Calls from outside the U.S.
888-394-2060
CalSTRS Pension2® Personal Wealth Plan
855-844-2468 (toll free)
Pension Abuse Reporting Hotline
*As of January 1, 2016
WRITE
Teachers’ Retirement Board
The 12-member Teachers’ Retirement Board includes:
• Three elected members who are current educators.
• A retired CalSTRS member appointed by the Governor.
• Three public representatives appointed by the Governor.
• A school board member appointed by the Governor.
• Four board members who serve by virtue of their
office: Director of Finance, State Controller,
State Superintendent of Public Instruction and
State Treasurer.
CalSTRS
P.O. Box 15275
Sacramento, CA 95851-0275
VISIT
Member Services
100 Waterfront Place
West Sacramento, CA 95605
Find your nearest CalSTRS office
at CalSTRS.com/localoffices
FAX
916-414-5040
STAY CONNECTED
COM 141 (rev 1/16)
.
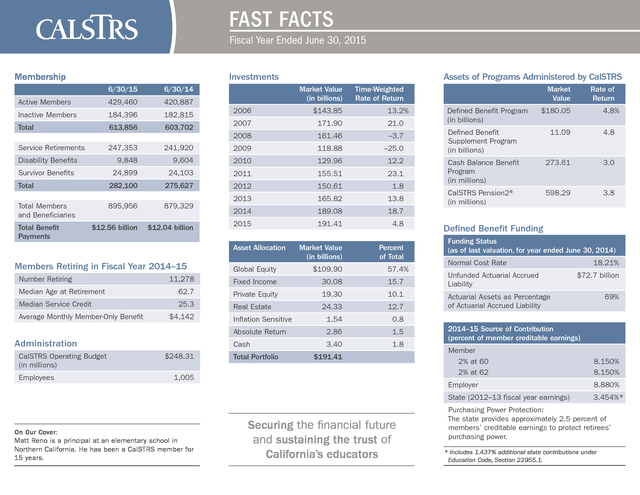
FAST FACTS Fiscal Year Ended June 30, 2015 Membership Investments 6/30/15 6/30/14 Active Members 429,460 420,887 Inactive Members 184,396 182,815 Total 613,856 603,702 Service Retirements 247,353 Disability Benefits Survivor Benefits Market Value (in billions) Time-Weighted Rate of Return $143.85 2007 171.90 21.0 2008 161.46 –3.7 241,920 2009 118.88 –25.0 9,604 2010 129.96 12.2 24,899 24,103 2011 155.51 23.1 282,100 Total Members and Beneficiaries 2006 9,848 Total Total Benefit Payments Assets of Programs Administered by CalSTRS 275,627 2012 150.61 1.8 2013 165.82 13.8 2014 189.08 191.41 4.8 Market Value (in billions) Percent of Total $12.56 billion 879,329 $12.04 billion Asset Allocation Members Retiring in Fiscal Year 2014–15 Global Equity $109.90 11,278 Fixed Income 30.08 15.7 Median Age at Retirement 62.7 Private Equity 19.30 10.1 Median Service Credit 25.3 Real Estate 24.33 12.7 Inflation Sensitive 1.54 Absolute Return 2.86 1.5 Cash 3.40 1.8 $180.05  4.8% Defined Benefit Supplement Program (in billions) 11.09 4.8 Cash Balance Benefit Program (in millions) 273.61 3.0 CalSTRS Pension2® (in millions) 598.29 3.8 Defined Benefit Funding Funding Status (as of last valuation, for year ended June 30, 2014) Normal Cost Rate 18.21% 0.8 Number Retiring Average Monthly Member-Only Benefit $4,142 Administration 57.4% Defined Benefit Program (in billions) Rate of Return 18.7 2015 895,956 13.2% Market Value Unfunded Actuarial Accrued Liability $72.7 billion Actuarial Assets as Percentage of Actuarial Accrued Liability 69% 2014–15 Source of Contribution (percent of member creditable earnings) Employees $248.31 $191.41 1,005 On Our Cover: Matt Reno is a principal at an elementary school in Northern California. He has been a CalSTRS member for 15 years. Securing the financial future and sustaining the trust of California’s educators 8.150% 8.150% Employer Total Portfolio Member 2% at 60 2% at 62 8.880% State (2012–13 fiscal year earnings) CalSTRS Operating Budget (in millions) 3.454%* Purchasing Power Protection: The state provides approximately 2.5 percent of members’ creditable earnings to protect retirees’ purchasing power. * Includes 1.437% additional state contributions under Education Code, Section 22955.1. .
FAST FACTS Fiscal Year Ended June 30, 2015 Membership Investments 6/30/15 6/30/14 Active Members 429,460 420,887 Inactive Members 184,396 182,815 Total 613,856 603,702 Service Retirements 247,353 Disability Benefits Survivor Benefits Market Value (in billions) Time-Weighted Rate of Return $143.85 2007 171.90 21.0 2008 161.46 –3.7 241,920 2009 118.88 –25.0 9,604 2010 129.96 12.2 24,899 24,103 2011 155.51 23.1 282,100 Total Members and Beneficiaries 2006 9,848 Total Total Benefit Payments Assets of Programs Administered by CalSTRS 275,627 2012 150.61 1.8 2013 165.82 13.8 2014 189.08 191.41 4.8 Market Value (in billions) Percent of Total $12.56 billion 879,329 $12.04 billion Asset Allocation Members Retiring in Fiscal Year 2014–15 Global Equity $109.90 11,278 Fixed Income 30.08 15.7 Median Age at Retirement 62.7 Private Equity 19.30 10.1 Median Service Credit 25.3 Real Estate 24.33 12.7 Inflation Sensitive 1.54 Absolute Return 2.86 1.5 Cash 3.40 1.8 $180.05  4.8% Defined Benefit Supplement Program (in billions) 11.09 4.8 Cash Balance Benefit Program (in millions) 273.61 3.0 CalSTRS Pension2® (in millions) 598.29 3.8 Defined Benefit Funding Funding Status (as of last valuation, for year ended June 30, 2014) Normal Cost Rate 18.21% 0.8 Number Retiring Average Monthly Member-Only Benefit $4,142 Administration 57.4% Defined Benefit Program (in billions) Rate of Return 18.7 2015 895,956 13.2% Market Value Unfunded Actuarial Accrued Liability $72.7 billion Actuarial Assets as Percentage of Actuarial Accrued Liability 69% 2014–15 Source of Contribution (percent of member creditable earnings) Employees $248.31 $191.41 1,005 On Our Cover: Matt Reno is a principal at an elementary school in Northern California. He has been a CalSTRS member for 15 years. Securing the financial future and sustaining the trust of California’s educators 8.150% 8.150% Employer Total Portfolio Member 2% at 60 2% at 62 8.880% State (2012–13 fiscal year earnings) CalSTRS Operating Budget (in millions) 3.454%* Purchasing Power Protection: The state provides approximately 2.5 percent of members’ creditable earnings to protect retirees’ purchasing power. * Includes 1.437% additional state contributions under Education Code, Section 22955.1. .