


Description
2015
FOR THE FISCAL YEAR ENDED JUNE 30, 2015
CalSTRS Popular Annual Financial Report
C A L I F O R N I A S TAT E T E A C H E R S ’ R E T I R E M E N T S Y S T E M
Redefining the Future
2015 Asset Allocation Study
The Popular Annual Financial
Report issued by the California
State Teachers’ Retirement System
details the system’s performance
for the fiscal year ended June 30,
2015. This fiscal year’s investment
returns of 4.8 percent gross, as
calculated on a time weighted
basis, was below our actuarially
assumed 7.5 percent (net) rate
and brings focus to risk mitigation efforts within the fund.
Slow U.S. and global growth, along with global market
volatility, are the primary factors for returns not meeting
targets.
In February, we initiated our 2015 Asset Allocation Study,
which has taken place every three years since 2003.
The study is being conducted over the course of five to six
board meetings throughout 2015 and into early 2016 and will
conclude with the Teachers’ Retirement Board’s adoption of
a strategic asset allocation policy. CalSTRS takes great care
in working with the world’s most highly regarded investment
professionals in determining a range of different asset classes
to consider for its policy allocation, the role and strategic
rationale of each asset class, and risk/reward characteristics
within the CalSTRS Investment Portfolio.
An appropriate long-term strategy and vision serve to
strengthen our success, and this fiscal year’s performance will
not adversely affect the long-term financial health of the fund.
Stabilization of the Defined Benefit Program
For the first time in nearly a decade, actuarial projections
indicate contributions are sufficient to meet future needs
based on the current investment assumption rate of 7.5
percent.
Due to the new funding structure enacted in Chapter 47, Statutes of 2014 (Assembly Bill 1469-Bonta), CalSTRS no longer projects a fund depletion date. Instead, the Defined Benefit Program is projected to be fully funded by 2046. A snapshot of the Defined Benefit Program’s assets and liabilities as reported in the June 30, 2014 actuarial valuation, reflects a decrease of about $1 billion in the unfunded liability, now at $72.7 billion. Last year’s projections marked the funding shortfall at $73.7 billion.
This year’s actuarial valuation also shows a 1.6 percent increase in the funded ratio from 66.9 percent to 68.5 percent. Much of the study’s discussion concerns strategies to mitigate the risk of future market declines, with a focus on the effect of dramatic equity declines like those of the past decade. It is important to keep in mind that as liabilities are being paid down, the fund remains sensitive to asset return volatility and large, negative returns. Lessons learned from the dot-com bust in 2001 and the economic turmoil from the 2008–09 market crash serve to remind us of how heavy losses during significant downturns can negatively affect the fund. At CalSTRS we are stewards of the hard-earned savings California’s educators contribute toward their retirement and have entrusted to us. CalSTRS is a long-term investor and ultimately our goal is to generate returns sufficient to meet the plan’s liabilities for the benefit of our members. We diversify our portfolio with holdings throughout the world to maximize our returns and continually seek proven and innovative ways to mitigate risk. Respectfully submitted, Chief Executive Officer Securing the financial future and sustaining the trust of California’s educators. .
AWARD: GFOA CERTIFICATE 2 Popular Annual Financial Report 2015 . TEACHERS’ RETIREMENT BOARD (AS OF JUNE 30, 2015 ) HARRY KEILEY Board Chair K–12 Classroom Teacher Term: 01/01/12–12/31/15 SHARON HENDRICKS Board Vice Chair Community College Instructor Term: 01/01/12–12/31/15 MICHAEL COHEN Director of Finance Ex-Officio Member JOHN CHIANG State Treasurer Ex-Officio Member DANA DILLON K–12 Classroom Teacher Term: 01/01/12–12/31/15 JOY HIGA Public Representative Term: 01/27/14–12/31/17 PAUL ROSENSTIEL Public Representative Term: 01/01/15–12/31/18 TOM TORLAKSON State Superintendent of Public Instruction Ex-Officio Member THOMAS UNTERMAN Public Representative Term: 07/03/13–12/31/15 BETTY YEE State Controller Ex-Officio Member NORA E. VARGAS School Board Representative Term: 04/23/15–12/31/2015 The Teachers’ Retirement Board has exclusive control over the administration of the retirement system plans and the investment of funds. The board makes rules, sets policies, and has the power and authority to hear and determine all facts pertaining to applications for benefits under the retirement system. It is comprised of 12 members: â— Five members appointed by the Governor: one member currently serving on a school board, one retired CalSTRS member, and three public members; â— Four ex-officio members: the Superintendent of Public Instruction, the State Treasurer, the State Controller, and the Director of Finance; and â— Three members elected by CalSTRS membership. A new governor-appointed school board representative joined the board in April 2015, and one governor-appointed position remains open as of June 30, 2015. CalSTRS Popular Annual Financial Report 2015 3 .
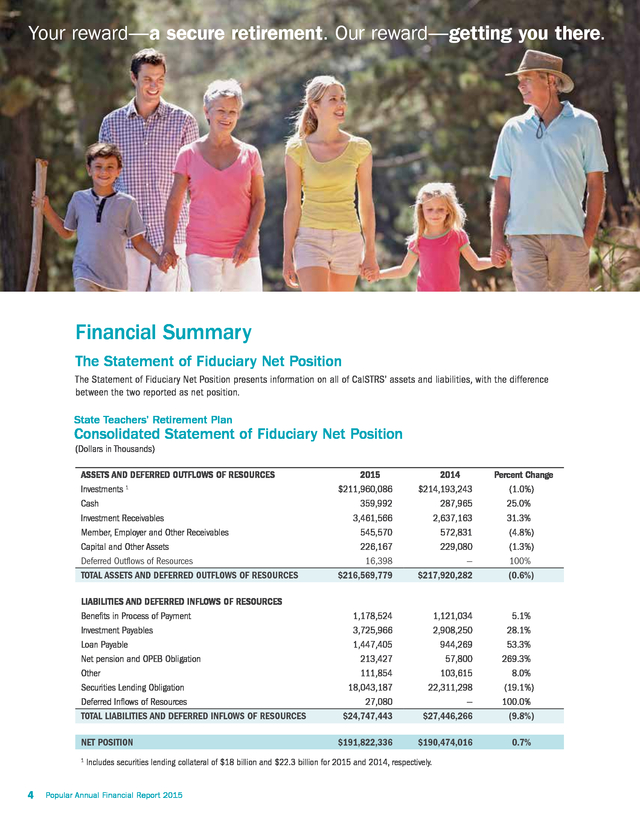
YourFinancial Summary reward—a secure retirement. Our reward—getting you there. The Statement of Fiduciary Net Position The Statement of Fiduciary Net Position presents information on all of CalSTRS assets and liabilities, with the difference between the two reported as net position. Financial Summary The Statement of Fiduciary Net Position The Statement of Fiduciary Net Position presents information on all of CalSTRS’ assets and liabilities, with the difference between the two reported as net position. State Teachers’ Retirement Plan Consolidated Statement of Fiduciary Net Position (Dollars in Thousands) ASSETS AND DEFERRED OUTFLOWS OF RESOURCES Investments 1 Cash Investment Receivables Member, Employer and Other Receivables Capital and Other Assets Deferred Outflows of Resources TOTAL ASSETS AND DEFERRED OUTFLOWS OF RESOURCES LIABILITIES AND DEFERRED INFLOWS OF RESOURCES Benefits in Process of Payment Investment Payables Loan Payable Net pension and OPEB Obligation Other Securities Lending Obligation Deferred Inflows of Resources TOTAL LIABILITIES AND DEFERRED INFLOWS OF RESOURCES NET POSITION 1 4 2015 $211,960,086 359,992 3,461,566 545,570 226,167 16,398 $216,569,779 2014 $214,193,243 287,965 2,637,163 572,831 229,080 — $217,920,282 1,178,524 3,725,966 1,447,405 213,427 111,854 18,043,187 27,080 $24,747,443 1,121,034 2,908,250 944,269 57,800 103,615 22,311,298 — $27,446,266 $191,822,336 $190,474,016 Includes securities lending collateral of $18 billion and $22.3 billion for 2015 and 2014, respectively. Popular Annual Financial Report 2015 Percent Change (1.0%) 25.0% 31.3% (4.8%) (1.3%) 100% (0.6%) 5.1% 28.1% 53.3% 269.3% 8.0% (19.1%) 100.0% (9.8%) 0.7% . STATE TEACHERS’ RETIREMENT PLAN FINANCIAL STATEMENTS The Statement of Changes in Fiduciary Net Position The Statement of Changes in Fiduciary Net Position shows how CalSTRS’ net position changed during the fiscal year, reflecting contributions earned, benefit payments made, investment returns, and the costs of plan administration. State Teachers’ Retirement Plan Consolidated Statement of Changes in Fiduciary Net Position (Dollars in Thousands) ADDITIONS Member Contributions Employer Contributions State of California Net Investment Income Other TOTAL ADDITIONS 2015 $2,509,712 2,677,815 1,425,796 7,611,644 3,935 $14,228,902 2014 $2,263,613 2,272,166 1,383,468 30,401,903 2,055 $36,323,205 Percent Change 10.9% 17.9% 3.1% (75.0%) 91.5% (60.8%) DEDUCTIONS Benefit Payments Refunds of Contributions Administrative Expenses Other TOTAL DEDUCTIONS 12,476,902 87,694 145,239 8,840 $12,718,675 11,927,556 107,600 154,155 8,787 $12,198,098 4.6% (18.5%) (5.8%) 0.6% 4.3% 1,510,227 190,474,016 (161,907) 190,312,109 $191,822,336 24,125,107 166,348,909 — $166,348,909 $190,474,016 (93.7%) 14.5% 100.0% 14.4% 0.7% NET POSITION INCREASE BEGINNING NET POSITION - as previously reported Adjustment for Application of GASB 68 BEGINNING NET POSITION - as adjusted ENDING NET POSITION Total net position for the State Teachers’ Retirement Plan (STRP) increased by $1.3 billion, or 0.7 percent, to $191.8 billion. Changes in net position are primarily caused by three factors—contributions, investment income and benefit payments. Total contributions for the current fiscal year increased by $694.0 million (11.7 percent) due to increases in both creditable compensation and contribution rates implemented through AB 1469. Net investment income for the STRP decreased by $22.8 billion, or 75.0 percent, to $7.6 billion due to modest investment returns this year as compared to the robust returns of the prior year. The increase in contributions and modest investment returns were offset by a 4.6 percent ($549.3 million) increase in benefit payments. Other Funds and Program The above financials are for the STRP, which consists of Defined Benefit Program, Defined Benefit Supplement Program, Cash Balance Benefit Program and Replacement Benefit Program. CalSTRS Pension2 Program is shown on Page 7. For the Teachers’ Health Benefits Fund and Teachers’ Deferred Compensation Fund, please refer to the 2015 Comprehensive Annual Financial Report. Note: The 2015 Popular Annual Financial Report contains summarized information from the 2015 Comprehensive Annual Financial Report. The CAFR can be viewed online at CalSTRS.com/CAFR. CalSTRS Popular Annual Financial Report 2015 5 .
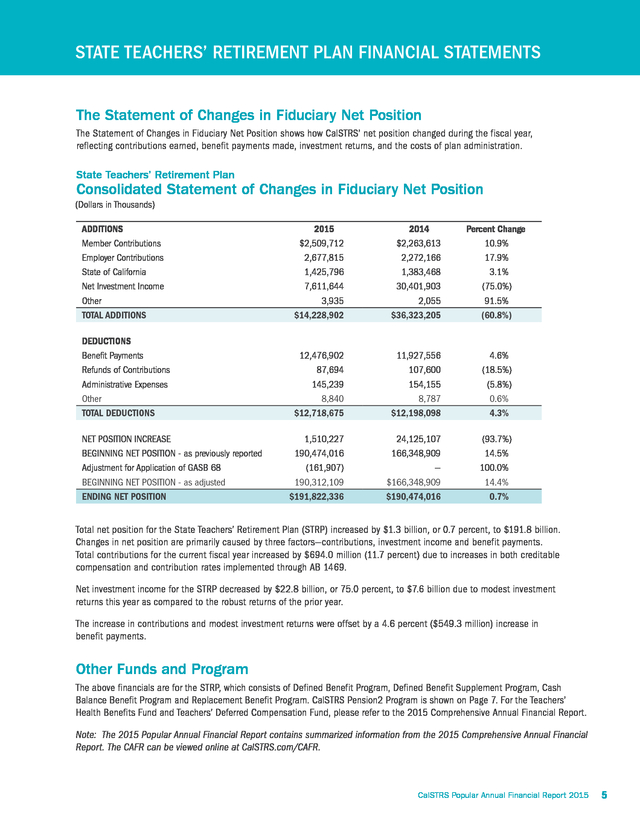
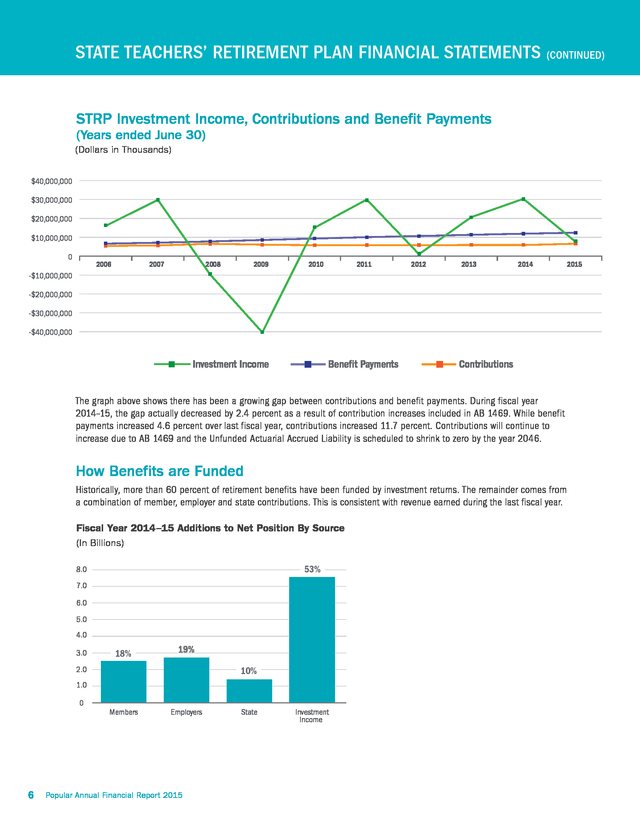
STATE TEACHERS’ RETIREMENT PLAN FINANCIAL STATEMENTS (CONTINUED) STRP Investment Income, Contributions and Benefit Payments (Years ended June 30) (Dollars in Thousands) $40,000,000 $30,000,000 $20,000,000 $10,000,000 0 2006 2007 2008 2009 2010 2011 2012 2013 2014 -$10,000,000 -$20,000,000 -$30,000,000 -$40,000,000 Investment Income Benefit Payments Contributions The graph above shows there has been a growing gap between contributions and benefit payments. During fiscal year 2014–15, the gap actually decreased by 2.4 percent as a result of contribution increases included in AB 1469. While benefit payments increased 4.6 percent over last fiscal year, contributions increased 11.7 percent. Contributions will continue to increase due to AB 1469 and the Unfunded Actuarial Accrued Liability is scheduled to shrink to zero by the year 2046. How Benefits are Funded Historically, more than 60 percent of retirement benefits have been funded by investment returns.
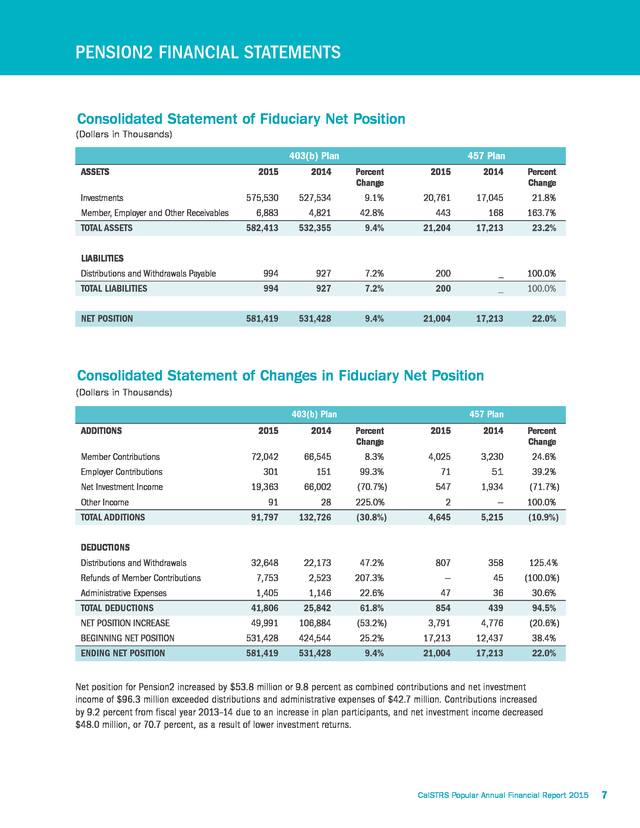
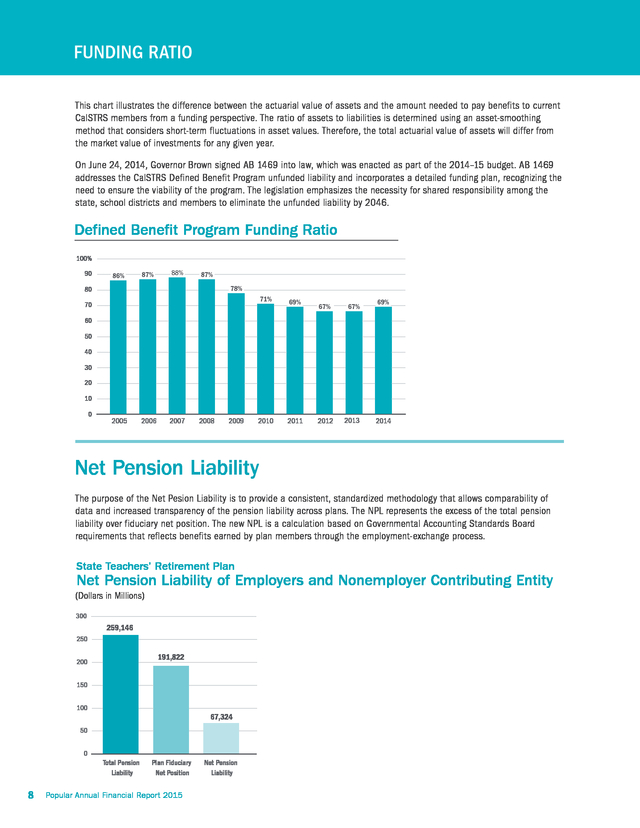
The remainder comes from a combination of member, employer and state contributions. This is consistent with revenue earned during the last fiscal year. Fiscal Year 2014–15 Additions to Net Position By Source (In Billions) 53% 8.0 7.0 6.0 5.0 4.0 3.0 18% 19% 2.0 10% 1.0 0 6 Members Employers Popular Annual Financial Report 2015 State Investment Income 2015 . PENSION2 FINANCIAL STATEMENTS Consolidated Statement of Fiduciary Net Position (Dollars in Thousands) 403(b) Plan ASSETS Investments Member, Employer and Other Receivables TOTAL ASSETS 2015 2014 575,530 6,883 582,413 457 Plan Percent Change 2015 2014 Percent Change 527,534 9.1% 20,761 17,045 21.8% 4,821 42.8% 443 168 163.7% 532,355 9.4% 21,204 17,213 23.2% LIABILITIES Distributions and Withdrawals Payable 994 927 7.2% 200 _ 100.0% TOTAL LIABILITIES 994 927 7.2% 200 _ 100.0% 581,419 531,428 9.4% 21,004 17,213 22.0% NET POSITION Consolidated Statement of Changes in Fiduciary Net Position (Dollars in Thousands) 403(b) Plan ADDITIONS 2015 2014 457 Plan Percent Change 2015 2014 Percent Change Member Contributions 72,042 66,545 8.3% 4,025 3,230 24.6% Employer Contributions 301 151 99.3% 71 51 39.2% Net Investment Income 19,363 66,002 (70.7%) 547 1,934 91 28 225.0% 2 — 100.0% 91,797 132,726 (30.8%) 4,645 5,215 (10.9%) Other Income TOTAL ADDITIONS (71.7%) DEDUCTIONS 32,648 22,173 47.2% 807 358 125.4% Refunds of Member Contributions Distributions and Withdrawals 7,753 2,523 207.3% — 45 (100.0%) Administrative Expenses 1,405 1,146 22.6% 47 36 30.6% TOTAL DEDUCTIONS 41,806 25,842 61.8% NET POSITION INCREASE 49,991 106,884 (53.2%) 854 439 3,791 4,776 (20.6%) 94.5% BEGINNING NET POSITION 531,428 424,544 25.2% 17,213 12,437 38.4% ENDING NET POSITION 581,419 531,428 9.4% 21,004 17,213 22.0% Net position for Pension2 increased by $53.8 million or 9.8 percent as combined contributions and net investment income of $96.3 million exceeded distributions and administrative expenses of $42.7 million. Contributions increased by 9.2 percent from fiscal year 2013–14 due to an increase in plan participants, and net investment income decreased $48.0 million, or 70.7 percent, as a result of lower investment returns. CalSTRS Popular Annual Financial Report 2015 7 . FUNDING RATIO This chart illustrates the difference between the actuarial value of assets and the amount needed to pay benefits to current CalSTRS members from a funding perspective. The ratio of assets to liabilities is determined using an asset-smoothing method that considers short-term fluctuations in asset values. Therefore, the total actuarial value of assets will differ from the market value of investments for any given year. On June 24, 2014, Governor Brown signed AB 1469 into law, which was enacted as part of the 2014–15 budget. AB 1469 addresses the CalSTRS Defined Benefit Program unfunded liability and incorporates a detailed funding plan, recognizing the need to ensure the viability of the program.
The legislation emphasizes the necessity for shared responsibility among the state, school districts and members to eliminate the unfunded liability by 2046. Defined Benefit Program Funding Ratio 100% 90 86% 87% 88% 87% 78% 80 71% 69% 2010 2011 70 67% 67% 2012 2013 69% 60 50 40 30 20 10 0 2005 2006 2007 2008 2009 2014 Net Pension Liability The purpose of the Net Pesion Liability is to provide a consistent, standardized methodology that allows comparability of data and increased transparency of the pension liability across plans. The NPL represents the excess of the total pension liability over fiduciary net position. The new NPL is a calculation based on Governmental Accounting Standards Board requirements that reflects benefits earned by plan members through the employment-exchange process. State Teachers’ Retirement Plan Net Pension Liability of Employers and Nonemployer Contributing Entity (Dollars in Millions) 300 259,146 250 191,822 200 150 100 67,324 50 0 Total Pension Liability 8 Plan Fiduciary Net Position Popular Annual Financial Report 2015 Net Pension Liability .
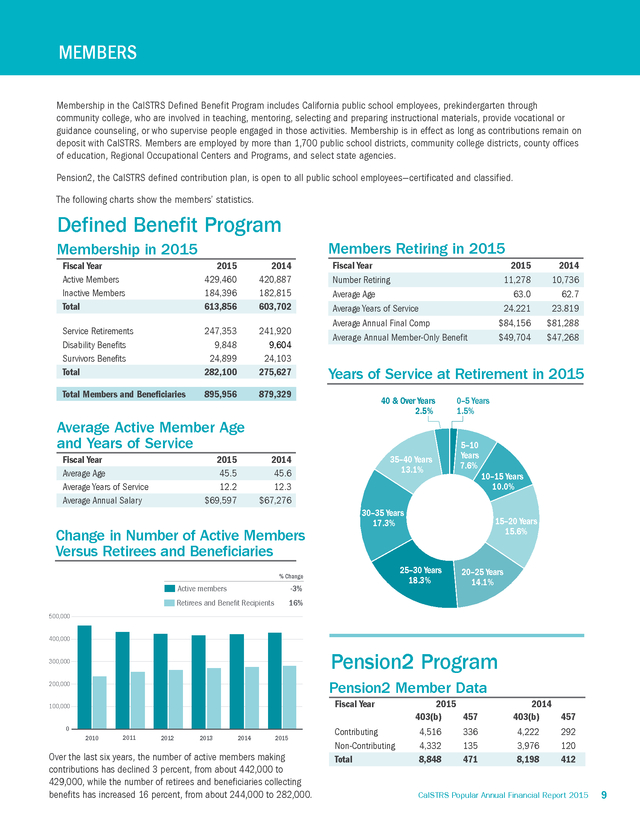
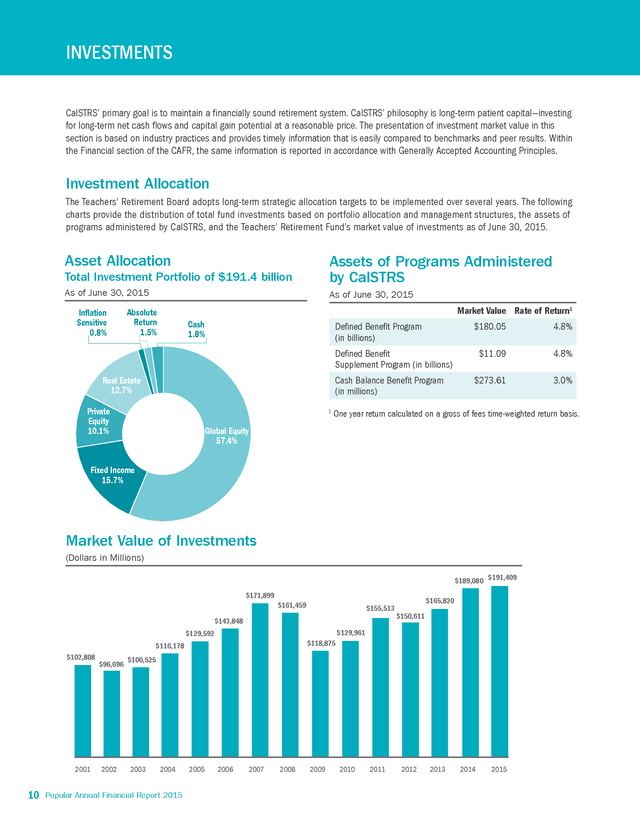
MEMBERS Membership in the CalSTRS Defined Benefit Program includes California public school employees, prekindergarten through community college, who are involved in teaching, mentoring, selecting and preparing instructional materials, provide vocational or guidance counseling, or who supervise people engaged in those activities. Membership is in effect as long as contributions remain on deposit with CalSTRS. Members are employed by more than 1,700 public school districts, community college districts, county offices of education, Regional Occupational Centers and Programs, and select state agencies. Pension2, the CalSTRS defined contribution plan, is open to all public school employees—certificated and classified. The following charts show the members’ statistics. Defined Benefit Program Members Retiring in 2015 Membership in 2015 Fiscal Year Active Members Inactive Members Total 2015 429,460 184,396 613,856 2014 420,887 182,815 603,702 Service Retirements Disability Benefits Survivors Benefits Total 247,353 9,848 24,899 282,100 241,920 9,604 24,103 275,627 Absolute Inflation Total Members and Beneficiaries Return Sensitive 1.5% 0.8% 895,956 Cash 1.8% 879,329 Fiscal Year Real Estate 12.7% Average Age Average Years of Service Private Average Annual Salary Equity 10.1% 2015 2014 45.5 45.6 12.2 12.3 $69,597 $67,276 Global Equity 57.4% Fiscal Year Number Retiring Average Age Average Years of Service Average Annual Final Comp Average Annual Member-Only Benefit 40 & Over Years 2.5% 35–40 Years 13.1% 5–10 Years 7.6% 10–15 Years 10.0% 15–20 Years 15.6% 25–30 Years 18.3% % Change Active members 0–5 Years 1.5% 30–35 Years 17.3% 15.7% -3% Retirees and Benefit Recipients 2014 10,736 62.7 23.819 $81,288 $47,268 Years of Service at Retirement in 2015 Average Active Member Age and Years of Service Change in Number of Active Members Versus Retirees and Beneficiaries Fixed Income 2015 11,278 63.0 24.221 $84,156 $49,704 20–25 Years 14.1% 16% 500,000 400,000 Pension2 Program 300,000 Pension2 Member Data 200,000 Fiscal Year 100,000 0 2010 2011 2012 2013 2014 2015 Over the last six years, the number of active members making contributions has declined 3 percent, from about 442,000 to 429,000, while the number of retirees and beneficiaries collecting benefits has increased 16 percent, from about 244,000 to 282,000. Contributing Non-Contributing Total 2015 403(b) 457 4,516 4,332 8,848 336 135 471 2014 403(b) 457 4,222 3,976 8,198 292 120 412 CalSTRS Popular Annual Financial Report 2015 9 . INVESTMENTS CalSTRS’ primary goal is to maintain a financially sound retirement system. CalSTRS’ philosophy is long-term patient capital—investing for long-term net cash flows and capital gain potential at a reasonable price. The presentation of investment market value in this section is based on industry practices and provides timely information that is easily compared to benchmarks and peer results. Within the Financial section of the CAFR, the same information is reported in accordance with Generally Accepted Accounting Principles. Investment Allocation The Teachers’ Retirement Board adopts long-term strategic allocation targets to be implemented over several years.
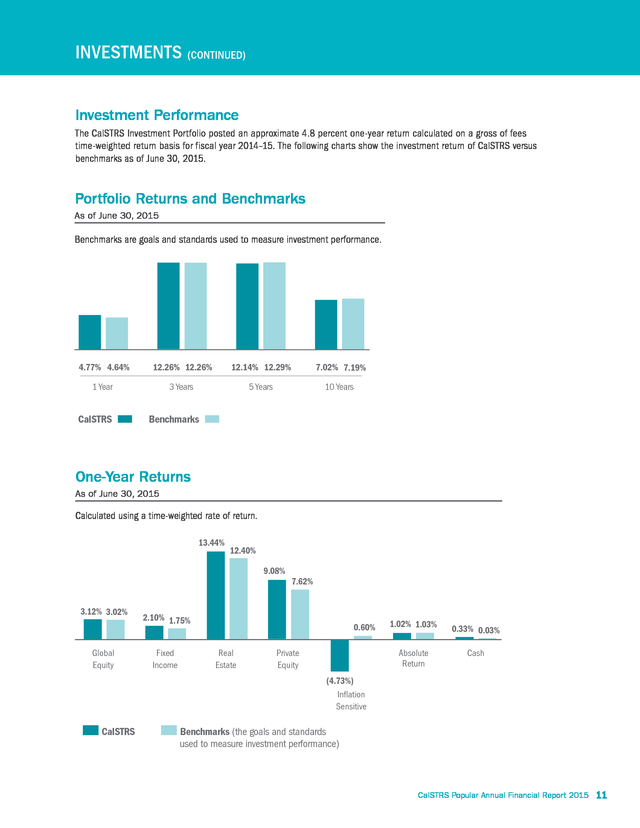
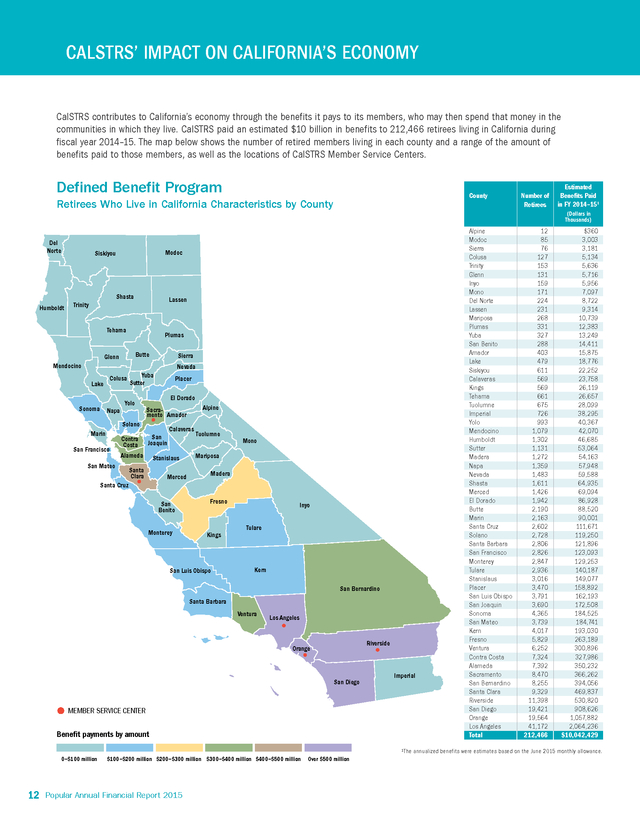
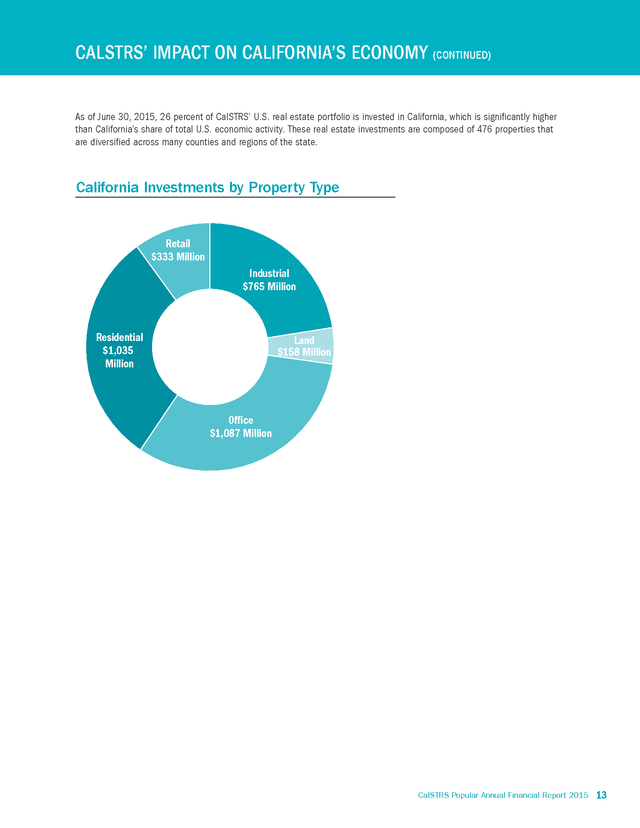
The following charts provide the distribution of total fund investments based on portfolio allocation and management structures, the assets of programs administered by CalSTRS, and the Teachers’ Retirement Fund’s market value of investments as of June 30, 2015. Asset Allocation Total Investment Portfolio of $191.4 billion Assets of Programs Administered by CalSTRS As of June 30, 2015 As of June 30, 2015 Inflation Sensitive 0.8% Market Value Rate of Return1 Absolute Return 1.5% 0–5 Years 40 & Over Years Defined Benefit2.5% Program 1.5% Cash 1.8% $180.05 4.8% $11.09 4.8% 35–40 Years Cash Balance Benefit Program $273.61 7.6% (in millions)13.1% 10–15 Years 3.0% (in billions) Defined Benefit 5–10 Supplement Program (in billions) Years Real Estate 12.7% Private Equity 10.1% 1 10.0% One year return calculated on a gross of fees time-weighted return basis. 30–35 Years 17.3% Global Equity 57.4% Fixed Income 15.7% 15–20 Years 15.6% 25–30 Years 18.3% 20–25 Years 14.1% Market Value of Investments (Dollars in Millions) $189,080 $191,409 $171,899 $161,459 $155,513 $143,848 $129,961 $129,592 $118,875 $116,178 $102,808 2001 10 $96,696 2002 $165,820 $150,611 $100,525 2003 2004 Popular Annual Financial Report 2015 2005 2006 2007 2008 2009 2010 2011 2012 2013 2014 2015 . INVESTMENTS (CONTINUED) Investment Performance The CalSTRS Investment Portfolio posted an approximate 4.8 percent one-year return calculated on a gross of fees time-weighted return basis for fiscal year 2014–15. The following charts show the investment return of CalSTRS versus benchmarks as of June 30, 2015. Portfolio Returns and Benchmarks As of June 30, 2015 Benchmarks are goals and standards used to measure investment performance. 4.77% 4.64% 12.26% 12.26% 12.14% 12.29% 7.02% 7.19% 1 Year 3 Years 5 Years 10 Years CalSTRS Benchmarks One-Year Returns As of June 30, 2015 Calculated using a time-weighted rate of return. 13.44% 12.40% 9.08% 3.12% 3.02% Global Equity 7.62% 2.10% 1.75% Fixed Income 0.60% Real Estate Private Equity 1.02% 1.03% Absolute Return 0.33% 0.03% Cash (4.73%) Inflation Sensitive CalSTRS Benchmarks (the goals and standards used to measure investment performance) CalSTRS Popular Annual Financial Report 2015 11 . CALSTRS’ IMPACT ON CALIFORNIA’S ECONOMY CalSTRS contributes to California’s economy through the benefits it pays to its members, who may then spend that money in the communities in which they live. CalSTRS paid an estimated $10 billion in benefits to 212,466 retirees living in California during fiscal year 2014–15. The map below shows the number of retired members living in each county and a range of the amount of benefits paid to those members, as well as the locations of CalSTRS Member Service Centers. Defined Benefit Program County Retirees Who Live in California Characteristics by County Del Norte Shasta Humboldt Lassen Trinity Tehama Plumas Butte Glenn Sierra Mendocino Nevada Colusa Lake Sonoma Napa Yuba Sutter Yolo Placer El Dorado Solano Marin San Francisco Contra Costa Calaveras San Joaquin Alameda San Mateo Alpine Sacramento Amador Stanislaus Santa Clara Merced Tuolumne Mono Mariposa Madera Santa Cruz San Benito Monterey Fresno Kings San Luis Obispo Inyo Tulare Kern San Bernardino Santa Barbara Ventura Estimated Benefits Paid in FY 2014–151 (Dollars in Thousands) Modoc Siskiyou Number of Retirees Los Angeles Riverside Orange San Diego MEMBER SERVICE CENTER Benefit payments by amount Imperial Alpine Modoc Sierra Colusa Trinity Glenn Inyo Mono Del Norte Lassen Mariposa Plumas Yuba San Benito Amador Lake Siskiyou Calaveras Kings Tehama Tuolumne Imperial Yolo Mendocino Humboldt Sutter Madera Napa Nevada Shasta Merced El Dorado Butte Marin Santa Cruz Solano Santa Barbara San Francisco Monterey Tulare Stanislaus Placer San Luis Obispo San Joaquin Sonoma San Mateo Kern Fresno Ventura Contra Costa Alameda Sacramento San Bernardino Santa Clara Riverside San Diego Orange Los Angeles Total 12 85 76 127 153 131 159 171 224 231 268 331 327 288 403 479 611 569 569 661 675 726 993 1,079 1,302 1,131 1,272 1,359 1,483 1,611 1,426 1,942 2,190 2,163 2,602 2,728 2,806 2,826 2,847 2,936 3,016 3,470 3,791 3,690 4,365 3,739 4,017 5,829 6,252 7,324 7,392 8,470 8,255 9,329 11,398 19,421 19,564 41,172 212,466 $360 3,003 3,181 5,134 5,636 5,716 5,956 7,097 8,722 9,314 10,739 12,383 13,249 14,411 15,875 18,776 22,252 23,758 26,119 26,657 28,099 38,295 40,367 42,070 46,685 53,064 54,163 57,948 59,588 64,935 69,094 86,928 88,520 90,001 111,671 119,250 121,896 123,093 129,253 140,187 149,077 158,892 162,193 172,508 184,525 184,741 193,030 263,189 300,896 327,986 350,232 366,262 394,056 469,837 530,820 908,626 1,057,882 2,064,236 $10,042,429 ¹The annualized benefits were estimates based on the June 2015 monthly allowance. 0−$100 million 12 $100−$200 million $200−$300 million $300−$400 million $400−$500 million Popular Annual Financial Report 2015 Over $500 million . CALSTRS’ IMPACT ON CALIFORNIA’S ECONOMY (CONTINUED) As of June 30, 2015, 26 percent of CalSTRS’ U.S. real estate portfolio is invested in California, which is significantly higher than California’s share of total U.S. economic activity. These real estate investments are composed of 476 properties that are diversified across many counties and regions of the state. California Investments by Property Type Retail $333 Million Industrial $765 Million Residential $1,035 Million Land $158 Million Office $1,087 Million CalSTRS Popular Annual Financial Report 2015 13 .
CalSTRS Resources WEB CalSTRS.com Click Contact Us to email myCalSTRS.com Legislation The following retirement-related legislation was passed during fiscal year 2014–15: 403bCompare.com Pension2.com CALL 800-228-5453 7 a.m. to 6 p.m. Monday through Friday 916-414-1099 Calls from outside the U.S. 888-394-2060 CalSTRS Pension2® Personal Wealth Plan 855-844-2468 (toll free) Pension Abuse Reporting Hotline WRITE CalSTRS P.O. Box 15275 Sacramento, CA 95851-0275 VISIT Member Services 100 Waterfront Place West Sacramento, CA 95605 Find your nearest CalSTRS office at CalSTRS.com/localoffices Public Divestiture of Thermal Coal Companies Act SB 185 (De León) Requires the CalSTRS and CalPERS boards to engage with thermal coal companies, as defined, and to divest the public employee retirement funds of any investments in thermal coal companies. It also prohibits additional or new investments or the renewal of existing investments in thermal coal companies. Windfall Elimination Provision/Government Pension Offset Resolution SJR 1 (Beall) Requests the President and Congress to enact legislation repealing the Government Pension Offset and the Windfall Elimination Provision from the Social Security Act. Omnibus Bill SB 1220 (Torres) FAX 916-414-5040 STAY CONNECTED Makes various technical, conforming, or minor amendments necessary for continued effective administration of the State Teachers’ Retirement Plan. Sponsor: CalSTRS. .
Due to the new funding structure enacted in Chapter 47, Statutes of 2014 (Assembly Bill 1469-Bonta), CalSTRS no longer projects a fund depletion date. Instead, the Defined Benefit Program is projected to be fully funded by 2046. A snapshot of the Defined Benefit Program’s assets and liabilities as reported in the June 30, 2014 actuarial valuation, reflects a decrease of about $1 billion in the unfunded liability, now at $72.7 billion. Last year’s projections marked the funding shortfall at $73.7 billion.
This year’s actuarial valuation also shows a 1.6 percent increase in the funded ratio from 66.9 percent to 68.5 percent. Much of the study’s discussion concerns strategies to mitigate the risk of future market declines, with a focus on the effect of dramatic equity declines like those of the past decade. It is important to keep in mind that as liabilities are being paid down, the fund remains sensitive to asset return volatility and large, negative returns. Lessons learned from the dot-com bust in 2001 and the economic turmoil from the 2008–09 market crash serve to remind us of how heavy losses during significant downturns can negatively affect the fund. At CalSTRS we are stewards of the hard-earned savings California’s educators contribute toward their retirement and have entrusted to us. CalSTRS is a long-term investor and ultimately our goal is to generate returns sufficient to meet the plan’s liabilities for the benefit of our members. We diversify our portfolio with holdings throughout the world to maximize our returns and continually seek proven and innovative ways to mitigate risk. Respectfully submitted, Chief Executive Officer Securing the financial future and sustaining the trust of California’s educators. .
AWARD: GFOA CERTIFICATE 2 Popular Annual Financial Report 2015 . TEACHERS’ RETIREMENT BOARD (AS OF JUNE 30, 2015 ) HARRY KEILEY Board Chair K–12 Classroom Teacher Term: 01/01/12–12/31/15 SHARON HENDRICKS Board Vice Chair Community College Instructor Term: 01/01/12–12/31/15 MICHAEL COHEN Director of Finance Ex-Officio Member JOHN CHIANG State Treasurer Ex-Officio Member DANA DILLON K–12 Classroom Teacher Term: 01/01/12–12/31/15 JOY HIGA Public Representative Term: 01/27/14–12/31/17 PAUL ROSENSTIEL Public Representative Term: 01/01/15–12/31/18 TOM TORLAKSON State Superintendent of Public Instruction Ex-Officio Member THOMAS UNTERMAN Public Representative Term: 07/03/13–12/31/15 BETTY YEE State Controller Ex-Officio Member NORA E. VARGAS School Board Representative Term: 04/23/15–12/31/2015 The Teachers’ Retirement Board has exclusive control over the administration of the retirement system plans and the investment of funds. The board makes rules, sets policies, and has the power and authority to hear and determine all facts pertaining to applications for benefits under the retirement system. It is comprised of 12 members: â— Five members appointed by the Governor: one member currently serving on a school board, one retired CalSTRS member, and three public members; â— Four ex-officio members: the Superintendent of Public Instruction, the State Treasurer, the State Controller, and the Director of Finance; and â— Three members elected by CalSTRS membership. A new governor-appointed school board representative joined the board in April 2015, and one governor-appointed position remains open as of June 30, 2015. CalSTRS Popular Annual Financial Report 2015 3 .
YourFinancial Summary reward—a secure retirement. Our reward—getting you there. The Statement of Fiduciary Net Position The Statement of Fiduciary Net Position presents information on all of CalSTRS assets and liabilities, with the difference between the two reported as net position. Financial Summary The Statement of Fiduciary Net Position The Statement of Fiduciary Net Position presents information on all of CalSTRS’ assets and liabilities, with the difference between the two reported as net position. State Teachers’ Retirement Plan Consolidated Statement of Fiduciary Net Position (Dollars in Thousands) ASSETS AND DEFERRED OUTFLOWS OF RESOURCES Investments 1 Cash Investment Receivables Member, Employer and Other Receivables Capital and Other Assets Deferred Outflows of Resources TOTAL ASSETS AND DEFERRED OUTFLOWS OF RESOURCES LIABILITIES AND DEFERRED INFLOWS OF RESOURCES Benefits in Process of Payment Investment Payables Loan Payable Net pension and OPEB Obligation Other Securities Lending Obligation Deferred Inflows of Resources TOTAL LIABILITIES AND DEFERRED INFLOWS OF RESOURCES NET POSITION 1 4 2015 $211,960,086 359,992 3,461,566 545,570 226,167 16,398 $216,569,779 2014 $214,193,243 287,965 2,637,163 572,831 229,080 — $217,920,282 1,178,524 3,725,966 1,447,405 213,427 111,854 18,043,187 27,080 $24,747,443 1,121,034 2,908,250 944,269 57,800 103,615 22,311,298 — $27,446,266 $191,822,336 $190,474,016 Includes securities lending collateral of $18 billion and $22.3 billion for 2015 and 2014, respectively. Popular Annual Financial Report 2015 Percent Change (1.0%) 25.0% 31.3% (4.8%) (1.3%) 100% (0.6%) 5.1% 28.1% 53.3% 269.3% 8.0% (19.1%) 100.0% (9.8%) 0.7% . STATE TEACHERS’ RETIREMENT PLAN FINANCIAL STATEMENTS The Statement of Changes in Fiduciary Net Position The Statement of Changes in Fiduciary Net Position shows how CalSTRS’ net position changed during the fiscal year, reflecting contributions earned, benefit payments made, investment returns, and the costs of plan administration. State Teachers’ Retirement Plan Consolidated Statement of Changes in Fiduciary Net Position (Dollars in Thousands) ADDITIONS Member Contributions Employer Contributions State of California Net Investment Income Other TOTAL ADDITIONS 2015 $2,509,712 2,677,815 1,425,796 7,611,644 3,935 $14,228,902 2014 $2,263,613 2,272,166 1,383,468 30,401,903 2,055 $36,323,205 Percent Change 10.9% 17.9% 3.1% (75.0%) 91.5% (60.8%) DEDUCTIONS Benefit Payments Refunds of Contributions Administrative Expenses Other TOTAL DEDUCTIONS 12,476,902 87,694 145,239 8,840 $12,718,675 11,927,556 107,600 154,155 8,787 $12,198,098 4.6% (18.5%) (5.8%) 0.6% 4.3% 1,510,227 190,474,016 (161,907) 190,312,109 $191,822,336 24,125,107 166,348,909 — $166,348,909 $190,474,016 (93.7%) 14.5% 100.0% 14.4% 0.7% NET POSITION INCREASE BEGINNING NET POSITION - as previously reported Adjustment for Application of GASB 68 BEGINNING NET POSITION - as adjusted ENDING NET POSITION Total net position for the State Teachers’ Retirement Plan (STRP) increased by $1.3 billion, or 0.7 percent, to $191.8 billion. Changes in net position are primarily caused by three factors—contributions, investment income and benefit payments. Total contributions for the current fiscal year increased by $694.0 million (11.7 percent) due to increases in both creditable compensation and contribution rates implemented through AB 1469. Net investment income for the STRP decreased by $22.8 billion, or 75.0 percent, to $7.6 billion due to modest investment returns this year as compared to the robust returns of the prior year. The increase in contributions and modest investment returns were offset by a 4.6 percent ($549.3 million) increase in benefit payments. Other Funds and Program The above financials are for the STRP, which consists of Defined Benefit Program, Defined Benefit Supplement Program, Cash Balance Benefit Program and Replacement Benefit Program. CalSTRS Pension2 Program is shown on Page 7. For the Teachers’ Health Benefits Fund and Teachers’ Deferred Compensation Fund, please refer to the 2015 Comprehensive Annual Financial Report. Note: The 2015 Popular Annual Financial Report contains summarized information from the 2015 Comprehensive Annual Financial Report. The CAFR can be viewed online at CalSTRS.com/CAFR. CalSTRS Popular Annual Financial Report 2015 5 .
STATE TEACHERS’ RETIREMENT PLAN FINANCIAL STATEMENTS (CONTINUED) STRP Investment Income, Contributions and Benefit Payments (Years ended June 30) (Dollars in Thousands) $40,000,000 $30,000,000 $20,000,000 $10,000,000 0 2006 2007 2008 2009 2010 2011 2012 2013 2014 -$10,000,000 -$20,000,000 -$30,000,000 -$40,000,000 Investment Income Benefit Payments Contributions The graph above shows there has been a growing gap between contributions and benefit payments. During fiscal year 2014–15, the gap actually decreased by 2.4 percent as a result of contribution increases included in AB 1469. While benefit payments increased 4.6 percent over last fiscal year, contributions increased 11.7 percent. Contributions will continue to increase due to AB 1469 and the Unfunded Actuarial Accrued Liability is scheduled to shrink to zero by the year 2046. How Benefits are Funded Historically, more than 60 percent of retirement benefits have been funded by investment returns.
The remainder comes from a combination of member, employer and state contributions. This is consistent with revenue earned during the last fiscal year. Fiscal Year 2014–15 Additions to Net Position By Source (In Billions) 53% 8.0 7.0 6.0 5.0 4.0 3.0 18% 19% 2.0 10% 1.0 0 6 Members Employers Popular Annual Financial Report 2015 State Investment Income 2015 . PENSION2 FINANCIAL STATEMENTS Consolidated Statement of Fiduciary Net Position (Dollars in Thousands) 403(b) Plan ASSETS Investments Member, Employer and Other Receivables TOTAL ASSETS 2015 2014 575,530 6,883 582,413 457 Plan Percent Change 2015 2014 Percent Change 527,534 9.1% 20,761 17,045 21.8% 4,821 42.8% 443 168 163.7% 532,355 9.4% 21,204 17,213 23.2% LIABILITIES Distributions and Withdrawals Payable 994 927 7.2% 200 _ 100.0% TOTAL LIABILITIES 994 927 7.2% 200 _ 100.0% 581,419 531,428 9.4% 21,004 17,213 22.0% NET POSITION Consolidated Statement of Changes in Fiduciary Net Position (Dollars in Thousands) 403(b) Plan ADDITIONS 2015 2014 457 Plan Percent Change 2015 2014 Percent Change Member Contributions 72,042 66,545 8.3% 4,025 3,230 24.6% Employer Contributions 301 151 99.3% 71 51 39.2% Net Investment Income 19,363 66,002 (70.7%) 547 1,934 91 28 225.0% 2 — 100.0% 91,797 132,726 (30.8%) 4,645 5,215 (10.9%) Other Income TOTAL ADDITIONS (71.7%) DEDUCTIONS 32,648 22,173 47.2% 807 358 125.4% Refunds of Member Contributions Distributions and Withdrawals 7,753 2,523 207.3% — 45 (100.0%) Administrative Expenses 1,405 1,146 22.6% 47 36 30.6% TOTAL DEDUCTIONS 41,806 25,842 61.8% NET POSITION INCREASE 49,991 106,884 (53.2%) 854 439 3,791 4,776 (20.6%) 94.5% BEGINNING NET POSITION 531,428 424,544 25.2% 17,213 12,437 38.4% ENDING NET POSITION 581,419 531,428 9.4% 21,004 17,213 22.0% Net position for Pension2 increased by $53.8 million or 9.8 percent as combined contributions and net investment income of $96.3 million exceeded distributions and administrative expenses of $42.7 million. Contributions increased by 9.2 percent from fiscal year 2013–14 due to an increase in plan participants, and net investment income decreased $48.0 million, or 70.7 percent, as a result of lower investment returns. CalSTRS Popular Annual Financial Report 2015 7 . FUNDING RATIO This chart illustrates the difference between the actuarial value of assets and the amount needed to pay benefits to current CalSTRS members from a funding perspective. The ratio of assets to liabilities is determined using an asset-smoothing method that considers short-term fluctuations in asset values. Therefore, the total actuarial value of assets will differ from the market value of investments for any given year. On June 24, 2014, Governor Brown signed AB 1469 into law, which was enacted as part of the 2014–15 budget. AB 1469 addresses the CalSTRS Defined Benefit Program unfunded liability and incorporates a detailed funding plan, recognizing the need to ensure the viability of the program.
The legislation emphasizes the necessity for shared responsibility among the state, school districts and members to eliminate the unfunded liability by 2046. Defined Benefit Program Funding Ratio 100% 90 86% 87% 88% 87% 78% 80 71% 69% 2010 2011 70 67% 67% 2012 2013 69% 60 50 40 30 20 10 0 2005 2006 2007 2008 2009 2014 Net Pension Liability The purpose of the Net Pesion Liability is to provide a consistent, standardized methodology that allows comparability of data and increased transparency of the pension liability across plans. The NPL represents the excess of the total pension liability over fiduciary net position. The new NPL is a calculation based on Governmental Accounting Standards Board requirements that reflects benefits earned by plan members through the employment-exchange process. State Teachers’ Retirement Plan Net Pension Liability of Employers and Nonemployer Contributing Entity (Dollars in Millions) 300 259,146 250 191,822 200 150 100 67,324 50 0 Total Pension Liability 8 Plan Fiduciary Net Position Popular Annual Financial Report 2015 Net Pension Liability .
MEMBERS Membership in the CalSTRS Defined Benefit Program includes California public school employees, prekindergarten through community college, who are involved in teaching, mentoring, selecting and preparing instructional materials, provide vocational or guidance counseling, or who supervise people engaged in those activities. Membership is in effect as long as contributions remain on deposit with CalSTRS. Members are employed by more than 1,700 public school districts, community college districts, county offices of education, Regional Occupational Centers and Programs, and select state agencies. Pension2, the CalSTRS defined contribution plan, is open to all public school employees—certificated and classified. The following charts show the members’ statistics. Defined Benefit Program Members Retiring in 2015 Membership in 2015 Fiscal Year Active Members Inactive Members Total 2015 429,460 184,396 613,856 2014 420,887 182,815 603,702 Service Retirements Disability Benefits Survivors Benefits Total 247,353 9,848 24,899 282,100 241,920 9,604 24,103 275,627 Absolute Inflation Total Members and Beneficiaries Return Sensitive 1.5% 0.8% 895,956 Cash 1.8% 879,329 Fiscal Year Real Estate 12.7% Average Age Average Years of Service Private Average Annual Salary Equity 10.1% 2015 2014 45.5 45.6 12.2 12.3 $69,597 $67,276 Global Equity 57.4% Fiscal Year Number Retiring Average Age Average Years of Service Average Annual Final Comp Average Annual Member-Only Benefit 40 & Over Years 2.5% 35–40 Years 13.1% 5–10 Years 7.6% 10–15 Years 10.0% 15–20 Years 15.6% 25–30 Years 18.3% % Change Active members 0–5 Years 1.5% 30–35 Years 17.3% 15.7% -3% Retirees and Benefit Recipients 2014 10,736 62.7 23.819 $81,288 $47,268 Years of Service at Retirement in 2015 Average Active Member Age and Years of Service Change in Number of Active Members Versus Retirees and Beneficiaries Fixed Income 2015 11,278 63.0 24.221 $84,156 $49,704 20–25 Years 14.1% 16% 500,000 400,000 Pension2 Program 300,000 Pension2 Member Data 200,000 Fiscal Year 100,000 0 2010 2011 2012 2013 2014 2015 Over the last six years, the number of active members making contributions has declined 3 percent, from about 442,000 to 429,000, while the number of retirees and beneficiaries collecting benefits has increased 16 percent, from about 244,000 to 282,000. Contributing Non-Contributing Total 2015 403(b) 457 4,516 4,332 8,848 336 135 471 2014 403(b) 457 4,222 3,976 8,198 292 120 412 CalSTRS Popular Annual Financial Report 2015 9 . INVESTMENTS CalSTRS’ primary goal is to maintain a financially sound retirement system. CalSTRS’ philosophy is long-term patient capital—investing for long-term net cash flows and capital gain potential at a reasonable price. The presentation of investment market value in this section is based on industry practices and provides timely information that is easily compared to benchmarks and peer results. Within the Financial section of the CAFR, the same information is reported in accordance with Generally Accepted Accounting Principles. Investment Allocation The Teachers’ Retirement Board adopts long-term strategic allocation targets to be implemented over several years.
The following charts provide the distribution of total fund investments based on portfolio allocation and management structures, the assets of programs administered by CalSTRS, and the Teachers’ Retirement Fund’s market value of investments as of June 30, 2015. Asset Allocation Total Investment Portfolio of $191.4 billion Assets of Programs Administered by CalSTRS As of June 30, 2015 As of June 30, 2015 Inflation Sensitive 0.8% Market Value Rate of Return1 Absolute Return 1.5% 0–5 Years 40 & Over Years Defined Benefit2.5% Program 1.5% Cash 1.8% $180.05 4.8% $11.09 4.8% 35–40 Years Cash Balance Benefit Program $273.61 7.6% (in millions)13.1% 10–15 Years 3.0% (in billions) Defined Benefit 5–10 Supplement Program (in billions) Years Real Estate 12.7% Private Equity 10.1% 1 10.0% One year return calculated on a gross of fees time-weighted return basis. 30–35 Years 17.3% Global Equity 57.4% Fixed Income 15.7% 15–20 Years 15.6% 25–30 Years 18.3% 20–25 Years 14.1% Market Value of Investments (Dollars in Millions) $189,080 $191,409 $171,899 $161,459 $155,513 $143,848 $129,961 $129,592 $118,875 $116,178 $102,808 2001 10 $96,696 2002 $165,820 $150,611 $100,525 2003 2004 Popular Annual Financial Report 2015 2005 2006 2007 2008 2009 2010 2011 2012 2013 2014 2015 . INVESTMENTS (CONTINUED) Investment Performance The CalSTRS Investment Portfolio posted an approximate 4.8 percent one-year return calculated on a gross of fees time-weighted return basis for fiscal year 2014–15. The following charts show the investment return of CalSTRS versus benchmarks as of June 30, 2015. Portfolio Returns and Benchmarks As of June 30, 2015 Benchmarks are goals and standards used to measure investment performance. 4.77% 4.64% 12.26% 12.26% 12.14% 12.29% 7.02% 7.19% 1 Year 3 Years 5 Years 10 Years CalSTRS Benchmarks One-Year Returns As of June 30, 2015 Calculated using a time-weighted rate of return. 13.44% 12.40% 9.08% 3.12% 3.02% Global Equity 7.62% 2.10% 1.75% Fixed Income 0.60% Real Estate Private Equity 1.02% 1.03% Absolute Return 0.33% 0.03% Cash (4.73%) Inflation Sensitive CalSTRS Benchmarks (the goals and standards used to measure investment performance) CalSTRS Popular Annual Financial Report 2015 11 . CALSTRS’ IMPACT ON CALIFORNIA’S ECONOMY CalSTRS contributes to California’s economy through the benefits it pays to its members, who may then spend that money in the communities in which they live. CalSTRS paid an estimated $10 billion in benefits to 212,466 retirees living in California during fiscal year 2014–15. The map below shows the number of retired members living in each county and a range of the amount of benefits paid to those members, as well as the locations of CalSTRS Member Service Centers. Defined Benefit Program County Retirees Who Live in California Characteristics by County Del Norte Shasta Humboldt Lassen Trinity Tehama Plumas Butte Glenn Sierra Mendocino Nevada Colusa Lake Sonoma Napa Yuba Sutter Yolo Placer El Dorado Solano Marin San Francisco Contra Costa Calaveras San Joaquin Alameda San Mateo Alpine Sacramento Amador Stanislaus Santa Clara Merced Tuolumne Mono Mariposa Madera Santa Cruz San Benito Monterey Fresno Kings San Luis Obispo Inyo Tulare Kern San Bernardino Santa Barbara Ventura Estimated Benefits Paid in FY 2014–151 (Dollars in Thousands) Modoc Siskiyou Number of Retirees Los Angeles Riverside Orange San Diego MEMBER SERVICE CENTER Benefit payments by amount Imperial Alpine Modoc Sierra Colusa Trinity Glenn Inyo Mono Del Norte Lassen Mariposa Plumas Yuba San Benito Amador Lake Siskiyou Calaveras Kings Tehama Tuolumne Imperial Yolo Mendocino Humboldt Sutter Madera Napa Nevada Shasta Merced El Dorado Butte Marin Santa Cruz Solano Santa Barbara San Francisco Monterey Tulare Stanislaus Placer San Luis Obispo San Joaquin Sonoma San Mateo Kern Fresno Ventura Contra Costa Alameda Sacramento San Bernardino Santa Clara Riverside San Diego Orange Los Angeles Total 12 85 76 127 153 131 159 171 224 231 268 331 327 288 403 479 611 569 569 661 675 726 993 1,079 1,302 1,131 1,272 1,359 1,483 1,611 1,426 1,942 2,190 2,163 2,602 2,728 2,806 2,826 2,847 2,936 3,016 3,470 3,791 3,690 4,365 3,739 4,017 5,829 6,252 7,324 7,392 8,470 8,255 9,329 11,398 19,421 19,564 41,172 212,466 $360 3,003 3,181 5,134 5,636 5,716 5,956 7,097 8,722 9,314 10,739 12,383 13,249 14,411 15,875 18,776 22,252 23,758 26,119 26,657 28,099 38,295 40,367 42,070 46,685 53,064 54,163 57,948 59,588 64,935 69,094 86,928 88,520 90,001 111,671 119,250 121,896 123,093 129,253 140,187 149,077 158,892 162,193 172,508 184,525 184,741 193,030 263,189 300,896 327,986 350,232 366,262 394,056 469,837 530,820 908,626 1,057,882 2,064,236 $10,042,429 ¹The annualized benefits were estimates based on the June 2015 monthly allowance. 0−$100 million 12 $100−$200 million $200−$300 million $300−$400 million $400−$500 million Popular Annual Financial Report 2015 Over $500 million . CALSTRS’ IMPACT ON CALIFORNIA’S ECONOMY (CONTINUED) As of June 30, 2015, 26 percent of CalSTRS’ U.S. real estate portfolio is invested in California, which is significantly higher than California’s share of total U.S. economic activity. These real estate investments are composed of 476 properties that are diversified across many counties and regions of the state. California Investments by Property Type Retail $333 Million Industrial $765 Million Residential $1,035 Million Land $158 Million Office $1,087 Million CalSTRS Popular Annual Financial Report 2015 13 .
CalSTRS Resources WEB CalSTRS.com Click Contact Us to email myCalSTRS.com Legislation The following retirement-related legislation was passed during fiscal year 2014–15: 403bCompare.com Pension2.com CALL 800-228-5453 7 a.m. to 6 p.m. Monday through Friday 916-414-1099 Calls from outside the U.S. 888-394-2060 CalSTRS Pension2® Personal Wealth Plan 855-844-2468 (toll free) Pension Abuse Reporting Hotline WRITE CalSTRS P.O. Box 15275 Sacramento, CA 95851-0275 VISIT Member Services 100 Waterfront Place West Sacramento, CA 95605 Find your nearest CalSTRS office at CalSTRS.com/localoffices Public Divestiture of Thermal Coal Companies Act SB 185 (De León) Requires the CalSTRS and CalPERS boards to engage with thermal coal companies, as defined, and to divest the public employee retirement funds of any investments in thermal coal companies. It also prohibits additional or new investments or the renewal of existing investments in thermal coal companies. Windfall Elimination Provision/Government Pension Offset Resolution SJR 1 (Beall) Requests the President and Congress to enact legislation repealing the Government Pension Offset and the Windfall Elimination Provision from the Social Security Act. Omnibus Bill SB 1220 (Torres) FAX 916-414-5040 STAY CONNECTED Makes various technical, conforming, or minor amendments necessary for continued effective administration of the State Teachers’ Retirement Plan. Sponsor: CalSTRS. .