The BDO 600 - The BDO 600 survey details director compensation practices of publicly traded companies
BDO USA


Description
THE BDO 600
2015 SURVEY OF BOARD COMPENSATION PRACTICES
OF 600 MID-MARKET PUBLIC COMPANIES
. THE BDO 600 – 2015 Survey of Board Compensation Practices of 600 Mid-Market Public Companies
CONTENTS
INTRODUCTION. . . .
. . .
. . .
. . .
. . .
. . .
. . .
. . .
. . .
. . .
. . .
. . .
. . .
. . .
. . .
. . .
. . .
. . .
1 HOW TO USE THIS SURVEY. . .
. . .
. . .
. . .
. . .
. . .
. . .
. . .
. . .
. . .
. . .
. . .
. . .
. . .
. . 2 BOARD COMPENSATION PRACTICES Overall Results.
. . .
. . .
. . .
. . .
. . .
. . .
. . .
. . .
. . .
. . .
. . .
. . .
. . .
. . .
. . .
. . .
. . .
4 By Company Size. . .
. . .
. . .
. . .
. . .
. . .
. . .
. . .
. . .
. . .
. . .
. . .
. . .
. . .
. . .
. . .
. . 5 By Industry.
. . .
. . .
. . .
. . .
. . .
. . .
. . .
. . .
. . .
. . .
. . .
. . .
. . .
. . .
. . .
. . .
. . .
. . .
9 ABOUT BDO AND KENEXA . . .
. . .
. . .
. . .
. . .
. . .
. . .
. . .
. . .
. . .
. . .
. . .
. . .
. . .
. 18 CONTACT US. .
. . .
. . .
. . .
. . .
. . .
. . .
. . .
. . .
. . .
. . .
. . .
. . .
. . .
. . .
. . .
BACK COVER ii . THE BDO 600 – 2015 Survey of Board Compensation Practices of 600 Mid-Market Public Companies Introduction ABOUT THE BDO 600 SURVEY The BDO 600 survey details director compensation practices of publicly traded companies in the energy, financial services–banking, financial services–nonbanking, healthcare, manufacturing, real estate, retail and technology industries. Companies in the six nonfinancial service industries have annual revenues between $25 million and $1 billion. Companies in the two financial services industries have assets between $50 million and $2 billion. All data in our survey was extracted from proxy statements that were filed between May 15, 2014 and May 15, 2015. The BDO 600 survey is the ninth iteration of our annual publication. 6% In fiscal year 2014, director compensation increased by an average of 6% This survey is unique because it focuses on mid-market companies; whereas most other board compensation surveys focus on much larger companies. ABOUT BDO’S GLOBAL EMPLOYER SERVICES PRACTICE BDO’s Global Employer Services practice offers an experienced and dedicated team of professionals who operate nationwide to seamlessly provide a comprehensive array of services to address client needs. Our team provides tax, accounting and consulting services for all types of compensation arrangements, including cash and equity incentives, merger and acquisition related issues, employee stock purchase plans, qualified and nonqualified plan arrangements and other related services. We serve a broad base of clients from mid-sized domestic companies to Fortune 500 multinationals. 45% Overall, companies pay 45% of director compensation in cash and 55% in equity (the same as last year) 1 . THE BDO 600 – 2015 Survey of Board Compensation Practices of 600 Mid-Market Public Companies How To Use This Survey The data we collected from the 600 companies surveyed represents the policy in effect at each company as of their fiscal year-end, as disclosed in the director compensation narrative in public filings. We analyzed the data in aggregate by the standard four components of compensation: board retainers and fees, committee retainers and fees, stock options and full-value stock awards. TYPES OF COMPENSATION XX“Board Retainers and Fees” comprise annual board retainer and total board meeting fees earned during the year. Total meeting fees are calculated by multiplying the inperson per-meeting fee by the total number of board meetings held during the year. XX“Committee Retainers and Fees” comprise the annual committee retainer and total committee meeting fees earned during the year. Total meeting fees are calculated by multiplying the in-person per-meeting fee by the total number of committee meetings held during the year.
The data shown reflects the assumption that the director serves as a member of two committees; fees for serving on the compensation committee and the nominating and governance committee were used in this analysis. XX“Stock Options” values are the grant date fair value awards as reported by each company. If a company did not report these values, the values were calculated using the Accounting Standards Codification (“ASC”) Topic 718 assumptions as reported by the company. Irregular grants have been annualized, but one-time grants have been excluded. XX“Full-value Stock Awards” data includes both stock and stock unit awards.
The grant date fair value of the awards was used in this analysis. Irregular grants have been annualized, but one-time grants have been excluded. XX“Total Compensation” represents the sum of board retainers and fees, committee retainers and fees, full-value stock awards and stock options for each company. DATA ARRANGEMENT The survey data is organized by company size and industry. Board compensation practices can be benchmarked by either of these groups to gain different perspectives on these practices.
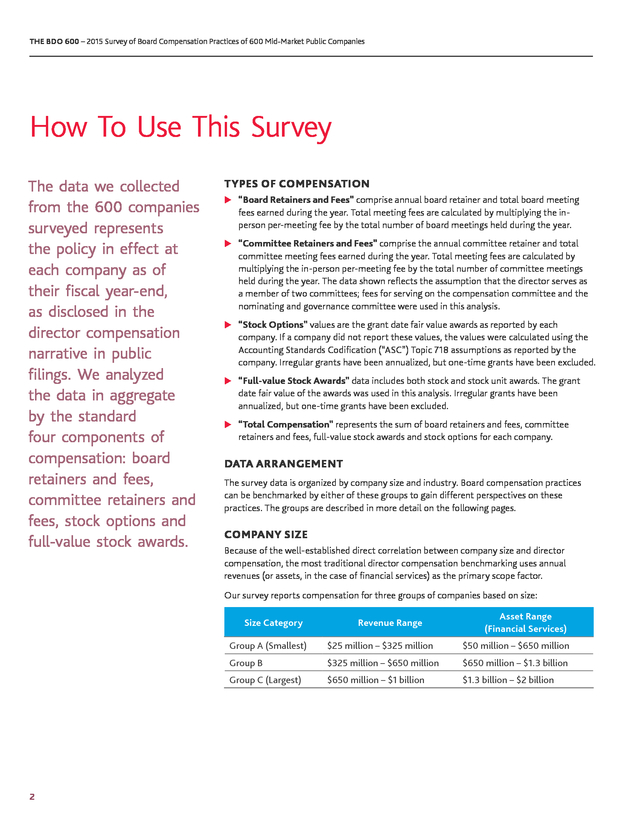
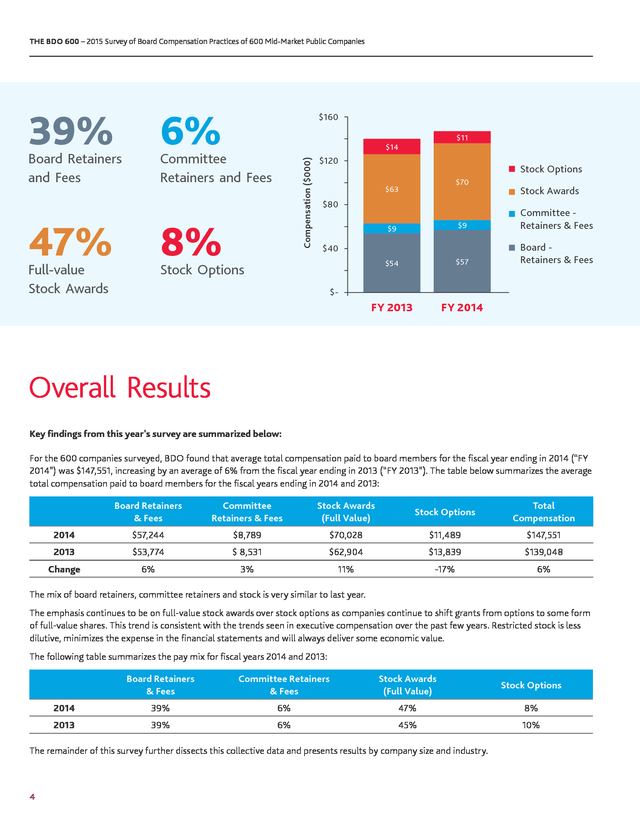
The groups are described in more detail on the following pages. COMPANY SIZE Because of the well-established direct correlation between company size and director compensation, the most traditional director compensation benchmarking uses annual revenues (or assets, in the case of financial services) as the primary scope factor. Our survey reports compensation for three groups of companies based on size: Size Category Revenue Range Asset Range (Financial Services) Group A (Smallest) $50 million – $650 million Group B $325 million – $650 million $650 million – $1.3 billion Group C (Largest) 2 $25 million – $325 million $650 million – $1 billion $1.3 billion – $2 billion . THE BDO 600 – 2015 Survey of Board Compensation Practices of 600 Mid-Market Public Companies INDUSTRY Industry group is another common lens used when benchmarking director compensation. In our survey, we report compensation provided to directors of companies in the following industries: XXEnergy XXFinancial Services – Banking XXFinancial Services – Nonbanking XXHealthcare XXManufacturing XXReal Estate XXRetail XXTechnology ADDITIONAL NOTES ON THE SURVEY One of the most important aspects of survey work is maintaining a consistent, quantitative platform for analysis. The majority of companies used in last year’s analysis were included in this year’s examination. In order to establish a common comparative base for all 600 companies surveyed, data was annualized and a consistent methodology was used to value compensation. If a surveyed company could not be brought into parity with other participant companies, it was excluded from the survey and replaced with a company chosen at random to obtain a representative sample across industries and company size. 3 . THE BDO 600 – 2015 Survey of Board Compensation Practices of 600 Mid-Market Public Companies 39% 6% $11 $14 Committee Retainers and Fees Compensation ($000) Board Retainers and Fees $160 $120 Stock Options $70 $63 $80 Stock Awards $54 8% Full-value Stock Awards Committee Retainers & Fees $57 Board Retainers & Fees FY 2013 47% $9 FY 2014 $9 $40 Stock Options $- Overall Results Key findings from this year’s survey are summarized below: For the 600 companies surveyed, BDO found that average total compensation paid to board members for the fiscal year ending in 2014 (“FY 2014”) was $147,551, increasing by an average of 6% from the fiscal year ending in 2013 (“FY 2013”). The table below summarizes the average total compensation paid to board members for the fiscal years ending in 2014 and 2013: Board Retainers & Fees Committee Retainers & Fees Stock Awards (Full Value) Stock Options Total Compensation 2014 $57,244 $8,789 $70,028 $11,489 $147,551 2013 $53,774 $ 8,531 $62,904 $13,839 $139,048 Change 6% 3% 11% -17% 6% The mix of board retainers, committee retainers and stock is very similar to last year. The emphasis continues to be on full-value stock awards over stock options as companies continue to shift grants from options to some form of full-value shares. This trend is consistent with the trends seen in executive compensation over the past few years. Restricted stock is less dilutive, minimizes the expense in the financial statements and will always deliver some economic value. The following table summarizes the pay mix for fiscal years 2014 and 2013: Board Retainers & Fees Committee Retainers & Fees Stock Awards (Full Value) Stock Options 2014 39% 6% 47% 8% 2013 39% 6% 45% 10% The remainder of this survey further dissects this collective data and presents results by company size and industry. 4 .
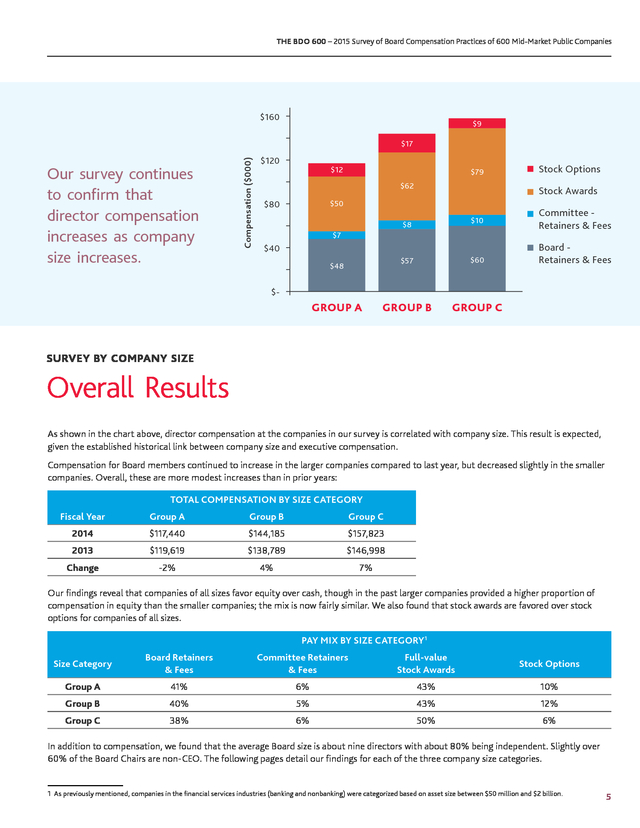
THE BDO 600 – 2015 Survey of Board Compensation Practices of 600 Mid-Market Public Companies $160 $9 Our survey continues to confirm that director compensation increases as company size increases. Compensation ($000) $17 $120 $12 $79 $62 Stock Awards $50 $80 Stock Options $10 $8 $7 $40 $57 $60 GROUP B Committee Retainers & Fees Board Retainers & Fees GROUP C $48 $- GROUP A SURVEY BY COMPANY SIZE Overall Results As shown in the chart above, director compensation at the companies in our survey is correlated with company size. This result is expected, given the established historical link between company size and executive compensation. Compensation for Board members continued to increase in the larger companies compared to last year, but decreased slightly in the smaller companies. Overall, these are more modest increases than in prior years: TOTAL COMPENSATION BY SIZE CATEGORY Fiscal Year Group A Group B Group C 2014 $117,440 $144,185 $157,823 2013 $119,619 $138,789 $146,998 Change -2% 4% 7% Our findings reveal that companies of all sizes favor equity over cash, though in the past larger companies provided a higher proportion of compensation in equity than the smaller companies; the mix is now fairly similar. We also found that stock awards are favored over stock options for companies of all sizes.
1 PAY MIX BY SIZE CATEGORY1 Size Category Board Retainers & Fees Committee Retainers & Fees Full-value Stock Awards Stock Options Group A 41% 6% 43% 10% Group B 40% 5% 43% 12% Group C 38% 6% 50% 6% In addition to compensation, we found that the average Board size is about nine directors with about 80% being independent. Slightly over 60% of the Board Chairs are non-CEO. The following pages detail our findings for each of the three company size categories. 1 As previously mentioned, companies in the financial services industries (banking and nonbanking) were categorized based on asset size between $50 million and $2 billion. 5 .
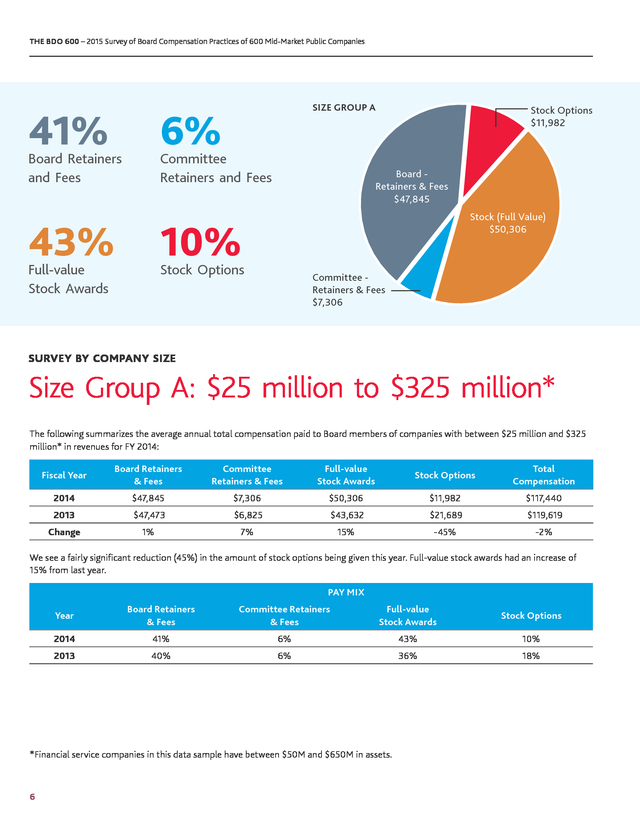
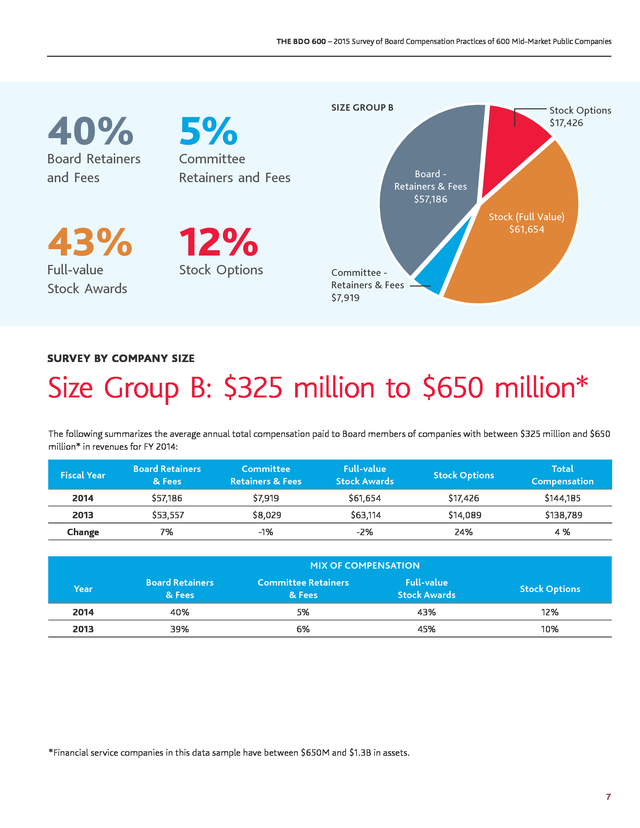
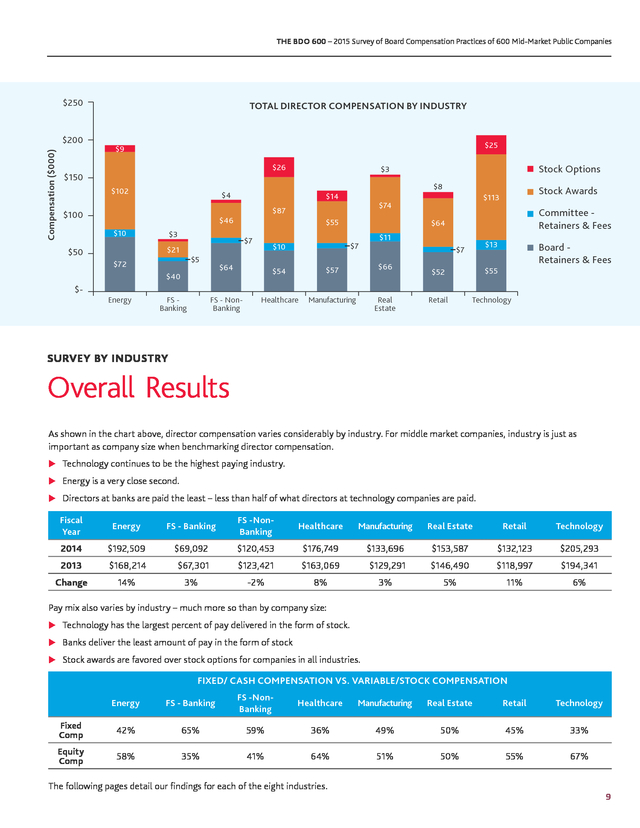
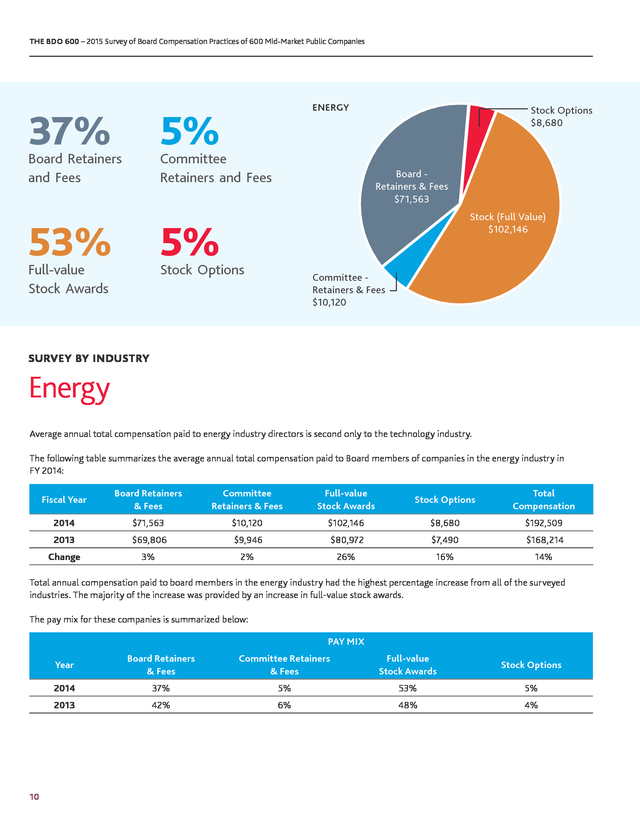
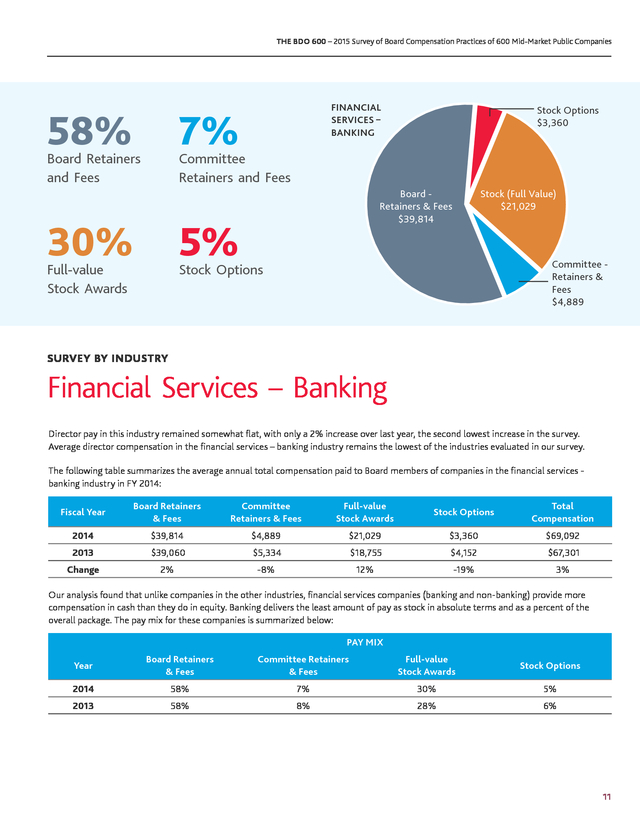
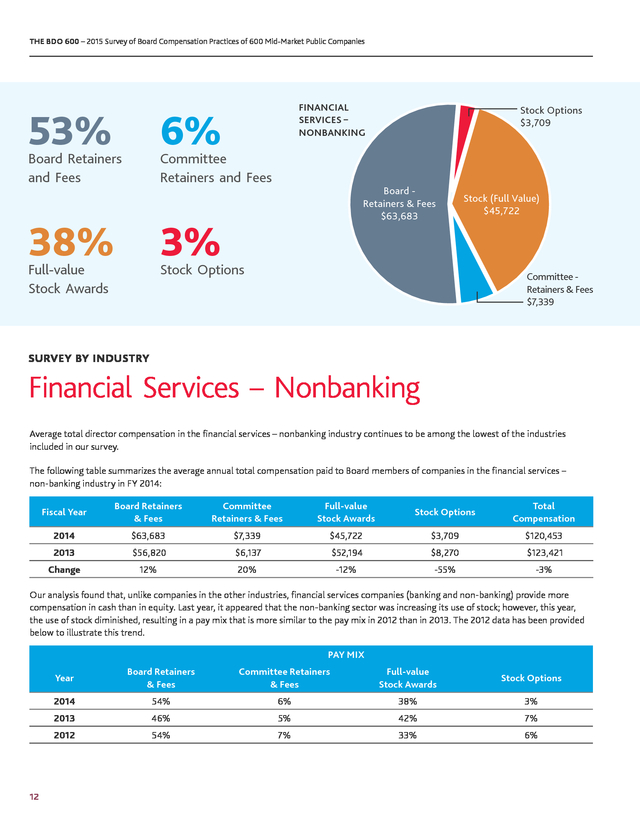
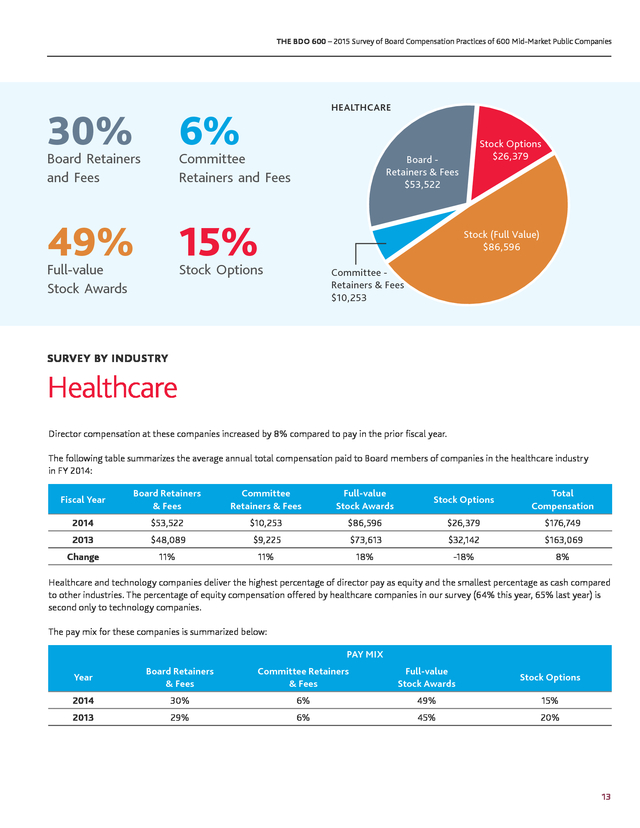
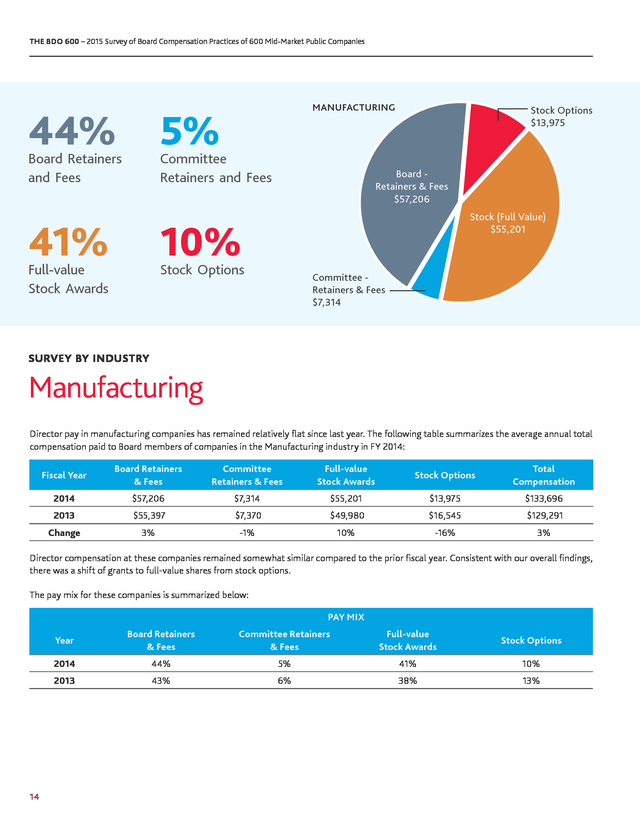
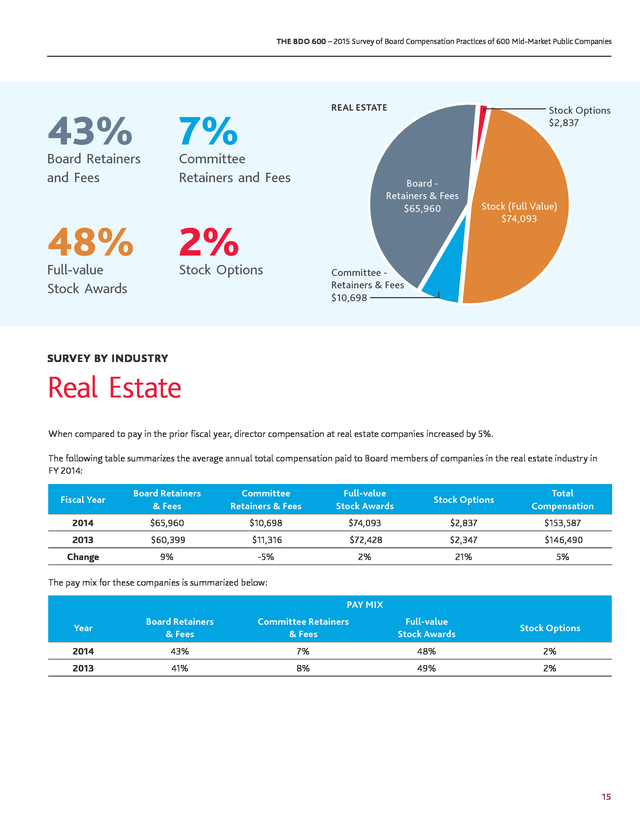
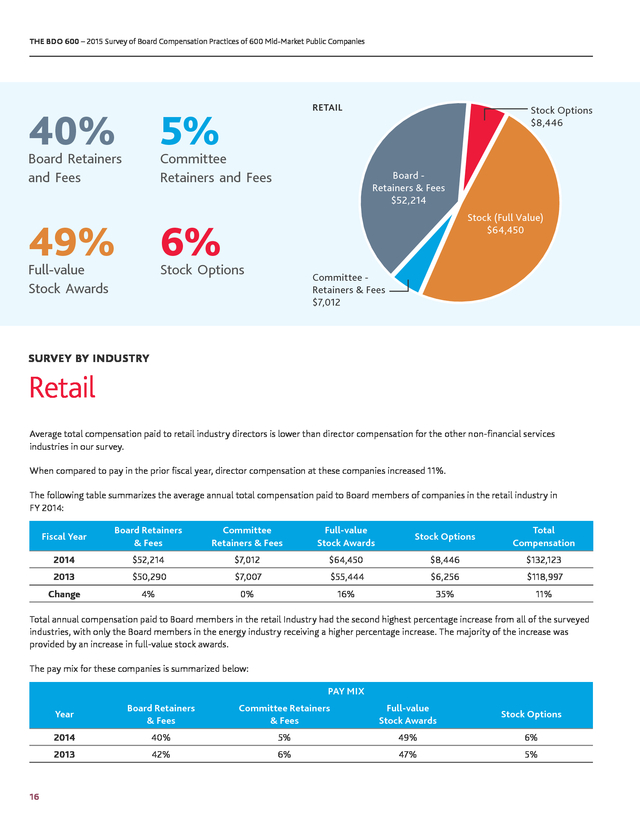
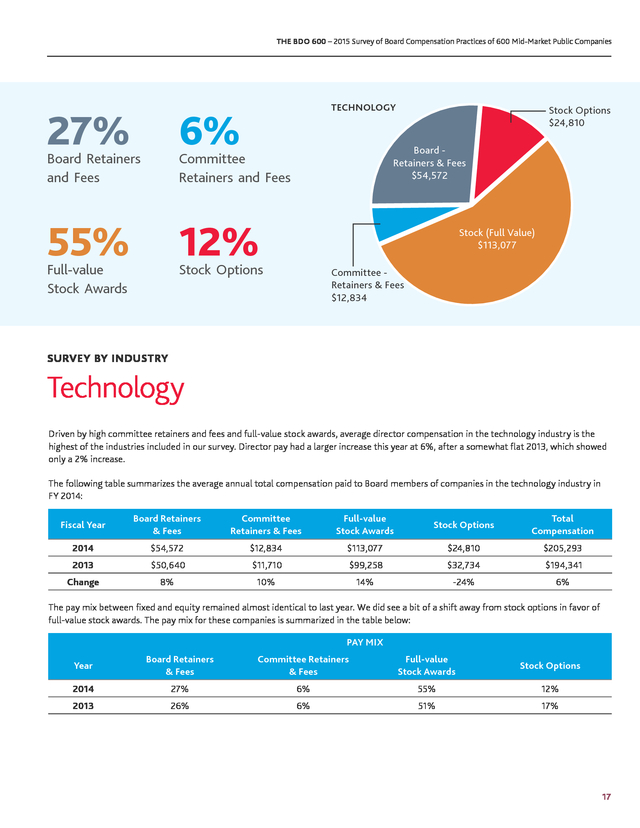
THE BDO 600 – 2015 Survey of Board Compensation Practices of 600 Mid-Market Public Companies 41% SIZE GROUP A 6% Board Retainers and Fees Committee Retainers and Fees 43% Stock Options $11,982 Board Retainers & Fees $47,845 Stock (Full Value) $50,306 10% Full-value Stock Awards Stock Options Committee Retainers & Fees $7,306 SURVEY BY COMPANY SIZE Size Group A: $25 million to $325 million* The following summarizes the average annual total compensation paid to Board members of companies with between $25 million and $325 million* in revenues for FY 2014: Fiscal Year Board Retainers & Fees Committee Retainers & Fees Full-value Stock Awards Stock Options Total Compensation 2014 $47,845 $7,306 $50,306 $11,982 $117,440 2013 $47,473 $6,825 $43,632 $21,689 $119,619 Change 1% 7% 15% -45% -2% We see a fairly significant reduction (45%) in the amount of stock options being given this year. Full-value stock awards had an increase of 15% from last year. PAY MIX Year Board Retainers & Fees Committee Retainers & Fees Full-value Stock Awards Stock Options 2014 41% 6% 43% 10% 2013 40% 6% 36% 18% *Financial service companies in this data sample have between $50M and $650M in assets. 6 . THE BDO 600 – 2015 Survey of Board Compensation Practices of 600 Mid-Market Public Companies 40% SIZE GROUP B 5% Board Retainers and Fees Committee Retainers and Fees 43% Stock Options $17,426 Board Retainers & Fees $57,186 Stock (Full Value) $61,654 12% Full-value Stock Awards Stock Options Committee Retainers & Fees $7,919 SURVEY BY COMPANY SIZE Size Group B: $325 million to $650 million* The following summarizes the average annual total compensation paid to Board members of companies with between $325 million and $650 million* in revenues for FY 2014: Fiscal Year Board Retainers & Fees Committee Retainers & Fees Full-value Stock Awards Stock Options Total Compensation 2014 $57,186 $7,919 $61,654 $17,426 $144,185 2013 $53,557 $8,029 $63,114 $14,089 $138,789 Change 7% -1% -2% 24% 4% MIX OF COMPENSATION Year Board Retainers & Fees Committee Retainers & Fees Full-value Stock Awards Stock Options 2014 40% 5% 43% 12% 2013 39% 6% 45% 10% *Financial service companies in this data sample have between $650M and $1.3B in assets. 7 . THE BDO 600 – 2015 Survey of Board Compensation Practices of 600 Mid-Market Public Companies 38% SIZE GROUP C 6% Board Retainers and Fees Committee Retainers and Fees 50% Stock Options $8,989 Board Retainers & Fees $59,678 Stock (Full Value) $79,300 6% Full-value Stock Awards Stock Options Committee Retainers & Fees $9,857 SURVEY BY COMPANY SIZE Size Group C: $650 Million to $1 Billion* The following summarizes the average annual total compensation paid to Board members of companies with between $650 million and $1 billion* in revenues for FY 2014: Fiscal Year Board Retainers & Fees Committee Retainers & Fees Full-value Stock Awards Stock Options Total Compensation 2014 $59,678 $9,857 $79,300 $8,989 $157,823 2013 $56,264 $9,490 $72,538 $8,707 $146,998 Change 6% 4% 9% 3% 7% The pay mix for these companies did not change much from last year. The highest percentage of equity compensation comes via stock awards for this revenue category than the lower revenue categories. PAY MIX Year Board Retainers & Fees Committee Retainers & Fees Full-value Stock Awards Stock Options 2014 38% 6% 50% 6% 2013 39% 6% 49% 6% *Financial service companies in this data sample have between $1.3B and $2B in assets. 8 . THE BDO 600 – 2015 Survey of Board Compensation Practices of 600 Mid-Market Public Companies $250 Compensation ($000) $200 TOTAL DIRECTOR COMPENSATION BY INDUSTRY $25 $9 $26 $150 $102 $4 $100 $10 $50 $7 $5 $72 Energy $7 $10 $11 $13 $7 $54 $57 $66 FS - NonBanking FS Banking Committee Retainers & Fees $64 $64 Healthcare Manufacturing Real Estate $40 $- $55 Stock Awards $113 $74 $87 $3 $21 $8 $14 $46 Stock Options $3 Board Retainers & Fees $52 $55 Retail Technology SURVEY BY INDUSTRY Overall Results As shown in the chart above, director compensation varies considerably by industry. For middle market companies, industry is just as important as company size when benchmarking director compensation. XXTechnology continues to be the highest paying industry. XXEnergy is a very close second. XXDirectors at banks are paid the least – less than half of what directors at technology companies are paid. Fiscal Year Energy FS - Banking FS -NonBanking Healthcare Manufacturing Real Estate Retail Technology 2014 $192,509 $69,092 $120,453 $176,749 $133,696 $153,587 $132,123 $205,293 2013 $168,214 $67,301 $123,421 $163,069 $129,291 $146,490 $118,997 $194,341 Change 14% 3% -2% 8% 3% 5% 11% 6% Pay mix also varies by industry – much more so than by company size: XXTechnology has the largest percent of pay delivered in the form of stock. XXBanks deliver the least amount of pay in the form of stock XXStock awards are favored over stock options for companies in all industries. FIXED/ CASH COMPENSATION VS. VARIABLE/STOCK COMPENSATION Energy FS - Banking FS -NonBanking Healthcare Manufacturing Real Estate Retail Technology Fixed Comp 42% 65% 59% 36% 49% 50% 45% 33% Equity Comp 58% 35% 41% 64% 51% 50% 55% 67% The following pages detail our findings for each of the eight industries. 9 . THE BDO 600 – 2015 Survey of Board Compensation Practices of 600 Mid-Market Public Companies 37% ENERGY 5% Board Retainers and Fees Committee Retainers and Fees 53% Stock Options $8,680 Board Retainers & Fees $71,563 Stock (Full Value) $102,146 5% Full-value Stock Awards Stock Options Committee Retainers & Fees $10,120 SURVEY BY INDUSTRY Energy Average annual total compensation paid to energy industry directors is second only to the technology industry. The following table summarizes the average annual total compensation paid to Board members of companies in the energy industry in FY 2014: Fiscal Year Board Retainers & Fees Committee Retainers & Fees Full-value Stock Awards Stock Options Total Compensation 2014 $71,563 $10,120 $102,146 $8,680 $192,509 2013 $69,806 $9,946 $80,972 $7,490 $168,214 Change 3% 2% 26% 16% 14% Total annual compensation paid to board members in the energy industry had the highest percentage increase from all of the surveyed industries. The majority of the increase was provided by an increase in full-value stock awards. The pay mix for these companies is summarized below: PAY MIX Year Committee Retainers & Fees Full-value Stock Awards Stock Options 2014 37% 5% 53% 5% 2013 10 Board Retainers & Fees 42% 6% 48% 4% . THE BDO 600 – 2015 Survey of Board Compensation Practices of 600 Mid-Market Public Companies 58% FINANCIAL SERVICES – BANKING 7% Board Retainers and Fees Stock Options $3,360 Committee Retainers and Fees 30% Board Retainers & Fees $39,814 5% Full-value Stock Awards Stock (Full Value) $21,029 Committee Retainers & Fees $4,889 Stock Options SURVEY BY INDUSTRY Financial Services – Banking Director pay in this industry remained somewhat flat, with only a 2% increase over last year, the second lowest increase in the survey. Average director compensation in the financial services – banking industry remains the lowest of the industries evaluated in our survey. The following table summarizes the average annual total compensation paid to Board members of companies in the financial services banking industry in FY 2014: Fiscal Year Board Retainers & Fees Committee Retainers & Fees Full-value Stock Awards Stock Options Total Compensation 2014 $39,814 $4,889 $21,029 $3,360 $69,092 2013 $39,060 $5,334 $18,755 $4,152 $67,301 Change 2% -8% 12% -19% 3% Our analysis found that unlike companies in the other industries, financial services companies (banking and non-banking) provide more compensation in cash than they do in equity. Banking delivers the least amount of pay as stock in absolute terms and as a percent of the overall package. The pay mix for these companies is summarized below: PAY MIX Year Board Retainers & Fees Committee Retainers & Fees Full-value Stock Awards Stock Options 2014 58% 7% 30% 5% 2013 58% 8% 28% 6% 11 . THE BDO 600 – 2015 Survey of Board Compensation Practices of 600 Mid-Market Public Companies 53% FINANCIAL SERVICES – NONBANKING 6% Board Retainers and Fees Committee Retainers and Fees 38% Board Retainers & Fees $63,683 3% Full-value Stock Awards Stock Options $3,709 Stock (Full Value) $45,722 Stock Options Committee Retainers & Fees $7,339 SURVEY BY INDUSTRY Financial Services – Nonbanking Average total director compensation in the financial services – nonbanking industry continues to be among the lowest of the industries included in our survey. The following table summarizes the average annual total compensation paid to Board members of companies in the financial services – non-banking industry in FY 2014: Fiscal Year Board Retainers & Fees Committee Retainers & Fees Full-value Stock Awards Stock Options Total Compensation 2014 $63,683 $7,339 $45,722 $3,709 $120,453 2013 $56,820 $6,137 $52,194 $8,270 $123,421 Change 12% 20% -12% -55% -3% Our analysis found that, unlike companies in the other industries, financial services companies (banking and non-banking) provide more compensation in cash than in equity. Last year, it appeared that the non-banking sector was increasing its use of stock; however, this year, the use of stock diminished, resulting in a pay mix that is more similar to the pay mix in 2012 than in 2013. The 2012 data has been provided below to illustrate this trend. PAY MIX Year Committee Retainers & Fees Full-value Stock Awards Stock Options 2014 54% 6% 38% 3% 2013 46% 5% 42% 7% 2012 12 Board Retainers & Fees 54% 7% 33% 6% . THE BDO 600 – 2015 Survey of Board Compensation Practices of 600 Mid-Market Public Companies HEALTHCARE 30% 6% 49% 15% Board Retainers and Fees Committee Retainers and Fees Full-value Stock Awards Stock Options $26,379 Board Retainers & Fees $53,522 Stock (Full Value) $86,596 Stock Options Committee Retainers & Fees $10,253 SURVEY BY INDUSTRY Healthcare Director compensation at these companies increased by 8% compared to pay in the prior fiscal year. The following table summarizes the average annual total compensation paid to Board members of companies in the healthcare industry in FY 2014: Fiscal Year Board Retainers & Fees Committee Retainers & Fees Full-value Stock Awards Stock Options Total Compensation 2014 $53,522 $10,253 $86,596 $26,379 $176,749 2013 $48,089 $9,225 $73,613 $32,142 $163,069 Change 11% 11% 18% -18% 8% Healthcare and technology companies deliver the highest percentage of director pay as equity and the smallest percentage as cash compared to other industries. The percentage of equity compensation offered by healthcare companies in our survey (64% this year, 65% last year) is second only to technology companies. The pay mix for these companies is summarized below: PAY MIX Year Board Retainers & Fees Committee Retainers & Fees Full-value Stock Awards Stock Options 2014 30% 6% 49% 15% 2013 29% 6% 45% 20% 13 . THE BDO 600 – 2015 Survey of Board Compensation Practices of 600 Mid-Market Public Companies 44% MANUFACTURING 5% Board Retainers and Fees Committee Retainers and Fees 41% Stock Options $13,975 Board Retainers & Fees $57,206 Stock (Full Value) $55,201 10% Full-value Stock Awards Stock Options Committee Retainers & Fees $7,314 SURVEY BY INDUSTRY Manufacturing Director pay in manufacturing companies has remained relatively flat since last year. The following table summarizes the average annual total compensation paid to Board members of companies in the Manufacturing industry in FY 2014: Fiscal Year Board Retainers & Fees Committee Retainers & Fees Full-value Stock Awards Stock Options Total Compensation 2014 $57,206 $7,314 $55,201 $13,975 $133,696 2013 $55,397 $7,370 $49,980 $16,545 $129,291 Change 3% -1% 10% -16% 3% Director compensation at these companies remained somewhat similar compared to the prior fiscal year. Consistent with our overall findings, there was a shift of grants to full-value shares from stock options. The pay mix for these companies is summarized below: PAY MIX Year Committee Retainers & Fees Full-value Stock Awards Stock Options 2014 44% 5% 41% 10% 2013 14 Board Retainers & Fees 43% 6% 38% 13% . THE BDO 600 – 2015 Survey of Board Compensation Practices of 600 Mid-Market Public Companies 43% REAL ESTATE 7% Board Retainers and Fees Committee Retainers and Fees 48% Stock Options $2,837 Board Retainers & Fees $65,960 2% Full-value Stock Awards Stock Options Stock (Full Value) $74,093 Committee Retainers & Fees $10,698 SURVEY BY INDUSTRY Real Estate When compared to pay in the prior fiscal year, director compensation at real estate companies increased by 5%. The following table summarizes the average annual total compensation paid to Board members of companies in the real estate industry in FY 2014: Fiscal Year Board Retainers & Fees Committee Retainers & Fees Full-value Stock Awards Stock Options Total Compensation 2014 $65,960 $10,698 $74,093 $2,837 $153,587 2013 $60,399 $11,316 $72,428 $2,347 $146,490 Change 9% -5% 2% 21% 5% The pay mix for these companies is summarized below: PAY MIX Year Board Retainers & Fees Committee Retainers & Fees Full-value Stock Awards Stock Options 2014 43% 7% 48% 2% 2013 41% 8% 49% 2% 15 . THE BDO 600 – 2015 Survey of Board Compensation Practices of 600 Mid-Market Public Companies 40% RETAIL 5% Board Retainers and Fees Committee Retainers and Fees 49% Stock Options $8,446 Board Retainers & Fees $52,214 Stock (Full Value) $64,450 6% Full-value Stock Awards Stock Options Committee Retainers & Fees $7,012 SURVEY BY INDUSTRY Retail Average total compensation paid to retail industry directors is lower than director compensation for the other non-financial services industries in our survey. When compared to pay in the prior fiscal year, director compensation at these companies increased 11%. The following table summarizes the average annual total compensation paid to Board members of companies in the retail industry in FY 2014: Fiscal Year Board Retainers & Fees Committee Retainers & Fees Full-value Stock Awards Stock Options Total Compensation 2014 $52,214 $7,012 $64,450 $8,446 $132,123 2013 $50,290 $7,007 $55,444 $6,256 $118,997 Change 4% 0% 16% 35% 11% Total annual compensation paid to Board members in the retail Industry had the second highest percentage increase from all of the surveyed industries, with only the Board members in the energy industry receiving a higher percentage increase. The majority of the increase was provided by an increase in full-value stock awards. The pay mix for these companies is summarized below: PAY MIX Year Committee Retainers & Fees Full-value Stock Awards Stock Options 2014 40% 5% 49% 6% 2013 16 Board Retainers & Fees 42% 6% 47% 5% . THE BDO 600 – 2015 Survey of Board Compensation Practices of 600 Mid-Market Public Companies TECHNOLOGY 27% 6% 55% Stock Options $24,810 12% Board Retainers and Fees Board Retainers & Fees $54,572 Committee Retainers and Fees Full-value Stock Awards Stock (Full Value) $113,077 Stock Options Committee Retainers & Fees $12,834 SURVEY BY INDUSTRY Technology Driven by high committee retainers and fees and full-value stock awards, average director compensation in the technology industry is the highest of the industries included in our survey. Director pay had a larger increase this year at 6%, after a somewhat flat 2013, which showed only a 2% increase. The following table summarizes the average annual total compensation paid to Board members of companies in the technology industry in FY 2014: Fiscal Year Board Retainers & Fees Committee Retainers & Fees Full-value Stock Awards Stock Options Total Compensation 2014 $54,572 $12,834 $113,077 $24,810 $205,293 2013 $50,640 $11,710 $99,258 $32,734 $194,341 Change 8% 10% 14% -24% 6% The pay mix between fixed and equity remained almost identical to last year. We did see a bit of a shift away from stock options in favor of full-value stock awards. The pay mix for these companies is summarized in the table below: PAY MIX Year Board Retainers & Fees Committee Retainers & Fees Full-value Stock Awards Stock Options 2014 27% 6% 55% 12% 2013 26% 6% 51% 17% 17 .
THE BDO 600 – 2015 Survey of Board Compensation Practices of 600 Mid-Market Public Companies The BDO 600: 2015 Survey of Board Compensation Practices of 600 Mid-Market Public Companies examined the compensation practices of publicly traded companies in the energy, financial services–banking, financial services–nonbanking, healthcare, manufacturing, real estate, retail and technology industries. Companies in the six non-financial service industries in our survey have annual revenues between $25 million and $1 billion. Companies in the two financial services industries in our survey have assets between $50 million and $2 billion. 18 ABOUT BDO BDO is the brand name for BDO USA, LLP, a U.S. professional services firm providing assurance, tax, advisory and consulting services to a wide range of publicly traded and privately held companies. For more than 100 years, BDO has provided quality service through the active involvement of experienced and committed professionals. The firm serves clients through 63 offices and more than 450 independent alliance firm locations nationwide. As an independent Member Firm of BDO International Limited, BDO serves multi-national clients through a global network of 1,408 offices in 154 countries. BDO USA, LLP, a Delaware limited liability partnership, is the U.S. member of BDO International Limited, a UK company limited by guarantee, and forms part of the international BDO network of independent member firms.
BDO is the brand name for the BDO network and for each of the BDO Member Firms. For more information please visit: www.bdo.com. ABOUT KENEXA Kenexa Corporation (NYSE:KNXA) helps drive HR and business outcomes through its unique combination of technology, content and services. Enabling organizations to optimize their workforces since 1987, Kenexa’s integrated talent acquisition and talent management solutions have touched the lives of more than 110 million people.
Additional information about Kenexa and its global products and services can be accessed at www.kenexa.com. . THE BDO 600 – 2015 Survey of Board Compensation Practices of 600 Mid-Market Public Companies BDO is the brand name for BDO USA, LLP, a U.S. professional services firm providing assurance, tax, advisory and consulting services to a wide range of publicly traded and privately held companies. For more than 100 years, BDO has provided quality service through the active involvement of experienced and committed professionals. The firm serves clients through 63 offices and more than 450 independent alliance firm locations nationwide. As an independent Member Firm of BDO International Limited, BDO serves multi-national clients through a global network of 1,408 offices in 154 countries. BDO USA, LLP, a Delaware limited liability partnership, is the U.S.
member of BDO International Limited, a UK company limited by guarantee, and forms part of the international BDO network of independent member firms. BDO is the brand name for the BDO network and for each of the BDO Member Firms. For more information please visit: www.bdo.com. Material discussed is meant to provide general information and should not be acted on without professional advice tailored to your firm’s individual needs. © 2016 BDO USA, LLP.
All rights reserved. 19 . Contact Us If you have any questions, comments or suggestions, please contact our Compensation and Benefits practice by emailing us at compensation@bdo.com or by calling your local BDO office. Please visit www.bdo.com/bdo600 for the electronic copy of this survey. THE BDO 600 SURVEY TEAM CONTACTS: Andy Gibson agibson@bdo.com / 404-979-7106 Randy Ramirez rramirez@bdo.com / 212-885-8015 .
. . .
. . .
. . .
. . .
. . .
. . .
. . .
. . .
. . .
. . .
. . .
. . .
. . .
. . .
. . .
. . .
. . .
1 HOW TO USE THIS SURVEY. . .
. . .
. . .
. . .
. . .
. . .
. . .
. . .
. . .
. . .
. . .
. . .
. . .
. . .
. . 2 BOARD COMPENSATION PRACTICES Overall Results.
. . .
. . .
. . .
. . .
. . .
. . .
. . .
. . .
. . .
. . .
. . .
. . .
. . .
. . .
. . .
. . .
. . .
4 By Company Size. . .
. . .
. . .
. . .
. . .
. . .
. . .
. . .
. . .
. . .
. . .
. . .
. . .
. . .
. . .
. . .
. . 5 By Industry.
. . .
. . .
. . .
. . .
. . .
. . .
. . .
. . .
. . .
. . .
. . .
. . .
. . .
. . .
. . .
. . .
. . .
. . .
9 ABOUT BDO AND KENEXA . . .
. . .
. . .
. . .
. . .
. . .
. . .
. . .
. . .
. . .
. . .
. . .
. . .
. . .
. 18 CONTACT US. .
. . .
. . .
. . .
. . .
. . .
. . .
. . .
. . .
. . .
. . .
. . .
. . .
. . .
. . .
. . .
BACK COVER ii . THE BDO 600 – 2015 Survey of Board Compensation Practices of 600 Mid-Market Public Companies Introduction ABOUT THE BDO 600 SURVEY The BDO 600 survey details director compensation practices of publicly traded companies in the energy, financial services–banking, financial services–nonbanking, healthcare, manufacturing, real estate, retail and technology industries. Companies in the six nonfinancial service industries have annual revenues between $25 million and $1 billion. Companies in the two financial services industries have assets between $50 million and $2 billion. All data in our survey was extracted from proxy statements that were filed between May 15, 2014 and May 15, 2015. The BDO 600 survey is the ninth iteration of our annual publication. 6% In fiscal year 2014, director compensation increased by an average of 6% This survey is unique because it focuses on mid-market companies; whereas most other board compensation surveys focus on much larger companies. ABOUT BDO’S GLOBAL EMPLOYER SERVICES PRACTICE BDO’s Global Employer Services practice offers an experienced and dedicated team of professionals who operate nationwide to seamlessly provide a comprehensive array of services to address client needs. Our team provides tax, accounting and consulting services for all types of compensation arrangements, including cash and equity incentives, merger and acquisition related issues, employee stock purchase plans, qualified and nonqualified plan arrangements and other related services. We serve a broad base of clients from mid-sized domestic companies to Fortune 500 multinationals. 45% Overall, companies pay 45% of director compensation in cash and 55% in equity (the same as last year) 1 . THE BDO 600 – 2015 Survey of Board Compensation Practices of 600 Mid-Market Public Companies How To Use This Survey The data we collected from the 600 companies surveyed represents the policy in effect at each company as of their fiscal year-end, as disclosed in the director compensation narrative in public filings. We analyzed the data in aggregate by the standard four components of compensation: board retainers and fees, committee retainers and fees, stock options and full-value stock awards. TYPES OF COMPENSATION XX“Board Retainers and Fees” comprise annual board retainer and total board meeting fees earned during the year. Total meeting fees are calculated by multiplying the inperson per-meeting fee by the total number of board meetings held during the year. XX“Committee Retainers and Fees” comprise the annual committee retainer and total committee meeting fees earned during the year. Total meeting fees are calculated by multiplying the in-person per-meeting fee by the total number of committee meetings held during the year.
The data shown reflects the assumption that the director serves as a member of two committees; fees for serving on the compensation committee and the nominating and governance committee were used in this analysis. XX“Stock Options” values are the grant date fair value awards as reported by each company. If a company did not report these values, the values were calculated using the Accounting Standards Codification (“ASC”) Topic 718 assumptions as reported by the company. Irregular grants have been annualized, but one-time grants have been excluded. XX“Full-value Stock Awards” data includes both stock and stock unit awards.
The grant date fair value of the awards was used in this analysis. Irregular grants have been annualized, but one-time grants have been excluded. XX“Total Compensation” represents the sum of board retainers and fees, committee retainers and fees, full-value stock awards and stock options for each company. DATA ARRANGEMENT The survey data is organized by company size and industry. Board compensation practices can be benchmarked by either of these groups to gain different perspectives on these practices.
The groups are described in more detail on the following pages. COMPANY SIZE Because of the well-established direct correlation between company size and director compensation, the most traditional director compensation benchmarking uses annual revenues (or assets, in the case of financial services) as the primary scope factor. Our survey reports compensation for three groups of companies based on size: Size Category Revenue Range Asset Range (Financial Services) Group A (Smallest) $50 million – $650 million Group B $325 million – $650 million $650 million – $1.3 billion Group C (Largest) 2 $25 million – $325 million $650 million – $1 billion $1.3 billion – $2 billion . THE BDO 600 – 2015 Survey of Board Compensation Practices of 600 Mid-Market Public Companies INDUSTRY Industry group is another common lens used when benchmarking director compensation. In our survey, we report compensation provided to directors of companies in the following industries: XXEnergy XXFinancial Services – Banking XXFinancial Services – Nonbanking XXHealthcare XXManufacturing XXReal Estate XXRetail XXTechnology ADDITIONAL NOTES ON THE SURVEY One of the most important aspects of survey work is maintaining a consistent, quantitative platform for analysis. The majority of companies used in last year’s analysis were included in this year’s examination. In order to establish a common comparative base for all 600 companies surveyed, data was annualized and a consistent methodology was used to value compensation. If a surveyed company could not be brought into parity with other participant companies, it was excluded from the survey and replaced with a company chosen at random to obtain a representative sample across industries and company size. 3 . THE BDO 600 – 2015 Survey of Board Compensation Practices of 600 Mid-Market Public Companies 39% 6% $11 $14 Committee Retainers and Fees Compensation ($000) Board Retainers and Fees $160 $120 Stock Options $70 $63 $80 Stock Awards $54 8% Full-value Stock Awards Committee Retainers & Fees $57 Board Retainers & Fees FY 2013 47% $9 FY 2014 $9 $40 Stock Options $- Overall Results Key findings from this year’s survey are summarized below: For the 600 companies surveyed, BDO found that average total compensation paid to board members for the fiscal year ending in 2014 (“FY 2014”) was $147,551, increasing by an average of 6% from the fiscal year ending in 2013 (“FY 2013”). The table below summarizes the average total compensation paid to board members for the fiscal years ending in 2014 and 2013: Board Retainers & Fees Committee Retainers & Fees Stock Awards (Full Value) Stock Options Total Compensation 2014 $57,244 $8,789 $70,028 $11,489 $147,551 2013 $53,774 $ 8,531 $62,904 $13,839 $139,048 Change 6% 3% 11% -17% 6% The mix of board retainers, committee retainers and stock is very similar to last year. The emphasis continues to be on full-value stock awards over stock options as companies continue to shift grants from options to some form of full-value shares. This trend is consistent with the trends seen in executive compensation over the past few years. Restricted stock is less dilutive, minimizes the expense in the financial statements and will always deliver some economic value. The following table summarizes the pay mix for fiscal years 2014 and 2013: Board Retainers & Fees Committee Retainers & Fees Stock Awards (Full Value) Stock Options 2014 39% 6% 47% 8% 2013 39% 6% 45% 10% The remainder of this survey further dissects this collective data and presents results by company size and industry. 4 .
THE BDO 600 – 2015 Survey of Board Compensation Practices of 600 Mid-Market Public Companies $160 $9 Our survey continues to confirm that director compensation increases as company size increases. Compensation ($000) $17 $120 $12 $79 $62 Stock Awards $50 $80 Stock Options $10 $8 $7 $40 $57 $60 GROUP B Committee Retainers & Fees Board Retainers & Fees GROUP C $48 $- GROUP A SURVEY BY COMPANY SIZE Overall Results As shown in the chart above, director compensation at the companies in our survey is correlated with company size. This result is expected, given the established historical link between company size and executive compensation. Compensation for Board members continued to increase in the larger companies compared to last year, but decreased slightly in the smaller companies. Overall, these are more modest increases than in prior years: TOTAL COMPENSATION BY SIZE CATEGORY Fiscal Year Group A Group B Group C 2014 $117,440 $144,185 $157,823 2013 $119,619 $138,789 $146,998 Change -2% 4% 7% Our findings reveal that companies of all sizes favor equity over cash, though in the past larger companies provided a higher proportion of compensation in equity than the smaller companies; the mix is now fairly similar. We also found that stock awards are favored over stock options for companies of all sizes.
1 PAY MIX BY SIZE CATEGORY1 Size Category Board Retainers & Fees Committee Retainers & Fees Full-value Stock Awards Stock Options Group A 41% 6% 43% 10% Group B 40% 5% 43% 12% Group C 38% 6% 50% 6% In addition to compensation, we found that the average Board size is about nine directors with about 80% being independent. Slightly over 60% of the Board Chairs are non-CEO. The following pages detail our findings for each of the three company size categories. 1 As previously mentioned, companies in the financial services industries (banking and nonbanking) were categorized based on asset size between $50 million and $2 billion. 5 .
THE BDO 600 – 2015 Survey of Board Compensation Practices of 600 Mid-Market Public Companies 41% SIZE GROUP A 6% Board Retainers and Fees Committee Retainers and Fees 43% Stock Options $11,982 Board Retainers & Fees $47,845 Stock (Full Value) $50,306 10% Full-value Stock Awards Stock Options Committee Retainers & Fees $7,306 SURVEY BY COMPANY SIZE Size Group A: $25 million to $325 million* The following summarizes the average annual total compensation paid to Board members of companies with between $25 million and $325 million* in revenues for FY 2014: Fiscal Year Board Retainers & Fees Committee Retainers & Fees Full-value Stock Awards Stock Options Total Compensation 2014 $47,845 $7,306 $50,306 $11,982 $117,440 2013 $47,473 $6,825 $43,632 $21,689 $119,619 Change 1% 7% 15% -45% -2% We see a fairly significant reduction (45%) in the amount of stock options being given this year. Full-value stock awards had an increase of 15% from last year. PAY MIX Year Board Retainers & Fees Committee Retainers & Fees Full-value Stock Awards Stock Options 2014 41% 6% 43% 10% 2013 40% 6% 36% 18% *Financial service companies in this data sample have between $50M and $650M in assets. 6 . THE BDO 600 – 2015 Survey of Board Compensation Practices of 600 Mid-Market Public Companies 40% SIZE GROUP B 5% Board Retainers and Fees Committee Retainers and Fees 43% Stock Options $17,426 Board Retainers & Fees $57,186 Stock (Full Value) $61,654 12% Full-value Stock Awards Stock Options Committee Retainers & Fees $7,919 SURVEY BY COMPANY SIZE Size Group B: $325 million to $650 million* The following summarizes the average annual total compensation paid to Board members of companies with between $325 million and $650 million* in revenues for FY 2014: Fiscal Year Board Retainers & Fees Committee Retainers & Fees Full-value Stock Awards Stock Options Total Compensation 2014 $57,186 $7,919 $61,654 $17,426 $144,185 2013 $53,557 $8,029 $63,114 $14,089 $138,789 Change 7% -1% -2% 24% 4% MIX OF COMPENSATION Year Board Retainers & Fees Committee Retainers & Fees Full-value Stock Awards Stock Options 2014 40% 5% 43% 12% 2013 39% 6% 45% 10% *Financial service companies in this data sample have between $650M and $1.3B in assets. 7 . THE BDO 600 – 2015 Survey of Board Compensation Practices of 600 Mid-Market Public Companies 38% SIZE GROUP C 6% Board Retainers and Fees Committee Retainers and Fees 50% Stock Options $8,989 Board Retainers & Fees $59,678 Stock (Full Value) $79,300 6% Full-value Stock Awards Stock Options Committee Retainers & Fees $9,857 SURVEY BY COMPANY SIZE Size Group C: $650 Million to $1 Billion* The following summarizes the average annual total compensation paid to Board members of companies with between $650 million and $1 billion* in revenues for FY 2014: Fiscal Year Board Retainers & Fees Committee Retainers & Fees Full-value Stock Awards Stock Options Total Compensation 2014 $59,678 $9,857 $79,300 $8,989 $157,823 2013 $56,264 $9,490 $72,538 $8,707 $146,998 Change 6% 4% 9% 3% 7% The pay mix for these companies did not change much from last year. The highest percentage of equity compensation comes via stock awards for this revenue category than the lower revenue categories. PAY MIX Year Board Retainers & Fees Committee Retainers & Fees Full-value Stock Awards Stock Options 2014 38% 6% 50% 6% 2013 39% 6% 49% 6% *Financial service companies in this data sample have between $1.3B and $2B in assets. 8 . THE BDO 600 – 2015 Survey of Board Compensation Practices of 600 Mid-Market Public Companies $250 Compensation ($000) $200 TOTAL DIRECTOR COMPENSATION BY INDUSTRY $25 $9 $26 $150 $102 $4 $100 $10 $50 $7 $5 $72 Energy $7 $10 $11 $13 $7 $54 $57 $66 FS - NonBanking FS Banking Committee Retainers & Fees $64 $64 Healthcare Manufacturing Real Estate $40 $- $55 Stock Awards $113 $74 $87 $3 $21 $8 $14 $46 Stock Options $3 Board Retainers & Fees $52 $55 Retail Technology SURVEY BY INDUSTRY Overall Results As shown in the chart above, director compensation varies considerably by industry. For middle market companies, industry is just as important as company size when benchmarking director compensation. XXTechnology continues to be the highest paying industry. XXEnergy is a very close second. XXDirectors at banks are paid the least – less than half of what directors at technology companies are paid. Fiscal Year Energy FS - Banking FS -NonBanking Healthcare Manufacturing Real Estate Retail Technology 2014 $192,509 $69,092 $120,453 $176,749 $133,696 $153,587 $132,123 $205,293 2013 $168,214 $67,301 $123,421 $163,069 $129,291 $146,490 $118,997 $194,341 Change 14% 3% -2% 8% 3% 5% 11% 6% Pay mix also varies by industry – much more so than by company size: XXTechnology has the largest percent of pay delivered in the form of stock. XXBanks deliver the least amount of pay in the form of stock XXStock awards are favored over stock options for companies in all industries. FIXED/ CASH COMPENSATION VS. VARIABLE/STOCK COMPENSATION Energy FS - Banking FS -NonBanking Healthcare Manufacturing Real Estate Retail Technology Fixed Comp 42% 65% 59% 36% 49% 50% 45% 33% Equity Comp 58% 35% 41% 64% 51% 50% 55% 67% The following pages detail our findings for each of the eight industries. 9 . THE BDO 600 – 2015 Survey of Board Compensation Practices of 600 Mid-Market Public Companies 37% ENERGY 5% Board Retainers and Fees Committee Retainers and Fees 53% Stock Options $8,680 Board Retainers & Fees $71,563 Stock (Full Value) $102,146 5% Full-value Stock Awards Stock Options Committee Retainers & Fees $10,120 SURVEY BY INDUSTRY Energy Average annual total compensation paid to energy industry directors is second only to the technology industry. The following table summarizes the average annual total compensation paid to Board members of companies in the energy industry in FY 2014: Fiscal Year Board Retainers & Fees Committee Retainers & Fees Full-value Stock Awards Stock Options Total Compensation 2014 $71,563 $10,120 $102,146 $8,680 $192,509 2013 $69,806 $9,946 $80,972 $7,490 $168,214 Change 3% 2% 26% 16% 14% Total annual compensation paid to board members in the energy industry had the highest percentage increase from all of the surveyed industries. The majority of the increase was provided by an increase in full-value stock awards. The pay mix for these companies is summarized below: PAY MIX Year Committee Retainers & Fees Full-value Stock Awards Stock Options 2014 37% 5% 53% 5% 2013 10 Board Retainers & Fees 42% 6% 48% 4% . THE BDO 600 – 2015 Survey of Board Compensation Practices of 600 Mid-Market Public Companies 58% FINANCIAL SERVICES – BANKING 7% Board Retainers and Fees Stock Options $3,360 Committee Retainers and Fees 30% Board Retainers & Fees $39,814 5% Full-value Stock Awards Stock (Full Value) $21,029 Committee Retainers & Fees $4,889 Stock Options SURVEY BY INDUSTRY Financial Services – Banking Director pay in this industry remained somewhat flat, with only a 2% increase over last year, the second lowest increase in the survey. Average director compensation in the financial services – banking industry remains the lowest of the industries evaluated in our survey. The following table summarizes the average annual total compensation paid to Board members of companies in the financial services banking industry in FY 2014: Fiscal Year Board Retainers & Fees Committee Retainers & Fees Full-value Stock Awards Stock Options Total Compensation 2014 $39,814 $4,889 $21,029 $3,360 $69,092 2013 $39,060 $5,334 $18,755 $4,152 $67,301 Change 2% -8% 12% -19% 3% Our analysis found that unlike companies in the other industries, financial services companies (banking and non-banking) provide more compensation in cash than they do in equity. Banking delivers the least amount of pay as stock in absolute terms and as a percent of the overall package. The pay mix for these companies is summarized below: PAY MIX Year Board Retainers & Fees Committee Retainers & Fees Full-value Stock Awards Stock Options 2014 58% 7% 30% 5% 2013 58% 8% 28% 6% 11 . THE BDO 600 – 2015 Survey of Board Compensation Practices of 600 Mid-Market Public Companies 53% FINANCIAL SERVICES – NONBANKING 6% Board Retainers and Fees Committee Retainers and Fees 38% Board Retainers & Fees $63,683 3% Full-value Stock Awards Stock Options $3,709 Stock (Full Value) $45,722 Stock Options Committee Retainers & Fees $7,339 SURVEY BY INDUSTRY Financial Services – Nonbanking Average total director compensation in the financial services – nonbanking industry continues to be among the lowest of the industries included in our survey. The following table summarizes the average annual total compensation paid to Board members of companies in the financial services – non-banking industry in FY 2014: Fiscal Year Board Retainers & Fees Committee Retainers & Fees Full-value Stock Awards Stock Options Total Compensation 2014 $63,683 $7,339 $45,722 $3,709 $120,453 2013 $56,820 $6,137 $52,194 $8,270 $123,421 Change 12% 20% -12% -55% -3% Our analysis found that, unlike companies in the other industries, financial services companies (banking and non-banking) provide more compensation in cash than in equity. Last year, it appeared that the non-banking sector was increasing its use of stock; however, this year, the use of stock diminished, resulting in a pay mix that is more similar to the pay mix in 2012 than in 2013. The 2012 data has been provided below to illustrate this trend. PAY MIX Year Committee Retainers & Fees Full-value Stock Awards Stock Options 2014 54% 6% 38% 3% 2013 46% 5% 42% 7% 2012 12 Board Retainers & Fees 54% 7% 33% 6% . THE BDO 600 – 2015 Survey of Board Compensation Practices of 600 Mid-Market Public Companies HEALTHCARE 30% 6% 49% 15% Board Retainers and Fees Committee Retainers and Fees Full-value Stock Awards Stock Options $26,379 Board Retainers & Fees $53,522 Stock (Full Value) $86,596 Stock Options Committee Retainers & Fees $10,253 SURVEY BY INDUSTRY Healthcare Director compensation at these companies increased by 8% compared to pay in the prior fiscal year. The following table summarizes the average annual total compensation paid to Board members of companies in the healthcare industry in FY 2014: Fiscal Year Board Retainers & Fees Committee Retainers & Fees Full-value Stock Awards Stock Options Total Compensation 2014 $53,522 $10,253 $86,596 $26,379 $176,749 2013 $48,089 $9,225 $73,613 $32,142 $163,069 Change 11% 11% 18% -18% 8% Healthcare and technology companies deliver the highest percentage of director pay as equity and the smallest percentage as cash compared to other industries. The percentage of equity compensation offered by healthcare companies in our survey (64% this year, 65% last year) is second only to technology companies. The pay mix for these companies is summarized below: PAY MIX Year Board Retainers & Fees Committee Retainers & Fees Full-value Stock Awards Stock Options 2014 30% 6% 49% 15% 2013 29% 6% 45% 20% 13 . THE BDO 600 – 2015 Survey of Board Compensation Practices of 600 Mid-Market Public Companies 44% MANUFACTURING 5% Board Retainers and Fees Committee Retainers and Fees 41% Stock Options $13,975 Board Retainers & Fees $57,206 Stock (Full Value) $55,201 10% Full-value Stock Awards Stock Options Committee Retainers & Fees $7,314 SURVEY BY INDUSTRY Manufacturing Director pay in manufacturing companies has remained relatively flat since last year. The following table summarizes the average annual total compensation paid to Board members of companies in the Manufacturing industry in FY 2014: Fiscal Year Board Retainers & Fees Committee Retainers & Fees Full-value Stock Awards Stock Options Total Compensation 2014 $57,206 $7,314 $55,201 $13,975 $133,696 2013 $55,397 $7,370 $49,980 $16,545 $129,291 Change 3% -1% 10% -16% 3% Director compensation at these companies remained somewhat similar compared to the prior fiscal year. Consistent with our overall findings, there was a shift of grants to full-value shares from stock options. The pay mix for these companies is summarized below: PAY MIX Year Committee Retainers & Fees Full-value Stock Awards Stock Options 2014 44% 5% 41% 10% 2013 14 Board Retainers & Fees 43% 6% 38% 13% . THE BDO 600 – 2015 Survey of Board Compensation Practices of 600 Mid-Market Public Companies 43% REAL ESTATE 7% Board Retainers and Fees Committee Retainers and Fees 48% Stock Options $2,837 Board Retainers & Fees $65,960 2% Full-value Stock Awards Stock Options Stock (Full Value) $74,093 Committee Retainers & Fees $10,698 SURVEY BY INDUSTRY Real Estate When compared to pay in the prior fiscal year, director compensation at real estate companies increased by 5%. The following table summarizes the average annual total compensation paid to Board members of companies in the real estate industry in FY 2014: Fiscal Year Board Retainers & Fees Committee Retainers & Fees Full-value Stock Awards Stock Options Total Compensation 2014 $65,960 $10,698 $74,093 $2,837 $153,587 2013 $60,399 $11,316 $72,428 $2,347 $146,490 Change 9% -5% 2% 21% 5% The pay mix for these companies is summarized below: PAY MIX Year Board Retainers & Fees Committee Retainers & Fees Full-value Stock Awards Stock Options 2014 43% 7% 48% 2% 2013 41% 8% 49% 2% 15 . THE BDO 600 – 2015 Survey of Board Compensation Practices of 600 Mid-Market Public Companies 40% RETAIL 5% Board Retainers and Fees Committee Retainers and Fees 49% Stock Options $8,446 Board Retainers & Fees $52,214 Stock (Full Value) $64,450 6% Full-value Stock Awards Stock Options Committee Retainers & Fees $7,012 SURVEY BY INDUSTRY Retail Average total compensation paid to retail industry directors is lower than director compensation for the other non-financial services industries in our survey. When compared to pay in the prior fiscal year, director compensation at these companies increased 11%. The following table summarizes the average annual total compensation paid to Board members of companies in the retail industry in FY 2014: Fiscal Year Board Retainers & Fees Committee Retainers & Fees Full-value Stock Awards Stock Options Total Compensation 2014 $52,214 $7,012 $64,450 $8,446 $132,123 2013 $50,290 $7,007 $55,444 $6,256 $118,997 Change 4% 0% 16% 35% 11% Total annual compensation paid to Board members in the retail Industry had the second highest percentage increase from all of the surveyed industries, with only the Board members in the energy industry receiving a higher percentage increase. The majority of the increase was provided by an increase in full-value stock awards. The pay mix for these companies is summarized below: PAY MIX Year Committee Retainers & Fees Full-value Stock Awards Stock Options 2014 40% 5% 49% 6% 2013 16 Board Retainers & Fees 42% 6% 47% 5% . THE BDO 600 – 2015 Survey of Board Compensation Practices of 600 Mid-Market Public Companies TECHNOLOGY 27% 6% 55% Stock Options $24,810 12% Board Retainers and Fees Board Retainers & Fees $54,572 Committee Retainers and Fees Full-value Stock Awards Stock (Full Value) $113,077 Stock Options Committee Retainers & Fees $12,834 SURVEY BY INDUSTRY Technology Driven by high committee retainers and fees and full-value stock awards, average director compensation in the technology industry is the highest of the industries included in our survey. Director pay had a larger increase this year at 6%, after a somewhat flat 2013, which showed only a 2% increase. The following table summarizes the average annual total compensation paid to Board members of companies in the technology industry in FY 2014: Fiscal Year Board Retainers & Fees Committee Retainers & Fees Full-value Stock Awards Stock Options Total Compensation 2014 $54,572 $12,834 $113,077 $24,810 $205,293 2013 $50,640 $11,710 $99,258 $32,734 $194,341 Change 8% 10% 14% -24% 6% The pay mix between fixed and equity remained almost identical to last year. We did see a bit of a shift away from stock options in favor of full-value stock awards. The pay mix for these companies is summarized in the table below: PAY MIX Year Board Retainers & Fees Committee Retainers & Fees Full-value Stock Awards Stock Options 2014 27% 6% 55% 12% 2013 26% 6% 51% 17% 17 .
THE BDO 600 – 2015 Survey of Board Compensation Practices of 600 Mid-Market Public Companies The BDO 600: 2015 Survey of Board Compensation Practices of 600 Mid-Market Public Companies examined the compensation practices of publicly traded companies in the energy, financial services–banking, financial services–nonbanking, healthcare, manufacturing, real estate, retail and technology industries. Companies in the six non-financial service industries in our survey have annual revenues between $25 million and $1 billion. Companies in the two financial services industries in our survey have assets between $50 million and $2 billion. 18 ABOUT BDO BDO is the brand name for BDO USA, LLP, a U.S. professional services firm providing assurance, tax, advisory and consulting services to a wide range of publicly traded and privately held companies. For more than 100 years, BDO has provided quality service through the active involvement of experienced and committed professionals. The firm serves clients through 63 offices and more than 450 independent alliance firm locations nationwide. As an independent Member Firm of BDO International Limited, BDO serves multi-national clients through a global network of 1,408 offices in 154 countries. BDO USA, LLP, a Delaware limited liability partnership, is the U.S. member of BDO International Limited, a UK company limited by guarantee, and forms part of the international BDO network of independent member firms.
BDO is the brand name for the BDO network and for each of the BDO Member Firms. For more information please visit: www.bdo.com. ABOUT KENEXA Kenexa Corporation (NYSE:KNXA) helps drive HR and business outcomes through its unique combination of technology, content and services. Enabling organizations to optimize their workforces since 1987, Kenexa’s integrated talent acquisition and talent management solutions have touched the lives of more than 110 million people.
Additional information about Kenexa and its global products and services can be accessed at www.kenexa.com. . THE BDO 600 – 2015 Survey of Board Compensation Practices of 600 Mid-Market Public Companies BDO is the brand name for BDO USA, LLP, a U.S. professional services firm providing assurance, tax, advisory and consulting services to a wide range of publicly traded and privately held companies. For more than 100 years, BDO has provided quality service through the active involvement of experienced and committed professionals. The firm serves clients through 63 offices and more than 450 independent alliance firm locations nationwide. As an independent Member Firm of BDO International Limited, BDO serves multi-national clients through a global network of 1,408 offices in 154 countries. BDO USA, LLP, a Delaware limited liability partnership, is the U.S.
member of BDO International Limited, a UK company limited by guarantee, and forms part of the international BDO network of independent member firms. BDO is the brand name for the BDO network and for each of the BDO Member Firms. For more information please visit: www.bdo.com. Material discussed is meant to provide general information and should not be acted on without professional advice tailored to your firm’s individual needs. © 2016 BDO USA, LLP.
All rights reserved. 19 . Contact Us If you have any questions, comments or suggestions, please contact our Compensation and Benefits practice by emailing us at compensation@bdo.com or by calling your local BDO office. Please visit www.bdo.com/bdo600 for the electronic copy of this survey. THE BDO 600 SURVEY TEAM CONTACTS: Andy Gibson agibson@bdo.com / 404-979-7106 Randy Ramirez rramirez@bdo.com / 212-885-8015 .


