


Description
Bullseye
Highlights
Value and Momentum
Over the years, many investors have become familiar with the concept of style box investing, as popularized by
Morningstar (see www.morningstar.com). The basic premise is to analyze an investment and categorize it based
on size and style. With equities, the size is based on market capitalization. Some investors prefer the stability of
large companies while others may prefer the potential of smaller companies.
The style element is determined by the valuation of a stock based on the company’s fundamentals relative to the share price. For example, growth stocks are more likely to reinvest earnings, perhaps showing little profitability while they are growing their company. Value stocks, often referred to as diamonds in the rough, are stocks that are generally trading at depressed prices relative to the fundamentals. Rather than simply owning a broad-based index fund, many mutual funds are specifically segmented by size and capture large-cap growth, while others may prefer small-cap value, or some other combination.
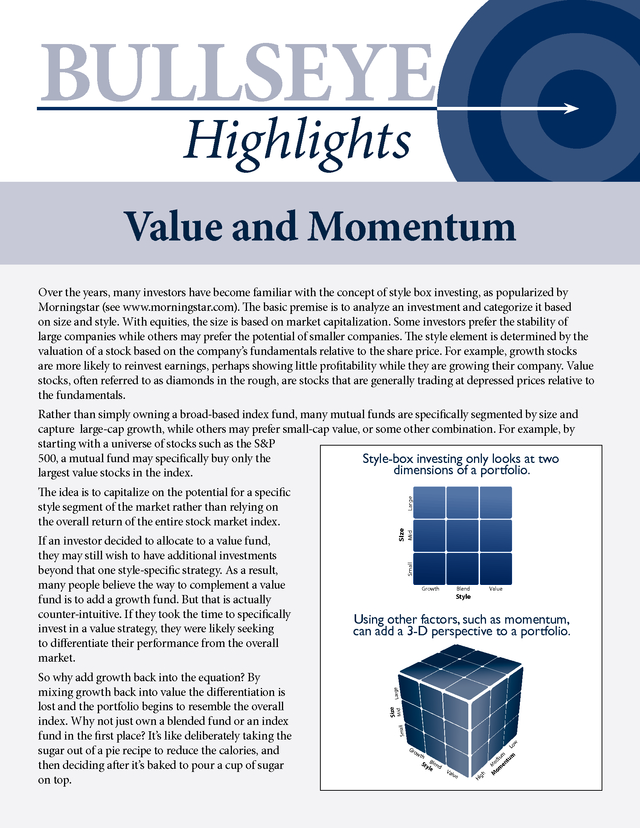
For example, by starting with a universe of stocks such as the S&P 500, a mutual fund may specifically buy only the Style-box investing only looks at two dimensions of a portfolio. largest value stocks in the index. Mid Size Small Blend Value Style Large Using other factors, such as momentum, can add a 3-D perspective to a portfolio. Mid Size So why add growth back into the equation? By mixing growth back into value the differentiation is lost and the portfolio begins to resemble the overall index. Why not just own a blended fund or an index fund in the first place? It’s like deliberately taking the sugar out of a pie recipe to reduce the calories, and then deciding after it’s baked to pour a cup of sugar on top. Growth Small If an investor decided to allocate to a value fund, they may still wish to have additional investments beyond that one style-specific strategy. As a result, many people believe the way to complement a value fund is to add a growth fund.
But that is actually counter-intuitive. If they took the time to specifically invest in a value strategy, they were likely seeking to differentiate their performance from the overall market. Large The idea is to capitalize on the potential for a specific style segment of the market rather than relying on the overall return of the entire stock market index. w Lo Gro wt h Sty Blend le Val ue M gh Hi m iu um ed ent M om . In order to enhance a value-based strategy without contradicting the style, an investor may want to consider using unrelated investment factors such as momentum. Momentum investing is based on the idea of trend following. Like Sir Isaac Newton’s theory of momentum, the concept is that an object in motion may remain in motion—but not forever. Remember, past performance is not an indication of future returns. Momentum strategies simply try to look at past performance to identify a trend in the early stages with the hope that it continues.
It’s like the difference between a photograph and a movie. Style box analysis is like taking a static snapshot to categorize an investment at a specific moment in time. Momentum strategies use a dynamic process to analyze the movement of an investment across multiple time periods.
Regardless of how an investment is categorized, momentum strategies can measure how they move. There are many ways to measure momentum. Relative strength (RS), for example, is a momentum-based strategy that measures the movement of a predefined group of investments across a period of time. The investments showing the best price movement are said to have the highest relative strength.
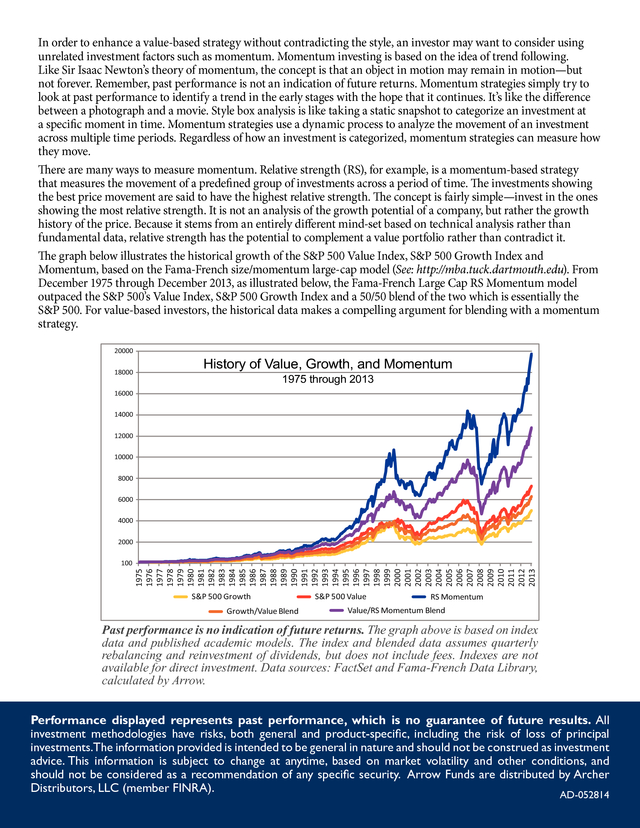
The concept is fairly simple—invest in the ones showing the most relative strength. It is not an analysis of the growth potential of a company, but rather the growth history of the price. Because it stems from an entirely different mind-set based on technical analysis rather than fundamental data, relative strength has the potential to complement a value portfolio rather than contradict it. The graph below illustrates the historical growth of the S&P 500 Value Index, S&P 500 Growth Index and Momentum, based on the Fama-French size/momentum large-cap model (See: http://mba.tuck.dartmouth.edu).
From December 1975 through December 2013, as illustrated below, the Fama-French Large Cap RS Momentum model outpaced the S&P 500’s Value Index, S&P 500 Growth Index and a 50/50 blend of the two which is essentially the S&P 500. For value-based investors, the historical data makes a compelling argument for blending with a momentum strategy. 20000 18000 History of Value, Growth, and Momentum 1975 through 2013 16000 14000 12000 10000 8000 6000 4000 2000 1975 1976 1977 1978 1979 1980 1981 1982 1983 1984 1985 1986 1987 1988 1989 1990 1991 1992 1993 1994 1995 1996 1997 1998 1999 2000 2001 2002 2003 2004 2005 2006 2007 2008 2009 2010 2011 2012 2013 100 S&P 500 Growth Growth/Value Blend S&P 500 Value RS Momentum Value/RS Momentum Blend Past performance is no indication of future returns. The graph above is based on index data and published academic models.
The index and blended data assumes quarterly rebalancing and reinvestment of dividends, but does not include fees. Indexes are not available for direct investment. Data sources: FactSet and Fama-French Data Library, calculated by Arrow. Performance displayed represents past performance, which is no guarantee of future results.
All investment methodologies have risks, both general and product-specific, including the risk of loss of principal investments.The information provided is intended to be general in nature and should not be construed as investment advice. This information is subject to change at anytime, based on market volatility and other conditions, and should not be considered as a recommendation of any specific security. Arrow Funds are distributed by Archer Distributors, LLC (member FINRA). AD-052814 .
The style element is determined by the valuation of a stock based on the company’s fundamentals relative to the share price. For example, growth stocks are more likely to reinvest earnings, perhaps showing little profitability while they are growing their company. Value stocks, often referred to as diamonds in the rough, are stocks that are generally trading at depressed prices relative to the fundamentals. Rather than simply owning a broad-based index fund, many mutual funds are specifically segmented by size and capture large-cap growth, while others may prefer small-cap value, or some other combination.
For example, by starting with a universe of stocks such as the S&P 500, a mutual fund may specifically buy only the Style-box investing only looks at two dimensions of a portfolio. largest value stocks in the index. Mid Size Small Blend Value Style Large Using other factors, such as momentum, can add a 3-D perspective to a portfolio. Mid Size So why add growth back into the equation? By mixing growth back into value the differentiation is lost and the portfolio begins to resemble the overall index. Why not just own a blended fund or an index fund in the first place? It’s like deliberately taking the sugar out of a pie recipe to reduce the calories, and then deciding after it’s baked to pour a cup of sugar on top. Growth Small If an investor decided to allocate to a value fund, they may still wish to have additional investments beyond that one style-specific strategy. As a result, many people believe the way to complement a value fund is to add a growth fund.
But that is actually counter-intuitive. If they took the time to specifically invest in a value strategy, they were likely seeking to differentiate their performance from the overall market. Large The idea is to capitalize on the potential for a specific style segment of the market rather than relying on the overall return of the entire stock market index. w Lo Gro wt h Sty Blend le Val ue M gh Hi m iu um ed ent M om . In order to enhance a value-based strategy without contradicting the style, an investor may want to consider using unrelated investment factors such as momentum. Momentum investing is based on the idea of trend following. Like Sir Isaac Newton’s theory of momentum, the concept is that an object in motion may remain in motion—but not forever. Remember, past performance is not an indication of future returns. Momentum strategies simply try to look at past performance to identify a trend in the early stages with the hope that it continues.
It’s like the difference between a photograph and a movie. Style box analysis is like taking a static snapshot to categorize an investment at a specific moment in time. Momentum strategies use a dynamic process to analyze the movement of an investment across multiple time periods.
Regardless of how an investment is categorized, momentum strategies can measure how they move. There are many ways to measure momentum. Relative strength (RS), for example, is a momentum-based strategy that measures the movement of a predefined group of investments across a period of time. The investments showing the best price movement are said to have the highest relative strength.
The concept is fairly simple—invest in the ones showing the most relative strength. It is not an analysis of the growth potential of a company, but rather the growth history of the price. Because it stems from an entirely different mind-set based on technical analysis rather than fundamental data, relative strength has the potential to complement a value portfolio rather than contradict it. The graph below illustrates the historical growth of the S&P 500 Value Index, S&P 500 Growth Index and Momentum, based on the Fama-French size/momentum large-cap model (See: http://mba.tuck.dartmouth.edu).
From December 1975 through December 2013, as illustrated below, the Fama-French Large Cap RS Momentum model outpaced the S&P 500’s Value Index, S&P 500 Growth Index and a 50/50 blend of the two which is essentially the S&P 500. For value-based investors, the historical data makes a compelling argument for blending with a momentum strategy. 20000 18000 History of Value, Growth, and Momentum 1975 through 2013 16000 14000 12000 10000 8000 6000 4000 2000 1975 1976 1977 1978 1979 1980 1981 1982 1983 1984 1985 1986 1987 1988 1989 1990 1991 1992 1993 1994 1995 1996 1997 1998 1999 2000 2001 2002 2003 2004 2005 2006 2007 2008 2009 2010 2011 2012 2013 100 S&P 500 Growth Growth/Value Blend S&P 500 Value RS Momentum Value/RS Momentum Blend Past performance is no indication of future returns. The graph above is based on index data and published academic models.
The index and blended data assumes quarterly rebalancing and reinvestment of dividends, but does not include fees. Indexes are not available for direct investment. Data sources: FactSet and Fama-French Data Library, calculated by Arrow. Performance displayed represents past performance, which is no guarantee of future results.
All investment methodologies have risks, both general and product-specific, including the risk of loss of principal investments.The information provided is intended to be general in nature and should not be construed as investment advice. This information is subject to change at anytime, based on market volatility and other conditions, and should not be considered as a recommendation of any specific security. Arrow Funds are distributed by Archer Distributors, LLC (member FINRA). AD-052814 .


