


Description
Arrow Insights
Market Turns
W
ith market indexes trending lower and volatility hitting extreme levels, many investors have lost confidence in financial institutions and
the market. Others have exited the equity markets in fear. While history does not always repeat itself, it can serve as a guide through
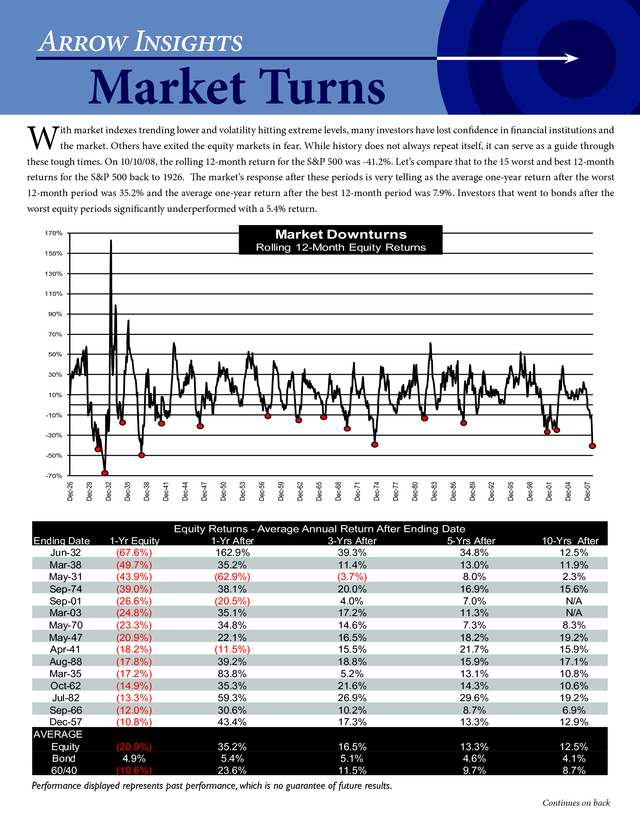
these tough times. On 10/10/08, the rolling 12-month return for the S&P 500 was -41.2%.
Let’s compare that to the 15 worst and best 12-month returns for the S&P 500 back to 1926. The market’s response after these periods is very telling as the average one-year return after the worst 12-month period was 35.2% and the average one-year return after the best 12-month period was 7.9%. Investors that went to bonds after the worst equity periods significantly underperformed with a 5.4% return. Market Downturns 170% Rolling 12-Month Equity Returns 150% 130% 110% 90% 70% 50% 30% 10% -10% -30% -50% Ending Date Jun-32 Mar-38 May-31 Sep-74 Sep-01 Mar-03 May-70 May-47 Apr-41 Aug-88 Mar-35 Oct-62 Jul-82 Sep-66 Dec-57 AVERAGE Equity Bond 60/40 1-Yr Equity (67.6%) (49.7%) (43.9%) (39.0%) (26.6%) (24.8%) (23.3%) (20.9%) (18.2%) (17.8%) (17.2%) (14.9%) (13.3%) (12.0%) (10.8%) (20.9%) 4.9% (10.6%) Equity Returns - Average Annual Return After Ending Date 1-Yr After 3-Yrs After 5-Yrs After 162.9% 39.3% 34.8% 35.2% 11.4% 13.0% (62.9%) (3.7%) 8.0% 38.1% 20.0% 16.9% (20.5%) 4.0% 7.0% 35.1% 17.2% 11.3% 34.8% 14.6% 7.3% 22.1% 16.5% 18.2% (11.5%) 15.5% 21.7% 39.2% 18.8% 15.9% 83.8% 5.2% 13.1% 35.3% 21.6% 14.3% 59.3% 26.9% 29.6% 30.6% 10.2% 8.7% 43.4% 17.3% 13.3% 35.2% 5.4% 23.6% 16.5% 5.1% 11.5% 13.3% 4.6% 9.7% Dec-07 Dec-04 Dec-01 Dec-98 Dec-95 Dec-92 Dec-89 Dec-86 Dec-83 Dec-80 Dec-77 Dec-74 Dec-71 Dec-68 Dec-65 Dec-62 Dec-59 Dec-56 Dec-53 Dec-50 Dec-47 Dec-44 Dec-41 Dec-38 Dec-35 Dec-32 Dec-29 Dec-26 -70% 10-Yrs After 12.5% 11.9% 2.3% 15.6% N/A N/A 8.3% 19.2% 15.9% 17.1% 10.8% 10.6% 19.2% 6.9% 12.9% 12.5% 4.1% 8.7% Performance displayed represents past performance, which is no guarantee of future results. Continues on back .
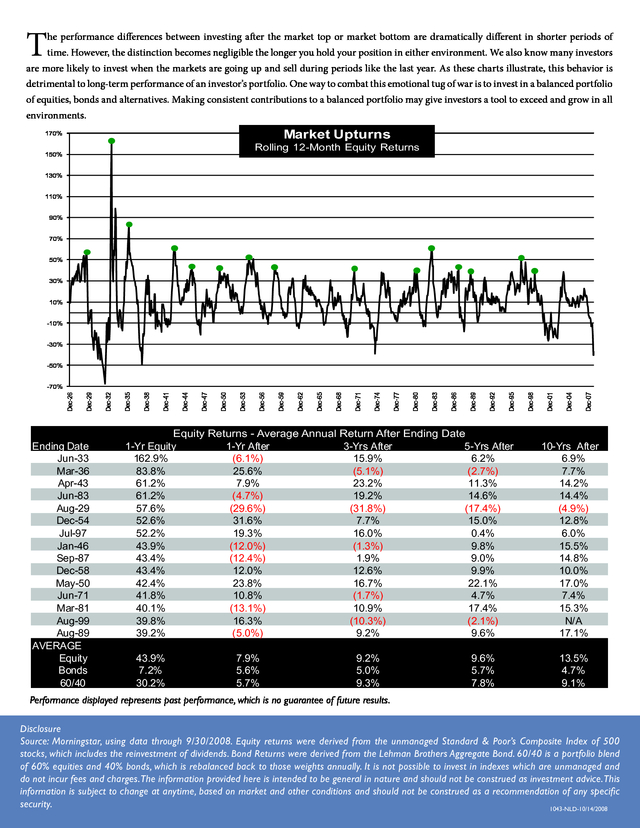
T he performance differences between investing after the market top or market bottom are dramatically different in shorter periods of time. However, the distinction becomes negligible the longer you hold your position in either environment. We also know many investors are more likely to invest when the markets are going up and sell during periods like the last year. As these charts illustrate, this behavior is detrimental to long-term performance of an investor’s portfolio.
One way to combat this emotional tug of war is to invest in a balanced portfolio of equities, bonds and alternatives. Making consistent contributions to a balanced portfolio may give investors a tool to exceed and grow in all environments. Market Upturns 170% Rolling 12-Month Equity Returns 150% 130% 110% 90% 70% 50% 30% 10% -10% -30% -50% Ending Date Jun-33 Mar-36 Apr-43 Jun-83 Aug-29 Dec-54 Jul-97 Jan-46 Sep-87 Dec-58 May-50 Jun-71 Mar-81 Aug-99 Aug-89 AVERAGE Equity Bonds 60/40 Equity Returns - Average Annual Return After Ending Date 1-Yr Equity 1-Yr After 3-Yrs After 5-Yrs After 162.9% (6.1%) 15.9% 6.2% 83.8% 25.6% (5.1%) (2.7%) 61.2% 7.9% 23.2% 11.3% 61.2% (4.7%) 19.2% 14.6% 57.6% (29.6%) (31.8%) (17.4%) 52.6% 31.6% 7.7% 15.0% 52.2% 19.3% 16.0% 0.4% 43.9% (12.0%) (1.3%) 9.8% 43.4% (12.4%) 1.9% 9.0% 43.4% 12.0% 12.6% 9.9% 42.4% 23.8% 16.7% 22.1% 41.8% 10.8% (1.7%) 4.7% 40.1% (13.1%) 10.9% 17.4% 39.8% 16.3% (10.3%) (2.1%) 39.2% (5.0%) 9.2% 9.6% 43.9% 7.2% 30.2% 7.9% 5.6% 5.7% 9.2% 5.0% 9.3% 9.6% 5.7% 7.8% Dec-07 Dec-04 Dec-01 Dec-98 Dec-95 Dec-92 Dec-89 Dec-86 Dec-83 Dec-80 Dec-77 Dec-74 Dec-71 Dec-68 Dec-65 Dec-62 Dec-59 Dec-56 Dec-53 Dec-50 Dec-47 Dec-44 Dec-41 Dec-38 Dec-35 Dec-32 Dec-29 Dec-26 -70% 10-Yrs After 6.9% 7.7% 14.2% 14.4% (4.9%) 12.8% 6.0% 15.5% 14.8% 10.0% 17.0% 7.4% 15.3% N/A 17.1% 13.5% 4.7% 9.1% Performance displayed represents past performance, which is no guarantee of future results. Disclosure Source: Morningstar, using data through 9/30/2008. Equity returns were derived from the unmanaged Standard & Poor’s Composite Index of 500 stocks, which includes the reinvestment of dividends.
Bond Returns were derived from the Lehman Brothers Aggregate Bond. 60/40 is a portfolio blend of 60% equities and 40% bonds, which is rebalanced back to those weights annually. It is not possible to invest in indexes which are unmanaged and do not incur fees and charges.
The information provided here is intended to be general in nature and should not be construed as investment advice. This information is subject to change at anytime, based on market and other conditions and should not be construed as a recommendation of any specific security. 1043-NLD-10/14/2008 .
Let’s compare that to the 15 worst and best 12-month returns for the S&P 500 back to 1926. The market’s response after these periods is very telling as the average one-year return after the worst 12-month period was 35.2% and the average one-year return after the best 12-month period was 7.9%. Investors that went to bonds after the worst equity periods significantly underperformed with a 5.4% return. Market Downturns 170% Rolling 12-Month Equity Returns 150% 130% 110% 90% 70% 50% 30% 10% -10% -30% -50% Ending Date Jun-32 Mar-38 May-31 Sep-74 Sep-01 Mar-03 May-70 May-47 Apr-41 Aug-88 Mar-35 Oct-62 Jul-82 Sep-66 Dec-57 AVERAGE Equity Bond 60/40 1-Yr Equity (67.6%) (49.7%) (43.9%) (39.0%) (26.6%) (24.8%) (23.3%) (20.9%) (18.2%) (17.8%) (17.2%) (14.9%) (13.3%) (12.0%) (10.8%) (20.9%) 4.9% (10.6%) Equity Returns - Average Annual Return After Ending Date 1-Yr After 3-Yrs After 5-Yrs After 162.9% 39.3% 34.8% 35.2% 11.4% 13.0% (62.9%) (3.7%) 8.0% 38.1% 20.0% 16.9% (20.5%) 4.0% 7.0% 35.1% 17.2% 11.3% 34.8% 14.6% 7.3% 22.1% 16.5% 18.2% (11.5%) 15.5% 21.7% 39.2% 18.8% 15.9% 83.8% 5.2% 13.1% 35.3% 21.6% 14.3% 59.3% 26.9% 29.6% 30.6% 10.2% 8.7% 43.4% 17.3% 13.3% 35.2% 5.4% 23.6% 16.5% 5.1% 11.5% 13.3% 4.6% 9.7% Dec-07 Dec-04 Dec-01 Dec-98 Dec-95 Dec-92 Dec-89 Dec-86 Dec-83 Dec-80 Dec-77 Dec-74 Dec-71 Dec-68 Dec-65 Dec-62 Dec-59 Dec-56 Dec-53 Dec-50 Dec-47 Dec-44 Dec-41 Dec-38 Dec-35 Dec-32 Dec-29 Dec-26 -70% 10-Yrs After 12.5% 11.9% 2.3% 15.6% N/A N/A 8.3% 19.2% 15.9% 17.1% 10.8% 10.6% 19.2% 6.9% 12.9% 12.5% 4.1% 8.7% Performance displayed represents past performance, which is no guarantee of future results. Continues on back .
T he performance differences between investing after the market top or market bottom are dramatically different in shorter periods of time. However, the distinction becomes negligible the longer you hold your position in either environment. We also know many investors are more likely to invest when the markets are going up and sell during periods like the last year. As these charts illustrate, this behavior is detrimental to long-term performance of an investor’s portfolio.
One way to combat this emotional tug of war is to invest in a balanced portfolio of equities, bonds and alternatives. Making consistent contributions to a balanced portfolio may give investors a tool to exceed and grow in all environments. Market Upturns 170% Rolling 12-Month Equity Returns 150% 130% 110% 90% 70% 50% 30% 10% -10% -30% -50% Ending Date Jun-33 Mar-36 Apr-43 Jun-83 Aug-29 Dec-54 Jul-97 Jan-46 Sep-87 Dec-58 May-50 Jun-71 Mar-81 Aug-99 Aug-89 AVERAGE Equity Bonds 60/40 Equity Returns - Average Annual Return After Ending Date 1-Yr Equity 1-Yr After 3-Yrs After 5-Yrs After 162.9% (6.1%) 15.9% 6.2% 83.8% 25.6% (5.1%) (2.7%) 61.2% 7.9% 23.2% 11.3% 61.2% (4.7%) 19.2% 14.6% 57.6% (29.6%) (31.8%) (17.4%) 52.6% 31.6% 7.7% 15.0% 52.2% 19.3% 16.0% 0.4% 43.9% (12.0%) (1.3%) 9.8% 43.4% (12.4%) 1.9% 9.0% 43.4% 12.0% 12.6% 9.9% 42.4% 23.8% 16.7% 22.1% 41.8% 10.8% (1.7%) 4.7% 40.1% (13.1%) 10.9% 17.4% 39.8% 16.3% (10.3%) (2.1%) 39.2% (5.0%) 9.2% 9.6% 43.9% 7.2% 30.2% 7.9% 5.6% 5.7% 9.2% 5.0% 9.3% 9.6% 5.7% 7.8% Dec-07 Dec-04 Dec-01 Dec-98 Dec-95 Dec-92 Dec-89 Dec-86 Dec-83 Dec-80 Dec-77 Dec-74 Dec-71 Dec-68 Dec-65 Dec-62 Dec-59 Dec-56 Dec-53 Dec-50 Dec-47 Dec-44 Dec-41 Dec-38 Dec-35 Dec-32 Dec-29 Dec-26 -70% 10-Yrs After 6.9% 7.7% 14.2% 14.4% (4.9%) 12.8% 6.0% 15.5% 14.8% 10.0% 17.0% 7.4% 15.3% N/A 17.1% 13.5% 4.7% 9.1% Performance displayed represents past performance, which is no guarantee of future results. Disclosure Source: Morningstar, using data through 9/30/2008. Equity returns were derived from the unmanaged Standard & Poor’s Composite Index of 500 stocks, which includes the reinvestment of dividends.
Bond Returns were derived from the Lehman Brothers Aggregate Bond. 60/40 is a portfolio blend of 60% equities and 40% bonds, which is rebalanced back to those weights annually. It is not possible to invest in indexes which are unmanaged and do not incur fees and charges.
The information provided here is intended to be general in nature and should not be construed as investment advice. This information is subject to change at anytime, based on market and other conditions and should not be construed as a recommendation of any specific security. 1043-NLD-10/14/2008 .


