


Description
Bullseye
Highlights
Managed Futures
M
anaged futures have grown in popularity for the past few
decades. Yet they remain a mystery to many investors.
Although today’s managed futures traders do use very
complicated algorithms and trading systems, the central story
behind managed futures is grounded in the basic principles of
supply and demand.
Futures contracts were originally created in the mid-1800s
to help farmers control seasonal price changes for their
crops while helping the buyers of crops manage swings in
production costs. The price of a crop was often lower right
after the harvest because there was so much available from
all the various farmers. But as the season ended, the supply
of crops diminished and the prices would increase.
This method of variable supply and demand pricing was
quite erratic.
To help stabilize these fluctuations, buyers and sellers created contracts in which they agreed upon a predetermined price for delivery of the crop at a designated time in the future. These contracts allowed farmers to lock in a price for the entire season and helped reduce the risks of changing demand. For manufacturers who relied on the crops, the contracts stabilized their costs and guaranteed continuous delivery for production. created far greater liquidity, which helped to narrow the spreads of sometimes wildly fluctuating seasonal price swings. The 1970s and 1980s brought about the creation of financial futures instruments.
Just like farmers and manufacturers, the financial markets needed a way to hedge against inflation, market volatility and foreign currency fluctuations. Similar to commodity futures, financial futures contracts help establish a price today for the future delivery of stocks, bonds and currencies. The combination of commodities and financials, along with electronic trading, has helped the futures market grow into a truly worldwide place of commerce. The term “Managed Futures” comes from Commodity Trading Advisors (CTAs) who manage accounts on behalf of high net worth clients and institutional investors.
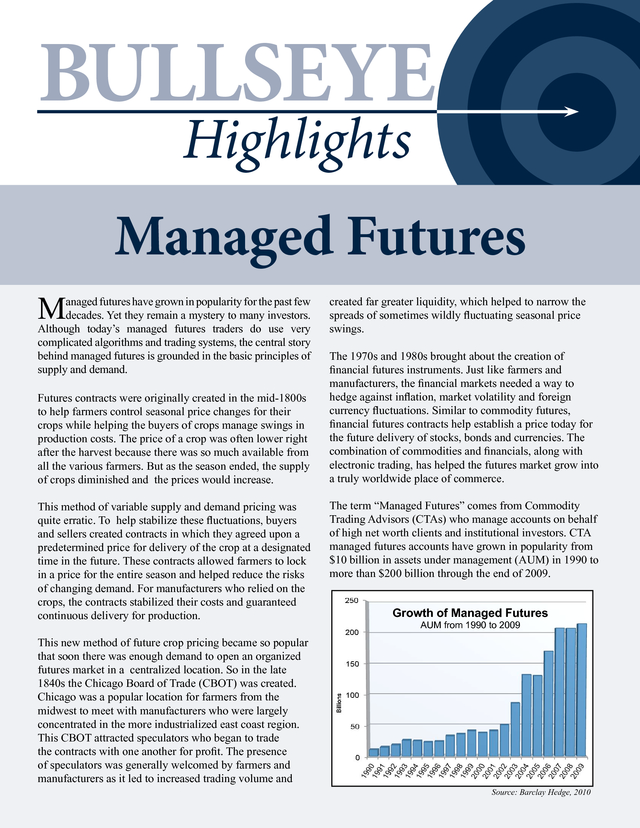
CTA managed futures accounts have grown in popularity from $10 billion in assets under management (AUM) in 1990 to more than $200 billion through the end of 2009. Growth of Managed Futures AUM from 1990 to 2009 This new method of future crop pricing became so popular that soon there was enough demand to open an organized futures market in a centralized location. So in the late 1840s the Chicago Board of Trade (CBOT) was created. Chicago was a popular location for farmers from the midwest to meet with manufacturers who were largely concentrated in the more industrialized east coast region. This CBOT attracted speculators who began to trade the contracts with one another for profit. The presence of speculators was generally welcomed by farmers and manufacturers as it led to increased trading volume and Source: Barclay Hedge, 2010 .
The reason for the growth in popularity of managed futures is quite clear. Managed futures are a compelling choice for investors seeking portfolio diversification, exposure to nontraditional assets, and access to directional trading strategies. One of the key benefits of managed futures is their low correlation to traditional assets, which makes them an attractive and efficient portfolio diversification tool. Many of the more popular managed futures investments use long/short trendfollowing systems to identify opportunities during both rising (long) and falling (short) markets. The long/short nature of managed futures has allowed for periods of historically strong performance even during periods of stress in the equity markets.
It is precisely this lack of correlation which makes managed futures so attractive to investors seeking improved portfolio diversification. The equity markets in the decade of the 2000s were marked by three distinct periods: a bear market, a bull market and a financial crisis. The first three years of the decade saw a bear market resulting from the Internet bubble burst. The following three years were very bullish as stocks recovered and went on to new highs.
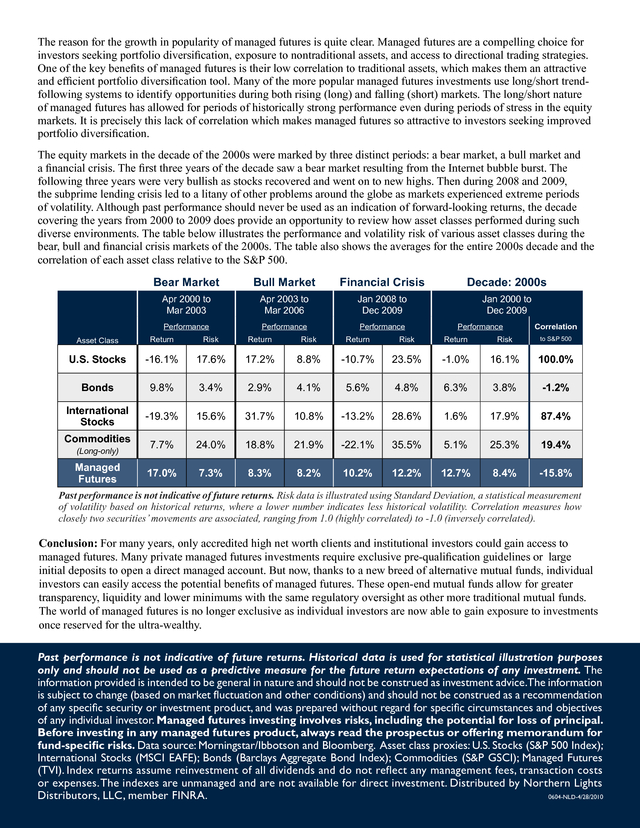
Then during 2008 and 2009, the subprime lending crisis led to a litany of other problems around the globe as markets experienced extreme periods of volatility. Although past performance should never be used as an indication of forward-looking returns, the decade covering the years from 2000 to 2009 does provide an opportunity to review how asset classes performed during such diverse environments. The table below illustrates the performance and volatility risk of various asset classes during the bear, bull and financial crisis markets of the 2000s.
The table also shows the averages for the entire 2000s decade and the correlation of each asset class relative to the S&P 500. Bear Market Bull Market Financial Crisis Decade: 2000s Apr 2000 to Mar 2003 Apr 2003 to Mar 2006 Jan 2008 to Dec 2009 Jan 2000 to Dec 2009 Performance Performance Performance Performance Correlation Asset Class Return Risk Return Risk Return Risk Return Risk to S&P 500 U.S. Stocks -16.1% 17.6% 17.2% 8.8% -10.7% 23.5% -1.0% 16.1% 100.0% Bonds 9.8% 3.4% 2.9% 4.1% 5.6% 4.8% 6.3% 3.8% -1.2% International Stocks -19.3% 15.6% 31.7% 10.8% -13.2% 28.6% 1.6% 17.9% 87.4% 7.7% 24.0% 18.8% 21.9% -22.1% 35.5% 5.1% 25.3% 19.4% 17.0% 7.3% 8.3% 8.2% 10.2% 12.2% 12.7% 8.4% -15.8% Commodities (Long-only) Managed Futures Past performance is not indicative of future returns. Risk data is illustrated using Standard Deviation, a statistical measurement of volatility based on historical returns, where a lower number indicates less historical volatility.
Correlation measures how closely two securities’ movements are associated, ranging from 1.0 (highly correlated) to -1.0 (inversely correlated). Conclusion: For many years, only accredited high net worth clients and institutional investors could gain access to managed futures. Many private managed futures investments require exclusive pre-qualification guidelines or large initial deposits to open a direct managed account. But now, thanks to a new breed of alternative mutual funds, individual investors can easily access the potential benefits of managed futures.
These open-end mutual funds allow for greater transparency, liquidity and lower minimums with the same regulatory oversight as other more traditional mutual funds. The world of managed futures is no longer exclusive as individual investors are now able to gain exposure to investments once reserved for the ultra-wealthy. Past performance is not indicative of future returns. Historical data is used for statistical illustration purposes only and should not be used as a predictive measure for the future return expectations of any investment. The information provided is intended to be general in nature and should not be construed as investment advice.The information is subject to change (based on market fluctuation and other conditions) and should not be construed as a recommendation of any specific security or investment product, and was prepared without regard for specific circumstances and objectives of any individual investor.
Managed futures investing involves risks, including the potential for loss of principal. Before investing in any managed futures product, always read the prospectus or offering memorandum for fund-specific risks. Data source: Morningstar/Ibbotson and Bloomberg. Asset class proxies: U.S.
Stocks (S&P 500 Index); International Stocks (MSCI EAFE); Bonds (Barclays Aggregate Bond Index); Commodities (S&P GSCI); Managed Futures (TVI). Index returns assume reinvestment of all dividends and do not reflect any management fees, transaction costs or expenses. The indexes are unmanaged and are not available for direct investment.
Distributed by Northern Lights 0604-NLD-4/28/2010 Distributors, LLC, member FINRA. .
To help stabilize these fluctuations, buyers and sellers created contracts in which they agreed upon a predetermined price for delivery of the crop at a designated time in the future. These contracts allowed farmers to lock in a price for the entire season and helped reduce the risks of changing demand. For manufacturers who relied on the crops, the contracts stabilized their costs and guaranteed continuous delivery for production. created far greater liquidity, which helped to narrow the spreads of sometimes wildly fluctuating seasonal price swings. The 1970s and 1980s brought about the creation of financial futures instruments.
Just like farmers and manufacturers, the financial markets needed a way to hedge against inflation, market volatility and foreign currency fluctuations. Similar to commodity futures, financial futures contracts help establish a price today for the future delivery of stocks, bonds and currencies. The combination of commodities and financials, along with electronic trading, has helped the futures market grow into a truly worldwide place of commerce. The term “Managed Futures” comes from Commodity Trading Advisors (CTAs) who manage accounts on behalf of high net worth clients and institutional investors.
CTA managed futures accounts have grown in popularity from $10 billion in assets under management (AUM) in 1990 to more than $200 billion through the end of 2009. Growth of Managed Futures AUM from 1990 to 2009 This new method of future crop pricing became so popular that soon there was enough demand to open an organized futures market in a centralized location. So in the late 1840s the Chicago Board of Trade (CBOT) was created. Chicago was a popular location for farmers from the midwest to meet with manufacturers who were largely concentrated in the more industrialized east coast region. This CBOT attracted speculators who began to trade the contracts with one another for profit. The presence of speculators was generally welcomed by farmers and manufacturers as it led to increased trading volume and Source: Barclay Hedge, 2010 .
The reason for the growth in popularity of managed futures is quite clear. Managed futures are a compelling choice for investors seeking portfolio diversification, exposure to nontraditional assets, and access to directional trading strategies. One of the key benefits of managed futures is their low correlation to traditional assets, which makes them an attractive and efficient portfolio diversification tool. Many of the more popular managed futures investments use long/short trendfollowing systems to identify opportunities during both rising (long) and falling (short) markets. The long/short nature of managed futures has allowed for periods of historically strong performance even during periods of stress in the equity markets.
It is precisely this lack of correlation which makes managed futures so attractive to investors seeking improved portfolio diversification. The equity markets in the decade of the 2000s were marked by three distinct periods: a bear market, a bull market and a financial crisis. The first three years of the decade saw a bear market resulting from the Internet bubble burst. The following three years were very bullish as stocks recovered and went on to new highs.
Then during 2008 and 2009, the subprime lending crisis led to a litany of other problems around the globe as markets experienced extreme periods of volatility. Although past performance should never be used as an indication of forward-looking returns, the decade covering the years from 2000 to 2009 does provide an opportunity to review how asset classes performed during such diverse environments. The table below illustrates the performance and volatility risk of various asset classes during the bear, bull and financial crisis markets of the 2000s.
The table also shows the averages for the entire 2000s decade and the correlation of each asset class relative to the S&P 500. Bear Market Bull Market Financial Crisis Decade: 2000s Apr 2000 to Mar 2003 Apr 2003 to Mar 2006 Jan 2008 to Dec 2009 Jan 2000 to Dec 2009 Performance Performance Performance Performance Correlation Asset Class Return Risk Return Risk Return Risk Return Risk to S&P 500 U.S. Stocks -16.1% 17.6% 17.2% 8.8% -10.7% 23.5% -1.0% 16.1% 100.0% Bonds 9.8% 3.4% 2.9% 4.1% 5.6% 4.8% 6.3% 3.8% -1.2% International Stocks -19.3% 15.6% 31.7% 10.8% -13.2% 28.6% 1.6% 17.9% 87.4% 7.7% 24.0% 18.8% 21.9% -22.1% 35.5% 5.1% 25.3% 19.4% 17.0% 7.3% 8.3% 8.2% 10.2% 12.2% 12.7% 8.4% -15.8% Commodities (Long-only) Managed Futures Past performance is not indicative of future returns. Risk data is illustrated using Standard Deviation, a statistical measurement of volatility based on historical returns, where a lower number indicates less historical volatility.
Correlation measures how closely two securities’ movements are associated, ranging from 1.0 (highly correlated) to -1.0 (inversely correlated). Conclusion: For many years, only accredited high net worth clients and institutional investors could gain access to managed futures. Many private managed futures investments require exclusive pre-qualification guidelines or large initial deposits to open a direct managed account. But now, thanks to a new breed of alternative mutual funds, individual investors can easily access the potential benefits of managed futures.
These open-end mutual funds allow for greater transparency, liquidity and lower minimums with the same regulatory oversight as other more traditional mutual funds. The world of managed futures is no longer exclusive as individual investors are now able to gain exposure to investments once reserved for the ultra-wealthy. Past performance is not indicative of future returns. Historical data is used for statistical illustration purposes only and should not be used as a predictive measure for the future return expectations of any investment. The information provided is intended to be general in nature and should not be construed as investment advice.The information is subject to change (based on market fluctuation and other conditions) and should not be construed as a recommendation of any specific security or investment product, and was prepared without regard for specific circumstances and objectives of any individual investor.
Managed futures investing involves risks, including the potential for loss of principal. Before investing in any managed futures product, always read the prospectus or offering memorandum for fund-specific risks. Data source: Morningstar/Ibbotson and Bloomberg. Asset class proxies: U.S.
Stocks (S&P 500 Index); International Stocks (MSCI EAFE); Bonds (Barclays Aggregate Bond Index); Commodities (S&P GSCI); Managed Futures (TVI). Index returns assume reinvestment of all dividends and do not reflect any management fees, transaction costs or expenses. The indexes are unmanaged and are not available for direct investment.
Distributed by Northern Lights 0604-NLD-4/28/2010 Distributors, LLC, member FINRA. .


