


Description
Bullseye
Highlights
The History of Inflation
The Effect of Inflation on $1 from 1976-2010
$4.00
Highest Inflationary Calendar Years
Inflation
CPI
$3.50
1976-1981
1987-1990
PPI
1977-1981
1989-1990
2005,2007,2009
$3.00
I
$2.50
19
7
19 6
7
19 8
80
19
8
19 2
84
19
8
19 6
88
19
9
19 0
92
19
9
19 4
96
19
9
20 8
0
20 0
02
20
0
20 4
06
20
0
20 8
10
nflation is generally defined as an increase of prices for goods and services. Everyone knows that the price of a loaf of
$2.00
bread in the 1950s was only a fraction of today’s cost—that’s due to inflation. In essence, inflation erodes the buying
power of the dollar because every dollar you have today buys a smaller percentage of goods or services in the future.
$1.50
Both the Consumer Price Index (CPI) and the Producer Price Index (PPI) are used as measures of inflation. The CPI
shows how prices to buy goods and services have increased, whereas the PPI reflects price increases for producing goods
and services.
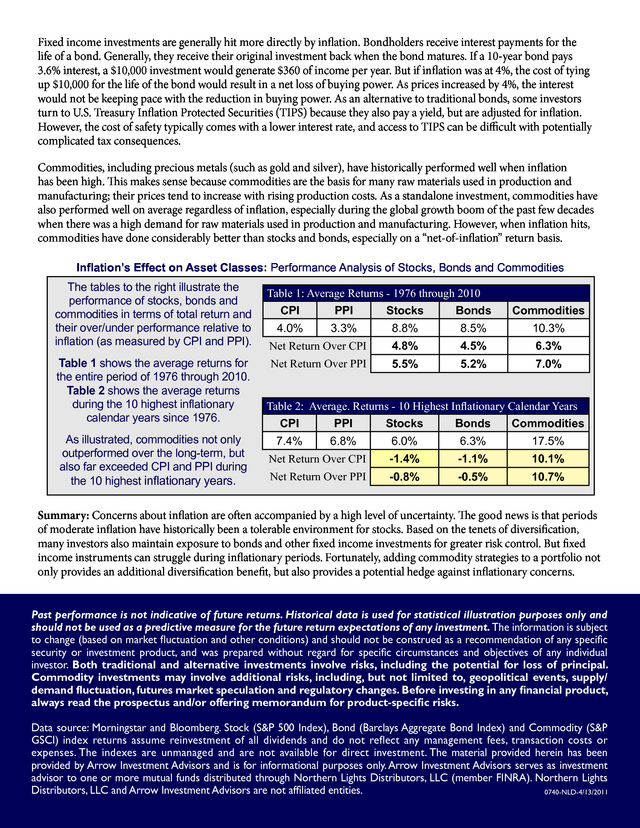
In some circumstances, production costs can go up without the costs being passed along to the consumer. $1.00 And sometimes consumer prices can increase even though the production costs remained constant. Depending on your perspective, either index serves as a valued measurement for tracking inflation. The History of Inflation The Effect of Inflation on $1 from 1976-2010 $4.00 Highest Inflationary Calendar Years $3.50 PPI CPI 1977-1981 1989-1990 2005,2007,2009 1976-1981 1987-1990 $3.00 $2.50 $2.00 $1.50 20 00 20 02 20 04 20 06 20 08 20 10 8 6 19 9 19 9 19 9 4 2 0 19 9 19 9 8 6 19 8 19 8 19 8 4 2 0 19 8 19 8 19 7 8 6 $1.00 19 7 The graph to the right shows the historical impact of inflation on the U.S. dollar’s buying power from 1976 through 2010 with the CPI shown in red, the PPI in blue and the 10 highest respective calendar years circled in green.
One could argue that the divergence of the lines in the early 1980s seems to reflect the economic environment of the times as corporate profits rose. The reluctance to pass price increases on to consumers in the mid 2000s is indicated by the PPI starting to narrow the gap between the CPI, perhaps reflective of corporate pull-backs after the dot.com bubble and the financial crisis. Inflation was a major concern during the 1970s and the effects were quite obvious. There were many major events worldwide that helped to drive prices higher, including U.S.
military action overseas, turmoil in the Middle East, high unemployment and an economy in crisis. It’s no wonder that people are drawing present-day comparisons with those events of the past. Fear of inflation is an ongoing concern, but some periods of time seem to be more primed for inflation than others.
So it’s also no wonder that inflation’s impact on a investment portfolio is a topic that arises with regularity. Stocks are often seen as a better hedge against inflation than investing in fixed income securities. Stocks have historically held their own during periods of moderate inflation, at times doing quite well. However, the net result of any investment’s performance is ultimately reduced by the effect of inflation.
For example, if a stock goes up 10% during a period when inflation also rose 4%, then the net result of the gain is reduced to 6% (subtracting 4% inflation from the 10% return). In other words, a $100 investment today may return $110 in the future, but that $10 profit will buy less than it did before. Keep in mind, this is a simplified explanation and is only meant to illustrate the impact of inflation on positive returns. . Fixed income investments are generally hit more directly by inflation. Bondholders receive interest payments for the life of a bond. Generally, they receive their original investment back when the bond matures. If a 10-year bond pays 3.6% interest, a $10,000 investment would generate $360 of income per year.
But if inflation was at 4%, the cost of tying up $10,000 for the life of the bond would result in a net loss of buying power. As prices increased by 4%, the interest would not be keeping pace with the reduction in buying power. As an alternative to traditional bonds, some investors turn to U.S.
Treasury Inflation Protected Securities (TIPS) because they also pay a yield, but are adjusted for inflation. However, the cost of safety typically comes with a lower interest rate, and access to TIPS can be difficult with potentially complicated tax consequences. Commodities, including precious metals (such as gold and silver), have historically performed well when inflation has been high. This makes sense because commodities are the basis for many raw materials used in production and manufacturing; their prices tend to increase with rising production costs. As a standalone investment, commodities have also performed well on average regardless of inflation, especially during the global growth boom of the past few decades when there was a high demand for raw materials used in production and manufacturing.
However, when inflation hits, commodities have done considerably better than stocks and bonds, especially on a “net-of-inflation” return basis. Inflation’s Effect on Asset Classes: Performance Analysis of Stocks, Bonds and Commodities The tables to the right illustrate the performance of stocks, bonds and commodities in terms of total return and their over/under performance relative to inflation (as measured by CPI and PPI). Table 1 shows the average returns for the entire period of 1976 through 2010. Table 2 shows the average returns during the 10 highest inflationary calendar years since 1976. As illustrated, commodities not only outperformed over the long-term, but also far exceeded CPI and PPI during the 10 highest inflationary years. Table 1: Average Returns - 1976 through 2010 CPI PPI Stocks Bonds 4.0% 3.3% Commodities 8.8% 8.5% 10.3% Net Return Over CPI 4.8% 4.5% 6.3% Net Return Over PPI 5.5% 5.2% 7.0% Table 2: Average. Returns - 10 Highest Inflationary Calendar Years CPI PPI Stocks Bonds Commodities 7.4% 6.8% 6.0% 6.3% 17.5% Net Return Over CPI -1.4% -1.1% 10.1% Net Return Over PPI -0.8% -0.5% 10.7% Summary: Concerns about inflation are often accompanied by a high level of uncertainty. The good news is that periods of moderate inflation have historically been a tolerable environment for stocks.
Based on the tenets of diversification, many investors also maintain exposure to bonds and other fixed income investments for greater risk control. But fixed income instruments can struggle during inflationary periods. Fortunately, adding commodity strategies to a portfolio not only provides an additional diversification benefit, but also provides a potential hedge against inflationary concerns. Past performance is not indicative of future returns.
Historical data is used for statistical illustration purposes only and should not be used as a predictive measure for the future return expectations of any investment. The information is subject to change (based on market fluctuation and other conditions) and should not be construed as a recommendation of any specific security or investment product, and was prepared without regard for specific circumstances and objectives of any individual investor. Both traditional and alternative investments involve risks, including the potential for loss of principal. Commodity investments may involve additional risks, including, but not limited to, geopolitical events, supply/ demand fluctuation, futures market speculation and regulatory changes.
Before investing in any financial product, always read the prospectus and/or offering memorandum for product-specific risks. Data source: Morningstar and Bloomberg. Stock (S&P 500 Index), Bond (Barclays Aggregate Bond Index) and Commodity (S&P GSCI) index returns assume reinvestment of all dividends and do not reflect any management fees, transaction costs or expenses. The indexes are unmanaged and are not available for direct investment.
The material provided herein has been provided by Arrow Investment Advisors and is for informational purposes only. Arrow Investment Advisors serves as investment advisor to one or more mutual funds distributed through Northern Lights Distributors, LLC (member FINRA). Northern Lights Distributors, LLC and Arrow Investment Advisors are not affiliated entities. 0740-NLD-4/13/2011 .


