


Description
Bullseye
Highlights
Flood Insurance
L
ike with many things in life, protecting a portfolio takes planning, discipline and foresight to prepare for
unexpected events. To plan for the unexpected, most people turn to insurance. We have insurance for life,
health care, homes and autos. Some insurance is comprehensive and other forms of insurance protect against
specific types of events.
The National Flood Insurance Program (NFIP) is designed to offer accessible insurance for people who live in
higher risk flood zones, since most commercial insurance companies will not provide flood insurance to those
areas, if anywhere at all.
So it would make sense that everyone with a home in that region would have NFIP coverage. But they don’t. Some people choose not to buy a flood insurance policy, thinking it is an expense they can do without.
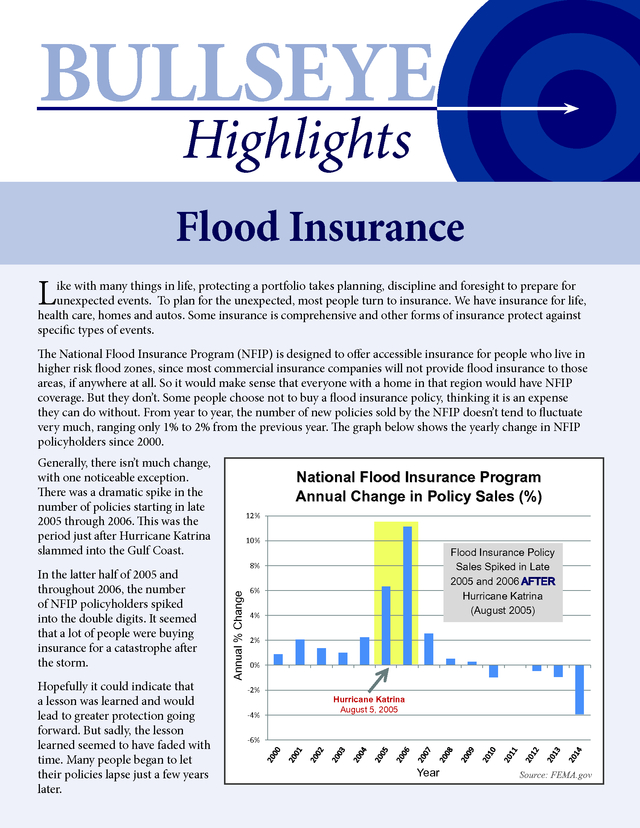
From year to year, the number of new policies sold by the NFIP doesn’t tend to fluctuate very much, ranging only 1% to 2% from the previous year. The graph below shows the yearly change in NFIP policyholders since 2000. Generally, there isn’t much change, with one noticeable exception. There was a dramatic spike in the number of policies starting in late 2005 through 2006. This was the period just after Hurricane Katrina slammed into the Gulf Coast. Hopefully it could indicate that a lesson was learned and would lead to greater protection going forward.
But sadly, the lesson learned seemed to have faded with time. Many people began to let their policies lapse just a few years later. 12% 10% Flood Insurance Policy Sales Spiked in Late 2005 and 2006 AFTER Hurricane Katrina (August 2005) 8% Annual % Change In the latter half of 2005 and throughout 2006, the number of NFIP policyholders spiked into the double digits. It seemed that a lot of people were buying insurance for a catastrophe after the storm. National Flood Insurance Program Annual Change in Policy Sales (%) 6% 4% 2% 0% -2% -4% Hurricane Katrina August 5, 2005 -6% Year Source: FEMA.gov .
There is a similar observation to be made for portfolio diversification. A sustained bull market can make it seem like there is an endless supply of sunny days, until the harsh storm of a bear market hits. Investors who are looking to truly diversify their portfolio look to investments beyond traditional stocks and bonds. But during the good times of a raging bull market, these portfolio diversifiers are often shunned and forgotten.
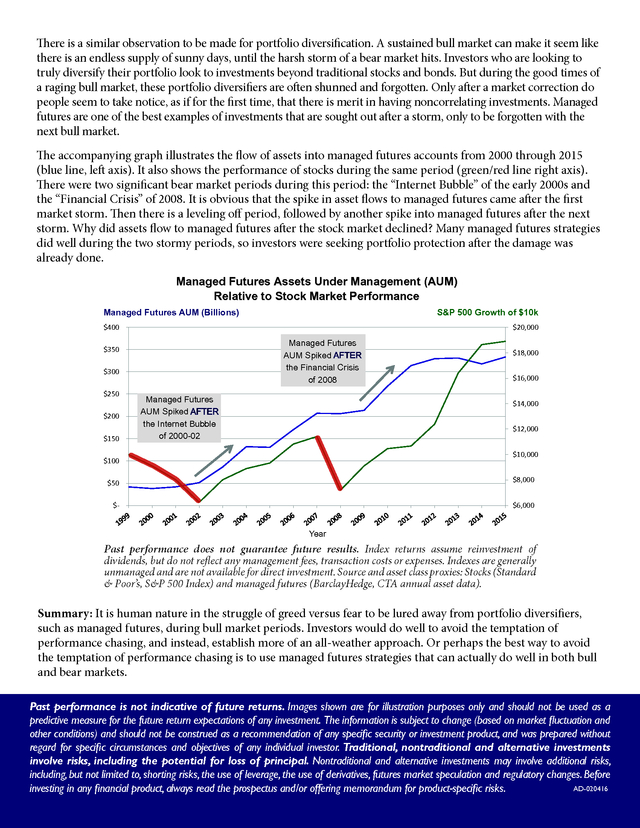
Only after a market correction do people seem to take notice, as if for the first time, that there is merit in having noncorrelating investments. Managed futures are one of the best examples of investments that are sought out after a storm, only to be forgotten with the next bull market. The accompanying graph illustrates the flow of assets into managed futures accounts from 2000 through 2015 (blue line, left axis). It also shows the performance of stocks during the same period (green/red line right axis). There were two significant bear market periods during this period: the “Internet Bubble” of the early 2000s and the “Financial Crisis” of 2008.
It is obvious that the spike in asset flows to managed futures came after the first market storm. Then there is a leveling off period, followed by another spike into managed futures after the next storm. Why did assets flow to managed futures after the stock market declined? Many managed futures strategies did well during the two stormy periods, so investors were seeking portfolio protection after the damage was already done. Managed Futures Assets Under Management (AUM) Relative to Stock Market Performance Managed Futures AUM (Billions) S&P 500 Growth of $10k $20,000 $400 Managed Futures AUM Spiked AFTER the Financial Crisis of 2008 $350 $300 $250 $200 $150 Managed Futures AUM Spiked AFTER the Internet Bubble of 2000-02 $18,000 $16,000 $14,000 $12,000 $10,000 $100 $50 $8,000 $- $6,000 Year Past performance does not guarantee future results.
Index returns assume reinvestment of dividends, but do not reflect any management fees, transaction costs or expenses. Indexes are generally unmanaged and are not available for direct investment. Source and asset class proxies: Stocks (Standard & Poor’s, S&P 500 Index) and managed futures (BarclayHedge, CTA annual asset data). Summary: It is human nature in the struggle of greed versus fear to be lured away from portfolio diversifiers, such as managed futures, during bull market periods.
Investors would do well to avoid the temptation of performance chasing, and instead, establish more of an all-weather approach. Or perhaps the best way to avoid the temptation of performance chasing is to use managed futures strategies that can actually do well in both bull and bear markets. Past performance is not indicative of future returns. Images shown are for illustration purposes only and should not be used as a predictive measure for the future return expectations of any investment.
The information is subject to change (based on market fluctuation and other conditions) and should not be construed as a recommendation of any specific security or investment product, and was prepared without regard for specific circumstances and objectives of any individual investor. Traditional, nontraditional and alternative investments involve risks, including the potential for loss of principal. Nontraditional and alternative investments may involve additional risks, including, but not limited to, shorting risks, the use of leverage, the use of derivatives, futures market speculation and regulatory changes.
Before AD-020416 investing in any financial product, always read the prospectus and/or offering memorandum for product-specific risks. .
So it would make sense that everyone with a home in that region would have NFIP coverage. But they don’t. Some people choose not to buy a flood insurance policy, thinking it is an expense they can do without.
From year to year, the number of new policies sold by the NFIP doesn’t tend to fluctuate very much, ranging only 1% to 2% from the previous year. The graph below shows the yearly change in NFIP policyholders since 2000. Generally, there isn’t much change, with one noticeable exception. There was a dramatic spike in the number of policies starting in late 2005 through 2006. This was the period just after Hurricane Katrina slammed into the Gulf Coast. Hopefully it could indicate that a lesson was learned and would lead to greater protection going forward.
But sadly, the lesson learned seemed to have faded with time. Many people began to let their policies lapse just a few years later. 12% 10% Flood Insurance Policy Sales Spiked in Late 2005 and 2006 AFTER Hurricane Katrina (August 2005) 8% Annual % Change In the latter half of 2005 and throughout 2006, the number of NFIP policyholders spiked into the double digits. It seemed that a lot of people were buying insurance for a catastrophe after the storm. National Flood Insurance Program Annual Change in Policy Sales (%) 6% 4% 2% 0% -2% -4% Hurricane Katrina August 5, 2005 -6% Year Source: FEMA.gov .
There is a similar observation to be made for portfolio diversification. A sustained bull market can make it seem like there is an endless supply of sunny days, until the harsh storm of a bear market hits. Investors who are looking to truly diversify their portfolio look to investments beyond traditional stocks and bonds. But during the good times of a raging bull market, these portfolio diversifiers are often shunned and forgotten.
Only after a market correction do people seem to take notice, as if for the first time, that there is merit in having noncorrelating investments. Managed futures are one of the best examples of investments that are sought out after a storm, only to be forgotten with the next bull market. The accompanying graph illustrates the flow of assets into managed futures accounts from 2000 through 2015 (blue line, left axis). It also shows the performance of stocks during the same period (green/red line right axis). There were two significant bear market periods during this period: the “Internet Bubble” of the early 2000s and the “Financial Crisis” of 2008.
It is obvious that the spike in asset flows to managed futures came after the first market storm. Then there is a leveling off period, followed by another spike into managed futures after the next storm. Why did assets flow to managed futures after the stock market declined? Many managed futures strategies did well during the two stormy periods, so investors were seeking portfolio protection after the damage was already done. Managed Futures Assets Under Management (AUM) Relative to Stock Market Performance Managed Futures AUM (Billions) S&P 500 Growth of $10k $20,000 $400 Managed Futures AUM Spiked AFTER the Financial Crisis of 2008 $350 $300 $250 $200 $150 Managed Futures AUM Spiked AFTER the Internet Bubble of 2000-02 $18,000 $16,000 $14,000 $12,000 $10,000 $100 $50 $8,000 $- $6,000 Year Past performance does not guarantee future results.
Index returns assume reinvestment of dividends, but do not reflect any management fees, transaction costs or expenses. Indexes are generally unmanaged and are not available for direct investment. Source and asset class proxies: Stocks (Standard & Poor’s, S&P 500 Index) and managed futures (BarclayHedge, CTA annual asset data). Summary: It is human nature in the struggle of greed versus fear to be lured away from portfolio diversifiers, such as managed futures, during bull market periods.
Investors would do well to avoid the temptation of performance chasing, and instead, establish more of an all-weather approach. Or perhaps the best way to avoid the temptation of performance chasing is to use managed futures strategies that can actually do well in both bull and bear markets. Past performance is not indicative of future returns. Images shown are for illustration purposes only and should not be used as a predictive measure for the future return expectations of any investment.
The information is subject to change (based on market fluctuation and other conditions) and should not be construed as a recommendation of any specific security or investment product, and was prepared without regard for specific circumstances and objectives of any individual investor. Traditional, nontraditional and alternative investments involve risks, including the potential for loss of principal. Nontraditional and alternative investments may involve additional risks, including, but not limited to, shorting risks, the use of leverage, the use of derivatives, futures market speculation and regulatory changes.
Before AD-020416 investing in any financial product, always read the prospectus and/or offering memorandum for product-specific risks. .


