


Description
Bullseye
Highlights
The Duration Dilemma
Fixed income investments, such as corporate
and government bonds, typically have an inverse
relationship with interest rates. When interest rates
rise, the value of bonds will generally decline. Why?
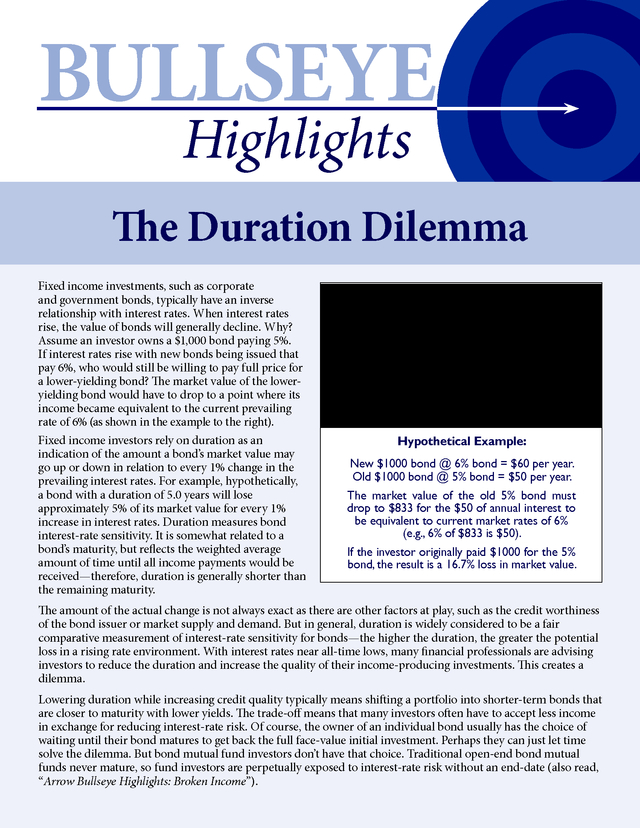
Assume an investor owns a $1,000 bond paying 5%.
If interest rates rise with new bonds being issued that
pay 6%, who would still be willing to pay full price for
a lower-yielding bond? The market value of the loweryielding bond would have to drop to a point where its
income became equivalent to the current prevailing
rate of 6% (as shown in the example to the right).
Fixed income investors rely on duration as an
indication of the amount a bond’s market value may
go up or down in relation to every 1% change in the
prevailing interest rates. For example, hypothetically,
a bond with a duration of 5.0 years will lose
approximately 5% of its market value for every 1%
increase in interest rates.
Duration measures bond interest-rate sensitivity. It is somewhat related to a bond’s maturity, but reflects the weighted average amount of time until all income payments would be received—therefore, duration is generally shorter than the remaining maturity. Interest Rates Market Value Hypothetical Example: New $1000 bond @ 6% bond = $60 per year. Old $1000 bond @ 5% bond = $50 per year. The market value of the old 5% bond must drop to $833 for the $50 of annual interest to be equivalent to current market rates of 6% (e.g., 6% of $833 is $50). If the investor originally paid $1000 for the 5% bond, the result is a 16.7% loss in market value. The amount of the actual change is not always exact as there are other factors at play, such as the credit worthiness of the bond issuer or market supply and demand. But in general, duration is widely considered to be a fair comparative measurement of interest-rate sensitivity for bonds—the higher the duration, the greater the potential loss in a rising rate environment.
With interest rates near all-time lows, many financial professionals are advising investors to reduce the duration and increase the quality of their income-producing investments. This creates a dilemma. Lowering duration while increasing credit quality typically means shifting a portfolio into shorter-term bonds that are closer to maturity with lower yields. The trade-off means that many investors often have to accept less income in exchange for reducing interest-rate risk.
Of course, the owner of an individual bond usually has the choice of waiting until their bond matures to get back the full face-value initial investment. Perhaps they can just let time solve the dilemma. But bond mutual fund investors don’t have that choice.
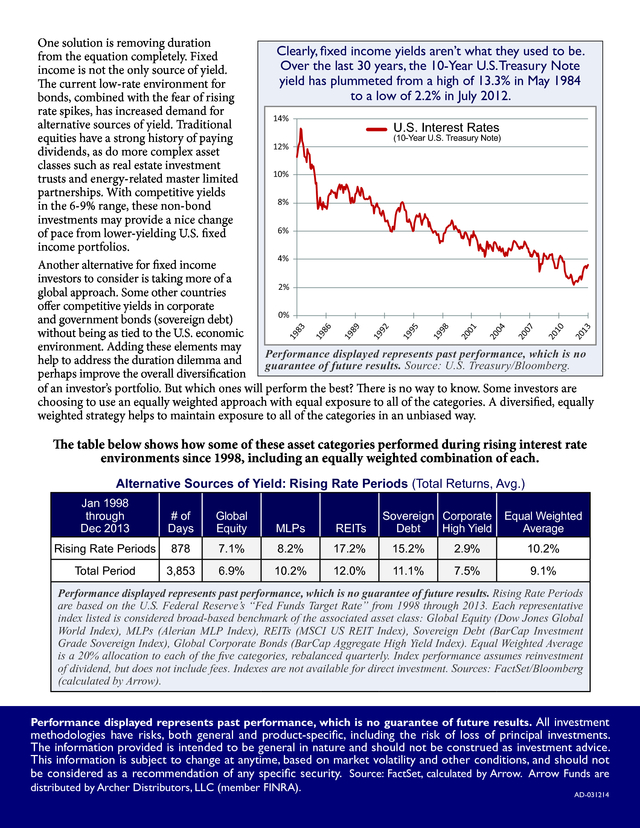
Traditional open-end bond mutual funds never mature, so fund investors are perpetually exposed to interest-rate risk without an end-date (also read, “Arrow Bullseye Highlights: Broken Income”). . 13 20 10 20 07 20 04 20 01 20 98 19 95 19 92 19 89 19 86 19 19 83 One solution is removing duration Clearly, fixed income yields aren’t what they used to be. from the equation completely. Fixed Over the last 30 years, the 10-Year U.S. Treasury Note income is not the only source of yield. yield has plummeted from a high of 13.3% in May 1984 The current low-rate environment for to a low of 2.2% in July 2012. bonds, combined with the fear of rising rate spikes, has increased demand for 14% alternative sources of yield. Traditional U.S.
Interest Rates (10-Year U.S. Treasury Note) equities have a strong history of paying 12% dividends, as do more complex asset classes such as real estate investment 10% trusts and energy-related master limited partnerships. With competitive yields 8% in the 6-9% range, these non-bond investments may provide a nice change 6% of pace from lower-yielding U.S.
fixed income portfolios. 4% Another alternative for fixed income investors to consider is taking more of a 2% global approach. Some other countries offer competitive yields in corporate 0% and government bonds (sovereign debt) without being as tied to the U.S. economic environment.
Adding these elements may Performance displayed represents past performance, which is no help to address the duration dilemma and guarantee of future results. Source: U.S. Treasury/Bloomberg. perhaps improve the overall diversification of an investor’s portfolio.
But which ones will perform the best? There is no way to know. Some investors are choosing to use an equally weighted approach with equal exposure to all of the categories. A diversified, equally weighted strategy helps to maintain exposure to all of the categories in an unbiased way. The table below shows how some of these asset categories performed during rising interest rate environments since 1998, including an equally weighted combination of each. Alternative Sources of Yield: Rising Rate Periods (Total Returns, Avg.) Jan 1998 through Dec 2013 # of Days Global Equity MLPs REITs Rising Rate Periods 878 7.1% 8.2% 17.2% 15.2% 2.9% 10.2% Total Period 3,853 6.9% 10.2% 12.0% 11.1% 7.5% 9.1% Sovereign Corporate Debt High Yield Equal Weighted Average Performance displayed represents past performance, which is no guarantee of future results.
Rising Rate Periods are based on the U.S. Federal Reserve’s “Fed Funds Target Rate” from 1998 through 2013. Each representative index listed is considered broad-based benchmark of the associated asset class: Global Equity (Dow Jones Global World Index), MLPs (Alerian MLP Index), REITs (MSCI US REIT Index), Sovereign Debt (BarCap Investment Grade Sovereign Index), Global Corporate Bonds (BarCap Aggregate High Yield Index).
Equal Weighted Average is a 20% allocation to each of the five categories, rebalanced quarterly. Index performance assumes reinvestment of dividend, but does not include fees. Indexes are not available for direct investment.
Sources: FactSet/Bloomberg (calculated by Arrow). Performance displayed represents past performance, which is no guarantee of future results. All investment methodologies have risks, both general and product-specific, including the risk of loss of principal investments. The information provided is intended to be general in nature and should not be construed as investment advice. This information is subject to change at anytime, based on market volatility and other conditions, and should not be considered as a recommendation of any specific security. Source: FactSet, calculated by Arrow.
Arrow Funds are distributed by Archer Distributors, LLC (member FINRA). AD-031214 .
Duration measures bond interest-rate sensitivity. It is somewhat related to a bond’s maturity, but reflects the weighted average amount of time until all income payments would be received—therefore, duration is generally shorter than the remaining maturity. Interest Rates Market Value Hypothetical Example: New $1000 bond @ 6% bond = $60 per year. Old $1000 bond @ 5% bond = $50 per year. The market value of the old 5% bond must drop to $833 for the $50 of annual interest to be equivalent to current market rates of 6% (e.g., 6% of $833 is $50). If the investor originally paid $1000 for the 5% bond, the result is a 16.7% loss in market value. The amount of the actual change is not always exact as there are other factors at play, such as the credit worthiness of the bond issuer or market supply and demand. But in general, duration is widely considered to be a fair comparative measurement of interest-rate sensitivity for bonds—the higher the duration, the greater the potential loss in a rising rate environment.
With interest rates near all-time lows, many financial professionals are advising investors to reduce the duration and increase the quality of their income-producing investments. This creates a dilemma. Lowering duration while increasing credit quality typically means shifting a portfolio into shorter-term bonds that are closer to maturity with lower yields. The trade-off means that many investors often have to accept less income in exchange for reducing interest-rate risk.
Of course, the owner of an individual bond usually has the choice of waiting until their bond matures to get back the full face-value initial investment. Perhaps they can just let time solve the dilemma. But bond mutual fund investors don’t have that choice.
Traditional open-end bond mutual funds never mature, so fund investors are perpetually exposed to interest-rate risk without an end-date (also read, “Arrow Bullseye Highlights: Broken Income”). . 13 20 10 20 07 20 04 20 01 20 98 19 95 19 92 19 89 19 86 19 19 83 One solution is removing duration Clearly, fixed income yields aren’t what they used to be. from the equation completely. Fixed Over the last 30 years, the 10-Year U.S. Treasury Note income is not the only source of yield. yield has plummeted from a high of 13.3% in May 1984 The current low-rate environment for to a low of 2.2% in July 2012. bonds, combined with the fear of rising rate spikes, has increased demand for 14% alternative sources of yield. Traditional U.S.
Interest Rates (10-Year U.S. Treasury Note) equities have a strong history of paying 12% dividends, as do more complex asset classes such as real estate investment 10% trusts and energy-related master limited partnerships. With competitive yields 8% in the 6-9% range, these non-bond investments may provide a nice change 6% of pace from lower-yielding U.S.
fixed income portfolios. 4% Another alternative for fixed income investors to consider is taking more of a 2% global approach. Some other countries offer competitive yields in corporate 0% and government bonds (sovereign debt) without being as tied to the U.S. economic environment.
Adding these elements may Performance displayed represents past performance, which is no help to address the duration dilemma and guarantee of future results. Source: U.S. Treasury/Bloomberg. perhaps improve the overall diversification of an investor’s portfolio.
But which ones will perform the best? There is no way to know. Some investors are choosing to use an equally weighted approach with equal exposure to all of the categories. A diversified, equally weighted strategy helps to maintain exposure to all of the categories in an unbiased way. The table below shows how some of these asset categories performed during rising interest rate environments since 1998, including an equally weighted combination of each. Alternative Sources of Yield: Rising Rate Periods (Total Returns, Avg.) Jan 1998 through Dec 2013 # of Days Global Equity MLPs REITs Rising Rate Periods 878 7.1% 8.2% 17.2% 15.2% 2.9% 10.2% Total Period 3,853 6.9% 10.2% 12.0% 11.1% 7.5% 9.1% Sovereign Corporate Debt High Yield Equal Weighted Average Performance displayed represents past performance, which is no guarantee of future results.
Rising Rate Periods are based on the U.S. Federal Reserve’s “Fed Funds Target Rate” from 1998 through 2013. Each representative index listed is considered broad-based benchmark of the associated asset class: Global Equity (Dow Jones Global World Index), MLPs (Alerian MLP Index), REITs (MSCI US REIT Index), Sovereign Debt (BarCap Investment Grade Sovereign Index), Global Corporate Bonds (BarCap Aggregate High Yield Index).
Equal Weighted Average is a 20% allocation to each of the five categories, rebalanced quarterly. Index performance assumes reinvestment of dividend, but does not include fees. Indexes are not available for direct investment.
Sources: FactSet/Bloomberg (calculated by Arrow). Performance displayed represents past performance, which is no guarantee of future results. All investment methodologies have risks, both general and product-specific, including the risk of loss of principal investments. The information provided is intended to be general in nature and should not be construed as investment advice. This information is subject to change at anytime, based on market volatility and other conditions, and should not be considered as a recommendation of any specific security. Source: FactSet, calculated by Arrow.
Arrow Funds are distributed by Archer Distributors, LLC (member FINRA). AD-031214 .


