


Description
Bullseye
Highlights
A Look at Yield
W
hen investors think of yield, they typically think of the interest earned on fixed income investments, such as Treasuries
and corporate bonds. With interest rates near all-time lows, investors have become increasingly eager to find additional
sources of income. Traditional sources of income, such as government bonds, bank CDs, and savings accounts simply are
not generating enough interest in today’s low-rate environment. The fear of being outpaced by inflation, when traditionally
safe haven investments are returning record lows, is at the forefront of investors’ minds.
This has led to a new search for yield through investment sources which may have previously been ignored. Investors have found some ways to improve the yield of their bond portfolios by taking on more risk through high yield bonds, or by looking beyond U.S. borders for global solutions. But bonds are not the only source of yield.
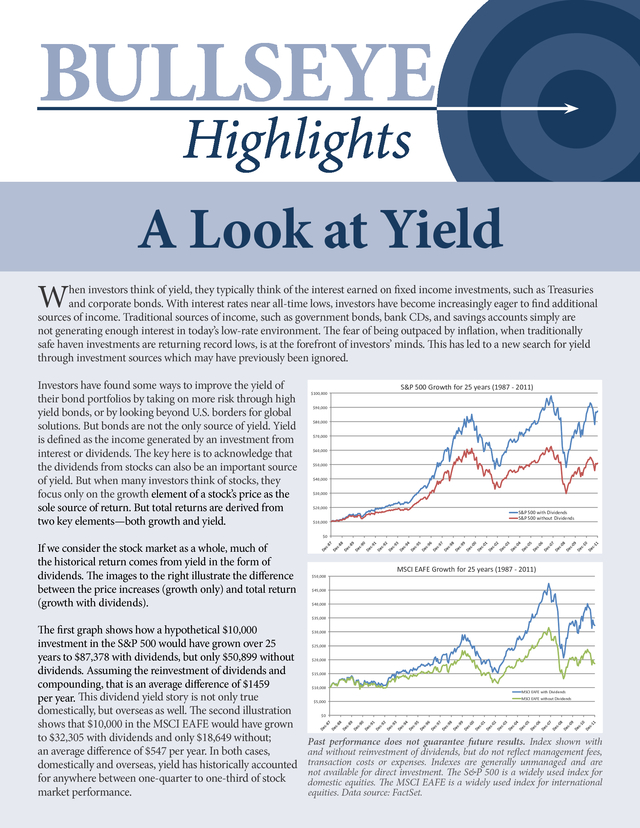
Yield is defined as the income generated by an investment from interest or dividends. The key here is to acknowledge that the dividends from stocks can also be an important source of yield. But when many investors think of stocks, they focus only on the growth element of a stock’s price as the sole source of return.
But total returns are derived from two key elements—both growth and yield. $100,000 S&P 500 Growth for 25 years (1987 - 2011) $90,000 $80,000 $70,000 $60,000 $50,000 $40,000 $30,000 $20,000 $10,000 S&P 500 with Dividends S&P 500 without Dividends $0 If we consider the stock market as a whole, much of the historical return comes from yield in the form of dividends. The images to the right illustrate the difference between the price increases (growth only) and total return (growth with dividends). $50,000 MSCI EAFE Growth for 25 years (1987 - 2011) $45,000 $40,000 $35,000 The first graph shows how a hypothetical $10,000 investment in the S&P 500 would have grown over 25 years to $87,378 with dividends, but only $50,899 without dividends. Assuming the reinvestment of dividends and compounding, that is an average difference of $1459 per year.
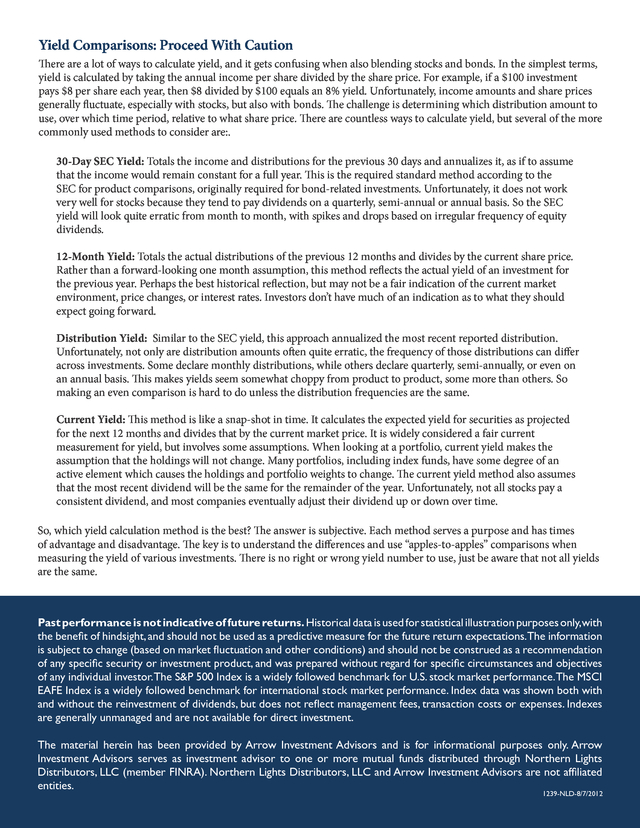
This dividend yield story is not only true domestically, but overseas as well. The second illustration shows that $10,000 in the MSCI EAFE would have grown to $32,305 with dividends and only $18,649 without; an average difference of $547 per year. In both cases, domestically and overseas, yield has historically accounted for anywhere between one-quarter to one-third of stock market performance. $30,000 $25,000 $20,000 $15,000 $10,000 $5,000 MSCI EAFE with Dividends MSCI EAFE without Dividends $0 Past performance does not guarantee future results.
Index shown with and without reinvestment of dividends, but do not reflect management fees, transaction costs or expenses. Indexes are generally unmanaged and are not available for direct investment. The S&P 500 is a widely used index for domestic equities.
The MSCI EAFE is a widely used index for international equities. Data source: FactSet. . Yield Comparisons: Proceed With Caution There are a lot of ways to calculate yield, and it gets confusing when also blending stocks and bonds. In the simplest terms, yield is calculated by taking the annual income per share divided by the share price. For example, if a $100 investment pays $8 per share each year, then $8 divided by $100 equals an 8% yield. Unfortunately, income amounts and share prices generally fluctuate, especially with stocks, but also with bonds.
The challenge is determining which distribution amount to use, over which time period, relative to what share price. There are countless ways to calculate yield, but several of the more commonly used methods to consider are:. 30-Day SEC Yield: Totals the income and distributions for the previous 30 days and annualizes it, as if to assume that the income would remain constant for a full year. This is the required standard method according to the SEC for product comparisons, originally required for bond-related investments.
Unfortunately, it does not work very well for stocks because they tend to pay dividends on a quarterly, semi-annual or annual basis. So the SEC yield will look quite erratic from month to month, with spikes and drops based on irregular frequency of equity dividends. 12-Month Yield: Totals the actual distributions of the previous 12 months and divides by the current share price. Rather than a forward-looking one month assumption, this method reflects the actual yield of an investment for the previous year. Perhaps the best historical reflection, but may not be a fair indication of the current market environment, price changes, or interest rates.
Investors don’t have much of an indication as to what they should expect going forward. Distribution Yield: Similar to the SEC yield, this approach annualized the most recent reported distribution. Unfortunately, not only are distribution amounts often quite erratic, the frequency of those distributions can differ across investments. Some declare monthly distributions, while others declare quarterly, semi-annually, or even on an annual basis. This makes yields seem somewhat choppy from product to product, some more than others.
So making an even comparison is hard to do unless the distribution frequencies are the same. Current Yield: This method is like a snap-shot in time. It calculates the expected yield for securities as projected for the next 12 months and divides that by the current market price. It is widely considered a fair current measurement for yield, but involves some assumptions.
When looking at a portfolio, current yield makes the assumption that the holdings will not change. Many portfolios, including index funds, have some degree of an active element which causes the holdings and portfolio weights to change. The current yield method also assumes that the most recent dividend will be the same for the remainder of the year.
Unfortunately, not all stocks pay a consistent dividend, and most companies eventually adjust their dividend up or down over time. So, which yield calculation method is the best? The answer is subjective. Each method serves a purpose and has times of advantage and disadvantage. The key is to understand the differences and use “apples-to-apples” comparisons when measuring the yield of various investments.
There is no right or wrong yield number to use, just be aware that not all yields are the same. Past performance is not indicative of future returns. Historical data is used for statistical illustration purposes only, with the benefit of hindsight, and should not be used as a predictive measure for the future return expectations.The information is subject to change (based on market fluctuation and other conditions) and should not be construed as a recommendation of any specific security or investment product, and was prepared without regard for specific circumstances and objectives of any individual investor. The S&P 500 Index is a widely followed benchmark for U.S.
stock market performance. The MSCI EAFE Index is a widely followed benchmark for international stock market performance. Index data was shown both with and without the reinvestment of dividends, but does not reflect management fees, transaction costs or expenses.
Indexes are generally unmanaged and are not available for direct investment. The material herein has been provided by Arrow Investment Advisors and is for informational purposes only. Arrow Investment Advisors serves as investment advisor to one or more mutual funds distributed through Northern Lights Distributors, LLC (member FINRA). Northern Lights Distributors, LLC and Arrow Investment Advisors are not affiliated entities. 1239-NLD-8/7/2012 .
This has led to a new search for yield through investment sources which may have previously been ignored. Investors have found some ways to improve the yield of their bond portfolios by taking on more risk through high yield bonds, or by looking beyond U.S. borders for global solutions. But bonds are not the only source of yield.
Yield is defined as the income generated by an investment from interest or dividends. The key here is to acknowledge that the dividends from stocks can also be an important source of yield. But when many investors think of stocks, they focus only on the growth element of a stock’s price as the sole source of return.
But total returns are derived from two key elements—both growth and yield. $100,000 S&P 500 Growth for 25 years (1987 - 2011) $90,000 $80,000 $70,000 $60,000 $50,000 $40,000 $30,000 $20,000 $10,000 S&P 500 with Dividends S&P 500 without Dividends $0 If we consider the stock market as a whole, much of the historical return comes from yield in the form of dividends. The images to the right illustrate the difference between the price increases (growth only) and total return (growth with dividends). $50,000 MSCI EAFE Growth for 25 years (1987 - 2011) $45,000 $40,000 $35,000 The first graph shows how a hypothetical $10,000 investment in the S&P 500 would have grown over 25 years to $87,378 with dividends, but only $50,899 without dividends. Assuming the reinvestment of dividends and compounding, that is an average difference of $1459 per year.
This dividend yield story is not only true domestically, but overseas as well. The second illustration shows that $10,000 in the MSCI EAFE would have grown to $32,305 with dividends and only $18,649 without; an average difference of $547 per year. In both cases, domestically and overseas, yield has historically accounted for anywhere between one-quarter to one-third of stock market performance. $30,000 $25,000 $20,000 $15,000 $10,000 $5,000 MSCI EAFE with Dividends MSCI EAFE without Dividends $0 Past performance does not guarantee future results.
Index shown with and without reinvestment of dividends, but do not reflect management fees, transaction costs or expenses. Indexes are generally unmanaged and are not available for direct investment. The S&P 500 is a widely used index for domestic equities.
The MSCI EAFE is a widely used index for international equities. Data source: FactSet. . Yield Comparisons: Proceed With Caution There are a lot of ways to calculate yield, and it gets confusing when also blending stocks and bonds. In the simplest terms, yield is calculated by taking the annual income per share divided by the share price. For example, if a $100 investment pays $8 per share each year, then $8 divided by $100 equals an 8% yield. Unfortunately, income amounts and share prices generally fluctuate, especially with stocks, but also with bonds.
The challenge is determining which distribution amount to use, over which time period, relative to what share price. There are countless ways to calculate yield, but several of the more commonly used methods to consider are:. 30-Day SEC Yield: Totals the income and distributions for the previous 30 days and annualizes it, as if to assume that the income would remain constant for a full year. This is the required standard method according to the SEC for product comparisons, originally required for bond-related investments.
Unfortunately, it does not work very well for stocks because they tend to pay dividends on a quarterly, semi-annual or annual basis. So the SEC yield will look quite erratic from month to month, with spikes and drops based on irregular frequency of equity dividends. 12-Month Yield: Totals the actual distributions of the previous 12 months and divides by the current share price. Rather than a forward-looking one month assumption, this method reflects the actual yield of an investment for the previous year. Perhaps the best historical reflection, but may not be a fair indication of the current market environment, price changes, or interest rates.
Investors don’t have much of an indication as to what they should expect going forward. Distribution Yield: Similar to the SEC yield, this approach annualized the most recent reported distribution. Unfortunately, not only are distribution amounts often quite erratic, the frequency of those distributions can differ across investments. Some declare monthly distributions, while others declare quarterly, semi-annually, or even on an annual basis. This makes yields seem somewhat choppy from product to product, some more than others.
So making an even comparison is hard to do unless the distribution frequencies are the same. Current Yield: This method is like a snap-shot in time. It calculates the expected yield for securities as projected for the next 12 months and divides that by the current market price. It is widely considered a fair current measurement for yield, but involves some assumptions.
When looking at a portfolio, current yield makes the assumption that the holdings will not change. Many portfolios, including index funds, have some degree of an active element which causes the holdings and portfolio weights to change. The current yield method also assumes that the most recent dividend will be the same for the remainder of the year.
Unfortunately, not all stocks pay a consistent dividend, and most companies eventually adjust their dividend up or down over time. So, which yield calculation method is the best? The answer is subjective. Each method serves a purpose and has times of advantage and disadvantage. The key is to understand the differences and use “apples-to-apples” comparisons when measuring the yield of various investments.
There is no right or wrong yield number to use, just be aware that not all yields are the same. Past performance is not indicative of future returns. Historical data is used for statistical illustration purposes only, with the benefit of hindsight, and should not be used as a predictive measure for the future return expectations.The information is subject to change (based on market fluctuation and other conditions) and should not be construed as a recommendation of any specific security or investment product, and was prepared without regard for specific circumstances and objectives of any individual investor. The S&P 500 Index is a widely followed benchmark for U.S.
stock market performance. The MSCI EAFE Index is a widely followed benchmark for international stock market performance. Index data was shown both with and without the reinvestment of dividends, but does not reflect management fees, transaction costs or expenses.
Indexes are generally unmanaged and are not available for direct investment. The material herein has been provided by Arrow Investment Advisors and is for informational purposes only. Arrow Investment Advisors serves as investment advisor to one or more mutual funds distributed through Northern Lights Distributors, LLC (member FINRA). Northern Lights Distributors, LLC and Arrow Investment Advisors are not affiliated entities. 1239-NLD-8/7/2012 .


