Description
Bullseye
Highlights
Asset Class Seasonality
There is an old adage that says, “Sell in May and go away.” Is there any truth to it, or is it just a clever thing
to say without any statistical validity? Historically, the phrase has been largely dismissed by academics as
anecdotal at best. There are many catch-phrases that are popular in the financial services industry, including
The January Effect, Hemline Theory, The Superbowl Theory, and others that have become part of the lexicon,
but are not always proven to be completely accurate.
Sometimes known as the “Halloween Indicator” (referring to the time to buy again), the “Sell in May”
strategy has historically worked well on average for equity markets on a global scale. Still, many people
dismiss this seasonal calendar effect as an anomaly with no proven fundamental driving force behind it. But
there has been a slew of research recently that examines how this seasonal effect actually works in an attempt
to put some academic support behind the lore.
The seasonal approach has typically been applied
to equities, as those markets are so widely followed.
Whether academic or anecdotal, many investors
reduce their equity exposure during the summer
months and shift toward fixed income.
Bonds, in general, have historically performed well as an asset class during the summer months. Perhaps this is a self-fulfilling outcome, or perhaps the asset class is simply the benefactor of 30 years worth of declining rates. That is not to say that bonds won’t do well.
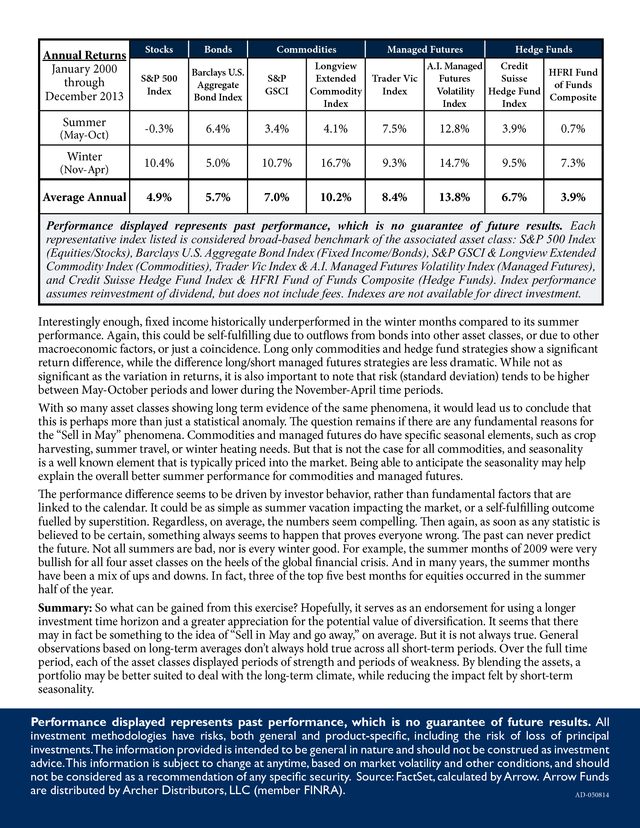
They may do just fine. But with interest rates near all time lows, it is hard to make a bull market case for bonds. Regardless of the outlook for bonds, there may be some benefit in taking a look at less traditional investments, such as commodities and managed futures. Unfortunately, commodity and managed futures data does not go back as far as stocks and bonds. But for the time periods that are available from the early 2000s, outperformance during the winter periods (November-April) seems to be evident across many different asset classes, as the table on the following page shows. Statements that are “generally true” based on averages are not always true. .
Annual Returns January 2000 through December 2013 Summer (May-Oct) Winter (Nov-Apr) Average Annual Stocks Bonds Commodities Managed Futures Hedge Funds S&P 500 Index Barclays U.S. Aggregate Bond Index S&P GSCI -0.3% 6.4% 3.4% 4.1% 7.5% 12.8% 3.9% 0.7% 10.4% 5.0% 10.7% 16.7% 9.3% 14.7% 9.5% 7.3% 4.9% 5.7% 7.0% 10.2% 8.4% 13.8% 6.7% 3.9% Longview A.I. Managed Credit HFRI Fund Extended Trader Vic Futures Suisse of Funds Commodity Index Volatility Hedge Fund Composite Index Index Index Performance displayed represents past performance, which is no guarantee of future results. Each representative index listed is considered broad-based benchmark of the associated asset class: S&P 500 Index (Equities/Stocks), Barclays U.S. Aggregate Bond Index (Fixed Income/Bonds), S&P GSCI & Longview Extended Commodity Index (Commodities), Trader Vic Index & A.I.
Managed Futures Volatility Index (Managed Futures), and Credit Suisse Hedge Fund Index & HFRI Fund of Funds Composite (Hedge Funds). Index performance assumes reinvestment of dividend, but does not include fees. Indexes are not available for direct investment. Interestingly enough, fixed income historically underperformed in the winter months compared to its summer performance.
Again, this could be self-fulfilling due to outflows from bonds into other asset classes, or due to other macroeconomic factors, or just a coincidence. Long only commodities and hedge fund strategies show a significant return difference, while the difference long/short managed futures strategies are less dramatic. While not as significant as the variation in returns, it is also important to note that risk (standard deviation) tends to be higher between May-October periods and lower during the November-April time periods. With so many asset classes showing long term evidence of the same phenomena, it would lead us to conclude that this is perhaps more than just a statistical anomaly.
The question remains if there are any fundamental reasons for the “Sell in May” phenomena. Commodities and managed futures do have specific seasonal elements, such as crop harvesting, summer travel, or winter heating needs. But that is not the case for all commodities, and seasonality is a well known element that is typically priced into the market.
Being able to anticipate the seasonality may help explain the overall better summer performance for commodities and managed futures. The performance difference seems to be driven by investor behavior, rather than fundamental factors that are linked to the calendar. It could be as simple as summer vacation impacting the market, or a self-fulfilling outcome fuelled by superstition. Regardless, on average, the numbers seem compelling.
Then again, as soon as any statistic is believed to be certain, something always seems to happen that proves everyone wrong. The past can never predict the future. Not all summers are bad, nor is every winter good.
For example, the summer months of 2009 were very bullish for all four asset classes on the heels of the global financial crisis. And in many years, the summer months have been a mix of ups and downs. In fact, three of the top five best months for equities occurred in the summer half of the year. Summary: So what can be gained from this exercise? Hopefully, it serves as an endorsement for using a longer investment time horizon and a greater appreciation for the potential value of diversification.
It seems that there may in fact be something to the idea of “Sell in May and go away,” on average. But it is not always true. General observations based on long-term averages don’t always hold true across all short-term periods.
Over the full time period, each of the asset classes displayed periods of strength and periods of weakness. By blending the assets, a portfolio may be better suited to deal with the long-term climate, while reducing the impact felt by short-term seasonality. Performance displayed represents past performance, which is no guarantee of future results. All investment methodologies have risks, both general and product-specific, including the risk of loss of principal investments.The information provided is intended to be general in nature and should not be construed as investment advice.This information is subject to change at anytime, based on market volatility and other conditions, and should not be considered as a recommendation of any specific security.
Source: FactSet, calculated by Arrow. Arrow Funds are distributed by Archer Distributors, LLC (member FINRA). AD-050814 .


