


Description
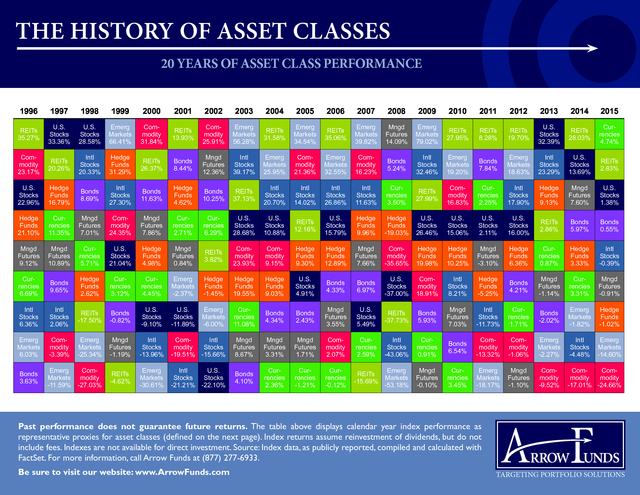
THE HISTORY OF ASSET CLASSES
20 YEARS OF ASSET CLASS PERFORMANCE
1996
1997
1998
1999
2000
2001
2002
2003
2004
2005
2006
2007
2008
2009
2010
2011
2012
2013
2014
2015
REITs
35.27%
U.S.
Stocks
33.36%
U.S.
Stocks
28.58%
Emerg
Markets
66.41%
Commodity
31.84%
REITs
13.93%
Commodity
25.91%
Emerg
Markets
56.28%
REITs
31.58%
Emerg
Markets
34.54%
REITs
35.06%
Emerg
Markets
39.82%
Mngd
Futures
14.09%
Emerg
Markets
79.02%
REITs
27.95%
REITs
8.28%
REITs
19.70%
U.S.
Stocks
32.39%
REITs
28.03%
Currencies
4.74%
Commodity
23.17%
REITs
20.26%
Intl
Stocks
20.33%
Hedge
Funds
31.29%
REITs
26.37%
Bonds
8.44%
Mngd
Futures
12.36%
Intl
Stocks
39.17%
Emerg
Markets
25.95%
Commodity
21.36%
Emerg
Markets
32.55%
Commodity
16.23%
Bonds
5.24%
Intl
Stocks
32.46%
Emerg
Markets
19.20%
Bonds
7.84%
Emerg
Markets
18.63%
Intl
Stocks
23.29%
U.S.
Stocks
13.69%
REITs
2.83%
U.S.
Stocks
22.96%
Hedge
Funds
16.79%
Bonds
8.69%
Intl
Stocks
27.30%
Bonds
11.63%
Hedge
Funds
4.62%
Bonds
10.25%
REITs
37.13%
Intl
Stocks
20.70%
Intl
Stocks
14.02%
Intl
Stocks
26.86%
Intl
Stocks
11.63%
Currencies
3.50%
REITs
27.99%
Commodity
16.83%
Currencies
2.25%
Intl
Stocks
17.90%
Hedge
Funds
9.13%
Mngd
Futures
7.60%
U.S.
Stocks
1.38%
Hedge
Funds
21.10%
Currencies
11.35%
Mngd
Futures
7.01%
Commodity
24.35%
Mngd
Futures
7.86%
Currencies
2.71%
Currencies
6.29%
U.S.
Stocks
28.68%
U.S.
Stocks
10.88%
REITs
12.16%
U.S.
Stocks
15.79%
Hedge
Funds
9.96%
Hedge
Funds
-19.03%
U.S.
Stocks
26.46%
U.S.
Stocks
15.06%
U.S.
Stocks
2.11%
U.S.
Stocks
16.00%
REITs
2.86%
Bonds
5.97%
Bonds
0.55%
Mngd
Futures
9.12%
Mngd
Futures
10.89%
Currencies
5.71%
U.S.
Stocks
21.04%
Hedge
Funds
4.98%
Mngd
Futures
0.84%
REITs
3.82%
Commodity
23.93%
Commodity
9.15%
Hedge
Funds
9.30%
Hedge
Funds
12.89%
Mngd
Futures
7.66%
Commodity
-35.65%
Hedge
Funds
19.98%
Hedge
Funds
10.25%
Mngd
Futures
-3.10%
Hedge
Funds
6.36%
Currencies
0.87%
Hedge
Funds
3.33%
Intl
Stocks
-0.39%
Currencies
6.69%
Bonds
9.65%
Hedge
Funds
2.62%
Currencies
3.12%
Currencies
4.45%
Emerg
Markets
-2.37%
Hedge
Funds
-1.45%
Hedge
Funds
19.55%
Hedge
Funds
9.03%
U.S.
Stocks
4.91%
Bonds
4.33%
Bonds
6.97%
U.S.
Stocks
-37.00%
Commodity
18.91%
Intl
Stocks
8.21%
Hedge
Funds
-5.25%
Bonds
4.21%
Mngd
Futures
-1.14%
Currencies
3.31%
Mngd
Futures
-0.91%
Intl
Stocks
6.36%
Intl
Stocks
2.06%
REITs
-17.50%
Bonds
-0.82%
U.S.
Stocks
-9.10%
U.S.
Stocks
-11.89%
Emerg
Markets
-6.00%
Currencies
11.08%
Bonds
4.34%
Bonds
2.43%
Mngd
Futures
3.55%
U.S.
Stocks
5.49%
REITs
-37.73%
Bonds
5.93%
Mngd
Futures
7.03%
Intl
Stocks
-11.73%
Currencies
1.71%
Bonds
-2.02%
Emerg
Markets
-1.82%
Hedge
Funds
-1.02%
Emerg
Markets
6.03%
Commodity
-3.39%
Emerg
Markets
-25.34%
Mngd
Futures
-1.19%
Intl
Stocks
-13.96%
ComIntl
modity
Stocks
-19.51% -15.66%
Mngd
Futures
8.67%
Mngd
Futures
3.31%
Mngd
Futures
1.71%
Commodity
2.07%
Currencies
2.59%
Intl
Stocks
-43.06%
Currencies
0.91%
Bonds
6.54%
Commodity
-13.32%
Commodity
-1.06%
Emerg
Markets
-2.27%
Intl
Stocks
-4.48%
Emerg
Markets
-14.60%
Bonds
3.63%
Emerg
Markets
-11.59%
Commodity
-27.03%
REITs
-4.62%
Emerg
Markets
-30.61%
Intl
U.S.
Stocks
Stocks
-21.21% -22.10%
Bonds
4.10%
Currencies
2.36%
Currencies
-1.21%
Currencies
-0.12%
REITs
-15.69%
Emerg
Markets
-53.18%
Mngd
Futures
-0.10%
Currencies
3.45%
Emerg
Markets
-18.17%
Mngd
Futures
-1.10%
Commodity
-9.52%
ComCommodity
modity
-17.01% -24.66%
Past performance does not guarantee future returns. The table above displays calendar year index performance as
representative proxies for asset classes (defined on the next page). Index returns assume reinvestment of dividends, but do not
include fees. Indexes are not available for direct investment.
Source: Index data, as publicly reported, compiled and calculated with FactSet. For more information, call Arrow Funds at (877) 277-6933. Be sure to visit our website: www.ArrowFunds.com TARGETING PORTFOLIO SOLUTIONS . The History of Asset Classes Definitions and Performance: 1996-2015 Annualized Return Standard Deviation TARGETING PORTFOLIO SOLUTIONS Asset Class Proxy Index Index Description U.S. Stocks S&P 500 Index 8.19% 15.29% Consisting of 500 U.S. equities, a common broad-based benchmark used to represent the domestic stock market. Bonds Barclays Capital U.S. Aggregate Bond Index 5.34% 3.46% A common bond benchmark used to represent broad-based fixed income exposure. International Stocks MSCI EAFE Index 4.83% 16.72% A broad benchmark to measure the performance of established international (nonU.S.) equity markets across Europe, Australia and Asia. Emerging Markets MSCI Emerging Markets Index 5.45% 23.61% An index designed to measure equity market performance in global emerging markets of developing economic countries and regions. REITs FTSE NAREIT All Equity REITs 10.88% 20.24% Designed as a comprehensive real estate investment trust (REIT) index that spans the commercial real estate space across multiple investment and property sectors. Commodity Bloomberg Commodity Index 0.99% 16.26% Formerly the Dow Jones-UBS Commodity Index (before July 2014), composed of a broad array of futures contracts on physical commodities. Managed Futures Barclay CTA Index 4.59% 7.01% Net performance index of more than 500 managed programs (CTAs) designed to reflect the overall managed futures industry with regard to trading style and overall market exposure. Currencies Barclay Currency Traders Index 3.74% 4.84% An equal-weighted composite of managed programs that specifically trade currency futures/forwards in the global interbank market. Hedge Funds HFRI Fund Weighted Composite Index 7.66% 6.95% Net performance index of more than 2000 monthly reporting hedge funds with at least $50 million or an active track record greater than twelve months. Past performance does not guarantee future returns. Index returns assume reinvestment of dividends, but do not include fees.
Indexes are not available for direct investment. Source: Index data, as publicly reported, compiled and calculated via FactSet. Standard Deviation is a statistical measurement of volatility based on historical returns. The indexes above are shown as common proxies for various asset classes, as described.
Other indexes may exist to serve as alternate proxies for the asset classes. All investment methodologies have risks, both general and product-specific, including the risk of loss of principal. Alternative investments, such as hedge funds and managed futures, may have additional risks not typically associated with traditional asset classes.
The information provided is intended to be general in nature, not specific to any investor profile, and should not be construed as investment advice. This information is subject to change at anytime, based on market volatility and other conditions, and should not be considered as a recommendation of any specific security. Always read the prospectus or offering memorandum before making any investment.
Arrow Funds are distributed by Archer Distributors, LLC (member FINRA). For more information, call Arrow Funds at (877) 277-6933 or visit our website: www.ArrowFunds.com. AD-020416 .


