


Description
Bullseye
Highlights
Alternative Assets
M
any portfolios aren’t truly as diversified as investors believe. That’s because traditional portfolios—including conventionally
diversified ones—consist exclusively of stocks and bonds, whose response to varying market conditions is insufficiently
independent. Reducing correlation between asset classes in a portfolio is the real goal of diversification. According to modern
portfolio theory, for any portfolio of assets there exists an efficient frontier.
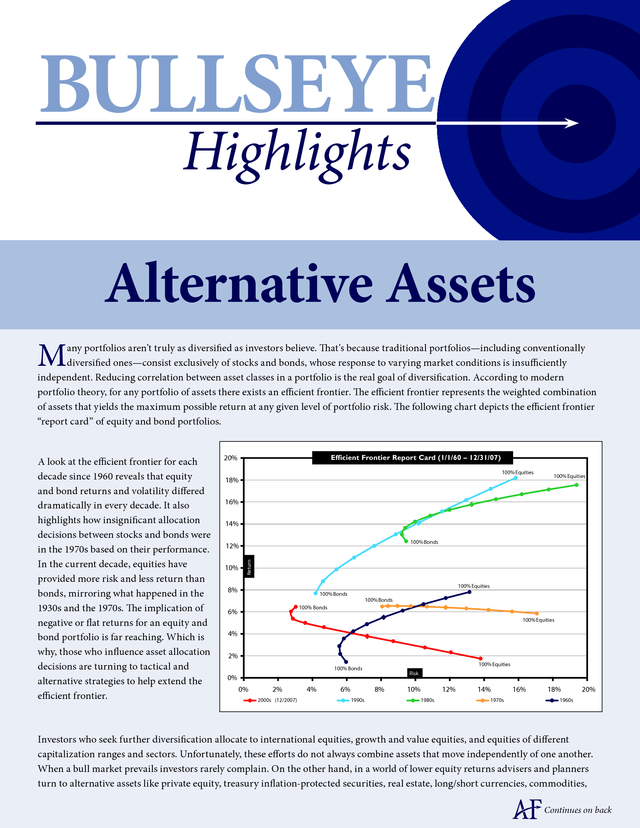
The efficient frontier represents the weighted combination of assets that yields the maximum possible return at any given level of portfolio risk. The following chart depicts the efficient frontier “report card” of equity and bond portfolios. Efficient Frontier Report Card (1/1/60 – 12/31/07) 20% 100% Equities 18% 100% Equities 16% 14% 100% Bonds 12% 10% Return A look at the efficient frontier for each decade since 1960 reveals that equity and bond returns and volatility differed dramatically in every decade. It also highlights how insignificant allocation decisions between stocks and bonds were in the 1970s based on their performance. In the current decade, equities have provided more risk and less return than bonds, mirroring what happened in the 1930s and the 1970s.
The implication of negative or flat returns for an equity and bond portfolio is far reaching. Which is why, those who influence asset allocation decisions are turning to tactical and alternative strategies to help extend the efficient frontier. 100% Equities 8% 100% Bonds 100% Bonds 100% Bonds 6% 100% Equities 4% 2% 100% Equities 100% Bonds Risk 0% 0% 2% 2000s (12/2007) 4% 6% 8% 1990s 10% 12% 1980s 14% 1970s 16% 18% 20% 1960s Investors who seek further diversification allocate to international equities, growth and value equities, and equities of different capitalization ranges and sectors. Unfortunately, these efforts do not always combine assets that move independently of one another. When a bull market prevails investors rarely complain.
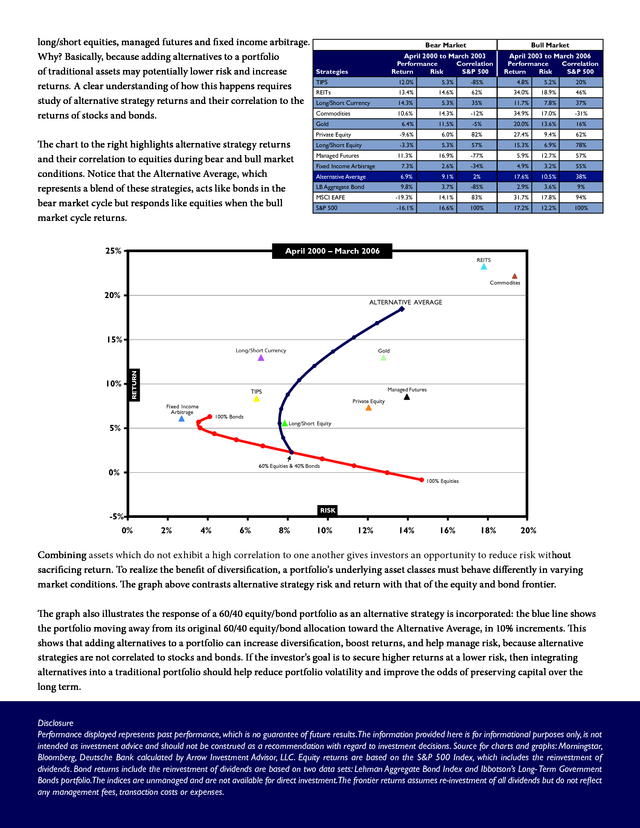
On the other hand, in a world of lower equity returns advisers and planners turn to alternative assets like private equity, treasury inflation-protected securities, real estate, long/short currencies, commodities, Continues on back . long/short equities, managed futures and fixed income arbitrage. Why? Basically, because adding alternatives to a portfolio of traditional assets may potentially lower risk and increase returns. A clear understanding of how this happens requires study of alternative strategy returns and their correlation to the returns of stocks and bonds. The chart to the right highlights alternative strategy returns and their correlation to equities during bear and bull market conditions. Notice that the Alternative Average, which represents a blend of these strategies, acts like bonds in the bear market cycle but responds like equities when the bull market cycle returns. Bear Market Bull Market April 2000 to March 2003 Performance Correlation Return Risk S&P 500 Strategies April 2003 to March 2006 Performance Correlation Return Risk S&P 500 TIPS 12.0% 5.3% -85% 4.8% 5.2% 20% REITs 13.4% 14.6% 62% 34.0% 18.9% 46% Long/Short Currency 14.3% 5.3% 35% 11.7% 7.8% 37% Commodities 10.6% 14.3% -12% 34.9% 17.0% -31% Gold 6.4% 11.5% -5% 20.0% 13.6% 16% Private Equity -9.6% 6.0% 82% 27.4% 9.4% 62% Long/Short Equity -3.3% 5.3% 57% 15.3% 6.9% 78% Managed Futures 11.3% 16.9% -77% 5.9% 12.7% 57% Fixed Income Arbitrage 7.3% 2.6% -34% 4.9% 3.2% 55% Alternative Average 6.9% 9.1% 2% 17.6% 10.5% 38% LB Aggregate Bond 9.8% 3.7% -85% 2.9% 3.6% 9% MSCI EAFE -19.3% 14.1% 83% 31.7% 17.8% 94% S&P 500 -16.1% 16.6% 100% 17.2% 12.2% 100% April 2000 – March 2006 25% REITS Commodites 20% ALTERNATIVE AVERAGE 15% RETURN Long/Short Currency 10% Gold Managed Futures TIPS Private Equity Fixed Income Arbitrage 100% Bonds 5% Long/Short Equity 60% Equities & 40% Bonds 0% 100% Equities RISK -5% 0% 2% 4% 6% 8% 10% 12% 14% 16% 18% 20% Combining assets which do not exhibit a high correlation to one another gives investors an opportunity to reduce risk without sacrificing return. To realize the benefit of diversification, a portfolio’s underlying asset classes must behave differently in varying market conditions.
The graph above contrasts alternative strategy risk and return with that of the equity and bond frontier. The graph also illustrates the response of a 60/40 equity/bond portfolio as an alternative strategy is incorporated: the blue line shows the portfolio moving away from its original 60/40 equity/bond allocation toward the Alternative Average, in 10% increments. This shows that adding alternatives to a portfolio can increase diversification, boost returns, and help manage risk, because alternative strategies are not correlated to stocks and bonds. If the investor’s goal is to secure higher returns at a lower risk, then integrating alternatives into a traditional portfolio should help reduce portfolio volatility and improve the odds of preserving capital over the long term. Disclosure Performance displayed represents past performance, which is no guarantee of future results.The information provided here is for informational purposes only, is not intended as investment advice and should not be construed as a recommendation with regard to investment decisions.
Source for charts and graphs: Morningstar, Bloomberg, Deutsche Bank calculated by Arrow Investment Advisor, LLC. Equity returns are based on the S&P 500 Index, which includes the reinvestment of dividends. Bond returns include the reinvestment of dividends are based on two data sets: Lehman Aggregate Bond Index and Ibbotson’s Long- Term Government Bonds portfolio.The indices are unmanaged and are not available for direct investment.The frontier returns assumes re-investment of all dividends but do not reflect any management fees, transaction costs or expenses. .
The efficient frontier represents the weighted combination of assets that yields the maximum possible return at any given level of portfolio risk. The following chart depicts the efficient frontier “report card” of equity and bond portfolios. Efficient Frontier Report Card (1/1/60 – 12/31/07) 20% 100% Equities 18% 100% Equities 16% 14% 100% Bonds 12% 10% Return A look at the efficient frontier for each decade since 1960 reveals that equity and bond returns and volatility differed dramatically in every decade. It also highlights how insignificant allocation decisions between stocks and bonds were in the 1970s based on their performance. In the current decade, equities have provided more risk and less return than bonds, mirroring what happened in the 1930s and the 1970s.
The implication of negative or flat returns for an equity and bond portfolio is far reaching. Which is why, those who influence asset allocation decisions are turning to tactical and alternative strategies to help extend the efficient frontier. 100% Equities 8% 100% Bonds 100% Bonds 100% Bonds 6% 100% Equities 4% 2% 100% Equities 100% Bonds Risk 0% 0% 2% 2000s (12/2007) 4% 6% 8% 1990s 10% 12% 1980s 14% 1970s 16% 18% 20% 1960s Investors who seek further diversification allocate to international equities, growth and value equities, and equities of different capitalization ranges and sectors. Unfortunately, these efforts do not always combine assets that move independently of one another. When a bull market prevails investors rarely complain.
On the other hand, in a world of lower equity returns advisers and planners turn to alternative assets like private equity, treasury inflation-protected securities, real estate, long/short currencies, commodities, Continues on back . long/short equities, managed futures and fixed income arbitrage. Why? Basically, because adding alternatives to a portfolio of traditional assets may potentially lower risk and increase returns. A clear understanding of how this happens requires study of alternative strategy returns and their correlation to the returns of stocks and bonds. The chart to the right highlights alternative strategy returns and their correlation to equities during bear and bull market conditions. Notice that the Alternative Average, which represents a blend of these strategies, acts like bonds in the bear market cycle but responds like equities when the bull market cycle returns. Bear Market Bull Market April 2000 to March 2003 Performance Correlation Return Risk S&P 500 Strategies April 2003 to March 2006 Performance Correlation Return Risk S&P 500 TIPS 12.0% 5.3% -85% 4.8% 5.2% 20% REITs 13.4% 14.6% 62% 34.0% 18.9% 46% Long/Short Currency 14.3% 5.3% 35% 11.7% 7.8% 37% Commodities 10.6% 14.3% -12% 34.9% 17.0% -31% Gold 6.4% 11.5% -5% 20.0% 13.6% 16% Private Equity -9.6% 6.0% 82% 27.4% 9.4% 62% Long/Short Equity -3.3% 5.3% 57% 15.3% 6.9% 78% Managed Futures 11.3% 16.9% -77% 5.9% 12.7% 57% Fixed Income Arbitrage 7.3% 2.6% -34% 4.9% 3.2% 55% Alternative Average 6.9% 9.1% 2% 17.6% 10.5% 38% LB Aggregate Bond 9.8% 3.7% -85% 2.9% 3.6% 9% MSCI EAFE -19.3% 14.1% 83% 31.7% 17.8% 94% S&P 500 -16.1% 16.6% 100% 17.2% 12.2% 100% April 2000 – March 2006 25% REITS Commodites 20% ALTERNATIVE AVERAGE 15% RETURN Long/Short Currency 10% Gold Managed Futures TIPS Private Equity Fixed Income Arbitrage 100% Bonds 5% Long/Short Equity 60% Equities & 40% Bonds 0% 100% Equities RISK -5% 0% 2% 4% 6% 8% 10% 12% 14% 16% 18% 20% Combining assets which do not exhibit a high correlation to one another gives investors an opportunity to reduce risk without sacrificing return. To realize the benefit of diversification, a portfolio’s underlying asset classes must behave differently in varying market conditions.
The graph above contrasts alternative strategy risk and return with that of the equity and bond frontier. The graph also illustrates the response of a 60/40 equity/bond portfolio as an alternative strategy is incorporated: the blue line shows the portfolio moving away from its original 60/40 equity/bond allocation toward the Alternative Average, in 10% increments. This shows that adding alternatives to a portfolio can increase diversification, boost returns, and help manage risk, because alternative strategies are not correlated to stocks and bonds. If the investor’s goal is to secure higher returns at a lower risk, then integrating alternatives into a traditional portfolio should help reduce portfolio volatility and improve the odds of preserving capital over the long term. Disclosure Performance displayed represents past performance, which is no guarantee of future results.The information provided here is for informational purposes only, is not intended as investment advice and should not be construed as a recommendation with regard to investment decisions.
Source for charts and graphs: Morningstar, Bloomberg, Deutsche Bank calculated by Arrow Investment Advisor, LLC. Equity returns are based on the S&P 500 Index, which includes the reinvestment of dividends. Bond returns include the reinvestment of dividends are based on two data sets: Lehman Aggregate Bond Index and Ibbotson’s Long- Term Government Bonds portfolio.The indices are unmanaged and are not available for direct investment.The frontier returns assumes re-investment of all dividends but do not reflect any management fees, transaction costs or expenses. .


