


Description
Angel Oak
Capital Advisors, LLC
Flexible Income Fund
Year-End Review
December 31, 2016
. Disclaimers
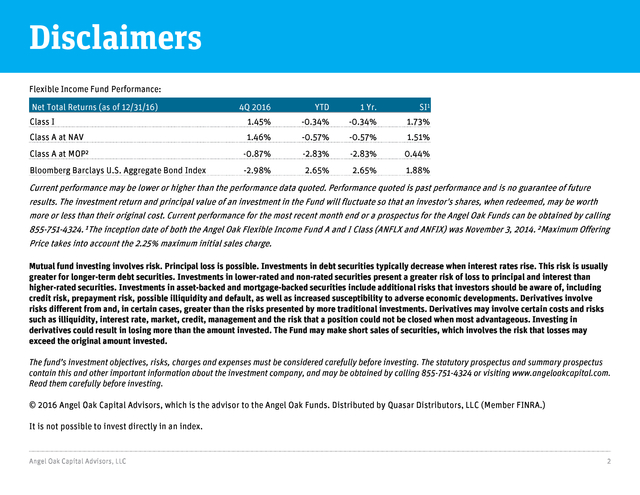
Flexible Income Fund Performance:
Net Total Returns (as of 12/31/16)
4Q 2016
YTD
1 Yr.
SI1
Class I
1.45%
-0.34%
-0.34%
1.73%
Class A at NAV
1.46%
-0.57%
-0.57%
1.51%
Class A at MOP2
-0.87%
-2.83%
-2.83%
0.44%
Bloomberg Barclays U.S. Aggregate Bond Index
-2.98%
2.65%
2.65%
1.88%
Current performance may be lower or higher than the performance data quoted. Performance quoted is past performance and is no guarantee of future
results. The investment return and principal value of an investment in the Fund will fluctuate so that an investor's shares, when redeemed, may be worth
more or less than their original cost.
Current performance for the most recent month end or a prospectus for the Angel Oak Funds can be obtained by calling 855-751-4324. 1The inception date of both the Angel Oak Flexible Income Fund A and I Class (ANFLX and ANFIX) was November 3, 2014. 2Maximum Offering Price takes into account the 2.25% maximum initial sales charge. Mutual fund investing involves risk.
Principal loss is possible. Investments in debt securities typically decrease when interest rates rise. This risk is usually greater for longer-term debt securities.
Investments in lower-rated and non-rated securities present a greater risk of loss to principal and interest than higher-rated securities. Investments in asset-backed and mortgage-backed securities include additional risks that investors should be aware of, including credit risk, prepayment risk, possible illiquidity and default, as well as increased susceptibility to adverse economic developments. Derivatives involve risks different from and, in certain cases, greater than the risks presented by more traditional investments.
Derivatives may involve certain costs and risks such as illiquidity, interest rate, market, credit, management and the risk that a position could not be closed when most advantageous. Investing in derivatives could result in losing more than the amount invested. The Fund may make short sales of securities, which involves the risk that losses may exceed the original amount invested. The fund’s investment objectives, risks, charges and expenses must be considered carefully before investing.
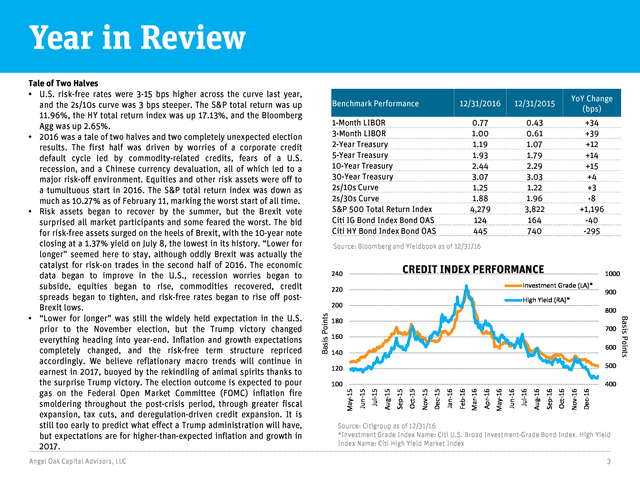
The statutory prospectus and summary prospectus contain this and other important information about the investment company, and may be obtained by calling 855-751-4324 or visiting www.angeloakcapital.com. Read them carefully before investing. © 2016 Angel Oak Capital Advisors, which is the advisor to the Angel Oak Funds. Distributed by Quasar Distributors, LLC (Member FINRA.) It is not possible to invest directly in an index. Angel Oak Capital Advisors, LLC 2 . Year in Review Angel Oak Capital Advisors, LLC 12/31/2016 12/31/2015 YoY Change (bps) 0.77 1.00 1.19 1.93 2.44 3.07 1.25 1.88 4,279 124 445 Benchmark Performance 0.43 0.61 1.07 1.79 2.29 3.03 1.22 1.96 3,822 164 740 +34 +39 +12 +14 +15 +4 +3 -8 +1,196 -40 -295 1-Month LIBOR 3-Month LIBOR 2-Year Treasury 5-Year Treasury 10-Year Treasury 30-Year Treasury 2s/10s Curve 2s/30s Curve S&P 500 Total Return Index Citi IG Bond Index Bond OAS Citi HY Bond Index Bond OAS Source: Bloomberg and Yieldbook as of 12/31/16 CREDIT INDEX PERFORMANCE 240 220 High Yield (RA)* 200 900 800 180 700 160 600 140 Dec-16 Nov-16 Oct-16 Sep-16 Aug-16 Jul-16 Jun-16 May-16 Apr-16 Mar-16 Feb-16 Jan-16 Dec-15 Nov-15 Oct-15 Sep-15 400 Aug-15 100 Jul-15 500 Jun-15 120 May-15 Basis Points 1000 Investment Grade (LA)* Source: Citigroup as of 12/31/16 *Investment Grade Index Name: Citi U.S. Broad Investment-Grade Bond Index. High Yield Index Name: Citi High Yield Market Index 3 Basis Points Tale of Two Halves • U.S. risk-free rates were 3-15 bps higher across the curve last year, and the 2s/10s curve was 3 bps steeper.
The S&P total return was up 11.96%, the HY total return index was up 17.13%, and the Bloomberg Agg was up 2.65%. • 2016 was a tale of two halves and two completely unexpected election results. The first half was driven by worries of a corporate credit default cycle led by commodity-related credits, fears of a U.S. recession, and a Chinese currency devaluation, all of which led to a major risk-off environment. Equities and other risk assets were off to a tumultuous start in 2016.
The S&P total return index was down as much as 10.27% as of February 11, marking the worst start of all time. • Risk assets began to recover by the summer, but the Brexit vote surprised all market participants and some feared the worst. The bid for risk-free assets surged on the heels of Brexit, with the 10-year note closing at a 1.37% yield on July 8, the lowest in its history. “Lower for longer” seemed here to stay, although oddly Brexit was actually the catalyst for risk-on trades in the second half of 2016.
The economic data began to improve in the U.S., recession worries began to subside, equities began to rise, commodities recovered, credit spreads began to tighten, and risk-free rates began to rise off postBrexit lows. • “Lower for longer” was still the widely held expectation in the U.S. prior to the November election, but the Trump victory changed everything heading into year-end. Inflation and growth expectations completely changed, and the risk-free term structure repriced accordingly. We believe reflationary macro trends will continue in earnest in 2017, buoyed by the rekindling of animal spirits thanks to the surprise Trump victory.
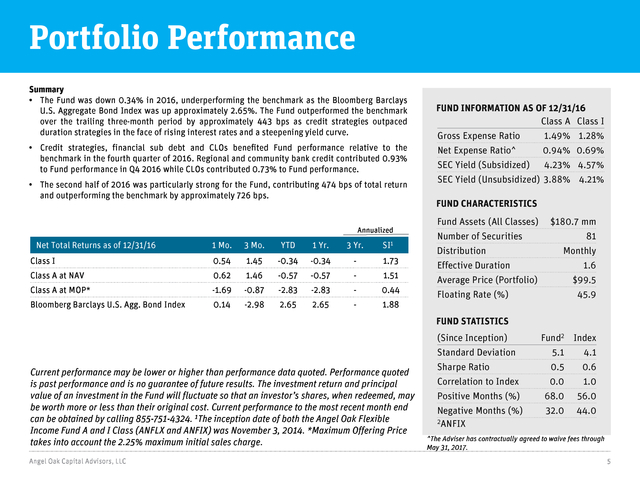
The election outcome is expected to pour gas on the Federal Open Market Committee (FOMC) inflation fire smoldering throughout the post-crisis period, through greater fiscal expansion, tax cuts, and deregulation-driven credit expansion. It is still too early to predict what effect a Trump administration will have, but expectations are for higher-than-expected inflation and growth in 2017. . Fundamental Backdrop Leveraged Loan Default Rates S&P Leveraged Loan 100 Index 110 12% Default rate by volume Default rate by loan count 10% 100 8% 6% 90 4% 2% 80 0% Source: Bloomberg as of 12/31/16 Source: Deutsche Bank as of 12/31/16 U.S. Cap Rates, All Property Types Avg (bps, RA) 600 500 400 300 200 100 0 16 15 14 13 12 11 10 9 8 7 6 Q1-96 Q4-96 Q3-97 Q2-98 Q1-99 Q4-99 Q3-00 Q2-01 Q1-02 Q4-02 Q3-03 Q2-04 Q1-05 Q4-05 Q3-06 Q2-07 Q1-08 Q4-08 Q3-09 Q2-10 Q1-11 Q4-11 Q3-12 Q2-13 Q1-14 Q4-14 Q3-15 Q2-16 10.0% 9.0% 8.0% 7.0% 6.0% 5.0% 4.0% 3.0% 2.0% 1.0% 0.0% Spread (bps, RA) % Cap Rate (LA) Basis Points 10yr UST (LA) Bank Subordinated Debt Tier 1 Common Capital (CET1) RB Ratio Total Capital Ratio Source: RCA, Morgan Stanley as of 12/31/16 Angel Oak Capital Advisors, LLC Source: SNL of 6/30/16 Tier 1 Leverage Ratio 4 . Portfolio Performance Summary • The Fund was down 0.34% in 2016, underperforming the benchmark as the Bloomberg Barclays U.S. Aggregate Bond Index was up approximately 2.65%. The Fund outperformed the benchmark over the trailing three-month period by approximately 443 bps as credit strategies outpaced duration strategies in the face of rising interest rates and a steepening yield curve. • Credit strategies, financial sub debt and CLOs benefited Fund performance relative to the benchmark in the fourth quarter of 2016. Regional and community bank credit contributed 0.93% to Fund performance in Q4 2016 while CLOs contributed 0.73% to Fund performance. • The second half of 2016 was particularly strong for the Fund, contributing 474 bps of total return and outperforming the benchmark by approximately 726 bps. Annualized Net Total Returns as of 12/31/16 1 Mo. 3 Mo. YTD 1 Yr. 3 Yr. SI1 Class I 0.54 1.45 -0.34 -0.34 - 1.73 Class A at NAV 0.62 1.46 -0.57 -0.57 - 1.51 Class A at MOP* -1.69 -0.87 -2.83 -2.83 - 0.44 Bloomberg Barclays U.S.
Agg. Bond Index 0.14 -2.98 2.65 2.65 - 1.88 FUND INFORMATION AS OF 12/31/16 Class A Class I Gross Expense Ratio 1.49% 1.28% Net Expense Ratio^ 0.94% 0.69% SEC Yield (Subsidized) 4.23% 4.57% SEC Yield (Unsubsidized) 3.88% 4.21% FUND CHARACTERISTICS Fund Assets (All Classes) Number of Securities Distribution Effective Duration Average Price (Portfolio) Floating Rate (%) $180.7 mm 81 Monthly 1.6 $99.5 45.9 FUND STATISTICS Current performance may be lower or higher than performance data quoted. Performance quoted is past performance and is no guarantee of future results.
The investment return and principal value of an investment in the Fund will fluctuate so that an investor’s shares, when redeemed, may be worth more or less than their original cost. Current performance to the most recent month end can be obtained by calling 855-751-4324. 1The inception date of both the Angel Oak Flexible Income Fund A and I Class (ANFLX and ANFIX) was November 3, 2014.
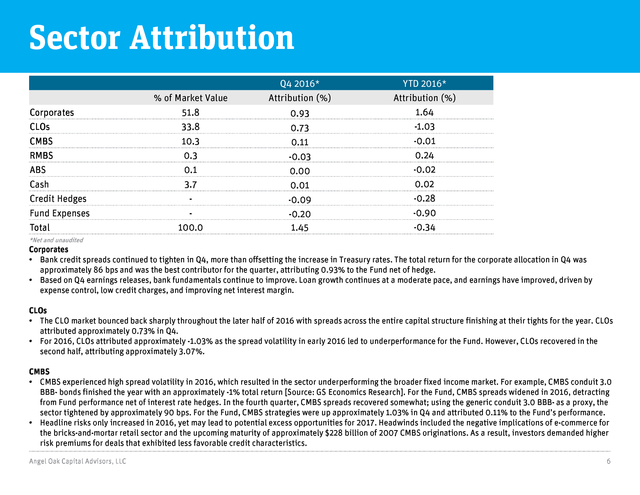
*Maximum Offering Price takes into account the 2.25% maximum initial sales charge. Angel Oak Capital Advisors, LLC (Since Inception) Standard Deviation Sharpe Ratio Correlation to Index Positive Months (%) Negative Months (%) 2ANFIX Fund2 Index 5.1 4.1 0.5 0.6 0.0 1.0 68.0 56.0 32.0 44.0 ^The Adviser has contractually agreed to waive fees through May 31, 2017. 5 . Sector Attribution Corporates CLOs CMBS RMBS ABS Cash Credit Hedges Fund Expenses Total % of Market Value 51.8 33.8 10.3 0.3 0.1 3.7 100.0 Q4 2016* Attribution (%) 0.93 0.73 0.11 -0.03 0.00 0.01 -0.09 -0.20 1.45 YTD 2016* Attribution (%) 1.64 -1.03 -0.01 0.24 -0.02 0.02 -0.28 -0.90 -0.34 *Net and unaudited Corporates • Bank credit spreads continued to tighten in Q4, more than offsetting the increase in Treasury rates. The total return for the corporate allocation in Q4 was approximately 86 bps and was the best contributor for the quarter, attributing 0.93% to the Fund net of hedge. • Based on Q4 earnings releases, bank fundamentals continue to improve. Loan growth continues at a moderate pace, and earnings have improved, driven by expense control, low credit charges, and improving net interest margin. CLOs • The CLO market bounced back sharply throughout the later half of 2016 with spreads across the entire capital structure finishing at their tights for the year. CLOs attributed approximately 0.73% in Q4. • For 2016, CLOs attributed approximately -1.03% as the spread volatility in early 2016 led to underperformance for the Fund.
However, CLOs recovered in the second half, attributing approximately 3.07%. CMBS • CMBS experienced high spread volatility in 2016, which resulted in the sector underperforming the broader fixed income market. For example, CMBS conduit 3.0 BBB- bonds finished the year with an approximately -1% total return [Source: GS Economics Research]. For the Fund, CMBS spreads widened in 2016, detracting from Fund performance net of interest rate hedges.
In the fourth quarter, CMBS spreads recovered somewhat; using the generic conduit 3.0 BBB- as a proxy, the sector tightened by approximately 90 bps. For the Fund, CMBS strategies were up approximately 1.03% in Q4 and attributed 0.11% to the Fund’s performance. • Headline risks only increased in 2016, yet may lead to potential excess opportunities for 2017. Headwinds included the negative implications of e-commerce for the bricks-and-mortar retail sector and the upcoming maturity of approximately $228 billion of 2007 CMBS originations.
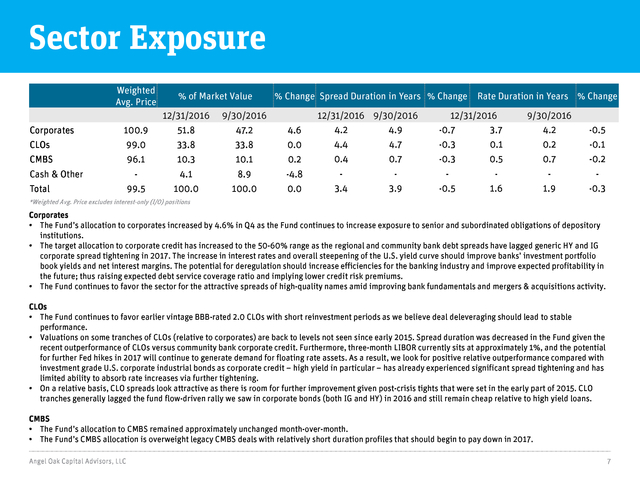
As a result, investors demanded higher risk premiums for deals that exhibited less favorable credit characteristics. Angel Oak Capital Advisors, LLC 6 . Sector Exposure Weighted Avg. Price % of Market Value 12/31/2016 % Change Spread Duration in Years % Change 9/30/2016 12/31/2016 9/30/2016 4.2 4.9 Rate Duration in Years % Change 12/31/2016 -0.7 3.7 9/30/2016 4.2 -0.5 Corporates 100.9 51.8 47.2 4.6 CLOs 99.0 33.8 33.8 0.0 4.4 4.7 -0.3 0.1 0.2 -0.1 CMBS 96.1 10.3 10.1 0.2 0.4 0.7 -0.3 0.5 0.7 -0.2 - 4.1 8.9 -4.8 - - - - - - 99.5 100.0 100.0 0.0 3.4 3.9 -0.5 1.6 1.9 -0.3 Cash & Other Total *Weighted Avg. Price excludes interest-only (I/O) positions Corporates • The Fund’s allocation to corporates increased by 4.6% in Q4 as the Fund continues to increase exposure to senior and subordinated obligations of depository institutions. • The target allocation to corporate credit has increased to the 50-60% range as the regional and community bank debt spreads have lagged generic HY and IG corporate spread tightening in 2017. The increase in interest rates and overall steepening of the U.S.
yield curve should improve banks’ investment portfolio book yields and net interest margins. The potential for deregulation should increase efficiencies for the banking industry and improve expected profitability in the future; thus raising expected debt service coverage ratio and implying lower credit risk premiums. • The Fund continues to favor the sector for the attractive spreads of high-quality names amid improving bank fundamentals and mergers & acquisitions activity. CLOs • The Fund continues to favor earlier vintage BBB-rated 2.0 CLOs with short reinvestment periods as we believe deal deleveraging should lead to stable performance. • Valuations on some tranches of CLOs (relative to corporates) are back to levels not seen since early 2015. Spread duration was decreased in the Fund given the recent outperformance of CLOs versus community bank corporate credit.
Furthermore, three-month LIBOR currently sits at approximately 1%, and the potential for further Fed hikes in 2017 will continue to generate demand for floating rate assets. As a result, we look for positive relative outperformance compared with investment grade U.S. corporate industrial bonds as corporate credit – high yield in particular – has already experienced significant spread tightening and has limited ability to absorb rate increases via further tightening. • On a relative basis, CLO spreads look attractive as there is room for further improvement given post-crisis tights that were set in the early part of 2015.
CLO tranches generally lagged the fund flow-driven rally we saw in corporate bonds (both IG and HY) in 2016 and still remain cheap relative to high yield loans. CMBS • The Fund’s allocation to CMBS remained approximately unchanged month-over-month. • The Fund’s CMBS allocation is overweight legacy CMBS deals with relatively short duration profiles that should begin to pay down in 2017. Angel Oak Capital Advisors, LLC 7 . Sector Exposure Definitions: ABS: Asset-backed securities. CLO: Collateralized loan obligation. CMBS: Commercial mortgage-backed security. RMBS: Residential mortgage-backed security. Basis Point (bps): One hundredth of one percent and is used to denote the percentage change in a financial instrument. Bloomberg Barclays U.S. Aggregate Bond Index: An unmanaged index that measures the performance of the investment-grade universe of bonds issued in the United States. The index includes institutionally traded U.S. Treasury, government sponsored, mortgage and corporate securities. Citi IG Bond Index Bond: An index that tracks the performance of U.S.
Dollar-denominated bonds issued in the U.S. investment-grade bond market. Citi HY Bond Index Bond: A U.S. dollar-denominated index which measures the performance of high-yield debt issued by corporations domiciled in the U.S. or Canada. Correlation: A statistical measure of how two securities move in relation to another.
Index used for comparison is the Barclays Aggregate Bond Index. Effective Duration: Measures a portfolio’s sensitivity to changes in interest rates. Generally, the longer the effective duration, the greater the price change relative to interest rate movements. LIBOR: A benchmark rate that some of the world's leading banks charge each other for short-term loans. It stands for Intercontinental Exchange London Interbank Offered Rate and serves as the first step to calculating interest rates on various loans throughout the world. Rate Duration: Measures the duration of a security or portfolio at a specific maturity point along the entirety of the yield curve. S&P 500 Total Return Index: An American stock market index based on the market capitalizations of 500 large companies having common stock listed on the NYSE or NASDAQ. S&P Leveraged Loan 100 Index: A capitalization-weighted syndicated loan index based upon market weightings, spreads and interest payments. Sharpe Ratio: A statistical measure that uses standard deviation and excess return to determine reward per unit of risk.
A higher Sharpe ratio implies a better historical risk-adjusted performance. The Sharpe ratio has been calculated since inception using the 3-month Treasury bill for the risk-free rate of return. Spread: The difference in yield between LIBOR and a debt security with the same maturity but of lesser quality. Spread Duration: A bond’s price sensitivity to spread changes. Standard Deviation: A statistical measure of portfolio risk used to measure variability of total return around an average, over a specified period of time. The greater the standard deviation over the period, the wider the variability or range of returns and hence, the greater the fund’s volatility. The standard deviation has been calculated since inception. Tier 1 Common Capital (CET1) RB Ratio: Measurement of a bank’s core equity capital compared with its total risk-weighted asset that signifies a bank’s financial strength. Total Capital Ratio: The percentage of a bank's capital to its risk-weighted assets. Tier 1 Leverage Ratio: The relationship between a banking organization's core capital and its total assets. Angel Oak Capital Advisors, LLC 8 .
.
Current performance for the most recent month end or a prospectus for the Angel Oak Funds can be obtained by calling 855-751-4324. 1The inception date of both the Angel Oak Flexible Income Fund A and I Class (ANFLX and ANFIX) was November 3, 2014. 2Maximum Offering Price takes into account the 2.25% maximum initial sales charge. Mutual fund investing involves risk.
Principal loss is possible. Investments in debt securities typically decrease when interest rates rise. This risk is usually greater for longer-term debt securities.
Investments in lower-rated and non-rated securities present a greater risk of loss to principal and interest than higher-rated securities. Investments in asset-backed and mortgage-backed securities include additional risks that investors should be aware of, including credit risk, prepayment risk, possible illiquidity and default, as well as increased susceptibility to adverse economic developments. Derivatives involve risks different from and, in certain cases, greater than the risks presented by more traditional investments.
Derivatives may involve certain costs and risks such as illiquidity, interest rate, market, credit, management and the risk that a position could not be closed when most advantageous. Investing in derivatives could result in losing more than the amount invested. The Fund may make short sales of securities, which involves the risk that losses may exceed the original amount invested. The fund’s investment objectives, risks, charges and expenses must be considered carefully before investing.
The statutory prospectus and summary prospectus contain this and other important information about the investment company, and may be obtained by calling 855-751-4324 or visiting www.angeloakcapital.com. Read them carefully before investing. © 2016 Angel Oak Capital Advisors, which is the advisor to the Angel Oak Funds. Distributed by Quasar Distributors, LLC (Member FINRA.) It is not possible to invest directly in an index. Angel Oak Capital Advisors, LLC 2 . Year in Review Angel Oak Capital Advisors, LLC 12/31/2016 12/31/2015 YoY Change (bps) 0.77 1.00 1.19 1.93 2.44 3.07 1.25 1.88 4,279 124 445 Benchmark Performance 0.43 0.61 1.07 1.79 2.29 3.03 1.22 1.96 3,822 164 740 +34 +39 +12 +14 +15 +4 +3 -8 +1,196 -40 -295 1-Month LIBOR 3-Month LIBOR 2-Year Treasury 5-Year Treasury 10-Year Treasury 30-Year Treasury 2s/10s Curve 2s/30s Curve S&P 500 Total Return Index Citi IG Bond Index Bond OAS Citi HY Bond Index Bond OAS Source: Bloomberg and Yieldbook as of 12/31/16 CREDIT INDEX PERFORMANCE 240 220 High Yield (RA)* 200 900 800 180 700 160 600 140 Dec-16 Nov-16 Oct-16 Sep-16 Aug-16 Jul-16 Jun-16 May-16 Apr-16 Mar-16 Feb-16 Jan-16 Dec-15 Nov-15 Oct-15 Sep-15 400 Aug-15 100 Jul-15 500 Jun-15 120 May-15 Basis Points 1000 Investment Grade (LA)* Source: Citigroup as of 12/31/16 *Investment Grade Index Name: Citi U.S. Broad Investment-Grade Bond Index. High Yield Index Name: Citi High Yield Market Index 3 Basis Points Tale of Two Halves • U.S. risk-free rates were 3-15 bps higher across the curve last year, and the 2s/10s curve was 3 bps steeper.
The S&P total return was up 11.96%, the HY total return index was up 17.13%, and the Bloomberg Agg was up 2.65%. • 2016 was a tale of two halves and two completely unexpected election results. The first half was driven by worries of a corporate credit default cycle led by commodity-related credits, fears of a U.S. recession, and a Chinese currency devaluation, all of which led to a major risk-off environment. Equities and other risk assets were off to a tumultuous start in 2016.
The S&P total return index was down as much as 10.27% as of February 11, marking the worst start of all time. • Risk assets began to recover by the summer, but the Brexit vote surprised all market participants and some feared the worst. The bid for risk-free assets surged on the heels of Brexit, with the 10-year note closing at a 1.37% yield on July 8, the lowest in its history. “Lower for longer” seemed here to stay, although oddly Brexit was actually the catalyst for risk-on trades in the second half of 2016.
The economic data began to improve in the U.S., recession worries began to subside, equities began to rise, commodities recovered, credit spreads began to tighten, and risk-free rates began to rise off postBrexit lows. • “Lower for longer” was still the widely held expectation in the U.S. prior to the November election, but the Trump victory changed everything heading into year-end. Inflation and growth expectations completely changed, and the risk-free term structure repriced accordingly. We believe reflationary macro trends will continue in earnest in 2017, buoyed by the rekindling of animal spirits thanks to the surprise Trump victory.
The election outcome is expected to pour gas on the Federal Open Market Committee (FOMC) inflation fire smoldering throughout the post-crisis period, through greater fiscal expansion, tax cuts, and deregulation-driven credit expansion. It is still too early to predict what effect a Trump administration will have, but expectations are for higher-than-expected inflation and growth in 2017. . Fundamental Backdrop Leveraged Loan Default Rates S&P Leveraged Loan 100 Index 110 12% Default rate by volume Default rate by loan count 10% 100 8% 6% 90 4% 2% 80 0% Source: Bloomberg as of 12/31/16 Source: Deutsche Bank as of 12/31/16 U.S. Cap Rates, All Property Types Avg (bps, RA) 600 500 400 300 200 100 0 16 15 14 13 12 11 10 9 8 7 6 Q1-96 Q4-96 Q3-97 Q2-98 Q1-99 Q4-99 Q3-00 Q2-01 Q1-02 Q4-02 Q3-03 Q2-04 Q1-05 Q4-05 Q3-06 Q2-07 Q1-08 Q4-08 Q3-09 Q2-10 Q1-11 Q4-11 Q3-12 Q2-13 Q1-14 Q4-14 Q3-15 Q2-16 10.0% 9.0% 8.0% 7.0% 6.0% 5.0% 4.0% 3.0% 2.0% 1.0% 0.0% Spread (bps, RA) % Cap Rate (LA) Basis Points 10yr UST (LA) Bank Subordinated Debt Tier 1 Common Capital (CET1) RB Ratio Total Capital Ratio Source: RCA, Morgan Stanley as of 12/31/16 Angel Oak Capital Advisors, LLC Source: SNL of 6/30/16 Tier 1 Leverage Ratio 4 . Portfolio Performance Summary • The Fund was down 0.34% in 2016, underperforming the benchmark as the Bloomberg Barclays U.S. Aggregate Bond Index was up approximately 2.65%. The Fund outperformed the benchmark over the trailing three-month period by approximately 443 bps as credit strategies outpaced duration strategies in the face of rising interest rates and a steepening yield curve. • Credit strategies, financial sub debt and CLOs benefited Fund performance relative to the benchmark in the fourth quarter of 2016. Regional and community bank credit contributed 0.93% to Fund performance in Q4 2016 while CLOs contributed 0.73% to Fund performance. • The second half of 2016 was particularly strong for the Fund, contributing 474 bps of total return and outperforming the benchmark by approximately 726 bps. Annualized Net Total Returns as of 12/31/16 1 Mo. 3 Mo. YTD 1 Yr. 3 Yr. SI1 Class I 0.54 1.45 -0.34 -0.34 - 1.73 Class A at NAV 0.62 1.46 -0.57 -0.57 - 1.51 Class A at MOP* -1.69 -0.87 -2.83 -2.83 - 0.44 Bloomberg Barclays U.S.
Agg. Bond Index 0.14 -2.98 2.65 2.65 - 1.88 FUND INFORMATION AS OF 12/31/16 Class A Class I Gross Expense Ratio 1.49% 1.28% Net Expense Ratio^ 0.94% 0.69% SEC Yield (Subsidized) 4.23% 4.57% SEC Yield (Unsubsidized) 3.88% 4.21% FUND CHARACTERISTICS Fund Assets (All Classes) Number of Securities Distribution Effective Duration Average Price (Portfolio) Floating Rate (%) $180.7 mm 81 Monthly 1.6 $99.5 45.9 FUND STATISTICS Current performance may be lower or higher than performance data quoted. Performance quoted is past performance and is no guarantee of future results.
The investment return and principal value of an investment in the Fund will fluctuate so that an investor’s shares, when redeemed, may be worth more or less than their original cost. Current performance to the most recent month end can be obtained by calling 855-751-4324. 1The inception date of both the Angel Oak Flexible Income Fund A and I Class (ANFLX and ANFIX) was November 3, 2014.
*Maximum Offering Price takes into account the 2.25% maximum initial sales charge. Angel Oak Capital Advisors, LLC (Since Inception) Standard Deviation Sharpe Ratio Correlation to Index Positive Months (%) Negative Months (%) 2ANFIX Fund2 Index 5.1 4.1 0.5 0.6 0.0 1.0 68.0 56.0 32.0 44.0 ^The Adviser has contractually agreed to waive fees through May 31, 2017. 5 . Sector Attribution Corporates CLOs CMBS RMBS ABS Cash Credit Hedges Fund Expenses Total % of Market Value 51.8 33.8 10.3 0.3 0.1 3.7 100.0 Q4 2016* Attribution (%) 0.93 0.73 0.11 -0.03 0.00 0.01 -0.09 -0.20 1.45 YTD 2016* Attribution (%) 1.64 -1.03 -0.01 0.24 -0.02 0.02 -0.28 -0.90 -0.34 *Net and unaudited Corporates • Bank credit spreads continued to tighten in Q4, more than offsetting the increase in Treasury rates. The total return for the corporate allocation in Q4 was approximately 86 bps and was the best contributor for the quarter, attributing 0.93% to the Fund net of hedge. • Based on Q4 earnings releases, bank fundamentals continue to improve. Loan growth continues at a moderate pace, and earnings have improved, driven by expense control, low credit charges, and improving net interest margin. CLOs • The CLO market bounced back sharply throughout the later half of 2016 with spreads across the entire capital structure finishing at their tights for the year. CLOs attributed approximately 0.73% in Q4. • For 2016, CLOs attributed approximately -1.03% as the spread volatility in early 2016 led to underperformance for the Fund.
However, CLOs recovered in the second half, attributing approximately 3.07%. CMBS • CMBS experienced high spread volatility in 2016, which resulted in the sector underperforming the broader fixed income market. For example, CMBS conduit 3.0 BBB- bonds finished the year with an approximately -1% total return [Source: GS Economics Research]. For the Fund, CMBS spreads widened in 2016, detracting from Fund performance net of interest rate hedges.
In the fourth quarter, CMBS spreads recovered somewhat; using the generic conduit 3.0 BBB- as a proxy, the sector tightened by approximately 90 bps. For the Fund, CMBS strategies were up approximately 1.03% in Q4 and attributed 0.11% to the Fund’s performance. • Headline risks only increased in 2016, yet may lead to potential excess opportunities for 2017. Headwinds included the negative implications of e-commerce for the bricks-and-mortar retail sector and the upcoming maturity of approximately $228 billion of 2007 CMBS originations.
As a result, investors demanded higher risk premiums for deals that exhibited less favorable credit characteristics. Angel Oak Capital Advisors, LLC 6 . Sector Exposure Weighted Avg. Price % of Market Value 12/31/2016 % Change Spread Duration in Years % Change 9/30/2016 12/31/2016 9/30/2016 4.2 4.9 Rate Duration in Years % Change 12/31/2016 -0.7 3.7 9/30/2016 4.2 -0.5 Corporates 100.9 51.8 47.2 4.6 CLOs 99.0 33.8 33.8 0.0 4.4 4.7 -0.3 0.1 0.2 -0.1 CMBS 96.1 10.3 10.1 0.2 0.4 0.7 -0.3 0.5 0.7 -0.2 - 4.1 8.9 -4.8 - - - - - - 99.5 100.0 100.0 0.0 3.4 3.9 -0.5 1.6 1.9 -0.3 Cash & Other Total *Weighted Avg. Price excludes interest-only (I/O) positions Corporates • The Fund’s allocation to corporates increased by 4.6% in Q4 as the Fund continues to increase exposure to senior and subordinated obligations of depository institutions. • The target allocation to corporate credit has increased to the 50-60% range as the regional and community bank debt spreads have lagged generic HY and IG corporate spread tightening in 2017. The increase in interest rates and overall steepening of the U.S.
yield curve should improve banks’ investment portfolio book yields and net interest margins. The potential for deregulation should increase efficiencies for the banking industry and improve expected profitability in the future; thus raising expected debt service coverage ratio and implying lower credit risk premiums. • The Fund continues to favor the sector for the attractive spreads of high-quality names amid improving bank fundamentals and mergers & acquisitions activity. CLOs • The Fund continues to favor earlier vintage BBB-rated 2.0 CLOs with short reinvestment periods as we believe deal deleveraging should lead to stable performance. • Valuations on some tranches of CLOs (relative to corporates) are back to levels not seen since early 2015. Spread duration was decreased in the Fund given the recent outperformance of CLOs versus community bank corporate credit.
Furthermore, three-month LIBOR currently sits at approximately 1%, and the potential for further Fed hikes in 2017 will continue to generate demand for floating rate assets. As a result, we look for positive relative outperformance compared with investment grade U.S. corporate industrial bonds as corporate credit – high yield in particular – has already experienced significant spread tightening and has limited ability to absorb rate increases via further tightening. • On a relative basis, CLO spreads look attractive as there is room for further improvement given post-crisis tights that were set in the early part of 2015.
CLO tranches generally lagged the fund flow-driven rally we saw in corporate bonds (both IG and HY) in 2016 and still remain cheap relative to high yield loans. CMBS • The Fund’s allocation to CMBS remained approximately unchanged month-over-month. • The Fund’s CMBS allocation is overweight legacy CMBS deals with relatively short duration profiles that should begin to pay down in 2017. Angel Oak Capital Advisors, LLC 7 . Sector Exposure Definitions: ABS: Asset-backed securities. CLO: Collateralized loan obligation. CMBS: Commercial mortgage-backed security. RMBS: Residential mortgage-backed security. Basis Point (bps): One hundredth of one percent and is used to denote the percentage change in a financial instrument. Bloomberg Barclays U.S. Aggregate Bond Index: An unmanaged index that measures the performance of the investment-grade universe of bonds issued in the United States. The index includes institutionally traded U.S. Treasury, government sponsored, mortgage and corporate securities. Citi IG Bond Index Bond: An index that tracks the performance of U.S.
Dollar-denominated bonds issued in the U.S. investment-grade bond market. Citi HY Bond Index Bond: A U.S. dollar-denominated index which measures the performance of high-yield debt issued by corporations domiciled in the U.S. or Canada. Correlation: A statistical measure of how two securities move in relation to another.
Index used for comparison is the Barclays Aggregate Bond Index. Effective Duration: Measures a portfolio’s sensitivity to changes in interest rates. Generally, the longer the effective duration, the greater the price change relative to interest rate movements. LIBOR: A benchmark rate that some of the world's leading banks charge each other for short-term loans. It stands for Intercontinental Exchange London Interbank Offered Rate and serves as the first step to calculating interest rates on various loans throughout the world. Rate Duration: Measures the duration of a security or portfolio at a specific maturity point along the entirety of the yield curve. S&P 500 Total Return Index: An American stock market index based on the market capitalizations of 500 large companies having common stock listed on the NYSE or NASDAQ. S&P Leveraged Loan 100 Index: A capitalization-weighted syndicated loan index based upon market weightings, spreads and interest payments. Sharpe Ratio: A statistical measure that uses standard deviation and excess return to determine reward per unit of risk.
A higher Sharpe ratio implies a better historical risk-adjusted performance. The Sharpe ratio has been calculated since inception using the 3-month Treasury bill for the risk-free rate of return. Spread: The difference in yield between LIBOR and a debt security with the same maturity but of lesser quality. Spread Duration: A bond’s price sensitivity to spread changes. Standard Deviation: A statistical measure of portfolio risk used to measure variability of total return around an average, over a specified period of time. The greater the standard deviation over the period, the wider the variability or range of returns and hence, the greater the fund’s volatility. The standard deviation has been calculated since inception. Tier 1 Common Capital (CET1) RB Ratio: Measurement of a bank’s core equity capital compared with its total risk-weighted asset that signifies a bank’s financial strength. Total Capital Ratio: The percentage of a bank's capital to its risk-weighted assets. Tier 1 Leverage Ratio: The relationship between a banking organization's core capital and its total assets. Angel Oak Capital Advisors, LLC 8 .
.


