Angel Oak Multi-Strategy Income Fund Year-End Review - December 31, 2016
Angel Oak Capital Advisors


Description
Angel Oak
Capital Advisors, LLC
Angel Oak Multi-Strategy Income Fund
Year-End Review
December 31, 2016
. Disclaimers
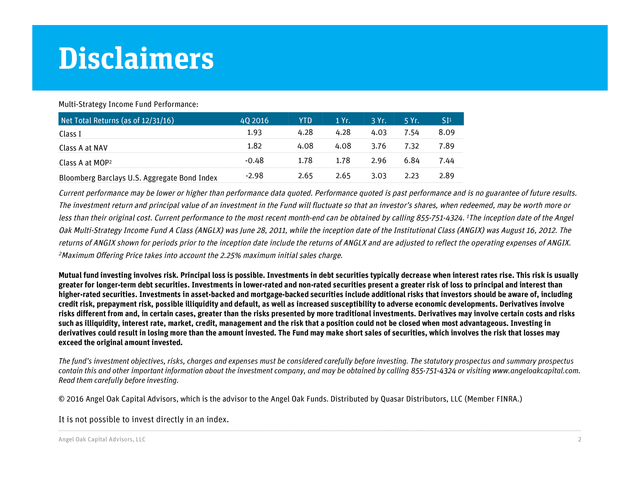
Multi-Strategy Income Fund Performance:
Net Total Returns (as of 12/31/16)
4Q 2016
1.93
YTD
4.28
1 Yr.
4.28
3 Yr.
4.03
5 Yr.
7.54
SI1
8.09
Class A at NAV
1.82
4.08
4.08
3.76
7.32
7.89
Class A at MOP2
-0.48
1.78
1.78
2.96
6.84
7.44
Bloomberg Barclays U.S. Aggregate Bond Index
-2.98
2.65
2.65
3.03
2.23
2.89
Class I
Current performance may be lower or higher than performance data quoted. Performance quoted is past performance and is no guarantee of future results.
The investment return and principal value of an investment in the Fund will fluctuate so that an investor’s shares, when redeemed, may be worth more or
less than their original cost. Current performance to the most recent month-end can be obtained by calling 855-751-4324.
1The inception date of the Angel Oak Multi-Strategy Income Fund A Class (ANGLX) was June 28, 2011, while the inception date of the Institutional Class (ANGIX) was August 16, 2012. The returns of ANGIX shown for periods prior to the inception date include the returns of ANGLX and are adjusted to reflect the operating expenses of ANGIX. 2Maximum Offering Price takes into account the 2.25% maximum initial sales charge. Mutual fund investing involves risk. Principal loss is possible.
Investments in debt securities typically decrease when interest rates rise. This risk is usually greater for longer-term debt securities. Investments in lower-rated and non-rated securities present a greater risk of loss to principal and interest than higher-rated securities.
Investments in asset-backed and mortgage-backed securities include additional risks that investors should be aware of, including credit risk, prepayment risk, possible illiquidity and default, as well as increased susceptibility to adverse economic developments. Derivatives involve risks different from and, in certain cases, greater than the risks presented by more traditional investments. Derivatives may involve certain costs and risks such as illiquidity, interest rate, market, credit, management and the risk that a position could not be closed when most advantageous.
Investing in derivatives could result in losing more than the amount invested. The Fund may make short sales of securities, which involves the risk that losses may exceed the original amount invested. The fund’s investment objectives, risks, charges and expenses must be considered carefully before investing. The statutory prospectus and summary prospectus contain this and other important information about the investment company, and may be obtained by calling 855-751-4324 or visiting www.angeloakcapital.com. Read them carefully before investing. © 2016 Angel Oak Capital Advisors, which is the advisor to the Angel Oak Funds.
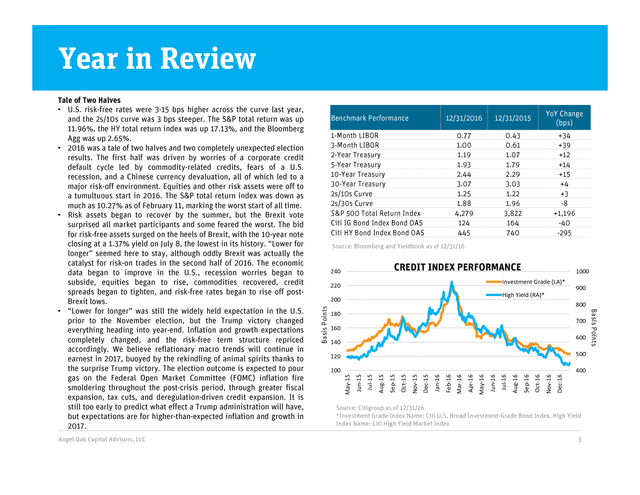
Distributed by Quasar Distributors, LLC (Member FINRA.) It is not possible to invest directly in an index. Angel Oak Capital Advisors, LLC 2 . Year in Review Angel Oak Capital Advisors, LLC 12/31/2016 12/31/2015 YoY Change (bps) 0.77 1.00 1.19 1.93 2.44 3.07 1.25 1.88 4,279 124 445 Benchmark Performance 0.43 0.61 1.07 1.79 2.29 3.03 1.22 1.96 3,822 164 740 +34 +39 +12 +14 +15 +4 +3 -8 +1,196 -40 -295 1-Month LIBOR 3-Month LIBOR 2-Year Treasury 5-Year Treasury 10-Year Treasury 30-Year Treasury 2s/10s Curve 2s/30s Curve S&P 500 Total Return Index Citi IG Bond Index Bond OAS Citi HY Bond Index Bond OAS Source: Bloomberg and Yieldbook as of 12/31/16 CREDIT INDEX PERFORMANCE 240 220 High Yield (RA)* 200 900 800 180 700 160 600 140 Dec-16 Nov-16 Oct-16 Sep-16 Jul-16 Aug-16 Jun-16 Apr-16 May-16 Feb-16 Mar-16 Jan-16 Dec-15 Oct-15 Nov-15 Sep-15 400 Jul-15 100 Aug-15 500 Jun-15 120 May-15 Basis Points 1000 Investment Grade (LA)* Source: Citigroup as of 12/31/16 *Investment Grade Index Name: Citi U.S. Broad Investment-Grade Bond Index. High Yield Index Name: Citi High Yield Market Index 3 Basis Points Tale of Two Halves • U.S. risk-free rates were 3-15 bps higher across the curve last year, and the 2s/10s curve was 3 bps steeper.
The S&P total return was up 11.96%, the HY total return index was up 17.13%, and the Bloomberg Agg was up 2.65%. • 2016 was a tale of two halves and two completely unexpected election results. The first half was driven by worries of a corporate credit default cycle led by commodity-related credits, fears of a U.S. recession, and a Chinese currency devaluation, all of which led to a major risk-off environment. Equities and other risk assets were off to a tumultuous start in 2016.
The S&P total return index was down as much as 10.27% as of February 11, marking the worst start of all time. • Risk assets began to recover by the summer, but the Brexit vote surprised all market participants and some feared the worst. The bid for risk-free assets surged on the heels of Brexit, with the 10-year note closing at a 1.37% yield on July 8, the lowest in its history. “Lower for longer” seemed here to stay, although oddly Brexit was actually the catalyst for risk-on trades in the second half of 2016.
The economic data began to improve in the U.S., recession worries began to subside, equities began to rise, commodities recovered, credit spreads began to tighten, and risk-free rates began to rise off postBrexit lows. • “Lower for longer” was still the widely held expectation in the U.S. prior to the November election, but the Trump victory changed everything heading into year-end. Inflation and growth expectations completely changed, and the risk-free term structure repriced accordingly. We believe reflationary macro trends will continue in earnest in 2017, buoyed by the rekindling of animal spirits thanks to the surprise Trump victory.
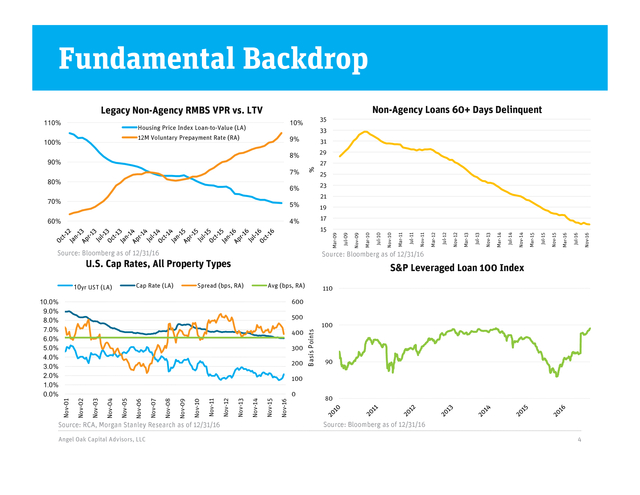
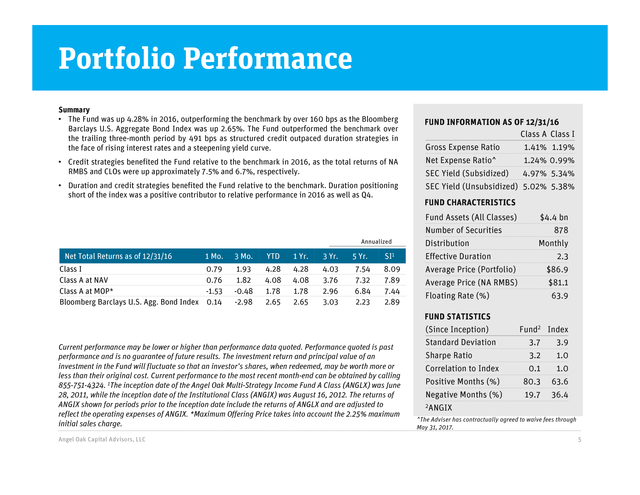
The election outcome is expected to pour gas on the Federal Open Market Committee (FOMC) inflation fire smoldering throughout the post-crisis period, through greater fiscal expansion, tax cuts, and deregulation-driven credit expansion. It is still too early to predict what effect a Trump administration will have, but expectations are for higher-than-expected inflation and growth in 2017. . Fundamental Backdrop Legacy Non-Agency RMBS VPR vs. LTV 10% 31 29 7% 6% 19 21 Source: Bloomberg as of 12/31/16 Cap Rate (LA) S&P Leveraged Loan 100 Index Spread (bps, RA) Avg (bps, RA) 110 600 500 300 200 100 Basis Points 400 90 100 Source: RCA, Morgan Stanley Research as of 12/31/16 Angel Oak Capital Advisors, LLC Nov-16 Nov-15 Nov-14 Nov-13 Nov-12 Nov-11 Nov-10 Nov-09 Nov-08 Nov-07 Nov-06 Nov-05 Nov-04 Nov-03 Nov-02 Nov-01 0 80 Source: Bloomberg as of 12/31/16 4 Nov-16 Jul-16 Mar-16 Jul-15 Nov-15 Mar-15 Jul-14 Nov-14 Mar-14 Jul-13 Nov-13 Nov-12 Mar-13 Jul-12 Nov-11 Mar-12 Source: Bloomberg as of 12/31/16 U.S. Cap Rates, All Property Types 10yr UST (LA) Jul-11 15 Mar-11 17 4% Nov-10 60% 23 5% 70% 10.0% 9.0% 8.0% 7.0% 6.0% 5.0% 4.0% 3.0% 2.0% 1.0% 0.0% 27 25 Jul-10 80% % 8% 90% Mar-10 100% 33 9% Jul-09 12M Voluntary Prepayment Rate (RA) Nov-09 Housing Price Index Loan-to-Value (LA) Mar-09 110% Non-Agency Loans 60+ Days Delinquent 35 . Portfolio Performance Summary • The Fund was up 4.28% in 2016, outperforming the benchmark by over 160 bps as the Bloomberg Barclays U.S. Aggregate Bond Index was up 2.65%. The Fund outperformed the benchmark over the trailing three-month period by 491 bps as structured credit outpaced duration strategies in the face of rising interest rates and a steepening yield curve. FUND INFORMATION AS OF 12/31/16 Class A Class I Gross Expense Ratio 1.41% 1.19% • Credit strategies benefited the Fund relative to the benchmark in 2016, as the total returns of NA RMBS and CLOs were up approximately 7.5% and 6.7%, respectively. Net Expense Ratio^ 1.24% 0.99% SEC Yield (Subsidized) 4.97% 5.34% • Duration and credit strategies benefited the Fund relative to the benchmark. Duration positioning short of the index was a positive contributor to relative performance in 2016 as well as Q4. SEC Yield (Unsubsidized) 5.02% 5.38% FUND CHARACTERISTICS Fund Assets (All Classes) $4.4 bn Number of Securities Annualized Net Total Returns as of 12/31/16 Class I Class A at NAV Class A at MOP* Bloomberg Barclays U.S.
Agg. Bond Index 1 Mo. 3 Mo. YTD 1 Yr. 3 Yr. 5 Yr. SI1 0.79 0.76 -1.53 0.14 1.93 1.82 -0.48 -2.98 4.28 4.08 1.78 2.65 4.28 4.08 1.78 2.65 4.03 3.76 2.96 3.03 7.54 7.32 6.84 2.23 8.09 7.89 7.44 2.89 Distribution 878 Monthly Effective Duration 2.3 Average Price (Portfolio) $86.9 Average Price (NA RMBS) $81.1 Angel Oak Capital Advisors, LLC 63.9 FUND STATISTICS (Since Inception) Current performance may be lower or higher than performance data quoted. Performance quoted is past performance and is no guarantee of future results.
The investment return and principal value of an investment in the Fund will fluctuate so that an investor’s shares, when redeemed, may be worth more or less than their original cost. Current performance to the most recent month-end can be obtained by calling 855-751-4324. 1The inception date of the Angel Oak Multi-Strategy Income Fund A Class (ANGLX) was June 28, 2011, while the inception date of the Institutional Class (ANGIX) was August 16, 2012.
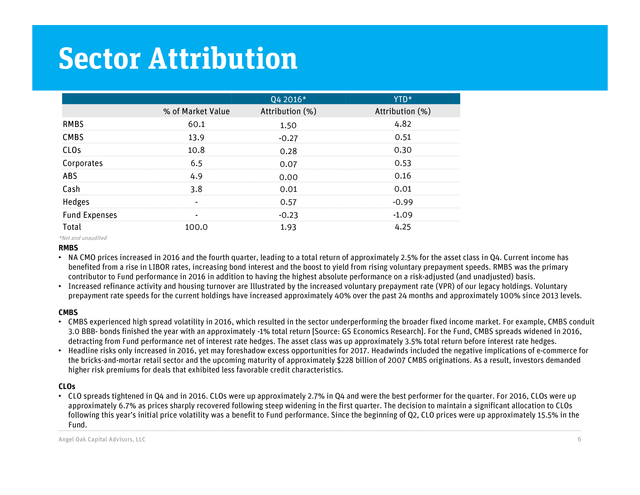
The returns of ANGIX shown for periods prior to the inception date include the returns of ANGLX and are adjusted to reflect the operating expenses of ANGIX. *Maximum Offering Price takes into account the 2.25% maximum initial sales charge. Floating Rate (%) Fund2 Index Standard Deviation 3.7 3.9 Sharpe Ratio 3.2 1.0 Correlation to Index 0.1 1.0 Positive Months (%) 80.3 63.6 Negative Months (%) 19.7 36.4 2ANGIX ^The Adviser has contractually agreed to waive fees through May 31, 2017. 5 . Sector Attribution % of Market Value Q4 2016* Attribution (%) RMBS 60.1 1.50 YTD* Attribution (%) 4.82 CMBS 13.9 -0.27 0.51 CLOs 10.8 0.28 0.30 Corporates 6.5 0.07 0.53 ABS 4.9 0.16 Cash 3.8 0.00 0.01 0.01 - 0.57 -0.99 100.0 -0.23 1.93 -1.09 4.25 Hedges Fund Expenses Total *Net and unaudited RMBS • NA CMO prices increased in 2016 and the fourth quarter, leading to a total return of approximately 2.5% for the asset class in Q4. Current income has benefited from a rise in LIBOR rates, increasing bond interest and the boost to yield from rising voluntary prepayment speeds. RMBS was the primary contributor to Fund performance in 2016 in addition to having the highest absolute performance on a risk-adjusted (and unadjusted) basis. • Increased refinance activity and housing turnover are Illustrated by the increased voluntary prepayment rate (VPR) of our legacy holdings. Voluntary prepayment rate speeds for the current holdings have increased approximately 40% over the past 24 months and approximately 100% since 2013 levels. CMBS • CMBS experienced high spread volatility in 2016, which resulted in the sector underperforming the broader fixed income market.
For example, CMBS conduit 3.0 BBB- bonds finished the year with an approximately -1% total return [Source: GS Economics Research]. For the Fund, CMBS spreads widened in 2016, detracting from Fund performance net of interest rate hedges. The asset class was up approximately 3.5% total return before interest rate hedges. • Headline risks only increased in 2016, yet may foreshadow excess opportunities for 2017.
Headwinds included the negative implications of e-commerce for the bricks-and-mortar retail sector and the upcoming maturity of approximately $228 billion of 2007 CMBS originations. As a result, investors demanded higher risk premiums for deals that exhibited less favorable credit characteristics. CLOs • CLO spreads tightened in Q4 and in 2016. CLOs were up approximately 2.7% in Q4 and were the best performer for the quarter.
For 2016, CLOs were up approximately 6.7% as prices sharply recovered following steep widening in the first quarter. The decision to maintain a significant allocation to CLOs following this year’s initial price volatility was a benefit to Fund performance. Since the beginning of Q2, CLO prices were up approximately 15.5% in the Fund. Angel Oak Capital Advisors, LLC 6 .
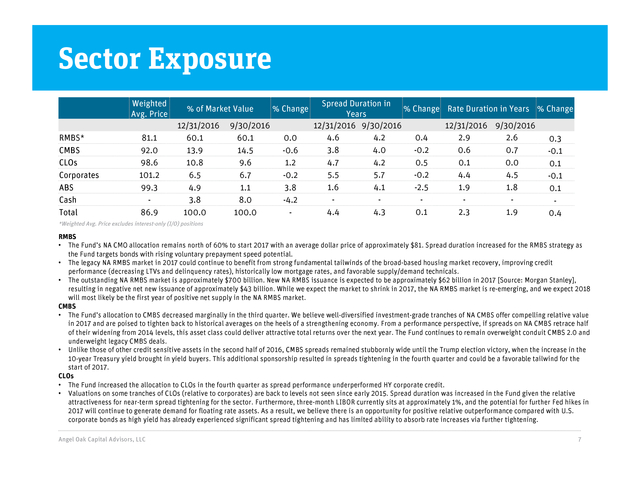
Sector Exposure Weighted Avg. Price RMBS* CMBS CLOs Corporates ABS Cash Total 81.1 92.0 98.6 101.2 99.3 86.9 % of Market Value 12/31/2016 60.1 13.9 10.8 6.5 4.9 3.8 100.0 9/30/2016 60.1 14.5 9.6 6.7 1.1 8.0 100.0 % Change 0.0 -0.6 1.2 -0.2 3.8 -4.2 - Spread Duration in % Change Rate Duration in Years % Change Years 12/31/2016 9/30/2016 12/31/2016 9/30/2016 4.6 4.2 0.4 2.9 2.6 0.3 3.8 4.0 -0.2 0.6 0.7 -0.1 4.7 4.2 0.5 0.1 0.0 0.1 5.5 5.7 -0.2 4.4 4.5 -0.1 1.6 4.1 -2.5 1.9 1.8 0.1 4.4 4.3 0.1 2.3 1.9 0.4 *Weighted Avg. Price excludes interest-only (I/O) positions RMBS • The Fund’s NA CMO allocation remains north of 60% to start 2017 with an average dollar price of approximately $81. Spread duration increased for the RMBS strategy as the Fund targets bonds with rising voluntary prepayment speed potential. • The legacy NA RMBS market in 2017 could continue to benefit from strong fundamental tailwinds of the broad-based housing market recovery, improving credit performance (decreasing LTVs and delinquency rates), historically low mortgage rates, and favorable supply/demand technicals. • The outstanding NA RMBS market is approximately $700 billion.
New NA RMBS issuance is expected to be approximately $62 billion in 2017 [Source: Morgan Stanley], resulting in negative net new issuance of approximately $43 billion. While we expect the market to shrink in 2017, the NA RMBS market is re-emerging, and we expect 2018 will most likely be the first year of positive net supply in the NA RMBS market. CMBS • The Fund’s allocation to CMBS decreased marginally in the third quarter. We believe well-diversified investment-grade tranches of NA CMBS offer compelling relative value in 2017 and are poised to tighten back to historical averages on the heels of a strengthening economy.
From a performance perspective, if spreads on NA CMBS retrace half of their widening from 2014 levels, this asset class could deliver attractive total returns over the next year. The Fund continues to remain overweight conduit CMBS 2.0 and underweight legacy CMBS deals. • Unlike those of other credit sensitive assets in the second half of 2016, CMBS spreads remained stubbornly wide until the Trump election victory, when the increase in the 10-year Treasury yield brought in yield buyers. This additional sponsorship resulted in spreads tightening in the fourth quarter and could be a favorable tailwind for the start of 2017. CLOs • The Fund increased the allocation to CLOs in the fourth quarter as spread performance underperformed HY corporate credit. • Valuations on some tranches of CLOs (relative to corporates) are back to levels not seen since early 2015.
Spread duration was increased in the Fund given the relative attractiveness for near-term spread tightening for the sector. Furthermore, three-month LIBOR currently sits at approximately 1%, and the potential for further Fed hikes in 2017 will continue to generate demand for floating rate assets. As a result, we believe there is an opportunity for positive relative outperformance compared with U.S. corporate bonds as high yield has already experienced significant spread tightening and has limited ability to absorb rate increases via further tightening. Angel Oak Capital Advisors, LLC 7 .
Definitions Definitions: RMBS: Residential mortgage-backed security. CMBS: Commercial mortgage-backed security. CLO: Collateralized loan obligation. ABS: Asset-backed securities. Bloomberg Barclays U.S. Aggregate Bond Index: An unmanaged index that measures the performance of the investment-grade universe of bonds issued in the United States. The index includes institutionally traded U.S. Treasury, government sponsored, mortgage and corporate securities. Citi IG Bond Index Bond: An index that tracks the performance of U.S.
Dollar-denominated bonds issued in the U.S. investment-grade bond market. Citi HY Bond Index Bond: A U.S. dollar-denominated index which measures the performance of high-yield debt issued by corporations domiciled in the U.S. or Canada. Correlation: A statistical measure of how two securities move in relation to another.
Index used for comparison is the Barclays Aggregate Bond Index. Effective Duration: Measures a portfolio’s sensitivity to changes in interest rates. Generally, the longer the effective duration, the greater the price change relative to interest rate movements. LIBOR: A benchmark rate that some of the world's leading banks charge each other for short-term loans. It stands for Intercontinental Exchange London Interbank Offered Rate and serves as the first step to calculating interest rates on various loans throughout the world. S&P 500 Total Return Index: An American stock market index based on the market capitalizations of 500 large companies having common stock listed on the NYSE or NASDAQ. S&P Leveraged Loan 100 Index: A capitalization-weighted syndicated loan index based upon market weightings, spreads and interest payments. Sharpe Ratio: A statistical measure that uses standard deviation and excess return to determine reward per unit of risk.
A higher Sharpe ratio implies a better historical risk-adjusted performance. The Sharpe ratio has been calculated since inception using the 3-month Treasury bill for the risk-free rate of return. Standard Deviation: A statistical measure of portfolio risk used to measure variability of total return around an average, over a specified period of time. The greater the standard deviation over the period, the wider the variability or range of returns and hence, the greater the fund’s volatility. The standard deviation has been calculated since inception. Angel Oak Capital Advisors, LLC 8 .
. . . . . . . . .
1The inception date of the Angel Oak Multi-Strategy Income Fund A Class (ANGLX) was June 28, 2011, while the inception date of the Institutional Class (ANGIX) was August 16, 2012. The returns of ANGIX shown for periods prior to the inception date include the returns of ANGLX and are adjusted to reflect the operating expenses of ANGIX. 2Maximum Offering Price takes into account the 2.25% maximum initial sales charge. Mutual fund investing involves risk. Principal loss is possible.
Investments in debt securities typically decrease when interest rates rise. This risk is usually greater for longer-term debt securities. Investments in lower-rated and non-rated securities present a greater risk of loss to principal and interest than higher-rated securities.
Investments in asset-backed and mortgage-backed securities include additional risks that investors should be aware of, including credit risk, prepayment risk, possible illiquidity and default, as well as increased susceptibility to adverse economic developments. Derivatives involve risks different from and, in certain cases, greater than the risks presented by more traditional investments. Derivatives may involve certain costs and risks such as illiquidity, interest rate, market, credit, management and the risk that a position could not be closed when most advantageous.
Investing in derivatives could result in losing more than the amount invested. The Fund may make short sales of securities, which involves the risk that losses may exceed the original amount invested. The fund’s investment objectives, risks, charges and expenses must be considered carefully before investing. The statutory prospectus and summary prospectus contain this and other important information about the investment company, and may be obtained by calling 855-751-4324 or visiting www.angeloakcapital.com. Read them carefully before investing. © 2016 Angel Oak Capital Advisors, which is the advisor to the Angel Oak Funds.
Distributed by Quasar Distributors, LLC (Member FINRA.) It is not possible to invest directly in an index. Angel Oak Capital Advisors, LLC 2 . Year in Review Angel Oak Capital Advisors, LLC 12/31/2016 12/31/2015 YoY Change (bps) 0.77 1.00 1.19 1.93 2.44 3.07 1.25 1.88 4,279 124 445 Benchmark Performance 0.43 0.61 1.07 1.79 2.29 3.03 1.22 1.96 3,822 164 740 +34 +39 +12 +14 +15 +4 +3 -8 +1,196 -40 -295 1-Month LIBOR 3-Month LIBOR 2-Year Treasury 5-Year Treasury 10-Year Treasury 30-Year Treasury 2s/10s Curve 2s/30s Curve S&P 500 Total Return Index Citi IG Bond Index Bond OAS Citi HY Bond Index Bond OAS Source: Bloomberg and Yieldbook as of 12/31/16 CREDIT INDEX PERFORMANCE 240 220 High Yield (RA)* 200 900 800 180 700 160 600 140 Dec-16 Nov-16 Oct-16 Sep-16 Jul-16 Aug-16 Jun-16 Apr-16 May-16 Feb-16 Mar-16 Jan-16 Dec-15 Oct-15 Nov-15 Sep-15 400 Jul-15 100 Aug-15 500 Jun-15 120 May-15 Basis Points 1000 Investment Grade (LA)* Source: Citigroup as of 12/31/16 *Investment Grade Index Name: Citi U.S. Broad Investment-Grade Bond Index. High Yield Index Name: Citi High Yield Market Index 3 Basis Points Tale of Two Halves • U.S. risk-free rates were 3-15 bps higher across the curve last year, and the 2s/10s curve was 3 bps steeper.
The S&P total return was up 11.96%, the HY total return index was up 17.13%, and the Bloomberg Agg was up 2.65%. • 2016 was a tale of two halves and two completely unexpected election results. The first half was driven by worries of a corporate credit default cycle led by commodity-related credits, fears of a U.S. recession, and a Chinese currency devaluation, all of which led to a major risk-off environment. Equities and other risk assets were off to a tumultuous start in 2016.
The S&P total return index was down as much as 10.27% as of February 11, marking the worst start of all time. • Risk assets began to recover by the summer, but the Brexit vote surprised all market participants and some feared the worst. The bid for risk-free assets surged on the heels of Brexit, with the 10-year note closing at a 1.37% yield on July 8, the lowest in its history. “Lower for longer” seemed here to stay, although oddly Brexit was actually the catalyst for risk-on trades in the second half of 2016.
The economic data began to improve in the U.S., recession worries began to subside, equities began to rise, commodities recovered, credit spreads began to tighten, and risk-free rates began to rise off postBrexit lows. • “Lower for longer” was still the widely held expectation in the U.S. prior to the November election, but the Trump victory changed everything heading into year-end. Inflation and growth expectations completely changed, and the risk-free term structure repriced accordingly. We believe reflationary macro trends will continue in earnest in 2017, buoyed by the rekindling of animal spirits thanks to the surprise Trump victory.
The election outcome is expected to pour gas on the Federal Open Market Committee (FOMC) inflation fire smoldering throughout the post-crisis period, through greater fiscal expansion, tax cuts, and deregulation-driven credit expansion. It is still too early to predict what effect a Trump administration will have, but expectations are for higher-than-expected inflation and growth in 2017. . Fundamental Backdrop Legacy Non-Agency RMBS VPR vs. LTV 10% 31 29 7% 6% 19 21 Source: Bloomberg as of 12/31/16 Cap Rate (LA) S&P Leveraged Loan 100 Index Spread (bps, RA) Avg (bps, RA) 110 600 500 300 200 100 Basis Points 400 90 100 Source: RCA, Morgan Stanley Research as of 12/31/16 Angel Oak Capital Advisors, LLC Nov-16 Nov-15 Nov-14 Nov-13 Nov-12 Nov-11 Nov-10 Nov-09 Nov-08 Nov-07 Nov-06 Nov-05 Nov-04 Nov-03 Nov-02 Nov-01 0 80 Source: Bloomberg as of 12/31/16 4 Nov-16 Jul-16 Mar-16 Jul-15 Nov-15 Mar-15 Jul-14 Nov-14 Mar-14 Jul-13 Nov-13 Nov-12 Mar-13 Jul-12 Nov-11 Mar-12 Source: Bloomberg as of 12/31/16 U.S. Cap Rates, All Property Types 10yr UST (LA) Jul-11 15 Mar-11 17 4% Nov-10 60% 23 5% 70% 10.0% 9.0% 8.0% 7.0% 6.0% 5.0% 4.0% 3.0% 2.0% 1.0% 0.0% 27 25 Jul-10 80% % 8% 90% Mar-10 100% 33 9% Jul-09 12M Voluntary Prepayment Rate (RA) Nov-09 Housing Price Index Loan-to-Value (LA) Mar-09 110% Non-Agency Loans 60+ Days Delinquent 35 . Portfolio Performance Summary • The Fund was up 4.28% in 2016, outperforming the benchmark by over 160 bps as the Bloomberg Barclays U.S. Aggregate Bond Index was up 2.65%. The Fund outperformed the benchmark over the trailing three-month period by 491 bps as structured credit outpaced duration strategies in the face of rising interest rates and a steepening yield curve. FUND INFORMATION AS OF 12/31/16 Class A Class I Gross Expense Ratio 1.41% 1.19% • Credit strategies benefited the Fund relative to the benchmark in 2016, as the total returns of NA RMBS and CLOs were up approximately 7.5% and 6.7%, respectively. Net Expense Ratio^ 1.24% 0.99% SEC Yield (Subsidized) 4.97% 5.34% • Duration and credit strategies benefited the Fund relative to the benchmark. Duration positioning short of the index was a positive contributor to relative performance in 2016 as well as Q4. SEC Yield (Unsubsidized) 5.02% 5.38% FUND CHARACTERISTICS Fund Assets (All Classes) $4.4 bn Number of Securities Annualized Net Total Returns as of 12/31/16 Class I Class A at NAV Class A at MOP* Bloomberg Barclays U.S.
Agg. Bond Index 1 Mo. 3 Mo. YTD 1 Yr. 3 Yr. 5 Yr. SI1 0.79 0.76 -1.53 0.14 1.93 1.82 -0.48 -2.98 4.28 4.08 1.78 2.65 4.28 4.08 1.78 2.65 4.03 3.76 2.96 3.03 7.54 7.32 6.84 2.23 8.09 7.89 7.44 2.89 Distribution 878 Monthly Effective Duration 2.3 Average Price (Portfolio) $86.9 Average Price (NA RMBS) $81.1 Angel Oak Capital Advisors, LLC 63.9 FUND STATISTICS (Since Inception) Current performance may be lower or higher than performance data quoted. Performance quoted is past performance and is no guarantee of future results.
The investment return and principal value of an investment in the Fund will fluctuate so that an investor’s shares, when redeemed, may be worth more or less than their original cost. Current performance to the most recent month-end can be obtained by calling 855-751-4324. 1The inception date of the Angel Oak Multi-Strategy Income Fund A Class (ANGLX) was June 28, 2011, while the inception date of the Institutional Class (ANGIX) was August 16, 2012.
The returns of ANGIX shown for periods prior to the inception date include the returns of ANGLX and are adjusted to reflect the operating expenses of ANGIX. *Maximum Offering Price takes into account the 2.25% maximum initial sales charge. Floating Rate (%) Fund2 Index Standard Deviation 3.7 3.9 Sharpe Ratio 3.2 1.0 Correlation to Index 0.1 1.0 Positive Months (%) 80.3 63.6 Negative Months (%) 19.7 36.4 2ANGIX ^The Adviser has contractually agreed to waive fees through May 31, 2017. 5 . Sector Attribution % of Market Value Q4 2016* Attribution (%) RMBS 60.1 1.50 YTD* Attribution (%) 4.82 CMBS 13.9 -0.27 0.51 CLOs 10.8 0.28 0.30 Corporates 6.5 0.07 0.53 ABS 4.9 0.16 Cash 3.8 0.00 0.01 0.01 - 0.57 -0.99 100.0 -0.23 1.93 -1.09 4.25 Hedges Fund Expenses Total *Net and unaudited RMBS • NA CMO prices increased in 2016 and the fourth quarter, leading to a total return of approximately 2.5% for the asset class in Q4. Current income has benefited from a rise in LIBOR rates, increasing bond interest and the boost to yield from rising voluntary prepayment speeds. RMBS was the primary contributor to Fund performance in 2016 in addition to having the highest absolute performance on a risk-adjusted (and unadjusted) basis. • Increased refinance activity and housing turnover are Illustrated by the increased voluntary prepayment rate (VPR) of our legacy holdings. Voluntary prepayment rate speeds for the current holdings have increased approximately 40% over the past 24 months and approximately 100% since 2013 levels. CMBS • CMBS experienced high spread volatility in 2016, which resulted in the sector underperforming the broader fixed income market.
For example, CMBS conduit 3.0 BBB- bonds finished the year with an approximately -1% total return [Source: GS Economics Research]. For the Fund, CMBS spreads widened in 2016, detracting from Fund performance net of interest rate hedges. The asset class was up approximately 3.5% total return before interest rate hedges. • Headline risks only increased in 2016, yet may foreshadow excess opportunities for 2017.
Headwinds included the negative implications of e-commerce for the bricks-and-mortar retail sector and the upcoming maturity of approximately $228 billion of 2007 CMBS originations. As a result, investors demanded higher risk premiums for deals that exhibited less favorable credit characteristics. CLOs • CLO spreads tightened in Q4 and in 2016. CLOs were up approximately 2.7% in Q4 and were the best performer for the quarter.
For 2016, CLOs were up approximately 6.7% as prices sharply recovered following steep widening in the first quarter. The decision to maintain a significant allocation to CLOs following this year’s initial price volatility was a benefit to Fund performance. Since the beginning of Q2, CLO prices were up approximately 15.5% in the Fund. Angel Oak Capital Advisors, LLC 6 .
Sector Exposure Weighted Avg. Price RMBS* CMBS CLOs Corporates ABS Cash Total 81.1 92.0 98.6 101.2 99.3 86.9 % of Market Value 12/31/2016 60.1 13.9 10.8 6.5 4.9 3.8 100.0 9/30/2016 60.1 14.5 9.6 6.7 1.1 8.0 100.0 % Change 0.0 -0.6 1.2 -0.2 3.8 -4.2 - Spread Duration in % Change Rate Duration in Years % Change Years 12/31/2016 9/30/2016 12/31/2016 9/30/2016 4.6 4.2 0.4 2.9 2.6 0.3 3.8 4.0 -0.2 0.6 0.7 -0.1 4.7 4.2 0.5 0.1 0.0 0.1 5.5 5.7 -0.2 4.4 4.5 -0.1 1.6 4.1 -2.5 1.9 1.8 0.1 4.4 4.3 0.1 2.3 1.9 0.4 *Weighted Avg. Price excludes interest-only (I/O) positions RMBS • The Fund’s NA CMO allocation remains north of 60% to start 2017 with an average dollar price of approximately $81. Spread duration increased for the RMBS strategy as the Fund targets bonds with rising voluntary prepayment speed potential. • The legacy NA RMBS market in 2017 could continue to benefit from strong fundamental tailwinds of the broad-based housing market recovery, improving credit performance (decreasing LTVs and delinquency rates), historically low mortgage rates, and favorable supply/demand technicals. • The outstanding NA RMBS market is approximately $700 billion.
New NA RMBS issuance is expected to be approximately $62 billion in 2017 [Source: Morgan Stanley], resulting in negative net new issuance of approximately $43 billion. While we expect the market to shrink in 2017, the NA RMBS market is re-emerging, and we expect 2018 will most likely be the first year of positive net supply in the NA RMBS market. CMBS • The Fund’s allocation to CMBS decreased marginally in the third quarter. We believe well-diversified investment-grade tranches of NA CMBS offer compelling relative value in 2017 and are poised to tighten back to historical averages on the heels of a strengthening economy.
From a performance perspective, if spreads on NA CMBS retrace half of their widening from 2014 levels, this asset class could deliver attractive total returns over the next year. The Fund continues to remain overweight conduit CMBS 2.0 and underweight legacy CMBS deals. • Unlike those of other credit sensitive assets in the second half of 2016, CMBS spreads remained stubbornly wide until the Trump election victory, when the increase in the 10-year Treasury yield brought in yield buyers. This additional sponsorship resulted in spreads tightening in the fourth quarter and could be a favorable tailwind for the start of 2017. CLOs • The Fund increased the allocation to CLOs in the fourth quarter as spread performance underperformed HY corporate credit. • Valuations on some tranches of CLOs (relative to corporates) are back to levels not seen since early 2015.
Spread duration was increased in the Fund given the relative attractiveness for near-term spread tightening for the sector. Furthermore, three-month LIBOR currently sits at approximately 1%, and the potential for further Fed hikes in 2017 will continue to generate demand for floating rate assets. As a result, we believe there is an opportunity for positive relative outperformance compared with U.S. corporate bonds as high yield has already experienced significant spread tightening and has limited ability to absorb rate increases via further tightening. Angel Oak Capital Advisors, LLC 7 .
Definitions Definitions: RMBS: Residential mortgage-backed security. CMBS: Commercial mortgage-backed security. CLO: Collateralized loan obligation. ABS: Asset-backed securities. Bloomberg Barclays U.S. Aggregate Bond Index: An unmanaged index that measures the performance of the investment-grade universe of bonds issued in the United States. The index includes institutionally traded U.S. Treasury, government sponsored, mortgage and corporate securities. Citi IG Bond Index Bond: An index that tracks the performance of U.S.
Dollar-denominated bonds issued in the U.S. investment-grade bond market. Citi HY Bond Index Bond: A U.S. dollar-denominated index which measures the performance of high-yield debt issued by corporations domiciled in the U.S. or Canada. Correlation: A statistical measure of how two securities move in relation to another.
Index used for comparison is the Barclays Aggregate Bond Index. Effective Duration: Measures a portfolio’s sensitivity to changes in interest rates. Generally, the longer the effective duration, the greater the price change relative to interest rate movements. LIBOR: A benchmark rate that some of the world's leading banks charge each other for short-term loans. It stands for Intercontinental Exchange London Interbank Offered Rate and serves as the first step to calculating interest rates on various loans throughout the world. S&P 500 Total Return Index: An American stock market index based on the market capitalizations of 500 large companies having common stock listed on the NYSE or NASDAQ. S&P Leveraged Loan 100 Index: A capitalization-weighted syndicated loan index based upon market weightings, spreads and interest payments. Sharpe Ratio: A statistical measure that uses standard deviation and excess return to determine reward per unit of risk.
A higher Sharpe ratio implies a better historical risk-adjusted performance. The Sharpe ratio has been calculated since inception using the 3-month Treasury bill for the risk-free rate of return. Standard Deviation: A statistical measure of portfolio risk used to measure variability of total return around an average, over a specified period of time. The greater the standard deviation over the period, the wider the variability or range of returns and hence, the greater the fund’s volatility. The standard deviation has been calculated since inception. Angel Oak Capital Advisors, LLC 8 .
. . . . . . . . .


