Angel Oak High Yield Opportunities Fund Year-End Review - December 31, 2016
Angel Oak Capital Advisors


Description
Angel Oak
Capital Advisors, LLC
Angel Oak High Yield Opportunities Fund
Year-End Review
December 31, 2016
. Quarter in Review
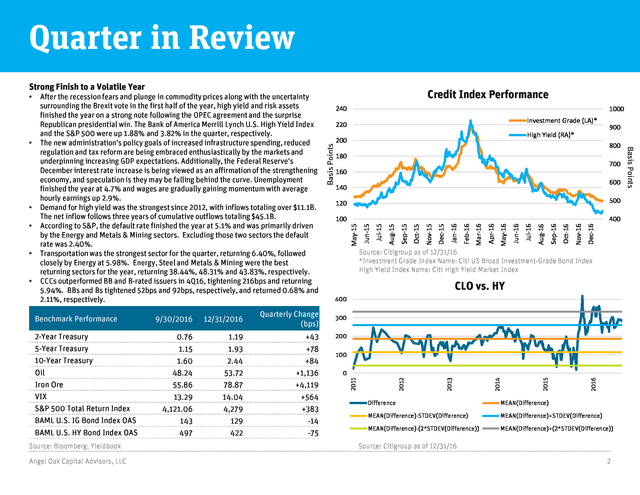
Strong Finish to a Volatile Year
Source: Bloomberg, Yieldbook
Angel Oak Capital Advisors, LLC
Quarterly Change
(bps)
0.76
1.15
1.60
48.24
55.86
13.29
4,121.06
143
497
1.19
1.93
2.44
53.72
78.87
14.04
4,279
129
422
+43
+78
+84
+1,136
+4,119
+564
+383
-14
-75
700
160
600
140
Dec-16
Nov-16
Oct-16
Sep-16
Aug-16
Jul-16
Jun-16
May-16
Apr-16
Feb-16
Mar-16
Jan-16
Dec-15
Nov-15
Oct-15
Sep-15
400
Aug-15
100
Jul-15
500
Jun-15
120
Source: Citigroup as of 12/31/16
*Investment Grade Index Name: Citi US Broad Investment-Grade Bond Index
High Yield Index Name: Citi High Yield Market Index
CLO vs. HY
400
300
200
100
0
2016
12/31/2016
900
800
180
2015
2-Year Treasury
5-Year Treasury
10-Year Treasury
Oil
Iron Ore
VIX
S&P 500 Total Return Index
BAML U.S. IG Bond Index OAS
BAML U.S. HY Bond Index OAS
9/30/2016
200
2014
Benchmark Performance
High Yield (RA)*
2013
•
220
2012
•
1000
Investment Grade (LA)*
May-15
•
240
2011
•
Credit Index Performance
Difference
MEAN(Difference)
MEAN(Difference)-STDEV(Difference)
MEAN(Difference)+STDEV(Difference)
MEAN(Difference)-(2*STDEV(Difference))
MEAN(Difference)+(2*STDEV(Difference))
Source: Citigroup as of 12/31/16
2
Basis Points
•
After the recession fears and plunge in commodity prices along with the uncertainty
surrounding the Brexit vote in the first half of the year, high yield and risk assets
finished the year on a strong note following the OPEC agreement and the surprise
Republican presidential win.
The Bank of America Merrill Lynch U.S. High Yield Index and the S&P 500 were up 1.88% and 3.82% in the quarter, respectively. The new administration’s policy goals of increased infrastructure spending, reduced regulation and tax reform are being embraced enthusiastically by the markets and underpinning increasing GDP expectations. Additionally, the Federal Reserve’s December interest rate increase is being viewed as an affirmation of the strengthening economy, and speculation is they may be falling behind the curve.
Unemployment finished the year at 4.7% and wages are gradually gaining momentum with average hourly earnings up 2.9%. Demand for high yield was the strongest since 2012, with inflows totaling over $11.1B. The net inflow follows three years of cumulative outflows totaling $45.1B. According to S&P, the default rate finished the year at 5.1% and was primarily driven by the Energy and Metals & Mining sectors. Excluding those two sectors the default rate was 2.40%. Transportation was the strongest sector for the quarter, returning 6.40%, followed closely by Energy at 5.98%. Energy, Steel and Metals & Mining were the best returning sectors for the year, returning 38.44%, 48.31% and 43.83%, respectively. CCCs outperformed BB and B-rated issuers in 4Q16, tightening 216bps and returning 5.94%.
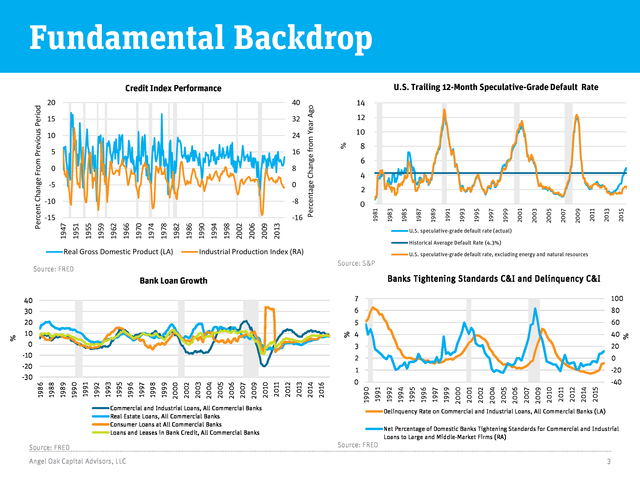
BBs and Bs tightened 52bps and 92bps, respectively, and returned 0.68% and 2.11%, respectively. Basis Points • . Fundamental Backdrop U.S. Trailing 12-Month Speculative-Grade Default Rate Real Gross Domestic Product (LA) Percentage Change from Year Ago 14 12 10 % 8 6 4 2015 2013 2011 2009 2007 2005 2003 2001 1999 1997 1995 1993 1991 1989 1987 1985 1983 0 1981 2 2013 2009 -16 2006 -15 2002 -8 1998 -10 1994 0 1990 -5 1986 8 1982 0 1978 16 1974 5 1970 24 1966 10 1962 32 1959 15 1955 40 1951 20 1947 Percent Change From Previous Period Credit Index Performance U.S. speculative-grade default rate (actual) Historical Average Default Rate (4.3%) Industrial Production Index (RA) U.S. speculative-grade default rate, excluding energy and natural resources Source: S&P Source: FRED Banks Tightening Standards C&I and Delinquency C&I Bank Loan Growth Source: FRED Angel Oak Capital Advisors, LLC 2015 2014 2011 2012 2010 2009 2007 1990 2016 2013 2014 2011 2012 2010 2009 2007 2006 2005 2004 2003 2002 1999 2000 1998 1997 1996 1995 1993 1992 1991 1989 1990 1988 1986 Commercial and Industrial Loans, All Commercial Banks Real Estate Loans, All Commercial Banks Consumer Loans at All Commercial Banks Loans and Leases in Bank Credit, All Commercial Banks 2006 Delinquency Rate on Commercial and Industrial Loans, All Commercial Banks (LA) Source: FRED Net Percentage of Domestic Banks Tightening Standards for Commercial and Industrial Loans to Large and Middle-Market Firms (RA) 3 % -40 2005 -20 2004 1 0 -30 2002 0 2001 2 -20 2000 20 -10 1999 40 3 1997 4 0 1996 60 1995 5 10 1992 20 1994 80 1991 100 6 % 7 30 % 40 .
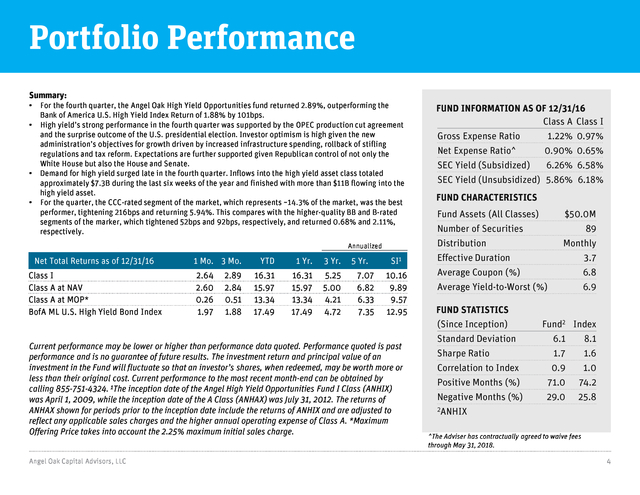
Portfolio Performance Summary: • • • • For the fourth quarter, the Angel Oak High Yield Opportunities fund returned 2.89%, outperforming the Bank of America U.S. High Yield Index Return of 1.88% by 101bps. High yield’s strong performance in the fourth quarter was supported by the OPEC production cut agreement and the surprise outcome of the U.S. presidential election. Investor optimism is high given the new administration’s objectives for growth driven by increased infrastructure spending, rollback of stifling regulations and tax reform.
Expectations are further supported given Republican control of not only the White House but also the House and Senate. Demand for high yield surged late in the fourth quarter. Inflows into the high yield asset class totaled approximately $7.3B during the last six weeks of the year and finished with more than $11B flowing into the high yield asset. For the quarter, the CCC-rated segment of the market, which represents ~14.3% of the market, was the best performer, tightening 216bps and returning 5.94%. This compares with the higher-quality BB and B-rated segments of the marker, which tightened 52bps and 92bps, respectively, and returned 0.68% and 2.11%, respectively. Annualized Net Total Returns as of 12/31/16 Class I Class A at NAV Class A at MOP* BofA ML U.S.
High Yield Bond Index 1 Mo. 3 Mo. 2.64 2.60 0.26 1.97 2.89 2.84 0.51 1.88 YTD 1 Yr. 3 Yr. 16.31 15.97 13.34 17.49 16.31 15.97 13.34 17.49 5.25 5.00 4.21 4.72 5 Yr. 7.07 6.82 6.33 7.35 SI1 10.16 9.89 9.57 12.95 Current performance may be lower or higher than performance data quoted. Performance quoted is past performance and is no guarantee of future results.
The investment return and principal value of an investment in the Fund will fluctuate so that an investor’s shares, when redeemed, may be worth more or less than their original cost. Current performance to the most recent month-end can be obtained by calling 855-751-4324. 1The inception date of the Angel High Yield Opportunities Fund I Class (ANHIX) was April 1, 2009, while the inception date of the A Class (ANHAX) was July 31, 2012.
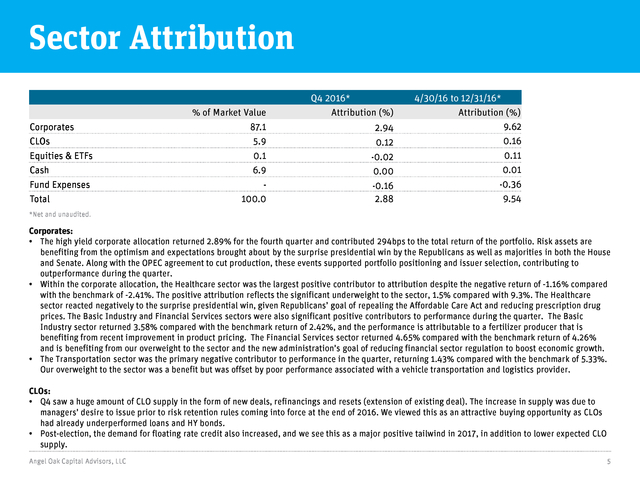
The returns of ANHAX shown for periods prior to the inception date include the returns of ANHIX and are adjusted to reflect any applicable sales charges and the higher annual operating expense of Class A. *Maximum Offering Price takes into account the 2.25% maximum initial sales charge. Angel Oak Capital Advisors, LLC FUND INFORMATION AS OF 12/31/16 Class A Class I Gross Expense Ratio 1.22% 0.97% Net Expense Ratio^ 0.90% 0.65% SEC Yield (Subsidized) 6.26% 6.58% SEC Yield (Unsubsidized) 5.86% 6.18% FUND CHARACTERISTICS Fund Assets (All Classes) Number of Securities Distribution Effective Duration Average Coupon (%) Average Yield-to-Worst (%) FUND STATISTICS (Since Inception) Standard Deviation Sharpe Ratio Correlation to Index Positive Months (%) Negative Months (%) 2ANHIX $50.0M 89 Monthly 3.7 6.8 6.9 Fund2 Index 6.1 8.1 1.7 1.6 0.9 1.0 71.0 74.2 29.0 25.8 ^The Adviser has contractually agreed to waive fees through May 31, 2018. 4 . Sector Attribution Corporates CLOs Equities & ETFs Cash Fund Expenses Total % of Market Value 87.1 5.9 0.1 6.9 100.0 Q4 2016* Attribution (%) 2.94 0.12 -0.02 0.00 -0.16 2.88 4/30/16 to 12/31/16* Attribution (%) 9.62 0.16 0.11 0.01 -0.36 9.54 *Net and unaudited. Corporates: • The high yield corporate allocation returned 2.89% for the fourth quarter and contributed 294bps to the total return of the portfolio. Risk assets are benefiting from the optimism and expectations brought about by the surprise presidential win by the Republicans as well as majorities in both the House and Senate. Along with the OPEC agreement to cut production, these events supported portfolio positioning and issuer selection, contributing to outperformance during the quarter. • Within the corporate allocation, the Healthcare sector was the largest positive contributor to attribution despite the negative return of -1.16% compared with the benchmark of -2.41%. The positive attribution reflects the significant underweight to the sector, 1.5% compared with 9.3%.
The Healthcare sector reacted negatively to the surprise presidential win, given Republicans’ goal of repealing the Affordable Care Act and reducing prescription drug prices. The Basic Industry and Financial Services sectors were also significant positive contributors to performance during the quarter. The Basic Industry sector returned 3.58% compared with the benchmark return of 2.42%, and the performance is attributable to a fertilizer producer that is benefiting from recent improvement in product pricing.
The Financial Services sector returned 4.65% compared with the benchmark return of 4.26% and is benefiting from our overweight to the sector and the new administration’s goal of reducing financial sector regulation to boost economic growth. • The Transportation sector was the primary negative contributor to performance in the quarter, returning 1.43% compared with the benchmark of 5.33%. Our overweight to the sector was a benefit but was offset by poor performance associated with a vehicle transportation and logistics provider. CLOs: • Q4 saw a huge amount of CLO supply in the form of new deals, refinancings and resets (extension of existing deal). The increase in supply was due to managers’ desire to issue prior to risk retention rules coming into force at the end of 2016. We viewed this as an attractive buying opportunity as CLOs had already underperformed loans and HY bonds. • Post-election, the demand for floating rate credit also increased, and we see this as a major positive tailwind in 2017, in addition to lower expected CLO supply. Angel Oak Capital Advisors, LLC 5 .
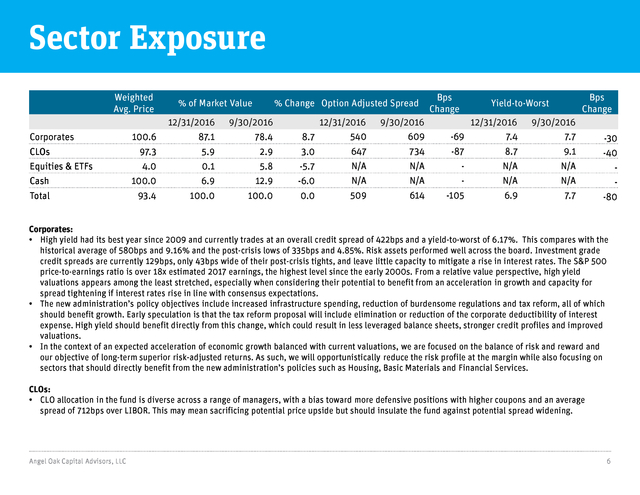
Sector Exposure Weighted Avg. Price % of Market Value % Change Option Adjusted Spread 12/31/2016 9/30/2016 100.6 87.1 78.4 CLOs 97.3 5.9 Equities & ETFs 4.0 Cash Total Corporates Bps Change Bps Change Yield-to-Worst 9/30/2016 609 2.9 12/31/2016 540 8.7 647 3.0 12/31/2016 -69 7.4 9/30/2016 7.7 -30 734 -87 8.7 9.1 -40 0.1 5.8 -5.7 N/A N/A - N/A N/A - 100.0 6.9 12.9 -6.0 N/A N/A - N/A N/A - 93.4 100.0 100.0 0.0 509 614 -105 6.9 7.7 -80 Corporates: • High yield had its best year since 2009 and currently trades at an overall credit spread of 422bps and a yield-to-worst of 6.17%. This compares with the historical average of 580bps and 9.16% and the post-crisis lows of 335bps and 4.85%. Risk assets performed well across the board.
Investment grade credit spreads are currently 129bps, only 43bps wide of their post-crisis tights, and leave little capacity to mitigate a rise in interest rates. The S&P 500 price-to-earnings ratio is over 18x estimated 2017 earnings, the highest level since the early 2000s. From a relative value perspective, high yield valuations appears among the least stretched, especially when considering their potential to benefit from an acceleration in growth and capacity for spread tightening if interest rates rise in line with consensus expectations. • The new administration’s policy objectives include increased infrastructure spending, reduction of burdensome regulations and tax reform, all of which should benefit growth.
Early speculation is that the tax reform proposal will include elimination or reduction of the corporate deductibility of interest expense. High yield should benefit directly from this change, which could result in less leveraged balance sheets, stronger credit profiles and improved valuations. • In the context of an expected acceleration of economic growth balanced with current valuations, we are focused on the balance of risk and reward and our objective of long-term superior risk-adjusted returns. As such, we will opportunistically reduce the risk profile at the margin while also focusing on sectors that should directly benefit from the new administration’s policies such as Housing, Basic Materials and Financial Services. CLOs: • CLO allocation in the fund is diverse across a range of managers, with a bias toward more defensive positions with higher coupons and an average spread of 712bps over LIBOR.
This may mean sacrificing potential price upside but should insulate the fund against potential spread widening. Angel Oak Capital Advisors, LLC 6 . Disclaimers Definitions and Disclosures: CLOs: Collateralized loan obligation. Average Coupon: Equal to the total interest payments of an issue divided by bond year dollars. Average Yield-to-Worst: The lowest potential yield that can be received on a bond without the issuer actually defaulting. Basis Points (bps): One hundredth of one percent and is used to denote the percentage change in a financial instrument. Bank of America Merrill Lynch (BAML) U.S. IG Bond Index: The BofA Merrill Lynch U.S. Corporate Index tracks the performance of U.S. dollar denominated investment grade corporate debt publicly issued in the U.S.
domestic market. Qualifying securities must have an investment grade rating (based on an average of Moody’s, S&P and Fitch), at least 18 months to final maturity at the time of issuance, at least one year remaining term to final maturity as of the rebalancing date, a fixed coupon schedule and a minimum amount outstanding of $250 million. Bank of America Merrill Lynch (BAML) U.S. High Yield Index: Tracks the performance of below investment grade, but not in default, U.S.
dollar denominated corporate bonds publicly issued in the U.S. domestic market, and includes issues with a credit rating of BBB or below, as rated by Moody’s and S&P. Citi U.S. Broad Investment Grade Bond Index: An index that tracks the performance of U.S.
Dollar-denominated bonds issued in the U.S. investment-grade bond market. Citi High Yield Market Index: A U.S. Dollar-denominated index which measures the performance of high-yield debt issued by corporations domiciled in the U.S. or Canada. Correlation: A statistical measure of how two securities move in relation to another.
Index used for comparison is the BofA Merrill Lynch U.S. High Yield Index. Effective Duration: Measures a portfolio’s sensitivity to changes in interest rates. Generally, the longer the effective duration, the greater the price change relative to interest rate movements. Free Cash Flow (FCF): A measure of a company’s financial performance, calculated as operating cash flow minus capital expenditures. FCF represents the cash that a company is able to generate after spending the money required to maintain or expand its asset base. Industrial Production Index (IPI): An economic indicator that is released monthly by the Federal Reserve Board.
The indicator measures the amount of output from the manufacturing, mining, electric and gas industries. LIBOR: A benchmark rate that some of the world's leading banks charge each other for short-term loans. It stands for Intercontinental Exchange London Interbank Offered Rate and serves as the first step to calculating interest rates on various loans throughout the world. Option-Adjusted Spread (OAS): The yield spread which has to be added to a benchmark yield curve to discount a security’s payments to match its market price, using a dynamic pricing model that accounts for embedded options. Price-to-Earnings Ratio (P/E Ratio): The ratio for valuing a company that measures its current share price relative to its per-share earnings. Angel Oak Capital Advisors, LLC 7 . Disclaimers S&P 500 Total Return Index: An American stock market index based on the market capitalizations of 500 large companies having common stock listed on the NYSE or NASDAQ. Sharpe Ratio: A statistical measure that uses standard deviation and excess return to determine reward per unit of risk. A higher Sharpe ratio implies a better historical risk-adjusted performance. The Sharpe ratio has been calculated since inception using the 3-month Treasury bill for the risk-free rate of return. Spread: The difference in yield between a U.S. Treasury bond and a debt security with the same maturity but of lesser quality. Standard Deviation: A statistical measure of portfolio risk used to measure variability of total return around an average, over a specified period of time.
The greater the standard deviation over the period, the wider the variability or range of returns and hence, the greater the fund’s volatility. The standard deviation has been calculated since inception. The CBOE Volatility Index (VIX): The VIX is a key measure of market expectations of near-term volatility conveyed by S&P 500 stock index options prices. Mutual fund investing involves risk. Principal loss is possible.
Investments in debt securities typically decrease when interest rates rise. This risk is usually greater for longer-term debt securities. Investments in lower-rated and non-rated securities present a greater risk of loss to principal and interest than higher-rated securities.
Investments in asset-backed and mortgage-backed securities include additional risks that investors should be aware of, including credit risk, prepayment risk, possible illiquidity and default, as well as increased susceptibility to adverse economic developments. Derivatives involve risks different from and, in certain cases, greater than the risks presented by more traditional investments. Derivatives may involve certain costs and risks such as illiquidity, interest rate, market, credit, management and the risk that a position could not be closed when most advantageous.
Investing in derivatives could result in losing more than the amount invested. The Fund may make short sales of securities, which involves the risk that losses may exceed the original amount invested. Must be preceded or accompanied by a current prospectus. To obtain an electronic copy of the prospectus, please visit www.angeloakcapital.com. © 2016 Angel Oak Capital Advisors, which is the advisor to the Angel Oak Funds. Distributed by Quasar Distributors, LLC (Member FINRA.) It is not possible to invest directly in an index. Angel Oak Capital Advisors, LLC 8 .
The Bank of America Merrill Lynch U.S. High Yield Index and the S&P 500 were up 1.88% and 3.82% in the quarter, respectively. The new administration’s policy goals of increased infrastructure spending, reduced regulation and tax reform are being embraced enthusiastically by the markets and underpinning increasing GDP expectations. Additionally, the Federal Reserve’s December interest rate increase is being viewed as an affirmation of the strengthening economy, and speculation is they may be falling behind the curve.
Unemployment finished the year at 4.7% and wages are gradually gaining momentum with average hourly earnings up 2.9%. Demand for high yield was the strongest since 2012, with inflows totaling over $11.1B. The net inflow follows three years of cumulative outflows totaling $45.1B. According to S&P, the default rate finished the year at 5.1% and was primarily driven by the Energy and Metals & Mining sectors. Excluding those two sectors the default rate was 2.40%. Transportation was the strongest sector for the quarter, returning 6.40%, followed closely by Energy at 5.98%. Energy, Steel and Metals & Mining were the best returning sectors for the year, returning 38.44%, 48.31% and 43.83%, respectively. CCCs outperformed BB and B-rated issuers in 4Q16, tightening 216bps and returning 5.94%.
BBs and Bs tightened 52bps and 92bps, respectively, and returned 0.68% and 2.11%, respectively. Basis Points • . Fundamental Backdrop U.S. Trailing 12-Month Speculative-Grade Default Rate Real Gross Domestic Product (LA) Percentage Change from Year Ago 14 12 10 % 8 6 4 2015 2013 2011 2009 2007 2005 2003 2001 1999 1997 1995 1993 1991 1989 1987 1985 1983 0 1981 2 2013 2009 -16 2006 -15 2002 -8 1998 -10 1994 0 1990 -5 1986 8 1982 0 1978 16 1974 5 1970 24 1966 10 1962 32 1959 15 1955 40 1951 20 1947 Percent Change From Previous Period Credit Index Performance U.S. speculative-grade default rate (actual) Historical Average Default Rate (4.3%) Industrial Production Index (RA) U.S. speculative-grade default rate, excluding energy and natural resources Source: S&P Source: FRED Banks Tightening Standards C&I and Delinquency C&I Bank Loan Growth Source: FRED Angel Oak Capital Advisors, LLC 2015 2014 2011 2012 2010 2009 2007 1990 2016 2013 2014 2011 2012 2010 2009 2007 2006 2005 2004 2003 2002 1999 2000 1998 1997 1996 1995 1993 1992 1991 1989 1990 1988 1986 Commercial and Industrial Loans, All Commercial Banks Real Estate Loans, All Commercial Banks Consumer Loans at All Commercial Banks Loans and Leases in Bank Credit, All Commercial Banks 2006 Delinquency Rate on Commercial and Industrial Loans, All Commercial Banks (LA) Source: FRED Net Percentage of Domestic Banks Tightening Standards for Commercial and Industrial Loans to Large and Middle-Market Firms (RA) 3 % -40 2005 -20 2004 1 0 -30 2002 0 2001 2 -20 2000 20 -10 1999 40 3 1997 4 0 1996 60 1995 5 10 1992 20 1994 80 1991 100 6 % 7 30 % 40 .
Portfolio Performance Summary: • • • • For the fourth quarter, the Angel Oak High Yield Opportunities fund returned 2.89%, outperforming the Bank of America U.S. High Yield Index Return of 1.88% by 101bps. High yield’s strong performance in the fourth quarter was supported by the OPEC production cut agreement and the surprise outcome of the U.S. presidential election. Investor optimism is high given the new administration’s objectives for growth driven by increased infrastructure spending, rollback of stifling regulations and tax reform.
Expectations are further supported given Republican control of not only the White House but also the House and Senate. Demand for high yield surged late in the fourth quarter. Inflows into the high yield asset class totaled approximately $7.3B during the last six weeks of the year and finished with more than $11B flowing into the high yield asset. For the quarter, the CCC-rated segment of the market, which represents ~14.3% of the market, was the best performer, tightening 216bps and returning 5.94%. This compares with the higher-quality BB and B-rated segments of the marker, which tightened 52bps and 92bps, respectively, and returned 0.68% and 2.11%, respectively. Annualized Net Total Returns as of 12/31/16 Class I Class A at NAV Class A at MOP* BofA ML U.S.
High Yield Bond Index 1 Mo. 3 Mo. 2.64 2.60 0.26 1.97 2.89 2.84 0.51 1.88 YTD 1 Yr. 3 Yr. 16.31 15.97 13.34 17.49 16.31 15.97 13.34 17.49 5.25 5.00 4.21 4.72 5 Yr. 7.07 6.82 6.33 7.35 SI1 10.16 9.89 9.57 12.95 Current performance may be lower or higher than performance data quoted. Performance quoted is past performance and is no guarantee of future results.
The investment return and principal value of an investment in the Fund will fluctuate so that an investor’s shares, when redeemed, may be worth more or less than their original cost. Current performance to the most recent month-end can be obtained by calling 855-751-4324. 1The inception date of the Angel High Yield Opportunities Fund I Class (ANHIX) was April 1, 2009, while the inception date of the A Class (ANHAX) was July 31, 2012.
The returns of ANHAX shown for periods prior to the inception date include the returns of ANHIX and are adjusted to reflect any applicable sales charges and the higher annual operating expense of Class A. *Maximum Offering Price takes into account the 2.25% maximum initial sales charge. Angel Oak Capital Advisors, LLC FUND INFORMATION AS OF 12/31/16 Class A Class I Gross Expense Ratio 1.22% 0.97% Net Expense Ratio^ 0.90% 0.65% SEC Yield (Subsidized) 6.26% 6.58% SEC Yield (Unsubsidized) 5.86% 6.18% FUND CHARACTERISTICS Fund Assets (All Classes) Number of Securities Distribution Effective Duration Average Coupon (%) Average Yield-to-Worst (%) FUND STATISTICS (Since Inception) Standard Deviation Sharpe Ratio Correlation to Index Positive Months (%) Negative Months (%) 2ANHIX $50.0M 89 Monthly 3.7 6.8 6.9 Fund2 Index 6.1 8.1 1.7 1.6 0.9 1.0 71.0 74.2 29.0 25.8 ^The Adviser has contractually agreed to waive fees through May 31, 2018. 4 . Sector Attribution Corporates CLOs Equities & ETFs Cash Fund Expenses Total % of Market Value 87.1 5.9 0.1 6.9 100.0 Q4 2016* Attribution (%) 2.94 0.12 -0.02 0.00 -0.16 2.88 4/30/16 to 12/31/16* Attribution (%) 9.62 0.16 0.11 0.01 -0.36 9.54 *Net and unaudited. Corporates: • The high yield corporate allocation returned 2.89% for the fourth quarter and contributed 294bps to the total return of the portfolio. Risk assets are benefiting from the optimism and expectations brought about by the surprise presidential win by the Republicans as well as majorities in both the House and Senate. Along with the OPEC agreement to cut production, these events supported portfolio positioning and issuer selection, contributing to outperformance during the quarter. • Within the corporate allocation, the Healthcare sector was the largest positive contributor to attribution despite the negative return of -1.16% compared with the benchmark of -2.41%. The positive attribution reflects the significant underweight to the sector, 1.5% compared with 9.3%.
The Healthcare sector reacted negatively to the surprise presidential win, given Republicans’ goal of repealing the Affordable Care Act and reducing prescription drug prices. The Basic Industry and Financial Services sectors were also significant positive contributors to performance during the quarter. The Basic Industry sector returned 3.58% compared with the benchmark return of 2.42%, and the performance is attributable to a fertilizer producer that is benefiting from recent improvement in product pricing.
The Financial Services sector returned 4.65% compared with the benchmark return of 4.26% and is benefiting from our overweight to the sector and the new administration’s goal of reducing financial sector regulation to boost economic growth. • The Transportation sector was the primary negative contributor to performance in the quarter, returning 1.43% compared with the benchmark of 5.33%. Our overweight to the sector was a benefit but was offset by poor performance associated with a vehicle transportation and logistics provider. CLOs: • Q4 saw a huge amount of CLO supply in the form of new deals, refinancings and resets (extension of existing deal). The increase in supply was due to managers’ desire to issue prior to risk retention rules coming into force at the end of 2016. We viewed this as an attractive buying opportunity as CLOs had already underperformed loans and HY bonds. • Post-election, the demand for floating rate credit also increased, and we see this as a major positive tailwind in 2017, in addition to lower expected CLO supply. Angel Oak Capital Advisors, LLC 5 .
Sector Exposure Weighted Avg. Price % of Market Value % Change Option Adjusted Spread 12/31/2016 9/30/2016 100.6 87.1 78.4 CLOs 97.3 5.9 Equities & ETFs 4.0 Cash Total Corporates Bps Change Bps Change Yield-to-Worst 9/30/2016 609 2.9 12/31/2016 540 8.7 647 3.0 12/31/2016 -69 7.4 9/30/2016 7.7 -30 734 -87 8.7 9.1 -40 0.1 5.8 -5.7 N/A N/A - N/A N/A - 100.0 6.9 12.9 -6.0 N/A N/A - N/A N/A - 93.4 100.0 100.0 0.0 509 614 -105 6.9 7.7 -80 Corporates: • High yield had its best year since 2009 and currently trades at an overall credit spread of 422bps and a yield-to-worst of 6.17%. This compares with the historical average of 580bps and 9.16% and the post-crisis lows of 335bps and 4.85%. Risk assets performed well across the board.
Investment grade credit spreads are currently 129bps, only 43bps wide of their post-crisis tights, and leave little capacity to mitigate a rise in interest rates. The S&P 500 price-to-earnings ratio is over 18x estimated 2017 earnings, the highest level since the early 2000s. From a relative value perspective, high yield valuations appears among the least stretched, especially when considering their potential to benefit from an acceleration in growth and capacity for spread tightening if interest rates rise in line with consensus expectations. • The new administration’s policy objectives include increased infrastructure spending, reduction of burdensome regulations and tax reform, all of which should benefit growth.
Early speculation is that the tax reform proposal will include elimination or reduction of the corporate deductibility of interest expense. High yield should benefit directly from this change, which could result in less leveraged balance sheets, stronger credit profiles and improved valuations. • In the context of an expected acceleration of economic growth balanced with current valuations, we are focused on the balance of risk and reward and our objective of long-term superior risk-adjusted returns. As such, we will opportunistically reduce the risk profile at the margin while also focusing on sectors that should directly benefit from the new administration’s policies such as Housing, Basic Materials and Financial Services. CLOs: • CLO allocation in the fund is diverse across a range of managers, with a bias toward more defensive positions with higher coupons and an average spread of 712bps over LIBOR.
This may mean sacrificing potential price upside but should insulate the fund against potential spread widening. Angel Oak Capital Advisors, LLC 6 . Disclaimers Definitions and Disclosures: CLOs: Collateralized loan obligation. Average Coupon: Equal to the total interest payments of an issue divided by bond year dollars. Average Yield-to-Worst: The lowest potential yield that can be received on a bond without the issuer actually defaulting. Basis Points (bps): One hundredth of one percent and is used to denote the percentage change in a financial instrument. Bank of America Merrill Lynch (BAML) U.S. IG Bond Index: The BofA Merrill Lynch U.S. Corporate Index tracks the performance of U.S. dollar denominated investment grade corporate debt publicly issued in the U.S.
domestic market. Qualifying securities must have an investment grade rating (based on an average of Moody’s, S&P and Fitch), at least 18 months to final maturity at the time of issuance, at least one year remaining term to final maturity as of the rebalancing date, a fixed coupon schedule and a minimum amount outstanding of $250 million. Bank of America Merrill Lynch (BAML) U.S. High Yield Index: Tracks the performance of below investment grade, but not in default, U.S.
dollar denominated corporate bonds publicly issued in the U.S. domestic market, and includes issues with a credit rating of BBB or below, as rated by Moody’s and S&P. Citi U.S. Broad Investment Grade Bond Index: An index that tracks the performance of U.S.
Dollar-denominated bonds issued in the U.S. investment-grade bond market. Citi High Yield Market Index: A U.S. Dollar-denominated index which measures the performance of high-yield debt issued by corporations domiciled in the U.S. or Canada. Correlation: A statistical measure of how two securities move in relation to another.
Index used for comparison is the BofA Merrill Lynch U.S. High Yield Index. Effective Duration: Measures a portfolio’s sensitivity to changes in interest rates. Generally, the longer the effective duration, the greater the price change relative to interest rate movements. Free Cash Flow (FCF): A measure of a company’s financial performance, calculated as operating cash flow minus capital expenditures. FCF represents the cash that a company is able to generate after spending the money required to maintain or expand its asset base. Industrial Production Index (IPI): An economic indicator that is released monthly by the Federal Reserve Board.
The indicator measures the amount of output from the manufacturing, mining, electric and gas industries. LIBOR: A benchmark rate that some of the world's leading banks charge each other for short-term loans. It stands for Intercontinental Exchange London Interbank Offered Rate and serves as the first step to calculating interest rates on various loans throughout the world. Option-Adjusted Spread (OAS): The yield spread which has to be added to a benchmark yield curve to discount a security’s payments to match its market price, using a dynamic pricing model that accounts for embedded options. Price-to-Earnings Ratio (P/E Ratio): The ratio for valuing a company that measures its current share price relative to its per-share earnings. Angel Oak Capital Advisors, LLC 7 . Disclaimers S&P 500 Total Return Index: An American stock market index based on the market capitalizations of 500 large companies having common stock listed on the NYSE or NASDAQ. Sharpe Ratio: A statistical measure that uses standard deviation and excess return to determine reward per unit of risk. A higher Sharpe ratio implies a better historical risk-adjusted performance. The Sharpe ratio has been calculated since inception using the 3-month Treasury bill for the risk-free rate of return. Spread: The difference in yield between a U.S. Treasury bond and a debt security with the same maturity but of lesser quality. Standard Deviation: A statistical measure of portfolio risk used to measure variability of total return around an average, over a specified period of time.
The greater the standard deviation over the period, the wider the variability or range of returns and hence, the greater the fund’s volatility. The standard deviation has been calculated since inception. The CBOE Volatility Index (VIX): The VIX is a key measure of market expectations of near-term volatility conveyed by S&P 500 stock index options prices. Mutual fund investing involves risk. Principal loss is possible.
Investments in debt securities typically decrease when interest rates rise. This risk is usually greater for longer-term debt securities. Investments in lower-rated and non-rated securities present a greater risk of loss to principal and interest than higher-rated securities.
Investments in asset-backed and mortgage-backed securities include additional risks that investors should be aware of, including credit risk, prepayment risk, possible illiquidity and default, as well as increased susceptibility to adverse economic developments. Derivatives involve risks different from and, in certain cases, greater than the risks presented by more traditional investments. Derivatives may involve certain costs and risks such as illiquidity, interest rate, market, credit, management and the risk that a position could not be closed when most advantageous.
Investing in derivatives could result in losing more than the amount invested. The Fund may make short sales of securities, which involves the risk that losses may exceed the original amount invested. Must be preceded or accompanied by a current prospectus. To obtain an electronic copy of the prospectus, please visit www.angeloakcapital.com. © 2016 Angel Oak Capital Advisors, which is the advisor to the Angel Oak Funds. Distributed by Quasar Distributors, LLC (Member FINRA.) It is not possible to invest directly in an index. Angel Oak Capital Advisors, LLC 8 .


