HYLD Peritus High Yield ETF – Fact Sheet as of January 31, 2016
AdvisorShares Investments


Description
HYLD
AdvisorShares Peritus High Yield ETF
As of 1/31/2016
Investment Strategy
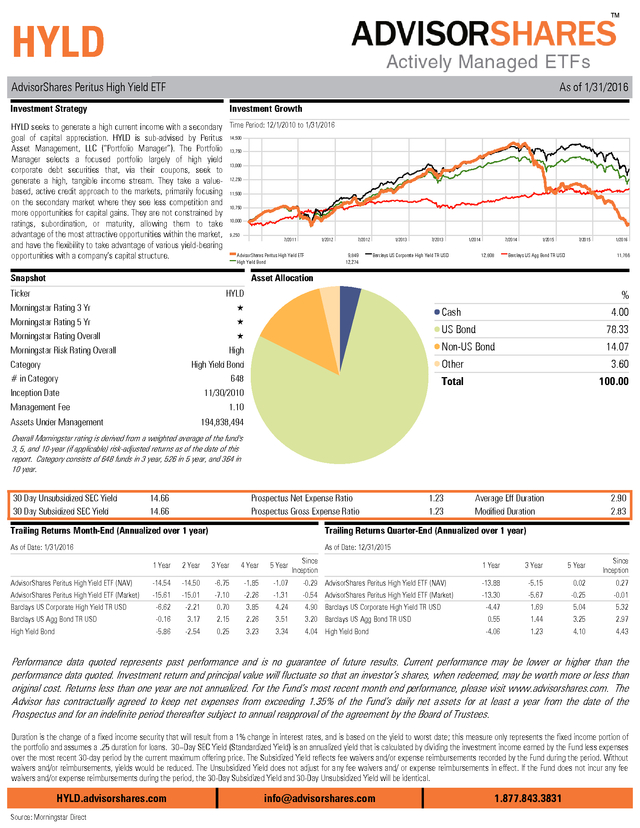
Investment Growth
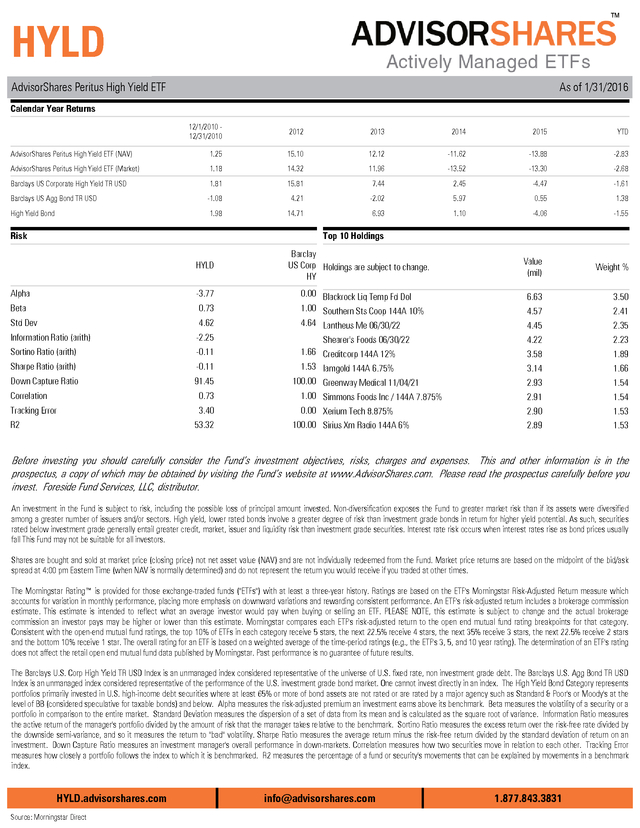
HYLD seeks to generate a high current income with a secondary Time Period: 12/1/2010 to 1/31/2016
goal of capital appreciation. HYLD is sub-advised by Peritus 14,500
Asset Management, LLC (“Portfolio Manager”). The Portfolio 13,750
Manager selects a focused portfolio largely of high yield
13,000
corporate debt securities that, via their coupons, seek to
generate a high, tangible income stream. They take a value- 12,250
based, active credit approach to the markets, primarily focusing 11,500
on the secondary market where they see less competition and 10,750
more opportunities for capital gains.
They are not constrained by ratings, subordination, or maturity, allowing them to take 10,000 advantage of the most attractive opportunities within the market, 9,250 7/2011 1/2012 and have the flexibility to take advantage of various yield-bearing AdvisorShares Peritus High Yield ETF opportunities with a company’s capital structure. High Yield Bond Snapshot 7/2012 9,849 12,274 1/2013 7/2013 1/2014 Barclays US Corporate High Yield TR USD 7/2014 12,808 1/2015 7/2015 Barclays US Agg Bond TR USD 1/2016 11,766 Asset Allocation HYLD Ticker Morningstar Rating 3 Yr Morningstar Rating 5 Yr Ù Morningstar Rating Overall % Ù Ù Cash US Bond 78.33 Non-US Bond High Morningstar Risk Rating Overall 4.00 14.07 High Yield Bond Other 3.60 # in Category 648 Inception Date 11/30/2010 Total 100.00 Category 1.10 Management Fee Assets Under Management 194,838,494 Overall Morningstar rating is derived from a weighted average of the fund's 3, 5, and 10-year (if applicable) risk-adjusted returns as of the date of this report. Category consists of 648 funds in 3 year, 526 in 5 year, and 364 in 10 year. 30 Day Unsubsidized SEC Yield 30 Day Subsidized SEC Yield Prospectus Net Expense Ratio Prospectus Gross Expense Ratio 14.66 14.66 Trailing Returns Month-End (Annualized over 1 year) 1.23 1.23 Average Eff Duration Modified Duration 2.90 2.83 Trailing Returns Quarter-End (Annualized over 1 year) As of Date: 1/31/2016 As of Date: 12/31/2015 1 Year 2 Year 3 Year 4 Year Since 5 Year Inception 1 Year 3 Year 5 Year Since Inception AdvisorShares Peritus High Yield ETF (NAV) -14.54 -14.50 -6.75 -1.85 -1.07 -0.29 AdvisorShares Peritus High Yield ETF (NAV) -13.88 -5.15 0.02 0.27 AdvisorShares Peritus High Yield ETF (Market) -15.61 -15.01 -7.10 -2.26 -1.31 -0.54 AdvisorShares Peritus High Yield ETF (Market) -13.30 -5.67 -0.25 -0.01 Barclays US Corporate High Yield TR USD -6.62 -2.21 0.70 3.85 4.24 4.90 Barclays US Corporate High Yield TR USD -4.47 1.69 5.04 5.32 Barclays US Agg Bond TR USD -0.16 3.17 2.15 2.26 3.51 3.20 Barclays US Agg Bond TR USD 0.55 1.44 3.25 2.97 High Yield Bond -5.86 -2.54 0.25 3.23 3.34 4.04 High Yield Bond -4.06 1.23 4.10 4.43 Performance data quoted represents past performance and is no guarantee of future results. Current performance may be lower or higher than the performance data quoted.
Investment return and principal value will fluctuate so that an investor’s shares, when redeemed, may be worth more or less than original cost. Returns less than one year are not annualized. For the Fund’s most recent month end performance, please visit www.advisorshares.com.
The Advisor has contractually agreed to keep net expenses from exceeding 1.35% of the Fund’s daily net assets for at least a year from the date of the Prospectus and for an indefinite period thereafter subject to annual reapproval of the agreement by the Board of Trustees. Duration is the change of a fixed income security that will result from a 1% change in interest rates, and is based on the yield to worst date; this measure only represents the fixed income portion of the portfolio and assumes a .25 duration for loans. 30–Day SEC Yield (Standardized Yield) is an annualized yield that is calculated by dividing the investment income earned by the Fund less expenses over the most recent 30-day period by the current maximum offering price. The Subsidized Yield reflects fee waivers and/or expense reimbursements recorded by the Fund during the period.
Without waivers and/or reimbursements, yields would be reduced. The Unsubsidized Yield does not adjust for any fee waivers and/ or expense reimbursements in effect. If the Fund does not incur any fee waivers and/or expense reimbursements during the period, the 30-Day Subsidized Yield and 30-Day Unsubsidized Yield will be identical. HYLD.advisorshares.com Source: Morningstar Direct info@advisorshares.com 1.877.843.3831 .
HYLD AdvisorShares Peritus High Yield ETF As of 1/31/2016 Calendar Year Returns 12/1/2010 12/31/2010 2012 2013 2014 2015 YTD AdvisorShares Peritus High Yield ETF (NAV) 1.25 15.10 12.12 -11.62 -13.88 -2.83 AdvisorShares Peritus High Yield ETF (Market) 1.18 14.32 11.96 -13.52 -13.30 -2.68 Barclays US Corporate High Yield TR USD 1.81 15.81 7.44 2.45 -4.47 -1.61 Barclays US Agg Bond TR USD -1.08 4.21 -2.02 5.97 0.55 1.38 High Yield Bond 1.98 14.71 6.93 1.10 -4.06 -1.55 Risk Top 10 Holdings HYLD Barclay US Corp Holdings are subject to change. HY Value (mil) Weight % 6.63 3.50 4.57 2.41 4.45 2.35 4.22 2.23 3.58 1.89 3.14 1.66 100.00 Greenway Medical 11/04/21 1.00 Simmons Foods Inc / 144A 7.875% 2.93 1.54 2.91 1.54 0.00 Xerium Tech 8.875% 100.00 Sirius Xm Radio 144A 6% 2.90 1.53 2.89 1.53 Alpha -3.77 Beta 0.73 0.00 Blackrock Liq Temp Fd Dol 1.00 Southern Sts Coop 144A 10% Std Dev 4.62 4.64 Lantheus Me 06/30/22 Information Ratio (arith) -2.25 Sortino Ratio (arith) -0.11 Sharpe Ratio (arith) -0.11 Down Capture Ratio 91.45 Correlation 0.73 Tracking Error 3.40 53.32 R2 Shearer's Foods 06/30/22 1.66 Creditcorp 144A 12% 1.53 Iamgold 144A 6.75% Before investing you should carefully consider the Fund’s investment objectives, risks, charges and expenses. This and other information is in the prospectus, a copy of which may be obtained by visiting the Fund’s website at www.AdvisorShares.com. Please read the prospectus carefully before you invest. Foreside Fund Services, LLC, distributor. An investment in the Fund is subject to risk, including the possible loss of principal amount invested.
Non-diversification exposes the Fund to greater market risk than if its assets were diversified among a greater number of issuers and/or sectors. High yield, lower rated bonds involve a greater degree of risk than investment grade bonds in return for higher yield potential. As such, securities rated below investment grade generally entail greater credit, market, issuer and liquidity risk than investment grade securities.
Interest rate risk occurs when interest rates rise as bond prices usually fall This Fund may not be suitable for all investors. Shares are bought and sold at market price (closing price) not net asset value (NAV) and are not individually redeemed from the Fund. Market price returns are based on the midpoint of the bid/ask spread at 4:00 pm Eastern Time (when NAV is normally determined) and do not represent the return you would receive if you traded at other times. The Morningstar Rating™ is provided for those exchange-traded funds ("ETFs") with at least a three-year history. Ratings are based on the ETF's Morningstar Risk-Adjusted Return measure which accounts for variation in monthly performance, placing more emphasis on downward variations and rewarding consistent performance.
An ETF's risk-adjusted return includes a brokerage commission estimate. This estimate is intended to reflect what an average investor would pay when buying or selling an ETF. PLEASE NOTE, this estimate is subject to change and the actual brokerage commission an investor pays may be higher or lower than this estimate.
Morningstar compares each ETF's risk-adjusted return to the open end mutual fund rating breakpoints for that category. Consistent with the open-end mutual fund ratings, the top 10% of ETFs in each category receive 5 stars, the next 22.5% receive 4 stars, the next 35% receive 3 stars, the next 22.5% receive 2 stars and the bottom 10% receive 1 star. The overall rating for an ETF is based on a weighted average of the time-period ratings (e.g., the ETF's 3, 5, and 10 year rating). The determination of an ETF's rating does not affect the retail open end mutual fund data published by Morningstar.
Past performance is no guarantee of future results. The Barclays U.S. Corp High Yield TR USD Index is an unmanaged index considered representative of the universe of U.S. fixed rate, non investment grade debt.
The Barclays U.S. Agg Bond TR USD Index is an unmanaged index considered representative of the performance of the U.S. investment grade bond market.
One cannot invest directly in an index. The High Yield Bond Category represents portfolios primarily invested in U.S. high-income debt securities where at least 65% or more of bond assets are not rated or are rated by a major agency such as Standard & Poor's or Moody's at the level of BB (considered speculative for taxable bonds) and below.
Alpha measures the risk-adjusted premium an investment earns above its benchmark. Beta measures the volatility of a security or a portfolio in comparison to the entire market. Standard Deviation measures the dispersion of a set of data from its mean and is calculated as the square root of variance.
Information Ratio measures the active return of the manager's portfolio divided by the amount of risk that the manager takes relative to the benchmark. Sortino Ratio measures the excess return over the risk-free rate divided by the downside semi-variance, and so it measures the return to "bad" volatility. Sharpe Ratio measures the average return minus the risk-free return divided by the standard deviation of return on an investment.
Down Capture Ratio measures an investment manager's overall performance in down-markets. Correlation measures how two securities move in relation to each other. Tracking Error measures how closely a portfolio follows the index to which it is benchmarked.
R2 measures the percentage of a fund or security's movements that can be explained by movements in a benchmark index. HYLD.advisorshares.com Source: Morningstar Direct info@advisorshares.com 1.877.843.3831 . .


