


Description
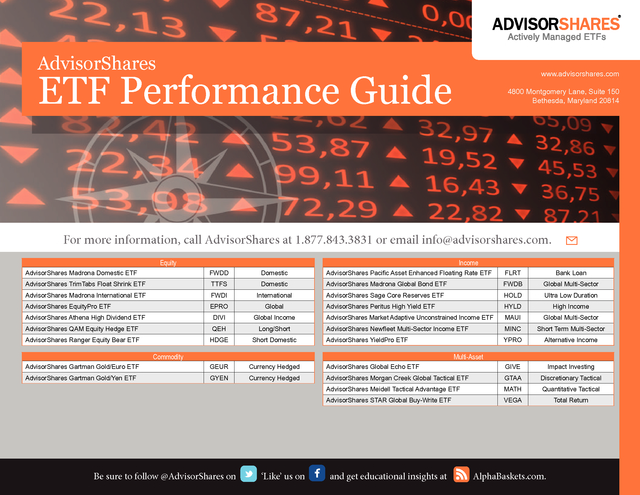
AdvisorShares
ETF Performance Guide
www.advisorshares.com
4800 Montgomery Lane, Suite 150
Bethesda, Maryland 20814
For more information, call AdvisorShares at 1.877.843.3831 or email info@advisorshares.com.
Income
Equity
AdvisorShares Madrona Domestic ETF
FWDD
Domestic
AdvisorShares Pacific Asset Enhanced Floating Rate ETF
FLRT
Bank Loan
AdvisorShares TrimTabs Float Shrink ETF
TTFS
Domestic
AdvisorShares Madrona Global Bond ETF
FWDB
Global Multi-Sector
AdvisorShares Madrona International ETF
FWDI
International
AdvisorShares Sage Core Reserves ETF
HOLD
Ultra Low Duration
AdvisorShares EquityPro ETF
EPRO
Global
AdvisorShares Peritus High Yield ETF
HYLD
High Income
DIVI
Global Income
AdvisorShares Market Adaptive Unconstrained Income ETF
MAUI
Global Multi-Sector
AdvisorShares Newfleet Multi-Sector Income ETF
MINC
Short Term Multi-Sector
AdvisorShares YieldPro ETF
YPRO
Alternative Income
AdvisorShares Athena High Dividend ETF
AdvisorShares QAM Equity Hedge ETF
QEH
Long/Short
AdvisorShares Ranger Equity Bear ETF
HDGE
Short Domestic
AdvisorShares Gartman Gold/Euro ETF
GEUR
Currency Hedged
AdvisorShares Global Echo ETF
GIVE
Impact Investing
AdvisorShares Gartman Gold/Yen ETF
GYEN
Currency Hedged
AdvisorShares Morgan Creek Global Tactical ETF
GTAA
Discretionary Tactical
AdvisorShares Meidell Tactical Advantage ETF
MATH
Quantitative Tactical
AdvisorShares STAR Global Buy-Write ETF
VEGA
Total Return
Commodity
Multi-Asset
Be sure to follow @AdvisorShares on
‘Like’ us on
and get educational insights at
AlphaBaskets.com.
Page 1
. Month-End Performance as of 01.31.2016
Equity ETFs
Month-End Performance as of 01.31.2016
NAV (%)
Fund
Exposure
TrimTabs Float Shrink (TTFS)
Domestic
Russell 3000 Index
WCM/BNY Mellon Focused Growth ADR (AADR)
International
YTD
-7.85
-6.18
-4.75
-8.23
-5.64
Domestic
S&P 500 Index
3-Mo
-10.69
-4.96
Madrona Domestic (FWDD)
1-Mo
-7.85
Quarter-End Performance as of
12.31.2015
Market Price(%)
Quarter-End Performance as of
12.31.2015
NAV (%)
Inception
9.76
1-Mo
-7.88
3-Mo
-10.76
YTD
-7.88
Inception
9.76
-4.96
11.82
-4.96
-6.18
-4.96
-4.75
17.66
-4.75
-8.27
-4.75
-7.07
-5.64
15.59
-5.64
-7.07
-5.64
15.59
Market Price(%)
1-Yr
-3.90
3-Yr
14.43
Inception
11.95
1-Yr
-3.87
3-Yr
14.40
Inception
11.96
11.82
1.38
15.13
17.65
-1.50
17.25
13.32
1.38
15.13
13.32
19.40
-1.52
17.24
0.48
19.40
14.74
17.53
0.48
14.74
17.53
-5.31
-5.02
-5.31
7.60
-5.85
-5.55
-5.85
7.58
4.38
7.76
8.80
4.79
7.99
8.90
MSCI EAFE Index
-7.23
-9.91
-7.23
4.99
-7.23
-9.91
-7.23
4.99
-0.81
5.01
6.53
-0.81
5.01
6.53
BNY Mellon Classic ADR Index
-5.95
-9.04
-5.95
3.58
-5.95
-9.04
-5.95
3.58
-3.22
2.47
4.81
-3.22
2.47
4.81
-5.29
-9.12
-5.29
-0.93
-5.57
-8.93
-5.57
-0.97
-6.74
1.12
0.24
-6.67
1.26
0.27
MSCI EAFE Index
-7.23
-9.91
-7.23
2.08
-7.23
-9.91
-7.23
2.08
-0.81
5.01
3.83
-0.81
5.01
3.83
BNY Mellon Classic ADR Index
-5.95
-9.04
-5.95
0.62
-5.95
-9.04
-5.95
0.62
-3.22
2.47
2.01
-3.22
2.47
2.01
-4.31
-8.85
-4.31
3.75
-0.31
-8.72
-0.31
3.82
-5.09
4.34
5.17
-6.41
3.26
4.01
-4.96
-6.18
-4.96
13.28
-4.96
-6.18
-4.96
13.28
1.38
15.13
15.30
1.38
15.13
15.30
Madrona International (FWDI)
International
EquityPro (EPRO)
Global
S&P 500 Index
MSCI World Index
-5.98
Global Income
MSCI AC World Index
-8.09
-5.98
9.31
-5.98
-8.09
-5.98
9.31
-0.87
9.63
11.51
-0.87
9.63
11.51
-2.81
-14.91
-2.81
-27.99
-2.74
-14.90
-2.74
-27.95
-25.18
n/a
-27.96
-25.24
n/a
-27.95
-6.03
Athena High Dividend (DIVI)
-8.49
-6.03
-7.02
-6.03
-8.49
-6.03
-7.02
-2.36
n/a
-3.29
-2.36
n/a
-3.29
Risk/Return Characteristics vs Benchmark
Fund
Madrona Domestic (FWDD)
As of 01.31.2016
Gross/Net
Net Expense
Inception
Beta
Expense Ratio Fee Cap*
06.20.11 1.37%/1.25%
1.25%
1.10
S&P 500 Index
TrimTabs Float Shrink (TTFS)
MSCI AC World Index
Sharpe Alpha
Sharp Ratio
-2.81
0.67
Up Capture
Ratio
109.24
Down Capture Max Drawdown
Ratio
(%)
112.67
-23.56
1.00
100.00
19.14
11.82
67.46
0.00
0.92
100.00
100.00
-18.38
1.01
94.42
17.95
17.66
102.05
1.76
1.48
102.64
100.80
-15.28
1.00
100.00
17.36
15.59
87.17
0.00
1.35
100.00
100.00
-13.38
07.21.10
1.63%/1.25%
1.25%
0.69
47.38
19.45
7.60
49.96
4.04
0.57
68.69
64.78
-21.45
1.00
100.00
19.38
5.43
34.02
0.00
0.41
100.00
100.00
-26.31
06.20.11
1.69%/1.25%
1.25%
0.93
58.27
23.61
-0.93
-4.23
-2.14
-0.06
87.83
90.87
-29.31
1.00
100.00
19.40
2.08
9.97
0.00
0.15
100.00
100.00
-23.60
07.10.12
1.19%/1.31%
1.25%
0.69
78.66
12.31
3.75
14.01
-5.07
0.44
71.73
79.37
-15.13
1.00
100.00
15.72
13.29
55.91
0.00
1.26
100.00
100.00
-12.04
07.29.14
2.02%/1.30%
0.99%
1.22
63.01
1.22
-28.59
-39.83
-0.07
-32.56
106.57
139.71
-46.52
1.00
100.00
0.80
-7.03
-10.41
0.00
-13.11
100.00
100.00
-18.37
S&P 500 Index
Athena High Dividend (DIVI)
21.46
Cumulative
Return (%)
53.72
0.99%
MSCI EAFE Index
EquityPro (EPRO)
96.90
Annualized
Return (%)
9.76
1.11%/0.99%
MSCI EAFE Index
Madrona International (FWDI)
Std Deviation
10.04.11
Russell 3000 Index
WCM/BNY Mellon Focused Growth ADR (AADR)
R-Squared
Performance data quoted represents past performance and is no guarantee of future results. Current performance may be lower or higher than the performance data quoted. Investment return and principal value will fluctuate so that an investor’s shares,
when redeemed, may be worth more or less than original cost. Returns less than one year are not annualized.
*The Advisor has contractually agreed to waive its management fees in the amounts shown at least through the respective fee waiver expiration dates as shown below and for an indefinite period thereafter, subject to annual reapproval of the agreement by the Board of Trustees: Madrona Domestic ETF, November 1, 2016; TrimTabs Float Shrink ETF, November 1, 2016; WCM/BNY Mellon Focused Growth ADR ETF, November 1, 2016; Madrona International ETF, November 1, 2016; EquityPro ETF, November 1, 2016; Athena High Dividend
ETF, November 1, 2016.
Page 2
.
Month-End Performance as of 01.31.2016 Equity ETFs (cont’d) Month-End Performance as of 01.31.2016 NAV (%) Fund Quarter-End Performance as of 12.31.2015 Market Price(%) Quarter-End Performance as of 12.31.2015 NAV (%) Market Price(%) Exposure 3-Mo YTD Inception 1-Mo 3-Mo YTD Inception 1-Yr 3-Yr Inception 1-Yr 3-Yr Inception Long/Short -4.26 -5.66 -4.26 1.99 -2.75 -5.76 -2.75 1.97 -3.26 2.74 3.35 -3.97 2.38 2.86 -3.66 -4.73 -3.66 n/a -3.66 -4.73 -3.66 n/a -0.45 5.02 n/a -0.45 5.02 n/a 10.98 13.30 10.98 -13.72 11.07 13.39 11.07 -13.70 -6.28 -16.28 -15.74 -6.11 -16.25 -15.74 -4.96 QAM Equity Hedge (QEH) 1-Mo -6.18 -4.96 10.70 -4.96 -6.18 -4.96 10.70 1.38 15.13 12.04 1.38 15.13 12.04 HFRI Equity Hedge (Total) Index Ranger Equity Bear (HDGE) Short Domestic S&P 500 Index Risk/Return Characteristics vs Benchmark Fund QAM Equity Hedge (QEH)** As of 01.31.2016 Gross/Net Net Expense Inception Beta Expense Ratio Fee Cap* 08.07.12 3.21%/2.03% 1.50% n/a HFRI Equity Hedge (Total) Index*** Ranger Equity Bear (HDGE) S&P 500 Index R-Squared Std Deviation n/a n/a Annualized Return (%) n/a Cumulative Return (%) n/a Sharpe Alpha Sharp Ratio n/a n/a Up Capture Ratio n/a Down Capture Max Drawdown Ratio (%) n/a n/a n/a 01.26.11 2.90%/2.90% n/a n/a n/a n/a n/a n/a n/a n/a n/a n/a -1.07 78.58 22.86 -13.72 -52.28 -0.89 -0.85 -116.46 -114.33 -65.82 1.00 100.00 18.90 10.70 66.46 0.00 0.84 100.00 100.00 -18.64 Performance data quoted represents past performance and is no guarantee of future results. Current performance may be lower or higher than the performance data quoted. Investment return and principal value will fluctuate so that an investor’s shares, when redeemed, may be worth more or less than original cost. Returns less than one year are not annualized. *The Advisor has contractually agreed to waive its management fees in the amounts shown at least through the respective fee waiver expiration dates as shown below and for an indefinite period thereafter, subject to annual reapproval of the agreement by the Board of Trustees: Accuvest Global Long Short ETF, November 1, 2016; QAM Equity Hedge ETF, November 1, 2016; Ranger Equity Bear, November 1, 2016. **QEH Modern Portfolio Theory Statistics are calculated monthly.
For this report the QEH risk statistics start on 9/1/2012. ***The HFRI Equity Hedge (Total) Index is updated three times a month. Performance shown takes into account the “Flash Update” which reflects performance through the 5th business day of the month. For the most up to date performance for the HFRI Index, please visit QEH.advisorshares.com. Page 3 .
Month-End Performance as of 01.31.2016 Income ETFs NAV (%) Fund Exposure Sage Core Reserves (HOLD) 0.02 0.00 0.02 0.00 0.02 0.00 0.02 0.03 n/a 0.02 0.03 n/a 0.02 -10.82 -2.86 -0.29 -2.66 -10.84 -2.66 -0.57 -13.87 -5.14 0.27 -13.32 -5.72 -0.05 -1.61 -6.22 -1.61 4.90 -1.61 -6.22 -1.61 4.90 -4.47 1.69 5.32 -4.47 1.69 5.32 0.17 -2.34 0.17 -4.30 3.15 -0.04 3.15 -3.47 -6.61 n/a -4.65 -6.02 n/a -5.66 1.38 0.78 1.38 2.68 1.38 0.78 1.38 2.68 0.55 n/a 1.89 0.55 n/a 1.89 0.35 -0.12 0.35 1.56 0.25 -0.24 0.25 1.56 1.28 n/a 1.48 1.24 n/a 1.52 1.38 0.78 1.38 2.07 1.38 0.78 1.38 2.07 0.55 n/a 1.63 0.55 n/a 1.63 Peritus High Yield (HYLD) High Income Barclays US High Yield Index Global Multi-Sector YTD -0.06 Inception 0.01 1-Yr 0.21 3-Yr n/a Inception 0.04 1-Yr 0.22 3-Yr n/a Inception 0.04 0.30 0.52 -1.21 0.57 0.34 0.57 -1.19 -1.51 n/a -1.55 -1.26 n/a -1.55 0.78 1.38 3.11 1.38 0.78 1.38 3.11 0.55 n/a 2.49 0.55 n/a 2.49 -0.34 -0.33 1.28 1.48 -0.28 -0.30 1.24 1.52 1.28 n/a 1.48 1.24 n/a 1.52 -0.57 0.55 1.63 -0.32 -0.57 0.55 1.63 0.55 n/a 1.63 0.55 n/a 1.63 -0.03 -0.22 -1.51 -1.55 -0.03 -0.22 -1.26 -1.55 -1.51 n/a -1.55 -1.26 n/a -1.55 -0.32 Alternative Income Barclays Capital Aggregate Bond Index 0.52 -0.32 ST Multi-Sector Barclays Capital Aggregate Bond Index YieldPro (YPRO) 3-Mo -0.09 1.38 Barclays Capital Aggregate Bond Index Newfleet Multi-Sector Income (MINC) 1-Mo -0.06 Market Price(%) 0.00 Ultra Low Duration Inception 0.04 NAV (%) -2.86 Barclays US Treasury Bill 1-3 Month Index Market Adaptive Unconstrained Income (MAUI) Market Price(%) Global Multi-Sector Barclays Capital Aggregate Bond Index YTD 0.02 Quarter-End Performance as of 12.31.2015 Bank Loan Pacific Asset Enhanced Floating Rate (FLRT) 3-Mo -0.08 Quarter-End Performance as of 12.31.2015 1-Mo 0.02 S&P / LSTA Leveraged Loan 100 Index Madrona Global Bond (FWDB) Month-End Performance as of 01.31.2016 -0.57 0.55 2.49 -0.32 -0.57 0.55 2.49 0.55 n/a 2.49 0.55 n/a 2.49 Risk/Return Characteristics vs Benchmark Fund Pacific Asset Enhanced Floating Rate (FLRT) As of 01.31.2016 Gross/Net Net Expense Inception Beta Expense Ratio Fee Cap* 2.18.15 1.43%/1.12% 1.10% 0.76 S&P / LSTA Leveraged Loan 100 Index Madrona Global Bond (FWDB) Barclays Capital Aggregate Bond Index Sharp Ratio 0.68 -2.25 Up Capture Ratio 72.05 Down Capture Max Drawdown Ratio (%) 67.88 -4.13 100.00 1.92 n/a -4.48 0.00 -3.59 100.00 100.00 -6.04 0.57 28.85 4.16 2.40 11.58 0.63 0.82 53.92 50.01 -7.48 1.00 100.00 3.91 3.11 15.17 0.00 1.14 100.00 100.00 -4.87 01.14.14 0.73%/0.35% 0.35% 0.24 0.04 0.31 0.05 0.10 0.01 0.03 -24.31 -114.83 -0.36 1.00 100.00 0.02 0.02 0.05 0.00 -1.41 100.00 100.00 -0.01 11.30.10 1.23%/1.23% n/a 0.73 53.32 4.62 -0.29 -1.51 -3.77 -0.12 70.26 91.45 -31.24 1.00 100.00 4.64 4.90 28.08 0.00 1.53 100.00 100.00 -12.01 07.08.14 5.72%/1.11% 0.99% -0.52 2.57 13.22 -4.30 -6.65 -2.45 -0.47 -64.67 -51.17 -9.35 1.00 100.00 4.07 2.68 4.23 0.00 0.95 100.00 100.00 -2.80 03.19.13 0.82%/0.75% 0.75% 0.23 56.80 1.24 1.56 4.54 1.02 1.77 25.14 19.82 -2.48 1.00 100.00 4.01 2.07 6.05 0.00 0.73 100.00 100.00 -4.87 03.04.14 1.08%/1.08% n/a 0.45 36.74 2.88 -1.21 -2.31 -2.61 -0.63 37.46 50.20 -5.52 1.00 100.00 3.91 3.11 6.04 0.00 1.15 100.00 100.00 -2.80 Barclays Capital Aggregate Bond Index YieldPro (YPRO) Sharpe Alpha 1.00 Barclays Capital Aggregate Bond Index Newfleet Multi-Sector Income (MINC) 1.92 Cumulative Return (%) -2.80 0.95% Barclays US High Yield Index Market Adaptive Unconstrained Income (MAUI) 60.40 Annualized Return (%) n/a 1.39%/1.35% Barclays US Treasury Bill 1-3 Month Index Peritus High Yield (HYLD) Std Deviation 06.20.11 Barclays Capital Aggregate Bond Index Sage Core Reserves (HOLD) R-Squared Performance data quoted represents past performance and is no guarantee of future results. Current performance may be lower or higher than the performance data quoted. Investment return and principal value will fluctuate so that an investor’s shares, when redeemed, may be worth more or less than original cost. Returns less than one year are not annualized. *The Advisor has contractually agreed to waive its management fees in the amounts shown at least through the respective fee waiver expiration dates as shown below and for an indefinite period thereafter, subject to annual reapproval of the agreement by the Board of Trustees: Pacific Asset Enhanced Floating Rate ETF, November 1, 2016; Madrona Global Bond ETF, November 1, 2016; Sage Core Reserves, November 1, 2016; Peritus High Yield ETF, November 1, 2016; Market Adaptive Unconstrained Income ETF, November 1, 2016; Newfleet Multi-Sector Income ETF, November 1, 2016; YieldPro ETF, November 1, 2016. Page 4 .
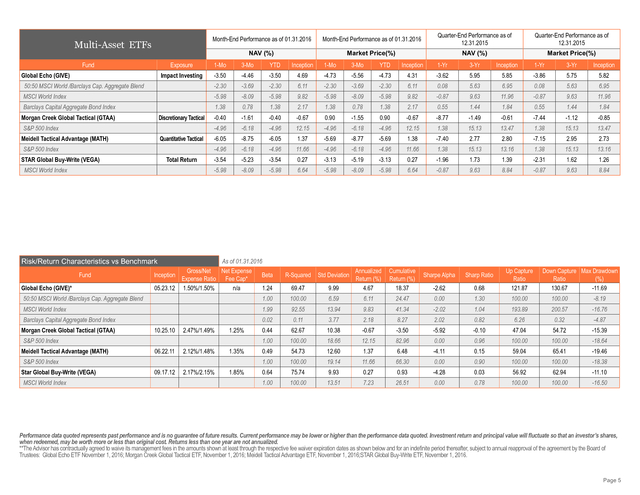
Month-End Performance as of 01.31.2016 Multi-Asset ETFs Month-End Performance as of 01.31.2016 NAV (%) Fund Quarter-End Performance as of 12.31.2015 Market Price(%) Quarter-End Performance as of 12.31.2015 NAV (%) Market Price(%) Exposure 3-Mo YTD Inception 1-Mo 3-Mo YTD Inception 1-Yr 3-Yr Inception 1-Yr 3-Yr Inception Impact Investing Global Echo (GIVE) 1-Mo 5.82 -3.50 -4.46 -3.50 4.69 -4.73 -5.56 -4.73 4.31 -3.62 5.95 5.85 -3.86 5.75 50:50 MSCI World /Barclays Cap. Aggregate Blend -2.30 -3.69 -2.30 6.11 -2.30 -3.69 -2.30 6.11 0.08 5.63 6.95 0.08 5.63 6.95 MSCI World Index -5.98 -8.09 -5.98 9.82 -5.98 -8.09 -5.98 9.82 -0.87 9.63 11.96 -0.87 9.63 11.96 Barclays Capital Aggregate Bond Index 1.38 0.78 1.38 2.17 1.38 0.78 1.38 2.17 0.55 1.44 1.84 0.55 1.44 1.84 -0.40 -1.61 -0.40 -0.67 0.90 -1.55 0.90 -0.67 -8.77 -1.49 -0.61 -7.44 -1.12 -0.85 -4.96 -6.18 -4.96 12.15 -4.96 -6.18 -4.96 12.15 1.38 15.13 13.47 1.38 15.13 13.47 -6.05 -8.75 -6.05 1.37 -5.69 -8.77 -5.69 1.38 -7.40 2.77 2.80 -7.15 2.95 2.73 -4.96 -6.18 -4.96 11.66 -4.96 -6.18 -4.96 11.66 1.38 15.13 13.16 1.38 15.13 13.16 -3.54 -5.23 -3.54 0.27 -3.13 -5.19 -3.13 0.27 -1.96 1.73 1.39 -2.31 1.62 1.26 -5.98 -8.09 -5.98 6.64 -5.98 -8.09 -5.98 6.64 -0.87 9.63 8.84 -0.87 9.63 8.84 Discretionary Tactical Morgan Creek Global Tactical (GTAA) S&P 500 Index Meidell Tactical Advantage (MATH) Quantitative Tactical S&P 500 Index STAR Global Buy-Write (VEGA) Total Return MSCI World Index Risk/Return Characteristics vs Benchmark Fund Global Echo (GIVE)* As of 01.31.2016 Gross/Net Net Expense Inception Beta Expense Ratio Fee Cap* 05.23.12 1.50%/1.50% n/a 1.24 R-Squared Std Deviation 69.47 9.99 Annualized Return (%) 4.67 Cumulative Return (%) 18.37 Sharpe Alpha Sharp Ratio -2.62 0.68 Up Capture Ratio 121.87 Down Capture Max Drawdown Ratio (%) 130.67 -11.69 50:50 MSCI World /Barclays Cap. Aggregate Blend 1.00 100.00 6.59 6.11 24.47 0.00 1.30 100.00 100.00 -8.19 MSCI World Index 1.99 92.55 13.94 9.83 41.34 -2.02 1.04 193.89 200.57 -16.76 Barclays Capital Aggregate Bond Index Morgan Creek Global Tactical (GTAA) 0.02 0.11 3.77 2.18 8.27 2.02 0.82 6.26 0.32 -4.87 10.25.10 2.47%/1.49% 1.25% 0.44 62.67 10.38 -0.67 -3.50 -5.92 -0.10 47.04 54.72 -15.39 1.00 100.00 18.66 12.15 82.96 0.00 0.96 100.00 100.00 -18.64 06.22.11 2.12%/1.48% 1.35% 0.49 54.73 12.60 1.37 6.48 -4.11 0.15 59.04 65.41 -19.46 1.00 100.00 19.14 11.66 66.30 0.00 0.90 100.00 100.00 -18.38 09.17.12 2.17%/2.15% 1.85% 0.64 75.74 9.93 0.27 0.93 -4.28 0.03 56.92 62.94 -11.10 1.00 100.00 13.51 7.23 26.51 0.00 0.78 100.00 100.00 -16.50 S&P 500 Index Meidell Tactical Advantage (MATH) S&P 500 Index Star Global Buy-Write (VEGA) MSCI World Index Performance data quoted represents past performance and is no guarantee of future results. Current performance may be lower or higher than the performance data quoted.
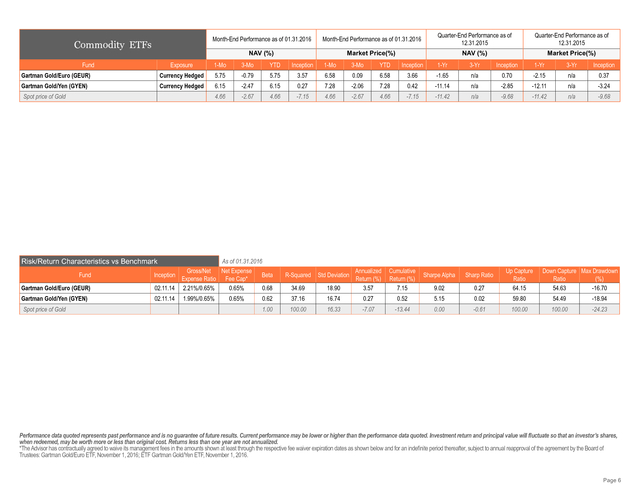
Investment return and principal value will fluctuate so that an investor’s shares, when redeemed, may be worth more or less than original cost. Returns less than one year are not annualized. **The Advisor has contractually agreed to waive its management fees in the amounts shown at least through the respective fee waiver expiration dates as shown below and for an indefinite period thereafter, subject to annual reapproval of the agreement by the Board of Trustees: Global Echo ETF November 1, 2016; Morgan Creek Global Tactical ETF, November 1, 2016; Meidell Tactical Advantage ETF, November 1, 2016;STAR Global Buy-Write ETF, November 1, 2016. Page 5 . Month-End Performance as of 01.31.2016 Commodity ETFs Month-End Performance as of 01.31.2016 NAV (%) Fund Market Price(%) Exposure 1-Mo 3-Mo YTD Inception 1-Mo Gartman Gold/Euro (GEUR) Currency Hedged 5.75 -0.79 5.75 3.57 Gartman Gold/Yen (GYEN) Currency Hedged 6.15 -2.47 6.15 0.27 4.66 -2.67 4.66 -7.15 Spot price of Gold Quarter-End Performance as of 12.31.2015 Quarter-End Performance as of 12.31.2015 NAV (%) 3-Mo YTD Inception 6.58 0.09 6.58 7.28 -2.06 7.28 4.66 -2.67 4.66 Market Price(%) 1-Yr 3-Yr Inception 1-Yr 3-Yr 3.66 -1.65 n/a 0.42 -11.14 n/a -7.15 -11.42 n/a -9.68 Inception 0.70 -2.15 n/a 0.37 -2.85 -12.11 n/a -3.24 -11.42 n/a -9.68 Risk/Return Characteristics vs Benchmark Gartman Gold/Euro (GEUR) As of 01.31.2016 Gross/Net Net Expense Inception Beta Expense Ratio Fee Cap* 02.11.14 2.21%/0.65% 0.65% 0.68 Gartman Gold/Yen (GYEN) 02.11.14 Fund Spot price of Gold 1.99%/0.65% 0.65% Annualized Return (%) 3.57 Cumulative Return (%) 7.15 Sharpe Alpha Sharp Ratio 9.02 0.27 Up Capture Ratio 64.15 Down Capture Max Drawdown Ratio (%) 54.63 -16.70 R-Squared Std Deviation 34.69 18.90 0.62 37.16 16.74 0.27 0.52 5.15 0.02 59.80 54.49 -18.94 1.00 100.00 16.33 -7.07 -13.44 0.00 -0.61 100.00 100.00 -24.23 Performance data quoted represents past performance and is no guarantee of future results. Current performance may be lower or higher than the performance data quoted. Investment return and principal value will fluctuate so that an investor’s shares, when redeemed, may be worth more or less than original cost. Returns less than one year are not annualized. *The Advisor has contractually agreed to waive its management fees in the amounts shown at least through the respective fee waiver expiration dates as shown below and for an indefinite period thereafter, subject to annual reapproval of the agreement by the Board of Trustees: Gartman Gold/Euro ETF, November 1, 2016; ETF Gartman Gold/Yen ETF, November 1, 2016. Page 6 .
The S&P 500 Index is a broad-based, unmanaged measurement of changes in stock market conditions based on the average of 500 widely held common stocks. The Russell 3000 Index measures the performance of the largest 3000 U.S. companies representing approximately 98% of the investable U.S. equity market. The MSCI EAFE Index is an unmanaged free float-adjusted market capitalization index that is designed to measure the equity market performance of developed markets, excluding the US & Canada. The BNY Mellon Classic ADR Index combines the over the counter (OTC) traded ADRs with exchange-listed ADRs bringing transparency to the available universe of American Depositary Receipts, including those issued by many of the world’s premier companies. The MSCI World Index is a free float-adjusted market capitalization weighted index that is designed to measure the equity market performance of developed markets. The MSCI AC World Index is an unmanaged free float-adjusted market capitalization weighted index that is designed to measure the equity market performance of developed and emerging markets. The HFRI Equity Hedge (Total) Index is a fund-weighted index of select hedge funds focusing on Equity Hedge strategies. Equity Hedge investing consists of a core holding of long equities hedged at all times with short sales of stocks and/or stock index options. The Barclays Capital Aggregate Bond Index measures the performance of the U.S.
investment grade bond market. The Barclays 1-3 Month U.S. Treasury Bill Index includes all publicly issued zero-coupon U.S. Treasury Bills that have a remaining maturity of less than 3 months and more than 1 month, are rated investment grade, and have $250 million or more of outstanding face value. The Barclays U.S.
High Yield Index is an unmanaged index considered representative of the universe of U.S. fixed rate, non investment grade debt. The Spot price of Gold is valued on the basis of each day’s 3pm London time announced price for an ounce of gold set by five market making members of the London Bullion Market Association. One cannot invest directly into an index. A long position is the purchase of an investment with the expectation that it will rise in value. A short position is the sale of a borrowed investment with the expectation that it will decline in value. Duration measures (in years) the sensitivity of the price of a fixed-income investment to a 1% change in interest rates. The Beta is a measure of the volatility, or systematic risk, of a security or a portfolio in comparison to the market as a whole.
Beta is used in the capital asset pricing model (CAPM), a model that calculates the expected return of an asset based on its beta and expected market returns. R-Squared is a statistical measure that represents the percentage of a fund or security’s movements that can be explained by movements in a benchmark index. Standard Deviation is a measure of the dispersion of a set of data from its mean. The more spread apart the data, the higher the deviation.
Standard deviation is calculated as the square root of variance. An Annualized Return is the return an investment provides over a period of time, expressed as a time-weighted annual percentage. Sources of returns can include dividends, returns of capital and capital appreciation. The rate of annual return is measured against the initial amount of the investment and represents a geometric mean rather than a simple arithmetic mean. A Cumulative Return is the aggregate amount that an investment has gained or lost over time, independent of the period of time involved. Presented as a percentage, the cumulative return is the raw mathematical return. The Alpha is a measure of performance on a risk-adjusted basis.
Alpha takes the volatility (price risk) of a fund and compares its risk-adjusted performance to a benchmark index. The excess return of the fund relative to the return of the benchmark index is a fund’s alpha. The Sharpe Ratio is developed by Nobel laureate William F. Sharpe to measure risk-adjusted performance. The Sharpe ratio is calculated by subtracting the risk-free rate - such as that of the 10-year U.S.
Treasury bond - from the rate of return for a portfolio and dividing the result by the standard deviation of the portfolio returns. The Up-Market Capture Ratio is a statistical measure of an investment manager’s overall performance in up-markets. The up-market capture ratio is used to evaluate how well an investment manager performed relative to an index during periods when that index has risen. The ratio is calculated by dividing the manager’s returns by the returns of the index during the up-market, and multiplying that factor by 100. The Down-market Capture Ratio is a statistical measure of an investment manager’s overall performance in down-markets. The down-market capture ratio is used to evaluate how well or poorly an investment manager performed relative to an index during periods when that index has dropped. The ratio is calculated by dividing the manager’s returns by the returns of the index during the down-market and multiplying that factor by 100. The Maximum Drawdown is a peak-to-trough decline during a specific record period of an investment, fund or commodity. A drawdown is usually quoted as the percentage between the peak and the trough. An investment in the Funds is subject to risk, including the possible loss of principal amount invested. Derivatives, as associated with FLRT, GEUR, GYEN, QEH, VEGA, may be riskier and more sensitive to changes in economic or market conditions than other types of investments and could result in losses that significantly exceed the Fund’s original investment.
GIVE, HDGB, HDGE, QEH and VEGA may participate in leveraged transactions to include selling securities short which creates the risk of magnified capital losses. Under certain market conditions, short sales can increase the volatility and decrease the liquidity of certain securities or positions and may lower the Fund’s return or result in a loss. Writing and purchasing call and put options are specialized activities and entail greater than ordinary investment risk when considering VEGA.
AADR,DIVI and FWDI may use ADRs which are subject to the risk of change in political or economic conditions and exchange rates in foreign currencies. HYLD includes high yield risk, which are lower rated bonds involve a greater degree of risk than investment grade bonds in return for higher yield potential. As it pertains to DIVI, Real Estate Investment Trust Risk (“REITs”) will be subject to the risks associated with the direct ownership or real estate such as fluctuation in value of property and defaults by borrowers or tenants.
DIVI may invest in Exchange-Traded Vehicles which subjects the Fund to the risks associated with such vehicle’s investments or reference asset in the case of ETNs, including the possibility that value of the securities could decrease. HOLD’s investment in fixed income securities will change in value in response to interest rate changes and other factors, such as the perception of the issuer’s creditworthiness. The risks associated with each Fund include the risks associated with the underlying ETFs, which can result in higher volatility, and are detailed in each Fund’s prospectus.
These Funds may not be suitable for all investors. Shares are bought and sold at market price (closing price) not NAV and are not individually redeemed from the Fund. Market price returns are based on the midpoint of the bid/ask spread at 4:00pm Eastern Time (when NAV is normally determined), and do not represent the return you would receive if you traded at other times. Holdings and allocations are subject to risks and to change. Before investing you should carefully consider the Fund’s investment objectives, risks, charges and expenses.
This and other information is in the prospectus, a copy of which may be obtained by visiting the Fund’s website at www.AdvisorShares.com. Please read the prospectus carefully before you invest. Foreside Fund Services, LLC, distributor. For more information, call AdvisorShares at 1.877.843.3831 or email info@advisorshares.com. For more information, call AdvisorShares at 1.877.843.3831 or visit www.advisorshares.com. www.advisorshares.com • 4800 Montgomery Lane, Suite 150 • Bethesda, Maryland 20814 Page 7 .
Month-End Performance as of 01.31.2016 Equity ETFs (cont’d) Month-End Performance as of 01.31.2016 NAV (%) Fund Quarter-End Performance as of 12.31.2015 Market Price(%) Quarter-End Performance as of 12.31.2015 NAV (%) Market Price(%) Exposure 3-Mo YTD Inception 1-Mo 3-Mo YTD Inception 1-Yr 3-Yr Inception 1-Yr 3-Yr Inception Long/Short -4.26 -5.66 -4.26 1.99 -2.75 -5.76 -2.75 1.97 -3.26 2.74 3.35 -3.97 2.38 2.86 -3.66 -4.73 -3.66 n/a -3.66 -4.73 -3.66 n/a -0.45 5.02 n/a -0.45 5.02 n/a 10.98 13.30 10.98 -13.72 11.07 13.39 11.07 -13.70 -6.28 -16.28 -15.74 -6.11 -16.25 -15.74 -4.96 QAM Equity Hedge (QEH) 1-Mo -6.18 -4.96 10.70 -4.96 -6.18 -4.96 10.70 1.38 15.13 12.04 1.38 15.13 12.04 HFRI Equity Hedge (Total) Index Ranger Equity Bear (HDGE) Short Domestic S&P 500 Index Risk/Return Characteristics vs Benchmark Fund QAM Equity Hedge (QEH)** As of 01.31.2016 Gross/Net Net Expense Inception Beta Expense Ratio Fee Cap* 08.07.12 3.21%/2.03% 1.50% n/a HFRI Equity Hedge (Total) Index*** Ranger Equity Bear (HDGE) S&P 500 Index R-Squared Std Deviation n/a n/a Annualized Return (%) n/a Cumulative Return (%) n/a Sharpe Alpha Sharp Ratio n/a n/a Up Capture Ratio n/a Down Capture Max Drawdown Ratio (%) n/a n/a n/a 01.26.11 2.90%/2.90% n/a n/a n/a n/a n/a n/a n/a n/a n/a n/a -1.07 78.58 22.86 -13.72 -52.28 -0.89 -0.85 -116.46 -114.33 -65.82 1.00 100.00 18.90 10.70 66.46 0.00 0.84 100.00 100.00 -18.64 Performance data quoted represents past performance and is no guarantee of future results. Current performance may be lower or higher than the performance data quoted. Investment return and principal value will fluctuate so that an investor’s shares, when redeemed, may be worth more or less than original cost. Returns less than one year are not annualized. *The Advisor has contractually agreed to waive its management fees in the amounts shown at least through the respective fee waiver expiration dates as shown below and for an indefinite period thereafter, subject to annual reapproval of the agreement by the Board of Trustees: Accuvest Global Long Short ETF, November 1, 2016; QAM Equity Hedge ETF, November 1, 2016; Ranger Equity Bear, November 1, 2016. **QEH Modern Portfolio Theory Statistics are calculated monthly.
For this report the QEH risk statistics start on 9/1/2012. ***The HFRI Equity Hedge (Total) Index is updated three times a month. Performance shown takes into account the “Flash Update” which reflects performance through the 5th business day of the month. For the most up to date performance for the HFRI Index, please visit QEH.advisorshares.com. Page 3 .
Month-End Performance as of 01.31.2016 Income ETFs NAV (%) Fund Exposure Sage Core Reserves (HOLD) 0.02 0.00 0.02 0.00 0.02 0.00 0.02 0.03 n/a 0.02 0.03 n/a 0.02 -10.82 -2.86 -0.29 -2.66 -10.84 -2.66 -0.57 -13.87 -5.14 0.27 -13.32 -5.72 -0.05 -1.61 -6.22 -1.61 4.90 -1.61 -6.22 -1.61 4.90 -4.47 1.69 5.32 -4.47 1.69 5.32 0.17 -2.34 0.17 -4.30 3.15 -0.04 3.15 -3.47 -6.61 n/a -4.65 -6.02 n/a -5.66 1.38 0.78 1.38 2.68 1.38 0.78 1.38 2.68 0.55 n/a 1.89 0.55 n/a 1.89 0.35 -0.12 0.35 1.56 0.25 -0.24 0.25 1.56 1.28 n/a 1.48 1.24 n/a 1.52 1.38 0.78 1.38 2.07 1.38 0.78 1.38 2.07 0.55 n/a 1.63 0.55 n/a 1.63 Peritus High Yield (HYLD) High Income Barclays US High Yield Index Global Multi-Sector YTD -0.06 Inception 0.01 1-Yr 0.21 3-Yr n/a Inception 0.04 1-Yr 0.22 3-Yr n/a Inception 0.04 0.30 0.52 -1.21 0.57 0.34 0.57 -1.19 -1.51 n/a -1.55 -1.26 n/a -1.55 0.78 1.38 3.11 1.38 0.78 1.38 3.11 0.55 n/a 2.49 0.55 n/a 2.49 -0.34 -0.33 1.28 1.48 -0.28 -0.30 1.24 1.52 1.28 n/a 1.48 1.24 n/a 1.52 -0.57 0.55 1.63 -0.32 -0.57 0.55 1.63 0.55 n/a 1.63 0.55 n/a 1.63 -0.03 -0.22 -1.51 -1.55 -0.03 -0.22 -1.26 -1.55 -1.51 n/a -1.55 -1.26 n/a -1.55 -0.32 Alternative Income Barclays Capital Aggregate Bond Index 0.52 -0.32 ST Multi-Sector Barclays Capital Aggregate Bond Index YieldPro (YPRO) 3-Mo -0.09 1.38 Barclays Capital Aggregate Bond Index Newfleet Multi-Sector Income (MINC) 1-Mo -0.06 Market Price(%) 0.00 Ultra Low Duration Inception 0.04 NAV (%) -2.86 Barclays US Treasury Bill 1-3 Month Index Market Adaptive Unconstrained Income (MAUI) Market Price(%) Global Multi-Sector Barclays Capital Aggregate Bond Index YTD 0.02 Quarter-End Performance as of 12.31.2015 Bank Loan Pacific Asset Enhanced Floating Rate (FLRT) 3-Mo -0.08 Quarter-End Performance as of 12.31.2015 1-Mo 0.02 S&P / LSTA Leveraged Loan 100 Index Madrona Global Bond (FWDB) Month-End Performance as of 01.31.2016 -0.57 0.55 2.49 -0.32 -0.57 0.55 2.49 0.55 n/a 2.49 0.55 n/a 2.49 Risk/Return Characteristics vs Benchmark Fund Pacific Asset Enhanced Floating Rate (FLRT) As of 01.31.2016 Gross/Net Net Expense Inception Beta Expense Ratio Fee Cap* 2.18.15 1.43%/1.12% 1.10% 0.76 S&P / LSTA Leveraged Loan 100 Index Madrona Global Bond (FWDB) Barclays Capital Aggregate Bond Index Sharp Ratio 0.68 -2.25 Up Capture Ratio 72.05 Down Capture Max Drawdown Ratio (%) 67.88 -4.13 100.00 1.92 n/a -4.48 0.00 -3.59 100.00 100.00 -6.04 0.57 28.85 4.16 2.40 11.58 0.63 0.82 53.92 50.01 -7.48 1.00 100.00 3.91 3.11 15.17 0.00 1.14 100.00 100.00 -4.87 01.14.14 0.73%/0.35% 0.35% 0.24 0.04 0.31 0.05 0.10 0.01 0.03 -24.31 -114.83 -0.36 1.00 100.00 0.02 0.02 0.05 0.00 -1.41 100.00 100.00 -0.01 11.30.10 1.23%/1.23% n/a 0.73 53.32 4.62 -0.29 -1.51 -3.77 -0.12 70.26 91.45 -31.24 1.00 100.00 4.64 4.90 28.08 0.00 1.53 100.00 100.00 -12.01 07.08.14 5.72%/1.11% 0.99% -0.52 2.57 13.22 -4.30 -6.65 -2.45 -0.47 -64.67 -51.17 -9.35 1.00 100.00 4.07 2.68 4.23 0.00 0.95 100.00 100.00 -2.80 03.19.13 0.82%/0.75% 0.75% 0.23 56.80 1.24 1.56 4.54 1.02 1.77 25.14 19.82 -2.48 1.00 100.00 4.01 2.07 6.05 0.00 0.73 100.00 100.00 -4.87 03.04.14 1.08%/1.08% n/a 0.45 36.74 2.88 -1.21 -2.31 -2.61 -0.63 37.46 50.20 -5.52 1.00 100.00 3.91 3.11 6.04 0.00 1.15 100.00 100.00 -2.80 Barclays Capital Aggregate Bond Index YieldPro (YPRO) Sharpe Alpha 1.00 Barclays Capital Aggregate Bond Index Newfleet Multi-Sector Income (MINC) 1.92 Cumulative Return (%) -2.80 0.95% Barclays US High Yield Index Market Adaptive Unconstrained Income (MAUI) 60.40 Annualized Return (%) n/a 1.39%/1.35% Barclays US Treasury Bill 1-3 Month Index Peritus High Yield (HYLD) Std Deviation 06.20.11 Barclays Capital Aggregate Bond Index Sage Core Reserves (HOLD) R-Squared Performance data quoted represents past performance and is no guarantee of future results. Current performance may be lower or higher than the performance data quoted. Investment return and principal value will fluctuate so that an investor’s shares, when redeemed, may be worth more or less than original cost. Returns less than one year are not annualized. *The Advisor has contractually agreed to waive its management fees in the amounts shown at least through the respective fee waiver expiration dates as shown below and for an indefinite period thereafter, subject to annual reapproval of the agreement by the Board of Trustees: Pacific Asset Enhanced Floating Rate ETF, November 1, 2016; Madrona Global Bond ETF, November 1, 2016; Sage Core Reserves, November 1, 2016; Peritus High Yield ETF, November 1, 2016; Market Adaptive Unconstrained Income ETF, November 1, 2016; Newfleet Multi-Sector Income ETF, November 1, 2016; YieldPro ETF, November 1, 2016. Page 4 .
Month-End Performance as of 01.31.2016 Multi-Asset ETFs Month-End Performance as of 01.31.2016 NAV (%) Fund Quarter-End Performance as of 12.31.2015 Market Price(%) Quarter-End Performance as of 12.31.2015 NAV (%) Market Price(%) Exposure 3-Mo YTD Inception 1-Mo 3-Mo YTD Inception 1-Yr 3-Yr Inception 1-Yr 3-Yr Inception Impact Investing Global Echo (GIVE) 1-Mo 5.82 -3.50 -4.46 -3.50 4.69 -4.73 -5.56 -4.73 4.31 -3.62 5.95 5.85 -3.86 5.75 50:50 MSCI World /Barclays Cap. Aggregate Blend -2.30 -3.69 -2.30 6.11 -2.30 -3.69 -2.30 6.11 0.08 5.63 6.95 0.08 5.63 6.95 MSCI World Index -5.98 -8.09 -5.98 9.82 -5.98 -8.09 -5.98 9.82 -0.87 9.63 11.96 -0.87 9.63 11.96 Barclays Capital Aggregate Bond Index 1.38 0.78 1.38 2.17 1.38 0.78 1.38 2.17 0.55 1.44 1.84 0.55 1.44 1.84 -0.40 -1.61 -0.40 -0.67 0.90 -1.55 0.90 -0.67 -8.77 -1.49 -0.61 -7.44 -1.12 -0.85 -4.96 -6.18 -4.96 12.15 -4.96 -6.18 -4.96 12.15 1.38 15.13 13.47 1.38 15.13 13.47 -6.05 -8.75 -6.05 1.37 -5.69 -8.77 -5.69 1.38 -7.40 2.77 2.80 -7.15 2.95 2.73 -4.96 -6.18 -4.96 11.66 -4.96 -6.18 -4.96 11.66 1.38 15.13 13.16 1.38 15.13 13.16 -3.54 -5.23 -3.54 0.27 -3.13 -5.19 -3.13 0.27 -1.96 1.73 1.39 -2.31 1.62 1.26 -5.98 -8.09 -5.98 6.64 -5.98 -8.09 -5.98 6.64 -0.87 9.63 8.84 -0.87 9.63 8.84 Discretionary Tactical Morgan Creek Global Tactical (GTAA) S&P 500 Index Meidell Tactical Advantage (MATH) Quantitative Tactical S&P 500 Index STAR Global Buy-Write (VEGA) Total Return MSCI World Index Risk/Return Characteristics vs Benchmark Fund Global Echo (GIVE)* As of 01.31.2016 Gross/Net Net Expense Inception Beta Expense Ratio Fee Cap* 05.23.12 1.50%/1.50% n/a 1.24 R-Squared Std Deviation 69.47 9.99 Annualized Return (%) 4.67 Cumulative Return (%) 18.37 Sharpe Alpha Sharp Ratio -2.62 0.68 Up Capture Ratio 121.87 Down Capture Max Drawdown Ratio (%) 130.67 -11.69 50:50 MSCI World /Barclays Cap. Aggregate Blend 1.00 100.00 6.59 6.11 24.47 0.00 1.30 100.00 100.00 -8.19 MSCI World Index 1.99 92.55 13.94 9.83 41.34 -2.02 1.04 193.89 200.57 -16.76 Barclays Capital Aggregate Bond Index Morgan Creek Global Tactical (GTAA) 0.02 0.11 3.77 2.18 8.27 2.02 0.82 6.26 0.32 -4.87 10.25.10 2.47%/1.49% 1.25% 0.44 62.67 10.38 -0.67 -3.50 -5.92 -0.10 47.04 54.72 -15.39 1.00 100.00 18.66 12.15 82.96 0.00 0.96 100.00 100.00 -18.64 06.22.11 2.12%/1.48% 1.35% 0.49 54.73 12.60 1.37 6.48 -4.11 0.15 59.04 65.41 -19.46 1.00 100.00 19.14 11.66 66.30 0.00 0.90 100.00 100.00 -18.38 09.17.12 2.17%/2.15% 1.85% 0.64 75.74 9.93 0.27 0.93 -4.28 0.03 56.92 62.94 -11.10 1.00 100.00 13.51 7.23 26.51 0.00 0.78 100.00 100.00 -16.50 S&P 500 Index Meidell Tactical Advantage (MATH) S&P 500 Index Star Global Buy-Write (VEGA) MSCI World Index Performance data quoted represents past performance and is no guarantee of future results. Current performance may be lower or higher than the performance data quoted.
Investment return and principal value will fluctuate so that an investor’s shares, when redeemed, may be worth more or less than original cost. Returns less than one year are not annualized. **The Advisor has contractually agreed to waive its management fees in the amounts shown at least through the respective fee waiver expiration dates as shown below and for an indefinite period thereafter, subject to annual reapproval of the agreement by the Board of Trustees: Global Echo ETF November 1, 2016; Morgan Creek Global Tactical ETF, November 1, 2016; Meidell Tactical Advantage ETF, November 1, 2016;STAR Global Buy-Write ETF, November 1, 2016. Page 5 . Month-End Performance as of 01.31.2016 Commodity ETFs Month-End Performance as of 01.31.2016 NAV (%) Fund Market Price(%) Exposure 1-Mo 3-Mo YTD Inception 1-Mo Gartman Gold/Euro (GEUR) Currency Hedged 5.75 -0.79 5.75 3.57 Gartman Gold/Yen (GYEN) Currency Hedged 6.15 -2.47 6.15 0.27 4.66 -2.67 4.66 -7.15 Spot price of Gold Quarter-End Performance as of 12.31.2015 Quarter-End Performance as of 12.31.2015 NAV (%) 3-Mo YTD Inception 6.58 0.09 6.58 7.28 -2.06 7.28 4.66 -2.67 4.66 Market Price(%) 1-Yr 3-Yr Inception 1-Yr 3-Yr 3.66 -1.65 n/a 0.42 -11.14 n/a -7.15 -11.42 n/a -9.68 Inception 0.70 -2.15 n/a 0.37 -2.85 -12.11 n/a -3.24 -11.42 n/a -9.68 Risk/Return Characteristics vs Benchmark Gartman Gold/Euro (GEUR) As of 01.31.2016 Gross/Net Net Expense Inception Beta Expense Ratio Fee Cap* 02.11.14 2.21%/0.65% 0.65% 0.68 Gartman Gold/Yen (GYEN) 02.11.14 Fund Spot price of Gold 1.99%/0.65% 0.65% Annualized Return (%) 3.57 Cumulative Return (%) 7.15 Sharpe Alpha Sharp Ratio 9.02 0.27 Up Capture Ratio 64.15 Down Capture Max Drawdown Ratio (%) 54.63 -16.70 R-Squared Std Deviation 34.69 18.90 0.62 37.16 16.74 0.27 0.52 5.15 0.02 59.80 54.49 -18.94 1.00 100.00 16.33 -7.07 -13.44 0.00 -0.61 100.00 100.00 -24.23 Performance data quoted represents past performance and is no guarantee of future results. Current performance may be lower or higher than the performance data quoted. Investment return and principal value will fluctuate so that an investor’s shares, when redeemed, may be worth more or less than original cost. Returns less than one year are not annualized. *The Advisor has contractually agreed to waive its management fees in the amounts shown at least through the respective fee waiver expiration dates as shown below and for an indefinite period thereafter, subject to annual reapproval of the agreement by the Board of Trustees: Gartman Gold/Euro ETF, November 1, 2016; ETF Gartman Gold/Yen ETF, November 1, 2016. Page 6 .
The S&P 500 Index is a broad-based, unmanaged measurement of changes in stock market conditions based on the average of 500 widely held common stocks. The Russell 3000 Index measures the performance of the largest 3000 U.S. companies representing approximately 98% of the investable U.S. equity market. The MSCI EAFE Index is an unmanaged free float-adjusted market capitalization index that is designed to measure the equity market performance of developed markets, excluding the US & Canada. The BNY Mellon Classic ADR Index combines the over the counter (OTC) traded ADRs with exchange-listed ADRs bringing transparency to the available universe of American Depositary Receipts, including those issued by many of the world’s premier companies. The MSCI World Index is a free float-adjusted market capitalization weighted index that is designed to measure the equity market performance of developed markets. The MSCI AC World Index is an unmanaged free float-adjusted market capitalization weighted index that is designed to measure the equity market performance of developed and emerging markets. The HFRI Equity Hedge (Total) Index is a fund-weighted index of select hedge funds focusing on Equity Hedge strategies. Equity Hedge investing consists of a core holding of long equities hedged at all times with short sales of stocks and/or stock index options. The Barclays Capital Aggregate Bond Index measures the performance of the U.S.
investment grade bond market. The Barclays 1-3 Month U.S. Treasury Bill Index includes all publicly issued zero-coupon U.S. Treasury Bills that have a remaining maturity of less than 3 months and more than 1 month, are rated investment grade, and have $250 million or more of outstanding face value. The Barclays U.S.
High Yield Index is an unmanaged index considered representative of the universe of U.S. fixed rate, non investment grade debt. The Spot price of Gold is valued on the basis of each day’s 3pm London time announced price for an ounce of gold set by five market making members of the London Bullion Market Association. One cannot invest directly into an index. A long position is the purchase of an investment with the expectation that it will rise in value. A short position is the sale of a borrowed investment with the expectation that it will decline in value. Duration measures (in years) the sensitivity of the price of a fixed-income investment to a 1% change in interest rates. The Beta is a measure of the volatility, or systematic risk, of a security or a portfolio in comparison to the market as a whole.
Beta is used in the capital asset pricing model (CAPM), a model that calculates the expected return of an asset based on its beta and expected market returns. R-Squared is a statistical measure that represents the percentage of a fund or security’s movements that can be explained by movements in a benchmark index. Standard Deviation is a measure of the dispersion of a set of data from its mean. The more spread apart the data, the higher the deviation.
Standard deviation is calculated as the square root of variance. An Annualized Return is the return an investment provides over a period of time, expressed as a time-weighted annual percentage. Sources of returns can include dividends, returns of capital and capital appreciation. The rate of annual return is measured against the initial amount of the investment and represents a geometric mean rather than a simple arithmetic mean. A Cumulative Return is the aggregate amount that an investment has gained or lost over time, independent of the period of time involved. Presented as a percentage, the cumulative return is the raw mathematical return. The Alpha is a measure of performance on a risk-adjusted basis.
Alpha takes the volatility (price risk) of a fund and compares its risk-adjusted performance to a benchmark index. The excess return of the fund relative to the return of the benchmark index is a fund’s alpha. The Sharpe Ratio is developed by Nobel laureate William F. Sharpe to measure risk-adjusted performance. The Sharpe ratio is calculated by subtracting the risk-free rate - such as that of the 10-year U.S.
Treasury bond - from the rate of return for a portfolio and dividing the result by the standard deviation of the portfolio returns. The Up-Market Capture Ratio is a statistical measure of an investment manager’s overall performance in up-markets. The up-market capture ratio is used to evaluate how well an investment manager performed relative to an index during periods when that index has risen. The ratio is calculated by dividing the manager’s returns by the returns of the index during the up-market, and multiplying that factor by 100. The Down-market Capture Ratio is a statistical measure of an investment manager’s overall performance in down-markets. The down-market capture ratio is used to evaluate how well or poorly an investment manager performed relative to an index during periods when that index has dropped. The ratio is calculated by dividing the manager’s returns by the returns of the index during the down-market and multiplying that factor by 100. The Maximum Drawdown is a peak-to-trough decline during a specific record period of an investment, fund or commodity. A drawdown is usually quoted as the percentage between the peak and the trough. An investment in the Funds is subject to risk, including the possible loss of principal amount invested. Derivatives, as associated with FLRT, GEUR, GYEN, QEH, VEGA, may be riskier and more sensitive to changes in economic or market conditions than other types of investments and could result in losses that significantly exceed the Fund’s original investment.
GIVE, HDGB, HDGE, QEH and VEGA may participate in leveraged transactions to include selling securities short which creates the risk of magnified capital losses. Under certain market conditions, short sales can increase the volatility and decrease the liquidity of certain securities or positions and may lower the Fund’s return or result in a loss. Writing and purchasing call and put options are specialized activities and entail greater than ordinary investment risk when considering VEGA.
AADR,DIVI and FWDI may use ADRs which are subject to the risk of change in political or economic conditions and exchange rates in foreign currencies. HYLD includes high yield risk, which are lower rated bonds involve a greater degree of risk than investment grade bonds in return for higher yield potential. As it pertains to DIVI, Real Estate Investment Trust Risk (“REITs”) will be subject to the risks associated with the direct ownership or real estate such as fluctuation in value of property and defaults by borrowers or tenants.
DIVI may invest in Exchange-Traded Vehicles which subjects the Fund to the risks associated with such vehicle’s investments or reference asset in the case of ETNs, including the possibility that value of the securities could decrease. HOLD’s investment in fixed income securities will change in value in response to interest rate changes and other factors, such as the perception of the issuer’s creditworthiness. The risks associated with each Fund include the risks associated with the underlying ETFs, which can result in higher volatility, and are detailed in each Fund’s prospectus.
These Funds may not be suitable for all investors. Shares are bought and sold at market price (closing price) not NAV and are not individually redeemed from the Fund. Market price returns are based on the midpoint of the bid/ask spread at 4:00pm Eastern Time (when NAV is normally determined), and do not represent the return you would receive if you traded at other times. Holdings and allocations are subject to risks and to change. Before investing you should carefully consider the Fund’s investment objectives, risks, charges and expenses.
This and other information is in the prospectus, a copy of which may be obtained by visiting the Fund’s website at www.AdvisorShares.com. Please read the prospectus carefully before you invest. Foreside Fund Services, LLC, distributor. For more information, call AdvisorShares at 1.877.843.3831 or email info@advisorshares.com. For more information, call AdvisorShares at 1.877.843.3831 or visit www.advisorshares.com. www.advisorshares.com • 4800 Montgomery Lane, Suite 150 • Bethesda, Maryland 20814 Page 7 .


