Global Catastrophe Recap - Impact Forecasting - Aon Benfield Analytics - December 2015
AON Hewitt


Description
Aon Benfield
Analytics | Impact Forecasting
Global Catastrophe Recap
December 2015
Risk. Reinsurance. Human Resources.
. Aon Benfield
Analytics | Impact Forecasting
Table of Contents
Executive Summary
3
United States
4
Remainder of North America
4
South America
5
Europe
5
Africa
6
Asia
6
Oceania
7
Appendix
8
Contact Information
Global Catastrophe Recap: December 2015
16
2
. Aon Benfield
Analytics | Impact Forecasting
Executive Summary

Powerful storm systems lead to violent tornadoes & historic flooding in the United States

Relentless rainfall and windstorms lead to more than USD2.0 billion insurance bill in the UK

El Niño-enhanced rainfall leads to major flooding across portions of South America
A complex weather pattern across the United States during the final 10 days of 2015 led to extensive
damage as a result of violent tornadoes, historic flooding, record snowfall, hail, and damaging winds.
At least 64 people were killed. Parts of the Midwest, Plains, Southeast, Rockies and Northeast were all
impacted by the inclement weather, though the states of Missouri, Texas, Illinois, Arkansas, Oklahoma,
Mississippi, Tennessee, Alabama, Kentucky and Indiana were among the hardest-hit. In total, at least 58
tornadoes touched down (including two rated EF4). Catastrophic tornado damage was noted just east of
the Dallas, TX metro region.
Relentless rainfall also led to historic flooding in the Mississippi Valley and Midwest that saw rivers cresting at or above historic heights previously set in 1993, 2008 and 2011. Additionally, the period was marked by record snowfall and ice that led to extensive travel disruption. Preliminary estimates suggest that total economic losses in the United States during December will exceed USD4.0 billion. Insured losses are likely to approach or exceed USD2.0 billion, with the Insurance Council of Texas reporting losses in the Dallas metro area alone at USD1.2 billion. Relentless rainfall from a series of North Atlantic storm systems led to extensive flooding across the United Kingdom and Ireland throughout the month. The arrival of windstorms Ted and Eckard – also known locally as Desmond and Frank – brought even more flood and wind damage.
The hardest-hit areas included a large swath of southern Scotland, northern England, and Wales, where thousands of homes endured varying levels of flood inundation. Various published reports, including from the Association of British Insurers, indicated that preliminary insured losses in the UK were expected to exceed GBP1.5 billion (USD2.2 billion). Overall economic losses were expected to be even higher and approach GBP2.8 billion (USD4.0 billion). Elsewhere, portions of Argentina, Paraguay, Uruguay and Brazil were inundated throughout December following prolonged periods of heavy rainfall that prompted the worst floods in at least 50 years.
At least 16 people were killed. Tens of thousands of homes were damaged or destroyed in river flooding and landslides as El Niño-enhanced rainfall occurred. Preliminary overall economic losses were estimated to exceed USD200 million. Typhoon Melor made multiple landfalls in the Philippines, killing at least 42 people and injuring 24 others. The storm brought torrential rainfall and gusty winds as it tracked through part of the archipelago at Category 4 intensity.
Nearly 280,000 homes were damaged or destroyed. Philippines’ National Disaster Risk Reduction and Management Center reported economic damages to agriculture and infrastructure alone at PHP6.5 billion (USD140 million). A wildfire burned in Australia’s state of Victoria and left serious damage on December 25, destroying at least 116 homes. The Lorne Fire destroyed 98 homes in Wye River and 18 at Separation Creek, which led to the Insurance Council of Australia declaring an insurance catastrophe.
Preliminary insured losses were listed at AUD53 million (USD38 million). Total economic losses are expected to top USD100 million. The Ethiopian National Risk Management Coordination Commission announced that it sought USD1.4 billion to deal with its worst drought in 30 years. At least 10 million people were affected. Global Catastrophe Recap: December 2015 3 .
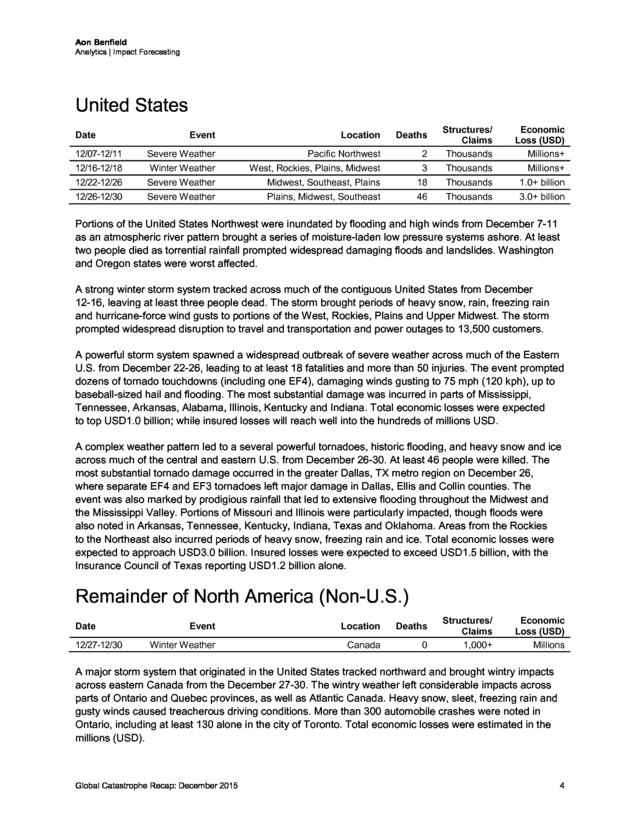
Aon Benfield Analytics | Impact Forecasting United States 12/07-12/11 Severe Weather Pacific Northwest 2 Structures/ Claims Thousands 12/16-12/18 Winter Weather West, Rockies, Plains, Midwest 3 Thousands Millions+ 12/22-12/26 Severe Weather Midwest, Southeast, Plains 18 Thousands 1.0+ billion 12/26-12/30 Severe Weather Plains, Midwest, Southeast 46 Thousands 3.0+ billion Date Event Location Deaths Economic Loss (USD) Millions+ Portions of the United States Northwest were inundated by flooding and high winds from December 7-11 as an atmospheric river pattern brought a series of moisture-laden low pressure systems ashore. At least two people died as torrential rainfall prompted widespread damaging floods and landslides. Washington and Oregon states were worst affected. A strong winter storm system tracked across much of the contiguous United States from December 12-16, leaving at least three people dead. The storm brought periods of heavy snow, rain, freezing rain and hurricane-force wind gusts to portions of the West, Rockies, Plains and Upper Midwest.
The storm prompted widespread disruption to travel and transportation and power outages to 13,500 customers. A powerful storm system spawned a widespread outbreak of severe weather across much of the Eastern U.S. from December 22-26, leading to at least 18 fatalities and more than 50 injuries. The event prompted dozens of tornado touchdowns (including one EF4), damaging winds gusting to 75 mph (120 kph), up to baseball-sized hail and flooding.
The most substantial damage was incurred in parts of Mississippi, Tennessee, Arkansas, Alabama, Illinois, Kentucky and Indiana. Total economic losses were expected to top USD1.0 billion; while insured losses will reach well into the hundreds of millions USD. A complex weather pattern led to a several powerful tornadoes, historic flooding, and heavy snow and ice across much of the central and eastern U.S. from December 26-30.
At least 46 people were killed. The most substantial tornado damage occurred in the greater Dallas, TX metro region on December 26, where separate EF4 and EF3 tornadoes left major damage in Dallas, Ellis and Collin counties. The event was also marked by prodigious rainfall that led to extensive flooding throughout the Midwest and the Mississippi Valley.
Portions of Missouri and Illinois were particularly impacted, though floods were also noted in Arkansas, Tennessee, Kentucky, Indiana, Texas and Oklahoma. Areas from the Rockies to the Northeast also incurred periods of heavy snow, freezing rain and ice. Total economic losses were expected to approach USD3.0 billion.
Insured losses were expected to exceed USD1.5 billion, with the Insurance Council of Texas reporting USD1.2 billion alone. Remainder of North America (Non-U.S.) Date 12/27-12/30 Event Location Deaths Winter Weather Canada 0 Structures/ Claims 1,000+ Economic Loss (USD) Millions A major storm system that originated in the United States tracked northward and brought wintry impacts across eastern Canada from the December 27-30. The wintry weather left considerable impacts across parts of Ontario and Quebec provinces, as well as Atlantic Canada. Heavy snow, sleet, freezing rain and gusty winds caused treacherous driving conditions.
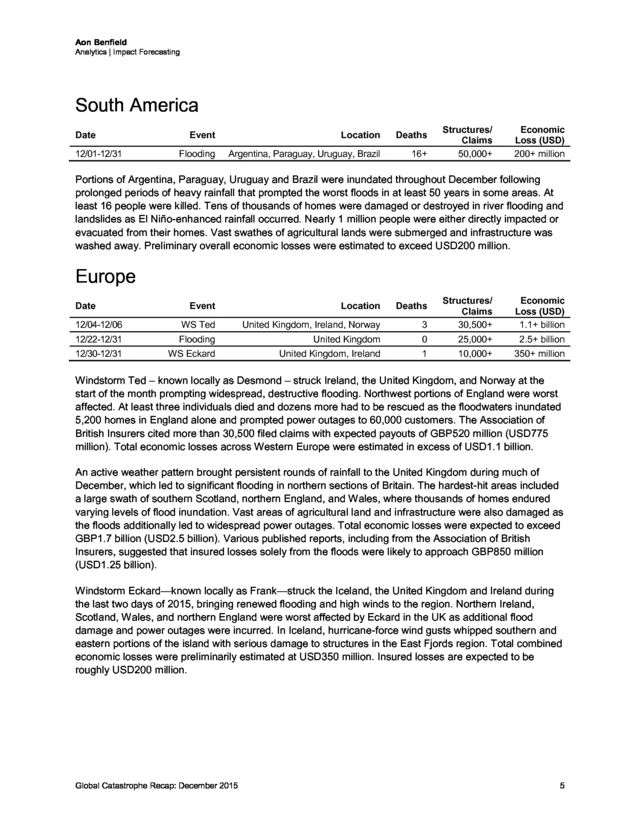
More than 300 automobile crashes were noted in Ontario, including at least 130 alone in the city of Toronto. Total economic losses were estimated in the millions (USD). Global Catastrophe Recap: December 2015 4 . Aon Benfield Analytics | Impact Forecasting South America Date 12/01-12/31 Event Location Deaths Flooding Argentina, Paraguay, Uruguay, Brazil 16+ Structures/ Claims 50,000+ Economic Loss (USD) 200+ million Portions of Argentina, Paraguay, Uruguay and Brazil were inundated throughout December following prolonged periods of heavy rainfall that prompted the worst floods in at least 50 years in some areas. At least 16 people were killed. Tens of thousands of homes were damaged or destroyed in river flooding and landslides as El Niño-enhanced rainfall occurred. Nearly 1 million people were either directly impacted or evacuated from their homes.
Vast swathes of agricultural lands were submerged and infrastructure was washed away. Preliminary overall economic losses were estimated to exceed USD200 million. Europe Date 3 Structures/ Claims 30,500+ Economic Loss (USD) 1.1+ billion 0 25,000+ 2.5+ billion 1 10,000+ 350+ million Event Location Deaths 12/04-12/06 WS Ted United Kingdom, Ireland, Norway 12/22-12/31 Flooding United Kingdom 12/30-12/31 WS Eckard United Kingdom, Ireland Windstorm Ted – known locally as Desmond – struck Ireland, the United Kingdom, and Norway at the start of the month prompting widespread, destructive flooding. Northwest portions of England were worst affected.
At least three individuals died and dozens more had to be rescued as the floodwaters inundated 5,200 homes in England alone and prompted power outages to 60,000 customers. The Association of British Insurers cited more than 30,500 filed claims with expected payouts of GBP520 million (USD775 million). Total economic losses across Western Europe were estimated in excess of USD1.1 billion. An active weather pattern brought persistent rounds of rainfall to the United Kingdom during much of December, which led to significant flooding in northern sections of Britain.
The hardest-hit areas included a large swath of southern Scotland, northern England, and Wales, where thousands of homes endured varying levels of flood inundation. Vast areas of agricultural land and infrastructure were also damaged as the floods additionally led to widespread power outages. Total economic losses were expected to exceed GBP1.7 billion (USD2.5 billion).
Various published reports, including from the Association of British Insurers, suggested that insured losses solely from the floods were likely to approach GBP850 million (USD1.25 billion). Windstorm Eckard—known locally as Frank—struck the Iceland, the United Kingdom and Ireland during the last two days of 2015, bringing renewed flooding and high winds to the region. Northern Ireland, Scotland, Wales, and northern England were worst affected by Eckard in the UK as additional flood damage and power outages were incurred. In Iceland, hurricane-force wind gusts whipped southern and eastern portions of the island with serious damage to structures in the East Fjords region.
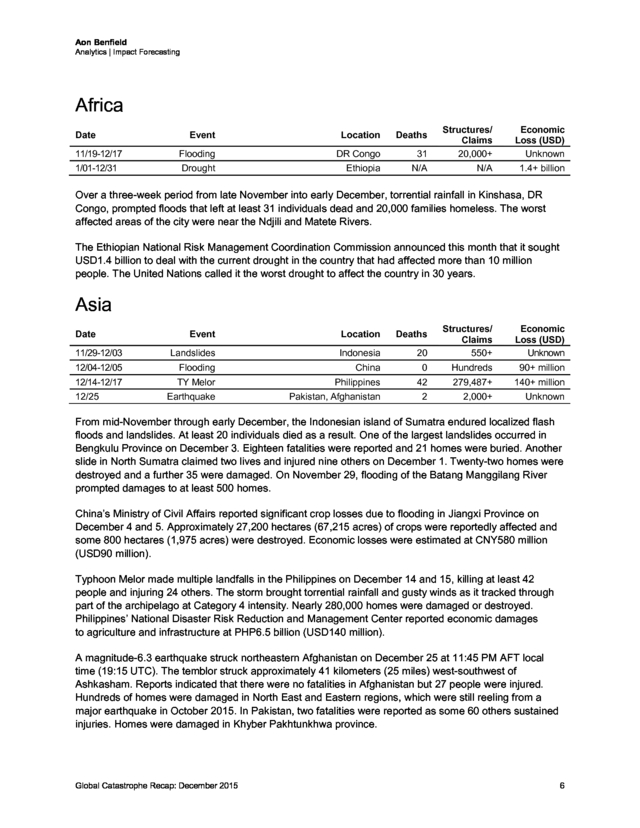
Total combined economic losses were preliminarily estimated at USD350 million. Insured losses are expected to be roughly USD200 million. Global Catastrophe Recap: December 2015 5 . Aon Benfield Analytics | Impact Forecasting Africa Date Event Location 11/19-12/17 Flooding DR Congo 1/01-12/31 Drought Ethiopia 31 Structures/ Claims 20,000+ Economic Loss (USD) Unknown N/A N/A 1.4+ billion Deaths Over a three-week period from late November into early December, torrential rainfall in Kinshasa, DR Congo, prompted floods that left at least 31 individuals dead and 20,000 families homeless. The worst affected areas of the city were near the Ndjili and Matete Rivers. The Ethiopian National Risk Management Coordination Commission announced this month that it sought USD1.4 billion to deal with the current drought in the country that had affected more than 10 million people. The United Nations called it the worst drought to affect the country in 30 years. Asia Date 20 Structures/ Claims 550+ Economic Loss (USD) Unknown 0 Hundreds 90+ million Philippines 42 279,487+ 140+ million Pakistan, Afghanistan 2 2,000+ Unknown Event Location Deaths 11/29-12/03 Landslides Indonesia 12/04-12/05 Flooding China TY Melor Earthquake 12/14-12/17 12/25 From mid-November through early December, the Indonesian island of Sumatra endured localized flash floods and landslides. At least 20 individuals died as a result.
One of the largest landslides occurred in Bengkulu Province on December 3. Eighteen fatalities were reported and 21 homes were buried. Another slide in North Sumatra claimed two lives and injured nine others on December 1.
Twenty-two homes were destroyed and a further 35 were damaged. On November 29, flooding of the Batang Manggilang River prompted damages to at least 500 homes. China’s Ministry of Civil Affairs reported significant crop losses due to flooding in Jiangxi Province on December 4 and 5. Approximately 27,200 hectares (67,215 acres) of crops were reportedly affected and some 800 hectares (1,975 acres) were destroyed.
Economic losses were estimated at CNY580 million (USD90 million). Typhoon Melor made multiple landfalls in the Philippines on December 14 and 15, killing at least 42 people and injuring 24 others. The storm brought torrential rainfall and gusty winds as it tracked through part of the archipelago at Category 4 intensity. Nearly 280,000 homes were damaged or destroyed. Philippines’ National Disaster Risk Reduction and Management Center reported economic damages to agriculture and infrastructure at PHP6.5 billion (USD140 million). A magnitude-6.3 earthquake struck northeastern Afghanistan on December 25 at 11:45 PM AFT local time (19:15 UTC).
The temblor struck approximately 41 kilometers (25 miles) west-southwest of Ashkasham. Reports indicated that there were no fatalities in Afghanistan but 27 people were injured. Hundreds of homes were damaged in North East and Eastern regions, which were still reeling from a major earthquake in October 2015. In Pakistan, two fatalities were reported as some 60 others sustained injuries.
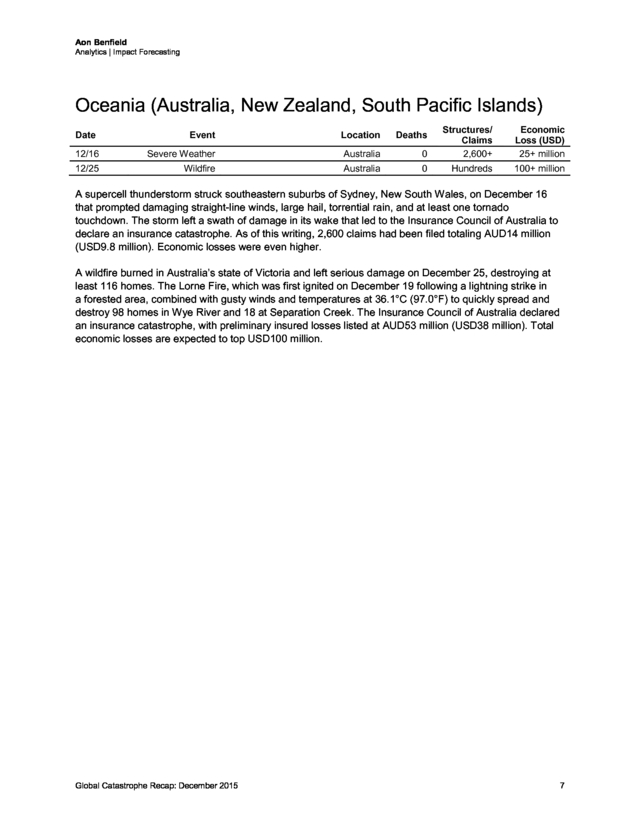
Homes were damaged in Khyber Pakhtunkhwa province. Global Catastrophe Recap: December 2015 6 . Aon Benfield Analytics | Impact Forecasting Oceania (Australia, New Zealand, South Pacific Islands) Date 0 Structures/ Claims 2,600+ Economic Loss (USD) 25+ million 0 Hundreds 100+ million Event Location Deaths 12/16 Severe Weather Australia 12/25 Wildfire Australia A supercell thunderstorm struck southeastern suburbs of Sydney, New South Wales, on December 16 that prompted damaging straight-line winds, large hail, torrential rain, and at least one tornado touchdown. The storm left a swath of damage in its wake that led to the Insurance Council of Australia to declare an insurance catastrophe. As of this writing, 2,600 claims had been filed totaling AUD14 million (USD9.8 million). Economic losses were even higher. A wildfire burned in Australia’s state of Victoria and left serious damage on December 25, destroying at least 116 homes.
The Lorne Fire, which was first ignited on December 19 following a lightning strike in a forested area, combined with gusty winds and temperatures at 36.1°C (97.0°F) to quickly spread and destroy 98 homes in Wye River and 18 at Separation Creek. The Insurance Council of Australia declared an insurance catastrophe, with preliminary insured losses listed at AUD53 million (USD38 million). Total economic losses are expected to top USD100 million. Global Catastrophe Recap: December 2015 7 .
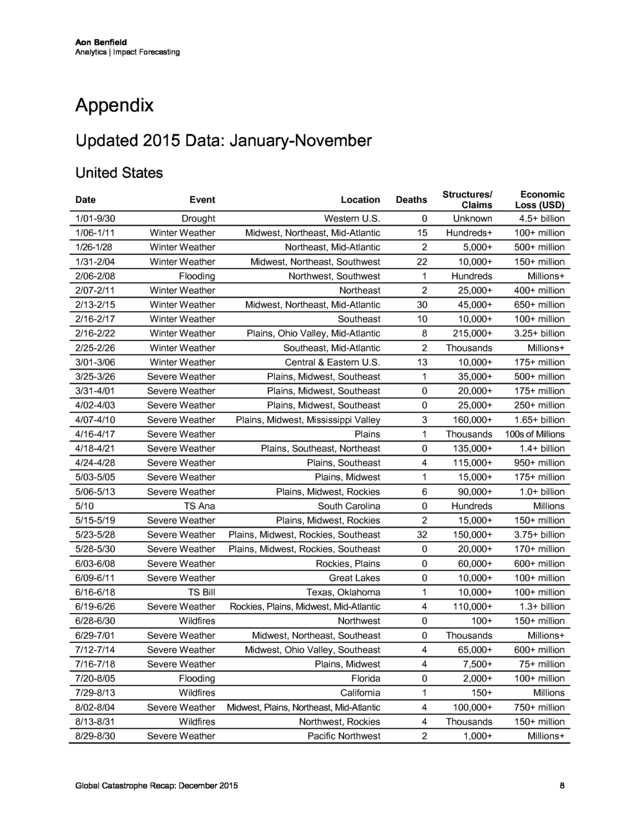
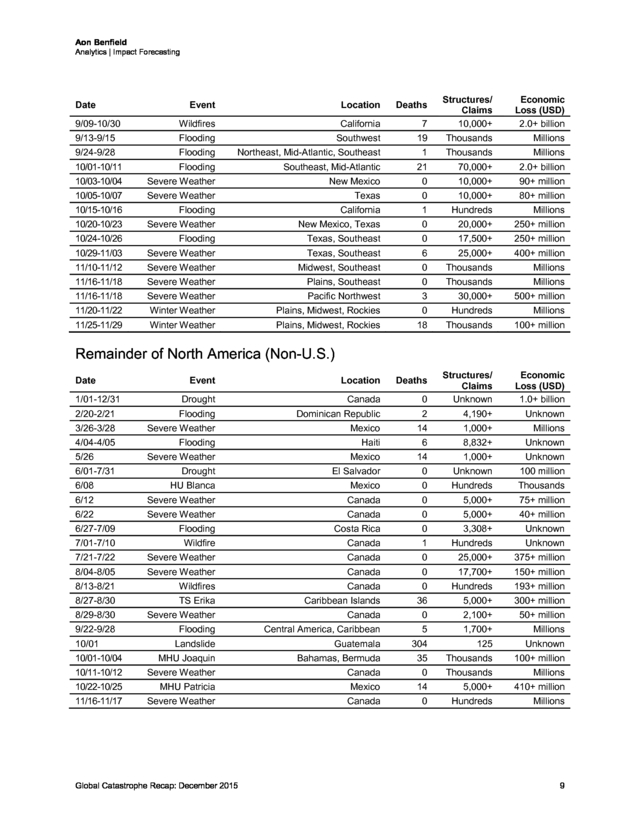
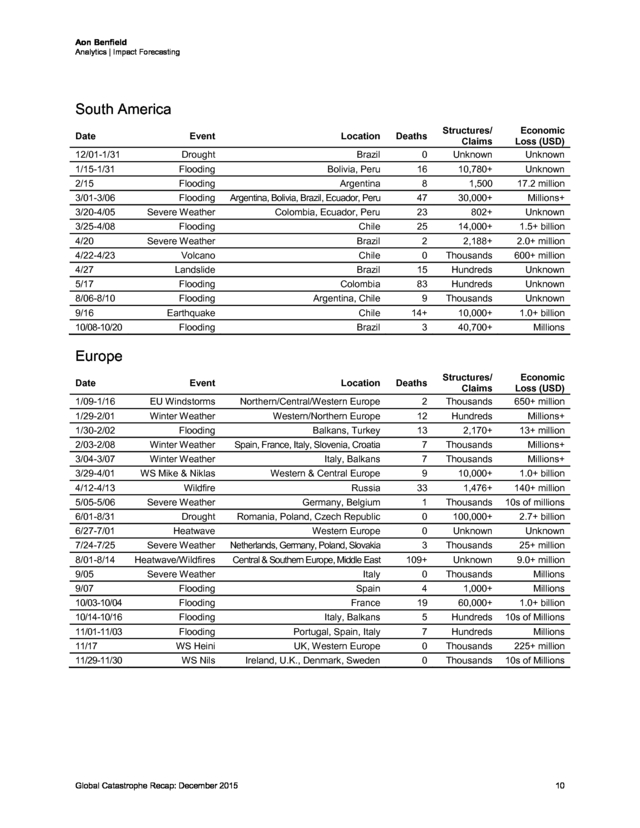
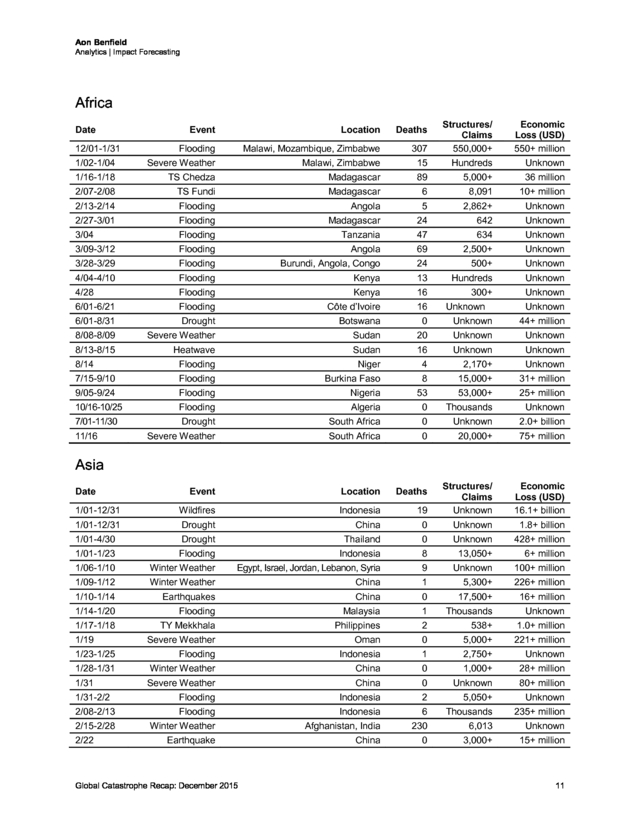
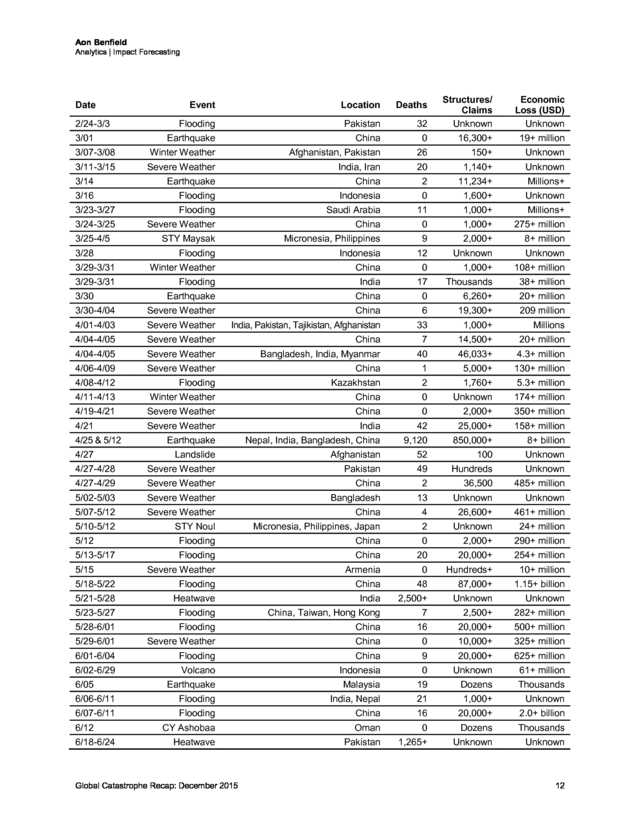
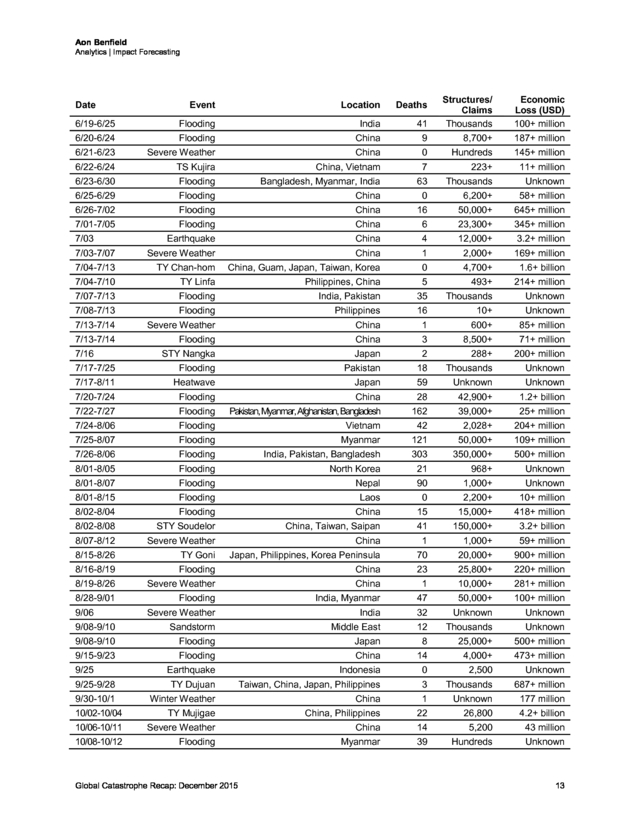
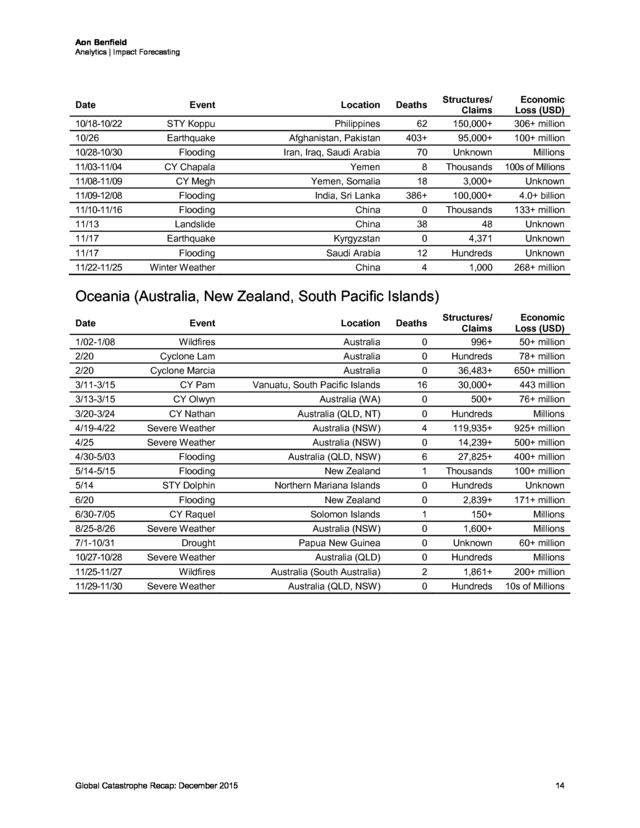
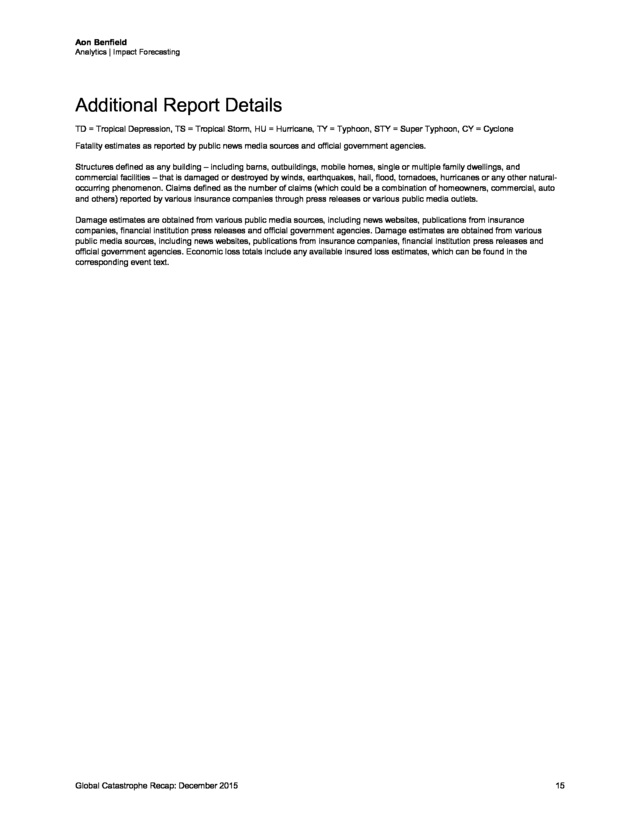
Aon Benfield Analytics | Impact Forecasting Appendix Updated 2015 Data: January-November United States 1/01-9/30 Drought Western U.S. 0 Structures/ Claims Unknown 1/06-1/11 Winter Weather Midwest, Northeast, Mid-Atlantic 15 Hundreds+ 100+ million 1/26-1/28 Winter Weather Northeast, Mid-Atlantic 2 5,000+ 500+ million 1/31-2/04 Winter Weather Midwest, Northeast, Southwest 22 10,000+ 150+ million 2/06-2/08 Flooding Northwest, Southwest 1 Hundreds Millions+ 2/07-2/11 Winter Weather Northeast 2 25,000+ 400+ million 2/13-2/15 Winter Weather Midwest, Northeast, Mid-Atlantic 30 45,000+ 650+ million 2/16-2/17 Winter Weather Southeast 10 10,000+ 100+ million 2/16-2/22 Winter Weather Plains, Ohio Valley, Mid-Atlantic 8 215,000+ 3.25+ billion 2/25-2/26 Winter Weather Southeast, Mid-Atlantic 2 Thousands Millions+ Date Event Location Deaths Economic Loss (USD) 4.5+ billion 3/01-3/06 Winter Weather Central & Eastern U.S. 13 10,000+ 175+ million 3/25-3/26 Severe Weather Plains, Midwest, Southeast 1 35,000+ 500+ million 3/31-4/01 Severe Weather Plains, Midwest, Southeast 0 20,000+ 175+ million 4/02-4/03 Severe Weather Plains, Midwest, Southeast 0 25,000+ 250+ million 4/07-4/10 Severe Weather Plains, Midwest, Mississippi Valley 3 160,000+ 1.65+ billion 4/16-4/17 Severe Weather Plains 1 Thousands 100s of Millions 4/18-4/21 Severe Weather Plains, Southeast, Northeast 0 135,000+ 1.4+ billion 4/24-4/28 Severe Weather Plains, Southeast 4 115,000+ 950+ million 5/03-5/05 Severe Weather Plains, Midwest 1 15,000+ 175+ million 5/06-5/13 Severe Weather Plains, Midwest, Rockies 6 90,000+ 1.0+ billion TS Ana South Carolina 0 Hundreds Millions 5/10 5/15-5/19 Severe Weather Plains, Midwest, Rockies 2 15,000+ 150+ million 5/23-5/28 Severe Weather Plains, Midwest, Rockies, Southeast 32 150,000+ 3.75+ billion 5/28-5/30 Severe Weather Plains, Midwest, Rockies, Southeast 0 20,000+ 170+ million 6/03-6/08 Severe Weather Rockies, Plains 0 60,000+ 600+ million 6/09-6/11 Severe Weather Great Lakes 0 10,000+ 100+ million 6/16-6/18 TS Bill Texas, Oklahoma 1 10,000+ 100+ million 6/19-6/26 Severe Weather Rockies, Plains, Midwest, Mid-Atlantic 4 110,000+ 1.3+ billion 6/28-6/30 Wildfires Northwest 0 100+ 150+ million 6/29-7/01 Severe Weather Midwest, Northeast, Southeast 0 Thousands Millions+ 7/12-7/14 Severe Weather Midwest, Ohio Valley, Southeast 4 65,000+ 600+ million 7/16-7/18 Severe Weather Plains, Midwest 4 7,500+ 75+ million 7/20-8/05 Flooding Florida 0 2,000+ 100+ million 7/29-8/13 Wildfires California 1 150+ Millions 8/02-8/04 Severe Weather Midwest, Plains, Northeast, Mid-Atlantic 4 100,000+ 750+ million 8/13-8/31 Wildfires Northwest, Rockies 4 Thousands 150+ million 8/29-8/30 Severe Weather Pacific Northwest 2 1,000+ Millions+ Global Catastrophe Recap: December 2015 8 . Aon Benfield Analytics | Impact Forecasting 9/09-10/30 Wildfires California 7 Structures/ Claims 10,000+ 9/13-9/15 Flooding Southwest 19 Thousands 9/24-9/28 Flooding Northeast, Mid-Atlantic, Southeast 1 Thousands Millions 10/01-10/11 Flooding Southeast, Mid-Atlantic 21 70,000+ 2.0+ billion 10/03-10/04 Severe Weather New Mexico 0 10,000+ 90+ million 10/05-10/07 Severe Weather Texas 0 10,000+ 80+ million 10/15-10/16 Flooding California 1 Hundreds Millions 10/20-10/23 Severe Weather New Mexico, Texas 0 20,000+ 250+ million 10/24-10/26 Flooding Texas, Southeast 0 17,500+ 250+ million 10/29-11/03 Severe Weather Texas, Southeast 6 25,000+ 400+ million 11/10-11/12 Severe Weather Midwest, Southeast 0 Thousands Millions 11/16-11/18 Severe Weather Plains, Southeast 0 Thousands Millions 11/16-11/18 Severe Weather Pacific Northwest 3 30,000+ 500+ million 11/20-11/22 Winter Weather Plains, Midwest, Rockies 0 Hundreds Millions 11/25-11/29 Winter Weather Plains, Midwest, Rockies 18 Thousands 100+ million Economic Loss (USD) 1.0+ billion Unknown Date Event Location Deaths Economic Loss (USD) 2.0+ billion Millions Remainder of North America (Non-U.S.) 1/01-12/31 Drought Canada 0 Structures/ Claims Unknown 2/20-2/21 Flooding Dominican Republic 2 4,190+ 3/26-3/28 Severe Weather Mexico 14 1,000+ Millions 4/04-4/05 Flooding Haiti 6 8,832+ Unknown Severe Weather Mexico 14 1,000+ Unknown Date 5/26 6/01-7/31 Event Location Deaths Drought El Salvador 0 Unknown 100 million 6/08 HU Blanca Mexico 0 Hundreds Thousands 6/12 Severe Weather Canada 0 5,000+ 75+ million 6/22 Severe Weather Canada 0 5,000+ 40+ million 6/27-7/09 Flooding Costa Rica 0 3,308+ Unknown 7/01-7/10 Wildfire Canada 1 Hundreds Unknown 7/21-7/22 Severe Weather Canada 0 25,000+ 375+ million 8/04-8/05 Severe Weather Canada 0 17,700+ 150+ million 8/13-8/21 Wildfires Canada 0 Hundreds 193+ million 8/27-8/30 TS Erika Caribbean Islands 36 5,000+ 300+ million 8/29-8/30 Severe Weather Canada 0 2,100+ 50+ million 9/22-9/28 Flooding Central America, Caribbean 5 1,700+ Millions Landslide Guatemala 304 125 Unknown 10/01-10/04 MHU Joaquin Bahamas, Bermuda 35 Thousands 100+ million 10/11-10/12 Severe Weather Canada 0 Thousands Millions 10/01 10/22-10/25 MHU Patricia Mexico 14 5,000+ 410+ million 11/16-11/17 Severe Weather Canada 0 Hundreds Millions Global Catastrophe Recap: December 2015 9 . Aon Benfield Analytics | Impact Forecasting South America Event Location Deaths 12/01-1/31 Drought Brazil 0 Structures/ Claims Unknown 1/15-1/31 Flooding Bolivia, Peru 16 10,780+ Unknown 2/15 Flooding Argentina 8 1,500 17.2 million 3/01-3/06 Flooding Argentina, Bolivia, Brazil, Ecuador, Peru 47 30,000+ Millions+ 3/20-4/05 Severe Weather Colombia, Ecuador, Peru 23 802+ Unknown 3/25-4/08 Flooding Chile 25 14,000+ 1.5+ billion Severe Weather Brazil 2 2,188+ 2.0+ million Volcano Chile 0 Thousands 600+ million Date 4/20 4/22-4/23 Economic Loss (USD) Unknown 4/27 Landslide Brazil 15 Hundreds Unknown 5/17 Flooding Colombia 83 Hundreds Unknown 8/06-8/10 Flooding Argentina, Chile 9 Thousands Unknown Earthquake Chile 14+ 10,000+ 1.0+ billion Flooding Brazil 3 40,700+ Millions Event Location Deaths 1/09-1/16 EU Windstorms Northern/Central/Western Europe 2 Structures/ Claims Thousands Economic Loss (USD) 650+ million 1/29-2/01 Winter Weather Western/Northern Europe 12 Hundreds Millions+ 1/30-2/02 Flooding Balkans, Turkey 13 2,170+ 13+ million 2/03-2/08 Winter Weather Spain, France, Italy, Slovenia, Croatia 7 Thousands Millions+ 3/04-3/07 Winter Weather Italy, Balkans 7 Thousands Millions+ 3/29-4/01 WS Mike & Niklas Western & Central Europe 9 10,000+ 1.0+ billion 9/16 10/08-10/20 Europe Date 4/12-4/13 Wildfire Russia 33 1,476+ 140+ million 5/05-5/06 Severe Weather Germany, Belgium 1 Thousands 10s of millions 6/01-8/31 Drought Romania, Poland, Czech Republic 0 100,000+ 2.7+ billion 6/27-7/01 Heatwave Western Europe 0 Unknown Unknown 7/24-7/25 Severe Weather Netherlands, Germany, Poland, Slovakia 3 Thousands 25+ million 8/01-8/14 Heatwave/Wildfires Central & Southern Europe, Middle East 109+ Unknown 9.0+ million Millions 9/05 Severe Weather Italy 0 Thousands 9/07 Flooding Spain 4 1,000+ Millions 10/03-10/04 Flooding France 19 60,000+ 1.0+ billion 10/14-10/16 Flooding Italy, Balkans 5 Hundreds 10s of Millions 11/01-11/03 Flooding Portugal, Spain, Italy 7 Hundreds Millions WS Heini UK, Western Europe 0 Thousands 225+ million WS Nils Ireland, U.K., Denmark, Sweden 0 Thousands 10s of Millions 11/17 11/29-11/30 Global Catastrophe Recap: December 2015 10 . Aon Benfield Analytics | Impact Forecasting Africa Flooding Malawi, Mozambique, Zimbabwe 307 Structures/ Claims 550,000+ 1/02-1/04 Severe Weather Malawi, Zimbabwe 15 Hundreds 1/16-1/18 TS Chedza Madagascar 89 5,000+ 36 million 2/07-2/08 TS Fundi Madagascar 6 8,091 10+ million 2/13-2/14 Flooding Angola 5 2,862+ Unknown 2/27-3/01 Flooding Madagascar 24 642 Unknown 3/04 Flooding Tanzania 47 634 Unknown 3/09-3/12 Flooding Angola 69 2,500+ Unknown 3/28-3/29 Flooding Burundi, Angola, Congo 24 500+ Unknown 4/04-4/10 Flooding Kenya 13 Hundreds Unknown 4/28 Flooding Kenya 16 300+ Unknown 6/01-6/21 Flooding Côte d’Ivoire 16 6/01-8/31 Drought Botswana 0 Unknown 44+ million 8/08-8/09 Severe Weather Sudan 20 Unknown Unknown 8/13-8/15 Date 12/01-1/31 Event Location Deaths Unknown Economic Loss (USD) 550+ million Unknown Unknown Heatwave Sudan 16 Unknown Unknown 8/14 Flooding Niger 4 2,170+ Unknown 7/15-9/10 Flooding Burkina Faso 8 15,000+ 31+ million 9/05-9/24 Flooding Nigeria 53 53,000+ 25+ million 10/16-10/25 Flooding Algeria 0 Thousands Unknown 7/01-11/30 Drought South Africa 0 Unknown 2.0+ billion Severe Weather South Africa 0 20,000+ 75+ million Event Location Deaths 1/01-12/31 Wildfires Indonesia 19 Structures/ Claims Unknown Economic Loss (USD) 16.1+ billion 1/01-12/31 Drought China 0 Unknown 1.8+ billion 1/01-4/30 Drought Thailand 0 Unknown 428+ million 11/16 Asia Date 1/01-1/23 Flooding Indonesia 8 13,050+ 6+ million 1/06-1/10 Winter Weather Egypt, Israel, Jordan, Lebanon, Syria 9 Unknown 100+ million 1/09-1/12 Winter Weather China 1 5,300+ 226+ million 1/10-1/14 Earthquakes China 0 17,500+ 16+ million 1/14-1/20 Flooding Malaysia 1 Thousands Unknown 1/17-1/18 TY Mekkhala Philippines 2 538+ 1.0+ million Severe Weather Oman 0 5,000+ 221+ million 1/23-1/25 Flooding Indonesia 1 2,750+ Unknown 1/28-1/31 Winter Weather China 0 1,000+ 28+ million 1/31 80+ million 1/19 Severe Weather China 0 Unknown 1/31-2/2 Flooding Indonesia 2 5,050+ Unknown 2/08-2/13 Flooding Indonesia 6 Thousands 235+ million 2/15-2/28 Winter Weather Afghanistan, India 230 6,013 Unknown Earthquake China 0 3,000+ 15+ million 2/22 Global Catastrophe Recap: December 2015 11 . Aon Benfield Analytics | Impact Forecasting Flooding Pakistan 32 Structures/ Claims Unknown Earthquake China 0 16,300+ 19+ million 3/07-3/08 Winter Weather Afghanistan, Pakistan 26 150+ Unknown 3/11-3/15 Severe Weather India, Iran 20 1,140+ Unknown Date 2/24-3/3 3/01 Event Location Deaths Economic Loss (USD) Unknown 3/14 Earthquake China 2 11,234+ Millions+ 3/16 Flooding Indonesia 0 1,600+ Unknown 3/23-3/27 Flooding Saudi Arabia 11 1,000+ Millions+ 3/24-3/25 Severe Weather China 0 1,000+ 275+ million STY Maysak Micronesia, Philippines 9 2,000+ 8+ million Flooding Indonesia 12 Unknown Unknown Winter Weather China 0 1,000+ 108+ million Flooding India 17 Thousands 38+ million Earthquake China 0 6,260+ 20+ million 209 million 3/25-4/5 3/28 3/29-3/31 3/29-3/31 3/30 3/30-4/04 Severe Weather China 6 19,300+ 4/01-4/03 Severe Weather India, Pakistan, Tajikistan, Afghanistan 33 1,000+ Millions 4/04-4/05 Severe Weather China 7 14,500+ 20+ million 4/04-4/05 Severe Weather Bangladesh, India, Myanmar 40 46,033+ 4.3+ million 4/06-4/09 Severe Weather China 1 5,000+ 130+ million 4/08-4/12 Flooding Kazakhstan 2 1,760+ 5.3+ million 4/11-4/13 Winter Weather China 0 Unknown 174+ million 4/19-4/21 Severe Weather China 0 2,000+ 350+ million 4/21 Severe Weather India 42 25,000+ 158+ million Earthquake Nepal, India, Bangladesh, China 9,120 850,000+ 8+ billion 4/25 & 5/12 4/27 Landslide Afghanistan 52 100 Unknown 4/27-4/28 Severe Weather Pakistan 49 Hundreds Unknown 4/27-4/29 Severe Weather China 2 36,500 485+ million 5/02-5/03 Severe Weather Bangladesh 13 Unknown Unknown 5/07-5/12 Severe Weather China 4 26,600+ 461+ million 5/10-5/12 STY Noul Micronesia, Philippines, Japan 2 Unknown 24+ million 5/12 Flooding China 0 2,000+ 290+ million 5/13-5/17 Flooding China 20 20,000+ 254+ million Severe Weather Armenia 0 Hundreds+ 10+ million 5/18-5/22 Flooding China 48 87,000+ 1.15+ billion 5/21-5/28 Heatwave India 2,500+ Unknown Unknown 5/23-5/27 Flooding China, Taiwan, Hong Kong 7 2,500+ 282+ million 5/28-6/01 Flooding China 16 20,000+ 500+ million 5/29-6/01 Severe Weather China 0 10,000+ 325+ million 6/01-6/04 Flooding China 9 20,000+ 625+ million 5/15 6/02-6/29 6/05 6/06-6/11 6/07-6/11 6/12 6/18-6/24 Volcano Indonesia 0 Unknown 61+ million Earthquake Malaysia 19 Dozens Thousands Flooding India, Nepal 21 1,000+ Unknown Flooding China 16 20,000+ 2.0+ billion CY Ashobaa Oman 0 Dozens Thousands Heatwave Pakistan 1,265+ Unknown Unknown Global Catastrophe Recap: December 2015 12 . Aon Benfield Analytics | Impact Forecasting 6/19-6/25 Flooding India 41 Structures/ Claims Thousands 6/20-6/24 Flooding China 9 8,700+ 187+ million 6/21-6/23 Severe Weather China 0 Hundreds 145+ million 6/22-6/24 TS Kujira China, Vietnam 7 223+ 11+ million 6/23-6/30 Flooding Bangladesh, Myanmar, India 63 Thousands Unknown 6/25-6/29 Flooding China 0 6,200+ 58+ million 6/26-7/02 Flooding China 16 50,000+ 645+ million Flooding China 6 23,300+ 345+ million Earthquake China 4 12,000+ 3.2+ million Date 7/01-7/05 7/03 Event Location Deaths Economic Loss (USD) 100+ million 7/03-7/07 Severe Weather China 1 2,000+ 169+ million 7/04-7/13 TY Chan-hom China, Guam, Japan, Taiwan, Korea 0 4,700+ 1.6+ billion 7/04-7/10 TY Linfa Philippines, China 5 493+ 214+ million 7/07-7/13 Flooding India, Pakistan 35 Thousands Unknown 7/08-7/13 Flooding Philippines 16 10+ Unknown 7/13-7/14 Severe Weather China 1 600+ 85+ million 7/13-7/14 Flooding China 3 8,500+ 71+ million 7/16 STY Nangka Japan 2 288+ 200+ million 7/17-7/25 Flooding Pakistan 18 Thousands Unknown 7/17-8/11 Heatwave Japan 59 Unknown Unknown 7/20-7/24 Flooding China 28 42,900+ 1.2+ billion 7/22-7/27 Flooding Pakistan, Myanmar, Afghanistan, Bangladesh 162 39,000+ 25+ million 7/24-8/06 Flooding Vietnam 42 2,028+ 204+ million 7/25-8/07 Flooding Myanmar 121 50,000+ 109+ million 7/26-8/06 Flooding India, Pakistan, Bangladesh 303 350,000+ 500+ million 8/01-8/05 Flooding North Korea 21 968+ Unknown 8/01-8/07 Flooding Nepal 90 1,000+ Unknown 8/01-8/15 Flooding Laos 0 2,200+ 10+ million 8/02-8/04 Flooding China 15 15,000+ 418+ million 8/02-8/08 STY Soudelor China, Taiwan, Saipan 41 150,000+ 3.2+ billion 8/07-8/12 Severe Weather China 1 1,000+ 59+ million 8/15-8/26 TY Goni Japan, Philippines, Korea Peninsula 70 20,000+ 900+ million 8/16-8/19 Flooding China 23 25,800+ 220+ million 8/19-8/26 Severe Weather China 1 10,000+ 281+ million 8/28-9/01 Flooding India, Myanmar 47 50,000+ 100+ million 9/06 Severe Weather India 32 Unknown Unknown 9/08-9/10 Sandstorm Middle East 12 Thousands Unknown 9/08-9/10 Flooding Japan 8 25,000+ 500+ million 9/15-9/23 Flooding China 14 4,000+ 473+ million Earthquake Indonesia 0 2,500 Unknown 9/25-9/28 TY Dujuan Taiwan, China, Japan, Philippines 3 Thousands 687+ million 9/30-10/1 Winter Weather China 1 Unknown 177 million 10/02-10/04 TY Mujigae China, Philippines 22 26,800 4.2+ billion 10/06-10/11 Severe Weather China 14 5,200 43 million 10/08-10/12 Flooding Myanmar 39 Hundreds Unknown 9/25 Global Catastrophe Recap: December 2015 13 . Aon Benfield Analytics | Impact Forecasting 10/18-10/22 STY Koppu Philippines 62 Structures/ Claims 150,000+ 10/26 Earthquake Afghanistan, Pakistan 403+ 95,000+ 10/28-10/30 Flooding Iran, Iraq, Saudi Arabia 70 Unknown Millions 11/03-11/04 CY Chapala Yemen 8 Thousands 100s of Millions 11/08-11/09 CY Megh Yemen, Somalia 18 3,000+ Unknown 11/09-12/08 Flooding India, Sri Lanka 386+ 100,000+ 4.0+ billion 11/10-11/16 Flooding China 0 Thousands 133+ million Date Event Location Deaths Economic Loss (USD) 306+ million 100+ million 11/13 Landslide China 38 48 Unknown 11/17 Earthquake Kyrgyzstan 0 4,371 Unknown Flooding Saudi Arabia 12 Hundreds Unknown Winter Weather China 4 1,000 268+ million Economic Loss (USD) 50+ million 11/17 11/22-11/25 Oceania (Australia, New Zealand, South Pacific Islands) Wildfires Australia 0 Structures/ Claims 996+ 2/20 Cyclone Lam Australia 0 Hundreds 78+ million 2/20 Cyclone Marcia Australia 0 36,483+ 650+ million CY Pam Vanuatu, South Pacific Islands 16 30,000+ 443 million Date 1/02-1/08 3/11-3/15 Event Location Deaths 3/13-3/15 CY Olwyn Australia (WA) 0 500+ 76+ million 3/20-3/24 CY Nathan Australia (QLD, NT) 0 Hundreds Millions 4/19-4/22 Severe Weather Australia (NSW) 4 119,935+ 925+ million 4/25 Severe Weather Australia (NSW) 0 14,239+ 500+ million Flooding Australia (QLD, NSW) 6 27,825+ 400+ million Flooding New Zealand 1 Thousands 100+ million STY Dolphin Northern Mariana Islands 0 Hundreds Unknown 4/30-5/03 5/14-5/15 5/14 6/20 Flooding New Zealand 0 2,839+ 171+ million 6/30-7/05 CY Raquel Solomon Islands 1 150+ Millions 8/25-8/26 Severe Weather Australia (NSW) 0 1,600+ Millions 7/1-10/31 Drought Papua New Guinea 0 Unknown 60+ million 10/27-10/28 Severe Weather Australia (QLD) 0 Hundreds Millions 11/25-11/27 Wildfires Australia (South Australia) 2 1,861+ 200+ million 11/29-11/30 Severe Weather Australia (QLD, NSW) 0 Hundreds 10s of Millions Global Catastrophe Recap: December 2015 14 . Aon Benfield Analytics | Impact Forecasting Additional Report Details TD = Tropical Depression, TS = Tropical Storm, HU = Hurricane, TY = Typhoon, STY = Super Typhoon, CY = Cyclone Fatality estimates as reported by public news media sources and official government agencies. Structures defined as any building – including barns, outbuildings, mobile homes, single or multiple family dwellings, and commercial facilities – that is damaged or destroyed by winds, earthquakes, hail, flood, tornadoes, hurricanes or any other naturaloccurring phenomenon. Claims defined as the number of claims (which could be a combination of homeowners, commercial, auto and others) reported by various insurance companies through press releases or various public media outlets. Damage estimates are obtained from various public media sources, including news websites, publications from insurance companies, financial institution press releases and official government agencies. Damage estimates are obtained from various public media sources, including news websites, publications from insurance companies, financial institution press releases and official government agencies. Economic loss totals include any available insured loss estimates, which can be found in the corresponding event text. Global Catastrophe Recap: December 2015 15 .
Aon Benfield Analytics | Impact Forecasting Contact Information Adam Podlaha Head of Impact Forecasting Aon Benfield Analytics Impact Forecasting +44 (0) 20 7522 3820 adam.podlaha@aonbenfield.com Steve Bowen Associate Director (Meteorologist) Aon Benfield Analytics Impact Forecasting +1.312.381.5883 steven.bowen@aonbenfield.com Claire Darbinyan Senior Analyst (Meteorologist) Aon Benfield Analytics Impact Forecasting +65 6645 0110 claire.darbinyan@aonbenfield.com Global Catastrophe Recap: December 2015 16 . Aon Benfield Analytics | Impact Forecasting About Aon Benfield Aon Benfield, a division of Aon plc (NYSE: AON), is the world’s leading reinsurance intermediary and fullservice capital advisor. We empower our clients to better understand, manage and transfer risk through innovative solutions and personalized access to all forms of global reinsurance capital across treaty, facultative and capital markets. As a trusted advocate, we deliver local reach to the world’s markets, an unparalleled investment in innovative analytics, including catastrophe management, actuarial and rating agency advisory. Through our professionals’ expertise and experience, we advise clients in making optimal capital choices that will empower results and improve operational effectiveness for their business. With more than 80 offices in 50 countries, our worldwide client base has access to the broadest portfolio of integrated capital solutions and services.
To learn how Aon Benfield helps empower results, please visit aonbenfield.com. Copyright © by Impact Forecasting® No claim to original government works. The text and graphics of this publication are provided for ® informational purposes only. While Impact Forecasting has tried to provide accurate and timely information, inadvertent technical inaccuracies and typographical errors may exist, and Impact ® Forecasting does not warrant that the information is accurate, complete or current.
The data presented at this site is intended to convey only general information on current natural perils and must not be used to make life-or-death decisions or decisions relating to the protection of property, as the data may not be accurate. Please listen to official information sources for current storm information. This data has no official status and should not be used for emergency response decision-making under any circumstances. ® Cat Alerts use publicly available data from the internet and other sources.
Impact Forecasting summarizes this publicly available information for the convenience of those individuals who have ® contacted Impact Forecasting and expressed an interest in natural catastrophes of various types. To find out more about Impact Forecasting or to sign up for the Cat Reports, visit Impact Forecasting’s webpage at impactforecasting.com. Copyright © by Aon plc. All rights reserved. No part of this document may be reproduced, stored in a retrieval system, or transmitted in any form or by any means, electronic, mechanical, photocopying, recording or otherwise. Impact Forecasting® is a wholly owned subsidiary of Aon plc. Global Catastrophe Recap: December 2015 17 .
Relentless rainfall also led to historic flooding in the Mississippi Valley and Midwest that saw rivers cresting at or above historic heights previously set in 1993, 2008 and 2011. Additionally, the period was marked by record snowfall and ice that led to extensive travel disruption. Preliminary estimates suggest that total economic losses in the United States during December will exceed USD4.0 billion. Insured losses are likely to approach or exceed USD2.0 billion, with the Insurance Council of Texas reporting losses in the Dallas metro area alone at USD1.2 billion. Relentless rainfall from a series of North Atlantic storm systems led to extensive flooding across the United Kingdom and Ireland throughout the month. The arrival of windstorms Ted and Eckard – also known locally as Desmond and Frank – brought even more flood and wind damage.
The hardest-hit areas included a large swath of southern Scotland, northern England, and Wales, where thousands of homes endured varying levels of flood inundation. Various published reports, including from the Association of British Insurers, indicated that preliminary insured losses in the UK were expected to exceed GBP1.5 billion (USD2.2 billion). Overall economic losses were expected to be even higher and approach GBP2.8 billion (USD4.0 billion). Elsewhere, portions of Argentina, Paraguay, Uruguay and Brazil were inundated throughout December following prolonged periods of heavy rainfall that prompted the worst floods in at least 50 years.
At least 16 people were killed. Tens of thousands of homes were damaged or destroyed in river flooding and landslides as El Niño-enhanced rainfall occurred. Preliminary overall economic losses were estimated to exceed USD200 million. Typhoon Melor made multiple landfalls in the Philippines, killing at least 42 people and injuring 24 others. The storm brought torrential rainfall and gusty winds as it tracked through part of the archipelago at Category 4 intensity.
Nearly 280,000 homes were damaged or destroyed. Philippines’ National Disaster Risk Reduction and Management Center reported economic damages to agriculture and infrastructure alone at PHP6.5 billion (USD140 million). A wildfire burned in Australia’s state of Victoria and left serious damage on December 25, destroying at least 116 homes. The Lorne Fire destroyed 98 homes in Wye River and 18 at Separation Creek, which led to the Insurance Council of Australia declaring an insurance catastrophe.
Preliminary insured losses were listed at AUD53 million (USD38 million). Total economic losses are expected to top USD100 million. The Ethiopian National Risk Management Coordination Commission announced that it sought USD1.4 billion to deal with its worst drought in 30 years. At least 10 million people were affected. Global Catastrophe Recap: December 2015 3 .
Aon Benfield Analytics | Impact Forecasting United States 12/07-12/11 Severe Weather Pacific Northwest 2 Structures/ Claims Thousands 12/16-12/18 Winter Weather West, Rockies, Plains, Midwest 3 Thousands Millions+ 12/22-12/26 Severe Weather Midwest, Southeast, Plains 18 Thousands 1.0+ billion 12/26-12/30 Severe Weather Plains, Midwest, Southeast 46 Thousands 3.0+ billion Date Event Location Deaths Economic Loss (USD) Millions+ Portions of the United States Northwest were inundated by flooding and high winds from December 7-11 as an atmospheric river pattern brought a series of moisture-laden low pressure systems ashore. At least two people died as torrential rainfall prompted widespread damaging floods and landslides. Washington and Oregon states were worst affected. A strong winter storm system tracked across much of the contiguous United States from December 12-16, leaving at least three people dead. The storm brought periods of heavy snow, rain, freezing rain and hurricane-force wind gusts to portions of the West, Rockies, Plains and Upper Midwest.
The storm prompted widespread disruption to travel and transportation and power outages to 13,500 customers. A powerful storm system spawned a widespread outbreak of severe weather across much of the Eastern U.S. from December 22-26, leading to at least 18 fatalities and more than 50 injuries. The event prompted dozens of tornado touchdowns (including one EF4), damaging winds gusting to 75 mph (120 kph), up to baseball-sized hail and flooding.
The most substantial damage was incurred in parts of Mississippi, Tennessee, Arkansas, Alabama, Illinois, Kentucky and Indiana. Total economic losses were expected to top USD1.0 billion; while insured losses will reach well into the hundreds of millions USD. A complex weather pattern led to a several powerful tornadoes, historic flooding, and heavy snow and ice across much of the central and eastern U.S. from December 26-30.
At least 46 people were killed. The most substantial tornado damage occurred in the greater Dallas, TX metro region on December 26, where separate EF4 and EF3 tornadoes left major damage in Dallas, Ellis and Collin counties. The event was also marked by prodigious rainfall that led to extensive flooding throughout the Midwest and the Mississippi Valley.
Portions of Missouri and Illinois were particularly impacted, though floods were also noted in Arkansas, Tennessee, Kentucky, Indiana, Texas and Oklahoma. Areas from the Rockies to the Northeast also incurred periods of heavy snow, freezing rain and ice. Total economic losses were expected to approach USD3.0 billion.
Insured losses were expected to exceed USD1.5 billion, with the Insurance Council of Texas reporting USD1.2 billion alone. Remainder of North America (Non-U.S.) Date 12/27-12/30 Event Location Deaths Winter Weather Canada 0 Structures/ Claims 1,000+ Economic Loss (USD) Millions A major storm system that originated in the United States tracked northward and brought wintry impacts across eastern Canada from the December 27-30. The wintry weather left considerable impacts across parts of Ontario and Quebec provinces, as well as Atlantic Canada. Heavy snow, sleet, freezing rain and gusty winds caused treacherous driving conditions.
More than 300 automobile crashes were noted in Ontario, including at least 130 alone in the city of Toronto. Total economic losses were estimated in the millions (USD). Global Catastrophe Recap: December 2015 4 . Aon Benfield Analytics | Impact Forecasting South America Date 12/01-12/31 Event Location Deaths Flooding Argentina, Paraguay, Uruguay, Brazil 16+ Structures/ Claims 50,000+ Economic Loss (USD) 200+ million Portions of Argentina, Paraguay, Uruguay and Brazil were inundated throughout December following prolonged periods of heavy rainfall that prompted the worst floods in at least 50 years in some areas. At least 16 people were killed. Tens of thousands of homes were damaged or destroyed in river flooding and landslides as El Niño-enhanced rainfall occurred. Nearly 1 million people were either directly impacted or evacuated from their homes.
Vast swathes of agricultural lands were submerged and infrastructure was washed away. Preliminary overall economic losses were estimated to exceed USD200 million. Europe Date 3 Structures/ Claims 30,500+ Economic Loss (USD) 1.1+ billion 0 25,000+ 2.5+ billion 1 10,000+ 350+ million Event Location Deaths 12/04-12/06 WS Ted United Kingdom, Ireland, Norway 12/22-12/31 Flooding United Kingdom 12/30-12/31 WS Eckard United Kingdom, Ireland Windstorm Ted – known locally as Desmond – struck Ireland, the United Kingdom, and Norway at the start of the month prompting widespread, destructive flooding. Northwest portions of England were worst affected.
At least three individuals died and dozens more had to be rescued as the floodwaters inundated 5,200 homes in England alone and prompted power outages to 60,000 customers. The Association of British Insurers cited more than 30,500 filed claims with expected payouts of GBP520 million (USD775 million). Total economic losses across Western Europe were estimated in excess of USD1.1 billion. An active weather pattern brought persistent rounds of rainfall to the United Kingdom during much of December, which led to significant flooding in northern sections of Britain.
The hardest-hit areas included a large swath of southern Scotland, northern England, and Wales, where thousands of homes endured varying levels of flood inundation. Vast areas of agricultural land and infrastructure were also damaged as the floods additionally led to widespread power outages. Total economic losses were expected to exceed GBP1.7 billion (USD2.5 billion).
Various published reports, including from the Association of British Insurers, suggested that insured losses solely from the floods were likely to approach GBP850 million (USD1.25 billion). Windstorm Eckard—known locally as Frank—struck the Iceland, the United Kingdom and Ireland during the last two days of 2015, bringing renewed flooding and high winds to the region. Northern Ireland, Scotland, Wales, and northern England were worst affected by Eckard in the UK as additional flood damage and power outages were incurred. In Iceland, hurricane-force wind gusts whipped southern and eastern portions of the island with serious damage to structures in the East Fjords region.
Total combined economic losses were preliminarily estimated at USD350 million. Insured losses are expected to be roughly USD200 million. Global Catastrophe Recap: December 2015 5 . Aon Benfield Analytics | Impact Forecasting Africa Date Event Location 11/19-12/17 Flooding DR Congo 1/01-12/31 Drought Ethiopia 31 Structures/ Claims 20,000+ Economic Loss (USD) Unknown N/A N/A 1.4+ billion Deaths Over a three-week period from late November into early December, torrential rainfall in Kinshasa, DR Congo, prompted floods that left at least 31 individuals dead and 20,000 families homeless. The worst affected areas of the city were near the Ndjili and Matete Rivers. The Ethiopian National Risk Management Coordination Commission announced this month that it sought USD1.4 billion to deal with the current drought in the country that had affected more than 10 million people. The United Nations called it the worst drought to affect the country in 30 years. Asia Date 20 Structures/ Claims 550+ Economic Loss (USD) Unknown 0 Hundreds 90+ million Philippines 42 279,487+ 140+ million Pakistan, Afghanistan 2 2,000+ Unknown Event Location Deaths 11/29-12/03 Landslides Indonesia 12/04-12/05 Flooding China TY Melor Earthquake 12/14-12/17 12/25 From mid-November through early December, the Indonesian island of Sumatra endured localized flash floods and landslides. At least 20 individuals died as a result.
One of the largest landslides occurred in Bengkulu Province on December 3. Eighteen fatalities were reported and 21 homes were buried. Another slide in North Sumatra claimed two lives and injured nine others on December 1.
Twenty-two homes were destroyed and a further 35 were damaged. On November 29, flooding of the Batang Manggilang River prompted damages to at least 500 homes. China’s Ministry of Civil Affairs reported significant crop losses due to flooding in Jiangxi Province on December 4 and 5. Approximately 27,200 hectares (67,215 acres) of crops were reportedly affected and some 800 hectares (1,975 acres) were destroyed.
Economic losses were estimated at CNY580 million (USD90 million). Typhoon Melor made multiple landfalls in the Philippines on December 14 and 15, killing at least 42 people and injuring 24 others. The storm brought torrential rainfall and gusty winds as it tracked through part of the archipelago at Category 4 intensity. Nearly 280,000 homes were damaged or destroyed. Philippines’ National Disaster Risk Reduction and Management Center reported economic damages to agriculture and infrastructure at PHP6.5 billion (USD140 million). A magnitude-6.3 earthquake struck northeastern Afghanistan on December 25 at 11:45 PM AFT local time (19:15 UTC).
The temblor struck approximately 41 kilometers (25 miles) west-southwest of Ashkasham. Reports indicated that there were no fatalities in Afghanistan but 27 people were injured. Hundreds of homes were damaged in North East and Eastern regions, which were still reeling from a major earthquake in October 2015. In Pakistan, two fatalities were reported as some 60 others sustained injuries.
Homes were damaged in Khyber Pakhtunkhwa province. Global Catastrophe Recap: December 2015 6 . Aon Benfield Analytics | Impact Forecasting Oceania (Australia, New Zealand, South Pacific Islands) Date 0 Structures/ Claims 2,600+ Economic Loss (USD) 25+ million 0 Hundreds 100+ million Event Location Deaths 12/16 Severe Weather Australia 12/25 Wildfire Australia A supercell thunderstorm struck southeastern suburbs of Sydney, New South Wales, on December 16 that prompted damaging straight-line winds, large hail, torrential rain, and at least one tornado touchdown. The storm left a swath of damage in its wake that led to the Insurance Council of Australia to declare an insurance catastrophe. As of this writing, 2,600 claims had been filed totaling AUD14 million (USD9.8 million). Economic losses were even higher. A wildfire burned in Australia’s state of Victoria and left serious damage on December 25, destroying at least 116 homes.
The Lorne Fire, which was first ignited on December 19 following a lightning strike in a forested area, combined with gusty winds and temperatures at 36.1°C (97.0°F) to quickly spread and destroy 98 homes in Wye River and 18 at Separation Creek. The Insurance Council of Australia declared an insurance catastrophe, with preliminary insured losses listed at AUD53 million (USD38 million). Total economic losses are expected to top USD100 million. Global Catastrophe Recap: December 2015 7 .
Aon Benfield Analytics | Impact Forecasting Appendix Updated 2015 Data: January-November United States 1/01-9/30 Drought Western U.S. 0 Structures/ Claims Unknown 1/06-1/11 Winter Weather Midwest, Northeast, Mid-Atlantic 15 Hundreds+ 100+ million 1/26-1/28 Winter Weather Northeast, Mid-Atlantic 2 5,000+ 500+ million 1/31-2/04 Winter Weather Midwest, Northeast, Southwest 22 10,000+ 150+ million 2/06-2/08 Flooding Northwest, Southwest 1 Hundreds Millions+ 2/07-2/11 Winter Weather Northeast 2 25,000+ 400+ million 2/13-2/15 Winter Weather Midwest, Northeast, Mid-Atlantic 30 45,000+ 650+ million 2/16-2/17 Winter Weather Southeast 10 10,000+ 100+ million 2/16-2/22 Winter Weather Plains, Ohio Valley, Mid-Atlantic 8 215,000+ 3.25+ billion 2/25-2/26 Winter Weather Southeast, Mid-Atlantic 2 Thousands Millions+ Date Event Location Deaths Economic Loss (USD) 4.5+ billion 3/01-3/06 Winter Weather Central & Eastern U.S. 13 10,000+ 175+ million 3/25-3/26 Severe Weather Plains, Midwest, Southeast 1 35,000+ 500+ million 3/31-4/01 Severe Weather Plains, Midwest, Southeast 0 20,000+ 175+ million 4/02-4/03 Severe Weather Plains, Midwest, Southeast 0 25,000+ 250+ million 4/07-4/10 Severe Weather Plains, Midwest, Mississippi Valley 3 160,000+ 1.65+ billion 4/16-4/17 Severe Weather Plains 1 Thousands 100s of Millions 4/18-4/21 Severe Weather Plains, Southeast, Northeast 0 135,000+ 1.4+ billion 4/24-4/28 Severe Weather Plains, Southeast 4 115,000+ 950+ million 5/03-5/05 Severe Weather Plains, Midwest 1 15,000+ 175+ million 5/06-5/13 Severe Weather Plains, Midwest, Rockies 6 90,000+ 1.0+ billion TS Ana South Carolina 0 Hundreds Millions 5/10 5/15-5/19 Severe Weather Plains, Midwest, Rockies 2 15,000+ 150+ million 5/23-5/28 Severe Weather Plains, Midwest, Rockies, Southeast 32 150,000+ 3.75+ billion 5/28-5/30 Severe Weather Plains, Midwest, Rockies, Southeast 0 20,000+ 170+ million 6/03-6/08 Severe Weather Rockies, Plains 0 60,000+ 600+ million 6/09-6/11 Severe Weather Great Lakes 0 10,000+ 100+ million 6/16-6/18 TS Bill Texas, Oklahoma 1 10,000+ 100+ million 6/19-6/26 Severe Weather Rockies, Plains, Midwest, Mid-Atlantic 4 110,000+ 1.3+ billion 6/28-6/30 Wildfires Northwest 0 100+ 150+ million 6/29-7/01 Severe Weather Midwest, Northeast, Southeast 0 Thousands Millions+ 7/12-7/14 Severe Weather Midwest, Ohio Valley, Southeast 4 65,000+ 600+ million 7/16-7/18 Severe Weather Plains, Midwest 4 7,500+ 75+ million 7/20-8/05 Flooding Florida 0 2,000+ 100+ million 7/29-8/13 Wildfires California 1 150+ Millions 8/02-8/04 Severe Weather Midwest, Plains, Northeast, Mid-Atlantic 4 100,000+ 750+ million 8/13-8/31 Wildfires Northwest, Rockies 4 Thousands 150+ million 8/29-8/30 Severe Weather Pacific Northwest 2 1,000+ Millions+ Global Catastrophe Recap: December 2015 8 . Aon Benfield Analytics | Impact Forecasting 9/09-10/30 Wildfires California 7 Structures/ Claims 10,000+ 9/13-9/15 Flooding Southwest 19 Thousands 9/24-9/28 Flooding Northeast, Mid-Atlantic, Southeast 1 Thousands Millions 10/01-10/11 Flooding Southeast, Mid-Atlantic 21 70,000+ 2.0+ billion 10/03-10/04 Severe Weather New Mexico 0 10,000+ 90+ million 10/05-10/07 Severe Weather Texas 0 10,000+ 80+ million 10/15-10/16 Flooding California 1 Hundreds Millions 10/20-10/23 Severe Weather New Mexico, Texas 0 20,000+ 250+ million 10/24-10/26 Flooding Texas, Southeast 0 17,500+ 250+ million 10/29-11/03 Severe Weather Texas, Southeast 6 25,000+ 400+ million 11/10-11/12 Severe Weather Midwest, Southeast 0 Thousands Millions 11/16-11/18 Severe Weather Plains, Southeast 0 Thousands Millions 11/16-11/18 Severe Weather Pacific Northwest 3 30,000+ 500+ million 11/20-11/22 Winter Weather Plains, Midwest, Rockies 0 Hundreds Millions 11/25-11/29 Winter Weather Plains, Midwest, Rockies 18 Thousands 100+ million Economic Loss (USD) 1.0+ billion Unknown Date Event Location Deaths Economic Loss (USD) 2.0+ billion Millions Remainder of North America (Non-U.S.) 1/01-12/31 Drought Canada 0 Structures/ Claims Unknown 2/20-2/21 Flooding Dominican Republic 2 4,190+ 3/26-3/28 Severe Weather Mexico 14 1,000+ Millions 4/04-4/05 Flooding Haiti 6 8,832+ Unknown Severe Weather Mexico 14 1,000+ Unknown Date 5/26 6/01-7/31 Event Location Deaths Drought El Salvador 0 Unknown 100 million 6/08 HU Blanca Mexico 0 Hundreds Thousands 6/12 Severe Weather Canada 0 5,000+ 75+ million 6/22 Severe Weather Canada 0 5,000+ 40+ million 6/27-7/09 Flooding Costa Rica 0 3,308+ Unknown 7/01-7/10 Wildfire Canada 1 Hundreds Unknown 7/21-7/22 Severe Weather Canada 0 25,000+ 375+ million 8/04-8/05 Severe Weather Canada 0 17,700+ 150+ million 8/13-8/21 Wildfires Canada 0 Hundreds 193+ million 8/27-8/30 TS Erika Caribbean Islands 36 5,000+ 300+ million 8/29-8/30 Severe Weather Canada 0 2,100+ 50+ million 9/22-9/28 Flooding Central America, Caribbean 5 1,700+ Millions Landslide Guatemala 304 125 Unknown 10/01-10/04 MHU Joaquin Bahamas, Bermuda 35 Thousands 100+ million 10/11-10/12 Severe Weather Canada 0 Thousands Millions 10/01 10/22-10/25 MHU Patricia Mexico 14 5,000+ 410+ million 11/16-11/17 Severe Weather Canada 0 Hundreds Millions Global Catastrophe Recap: December 2015 9 . Aon Benfield Analytics | Impact Forecasting South America Event Location Deaths 12/01-1/31 Drought Brazil 0 Structures/ Claims Unknown 1/15-1/31 Flooding Bolivia, Peru 16 10,780+ Unknown 2/15 Flooding Argentina 8 1,500 17.2 million 3/01-3/06 Flooding Argentina, Bolivia, Brazil, Ecuador, Peru 47 30,000+ Millions+ 3/20-4/05 Severe Weather Colombia, Ecuador, Peru 23 802+ Unknown 3/25-4/08 Flooding Chile 25 14,000+ 1.5+ billion Severe Weather Brazil 2 2,188+ 2.0+ million Volcano Chile 0 Thousands 600+ million Date 4/20 4/22-4/23 Economic Loss (USD) Unknown 4/27 Landslide Brazil 15 Hundreds Unknown 5/17 Flooding Colombia 83 Hundreds Unknown 8/06-8/10 Flooding Argentina, Chile 9 Thousands Unknown Earthquake Chile 14+ 10,000+ 1.0+ billion Flooding Brazil 3 40,700+ Millions Event Location Deaths 1/09-1/16 EU Windstorms Northern/Central/Western Europe 2 Structures/ Claims Thousands Economic Loss (USD) 650+ million 1/29-2/01 Winter Weather Western/Northern Europe 12 Hundreds Millions+ 1/30-2/02 Flooding Balkans, Turkey 13 2,170+ 13+ million 2/03-2/08 Winter Weather Spain, France, Italy, Slovenia, Croatia 7 Thousands Millions+ 3/04-3/07 Winter Weather Italy, Balkans 7 Thousands Millions+ 3/29-4/01 WS Mike & Niklas Western & Central Europe 9 10,000+ 1.0+ billion 9/16 10/08-10/20 Europe Date 4/12-4/13 Wildfire Russia 33 1,476+ 140+ million 5/05-5/06 Severe Weather Germany, Belgium 1 Thousands 10s of millions 6/01-8/31 Drought Romania, Poland, Czech Republic 0 100,000+ 2.7+ billion 6/27-7/01 Heatwave Western Europe 0 Unknown Unknown 7/24-7/25 Severe Weather Netherlands, Germany, Poland, Slovakia 3 Thousands 25+ million 8/01-8/14 Heatwave/Wildfires Central & Southern Europe, Middle East 109+ Unknown 9.0+ million Millions 9/05 Severe Weather Italy 0 Thousands 9/07 Flooding Spain 4 1,000+ Millions 10/03-10/04 Flooding France 19 60,000+ 1.0+ billion 10/14-10/16 Flooding Italy, Balkans 5 Hundreds 10s of Millions 11/01-11/03 Flooding Portugal, Spain, Italy 7 Hundreds Millions WS Heini UK, Western Europe 0 Thousands 225+ million WS Nils Ireland, U.K., Denmark, Sweden 0 Thousands 10s of Millions 11/17 11/29-11/30 Global Catastrophe Recap: December 2015 10 . Aon Benfield Analytics | Impact Forecasting Africa Flooding Malawi, Mozambique, Zimbabwe 307 Structures/ Claims 550,000+ 1/02-1/04 Severe Weather Malawi, Zimbabwe 15 Hundreds 1/16-1/18 TS Chedza Madagascar 89 5,000+ 36 million 2/07-2/08 TS Fundi Madagascar 6 8,091 10+ million 2/13-2/14 Flooding Angola 5 2,862+ Unknown 2/27-3/01 Flooding Madagascar 24 642 Unknown 3/04 Flooding Tanzania 47 634 Unknown 3/09-3/12 Flooding Angola 69 2,500+ Unknown 3/28-3/29 Flooding Burundi, Angola, Congo 24 500+ Unknown 4/04-4/10 Flooding Kenya 13 Hundreds Unknown 4/28 Flooding Kenya 16 300+ Unknown 6/01-6/21 Flooding Côte d’Ivoire 16 6/01-8/31 Drought Botswana 0 Unknown 44+ million 8/08-8/09 Severe Weather Sudan 20 Unknown Unknown 8/13-8/15 Date 12/01-1/31 Event Location Deaths Unknown Economic Loss (USD) 550+ million Unknown Unknown Heatwave Sudan 16 Unknown Unknown 8/14 Flooding Niger 4 2,170+ Unknown 7/15-9/10 Flooding Burkina Faso 8 15,000+ 31+ million 9/05-9/24 Flooding Nigeria 53 53,000+ 25+ million 10/16-10/25 Flooding Algeria 0 Thousands Unknown 7/01-11/30 Drought South Africa 0 Unknown 2.0+ billion Severe Weather South Africa 0 20,000+ 75+ million Event Location Deaths 1/01-12/31 Wildfires Indonesia 19 Structures/ Claims Unknown Economic Loss (USD) 16.1+ billion 1/01-12/31 Drought China 0 Unknown 1.8+ billion 1/01-4/30 Drought Thailand 0 Unknown 428+ million 11/16 Asia Date 1/01-1/23 Flooding Indonesia 8 13,050+ 6+ million 1/06-1/10 Winter Weather Egypt, Israel, Jordan, Lebanon, Syria 9 Unknown 100+ million 1/09-1/12 Winter Weather China 1 5,300+ 226+ million 1/10-1/14 Earthquakes China 0 17,500+ 16+ million 1/14-1/20 Flooding Malaysia 1 Thousands Unknown 1/17-1/18 TY Mekkhala Philippines 2 538+ 1.0+ million Severe Weather Oman 0 5,000+ 221+ million 1/23-1/25 Flooding Indonesia 1 2,750+ Unknown 1/28-1/31 Winter Weather China 0 1,000+ 28+ million 1/31 80+ million 1/19 Severe Weather China 0 Unknown 1/31-2/2 Flooding Indonesia 2 5,050+ Unknown 2/08-2/13 Flooding Indonesia 6 Thousands 235+ million 2/15-2/28 Winter Weather Afghanistan, India 230 6,013 Unknown Earthquake China 0 3,000+ 15+ million 2/22 Global Catastrophe Recap: December 2015 11 . Aon Benfield Analytics | Impact Forecasting Flooding Pakistan 32 Structures/ Claims Unknown Earthquake China 0 16,300+ 19+ million 3/07-3/08 Winter Weather Afghanistan, Pakistan 26 150+ Unknown 3/11-3/15 Severe Weather India, Iran 20 1,140+ Unknown Date 2/24-3/3 3/01 Event Location Deaths Economic Loss (USD) Unknown 3/14 Earthquake China 2 11,234+ Millions+ 3/16 Flooding Indonesia 0 1,600+ Unknown 3/23-3/27 Flooding Saudi Arabia 11 1,000+ Millions+ 3/24-3/25 Severe Weather China 0 1,000+ 275+ million STY Maysak Micronesia, Philippines 9 2,000+ 8+ million Flooding Indonesia 12 Unknown Unknown Winter Weather China 0 1,000+ 108+ million Flooding India 17 Thousands 38+ million Earthquake China 0 6,260+ 20+ million 209 million 3/25-4/5 3/28 3/29-3/31 3/29-3/31 3/30 3/30-4/04 Severe Weather China 6 19,300+ 4/01-4/03 Severe Weather India, Pakistan, Tajikistan, Afghanistan 33 1,000+ Millions 4/04-4/05 Severe Weather China 7 14,500+ 20+ million 4/04-4/05 Severe Weather Bangladesh, India, Myanmar 40 46,033+ 4.3+ million 4/06-4/09 Severe Weather China 1 5,000+ 130+ million 4/08-4/12 Flooding Kazakhstan 2 1,760+ 5.3+ million 4/11-4/13 Winter Weather China 0 Unknown 174+ million 4/19-4/21 Severe Weather China 0 2,000+ 350+ million 4/21 Severe Weather India 42 25,000+ 158+ million Earthquake Nepal, India, Bangladesh, China 9,120 850,000+ 8+ billion 4/25 & 5/12 4/27 Landslide Afghanistan 52 100 Unknown 4/27-4/28 Severe Weather Pakistan 49 Hundreds Unknown 4/27-4/29 Severe Weather China 2 36,500 485+ million 5/02-5/03 Severe Weather Bangladesh 13 Unknown Unknown 5/07-5/12 Severe Weather China 4 26,600+ 461+ million 5/10-5/12 STY Noul Micronesia, Philippines, Japan 2 Unknown 24+ million 5/12 Flooding China 0 2,000+ 290+ million 5/13-5/17 Flooding China 20 20,000+ 254+ million Severe Weather Armenia 0 Hundreds+ 10+ million 5/18-5/22 Flooding China 48 87,000+ 1.15+ billion 5/21-5/28 Heatwave India 2,500+ Unknown Unknown 5/23-5/27 Flooding China, Taiwan, Hong Kong 7 2,500+ 282+ million 5/28-6/01 Flooding China 16 20,000+ 500+ million 5/29-6/01 Severe Weather China 0 10,000+ 325+ million 6/01-6/04 Flooding China 9 20,000+ 625+ million 5/15 6/02-6/29 6/05 6/06-6/11 6/07-6/11 6/12 6/18-6/24 Volcano Indonesia 0 Unknown 61+ million Earthquake Malaysia 19 Dozens Thousands Flooding India, Nepal 21 1,000+ Unknown Flooding China 16 20,000+ 2.0+ billion CY Ashobaa Oman 0 Dozens Thousands Heatwave Pakistan 1,265+ Unknown Unknown Global Catastrophe Recap: December 2015 12 . Aon Benfield Analytics | Impact Forecasting 6/19-6/25 Flooding India 41 Structures/ Claims Thousands 6/20-6/24 Flooding China 9 8,700+ 187+ million 6/21-6/23 Severe Weather China 0 Hundreds 145+ million 6/22-6/24 TS Kujira China, Vietnam 7 223+ 11+ million 6/23-6/30 Flooding Bangladesh, Myanmar, India 63 Thousands Unknown 6/25-6/29 Flooding China 0 6,200+ 58+ million 6/26-7/02 Flooding China 16 50,000+ 645+ million Flooding China 6 23,300+ 345+ million Earthquake China 4 12,000+ 3.2+ million Date 7/01-7/05 7/03 Event Location Deaths Economic Loss (USD) 100+ million 7/03-7/07 Severe Weather China 1 2,000+ 169+ million 7/04-7/13 TY Chan-hom China, Guam, Japan, Taiwan, Korea 0 4,700+ 1.6+ billion 7/04-7/10 TY Linfa Philippines, China 5 493+ 214+ million 7/07-7/13 Flooding India, Pakistan 35 Thousands Unknown 7/08-7/13 Flooding Philippines 16 10+ Unknown 7/13-7/14 Severe Weather China 1 600+ 85+ million 7/13-7/14 Flooding China 3 8,500+ 71+ million 7/16 STY Nangka Japan 2 288+ 200+ million 7/17-7/25 Flooding Pakistan 18 Thousands Unknown 7/17-8/11 Heatwave Japan 59 Unknown Unknown 7/20-7/24 Flooding China 28 42,900+ 1.2+ billion 7/22-7/27 Flooding Pakistan, Myanmar, Afghanistan, Bangladesh 162 39,000+ 25+ million 7/24-8/06 Flooding Vietnam 42 2,028+ 204+ million 7/25-8/07 Flooding Myanmar 121 50,000+ 109+ million 7/26-8/06 Flooding India, Pakistan, Bangladesh 303 350,000+ 500+ million 8/01-8/05 Flooding North Korea 21 968+ Unknown 8/01-8/07 Flooding Nepal 90 1,000+ Unknown 8/01-8/15 Flooding Laos 0 2,200+ 10+ million 8/02-8/04 Flooding China 15 15,000+ 418+ million 8/02-8/08 STY Soudelor China, Taiwan, Saipan 41 150,000+ 3.2+ billion 8/07-8/12 Severe Weather China 1 1,000+ 59+ million 8/15-8/26 TY Goni Japan, Philippines, Korea Peninsula 70 20,000+ 900+ million 8/16-8/19 Flooding China 23 25,800+ 220+ million 8/19-8/26 Severe Weather China 1 10,000+ 281+ million 8/28-9/01 Flooding India, Myanmar 47 50,000+ 100+ million 9/06 Severe Weather India 32 Unknown Unknown 9/08-9/10 Sandstorm Middle East 12 Thousands Unknown 9/08-9/10 Flooding Japan 8 25,000+ 500+ million 9/15-9/23 Flooding China 14 4,000+ 473+ million Earthquake Indonesia 0 2,500 Unknown 9/25-9/28 TY Dujuan Taiwan, China, Japan, Philippines 3 Thousands 687+ million 9/30-10/1 Winter Weather China 1 Unknown 177 million 10/02-10/04 TY Mujigae China, Philippines 22 26,800 4.2+ billion 10/06-10/11 Severe Weather China 14 5,200 43 million 10/08-10/12 Flooding Myanmar 39 Hundreds Unknown 9/25 Global Catastrophe Recap: December 2015 13 . Aon Benfield Analytics | Impact Forecasting 10/18-10/22 STY Koppu Philippines 62 Structures/ Claims 150,000+ 10/26 Earthquake Afghanistan, Pakistan 403+ 95,000+ 10/28-10/30 Flooding Iran, Iraq, Saudi Arabia 70 Unknown Millions 11/03-11/04 CY Chapala Yemen 8 Thousands 100s of Millions 11/08-11/09 CY Megh Yemen, Somalia 18 3,000+ Unknown 11/09-12/08 Flooding India, Sri Lanka 386+ 100,000+ 4.0+ billion 11/10-11/16 Flooding China 0 Thousands 133+ million Date Event Location Deaths Economic Loss (USD) 306+ million 100+ million 11/13 Landslide China 38 48 Unknown 11/17 Earthquake Kyrgyzstan 0 4,371 Unknown Flooding Saudi Arabia 12 Hundreds Unknown Winter Weather China 4 1,000 268+ million Economic Loss (USD) 50+ million 11/17 11/22-11/25 Oceania (Australia, New Zealand, South Pacific Islands) Wildfires Australia 0 Structures/ Claims 996+ 2/20 Cyclone Lam Australia 0 Hundreds 78+ million 2/20 Cyclone Marcia Australia 0 36,483+ 650+ million CY Pam Vanuatu, South Pacific Islands 16 30,000+ 443 million Date 1/02-1/08 3/11-3/15 Event Location Deaths 3/13-3/15 CY Olwyn Australia (WA) 0 500+ 76+ million 3/20-3/24 CY Nathan Australia (QLD, NT) 0 Hundreds Millions 4/19-4/22 Severe Weather Australia (NSW) 4 119,935+ 925+ million 4/25 Severe Weather Australia (NSW) 0 14,239+ 500+ million Flooding Australia (QLD, NSW) 6 27,825+ 400+ million Flooding New Zealand 1 Thousands 100+ million STY Dolphin Northern Mariana Islands 0 Hundreds Unknown 4/30-5/03 5/14-5/15 5/14 6/20 Flooding New Zealand 0 2,839+ 171+ million 6/30-7/05 CY Raquel Solomon Islands 1 150+ Millions 8/25-8/26 Severe Weather Australia (NSW) 0 1,600+ Millions 7/1-10/31 Drought Papua New Guinea 0 Unknown 60+ million 10/27-10/28 Severe Weather Australia (QLD) 0 Hundreds Millions 11/25-11/27 Wildfires Australia (South Australia) 2 1,861+ 200+ million 11/29-11/30 Severe Weather Australia (QLD, NSW) 0 Hundreds 10s of Millions Global Catastrophe Recap: December 2015 14 . Aon Benfield Analytics | Impact Forecasting Additional Report Details TD = Tropical Depression, TS = Tropical Storm, HU = Hurricane, TY = Typhoon, STY = Super Typhoon, CY = Cyclone Fatality estimates as reported by public news media sources and official government agencies. Structures defined as any building – including barns, outbuildings, mobile homes, single or multiple family dwellings, and commercial facilities – that is damaged or destroyed by winds, earthquakes, hail, flood, tornadoes, hurricanes or any other naturaloccurring phenomenon. Claims defined as the number of claims (which could be a combination of homeowners, commercial, auto and others) reported by various insurance companies through press releases or various public media outlets. Damage estimates are obtained from various public media sources, including news websites, publications from insurance companies, financial institution press releases and official government agencies. Damage estimates are obtained from various public media sources, including news websites, publications from insurance companies, financial institution press releases and official government agencies. Economic loss totals include any available insured loss estimates, which can be found in the corresponding event text. Global Catastrophe Recap: December 2015 15 .
Aon Benfield Analytics | Impact Forecasting Contact Information Adam Podlaha Head of Impact Forecasting Aon Benfield Analytics Impact Forecasting +44 (0) 20 7522 3820 adam.podlaha@aonbenfield.com Steve Bowen Associate Director (Meteorologist) Aon Benfield Analytics Impact Forecasting +1.312.381.5883 steven.bowen@aonbenfield.com Claire Darbinyan Senior Analyst (Meteorologist) Aon Benfield Analytics Impact Forecasting +65 6645 0110 claire.darbinyan@aonbenfield.com Global Catastrophe Recap: December 2015 16 . Aon Benfield Analytics | Impact Forecasting About Aon Benfield Aon Benfield, a division of Aon plc (NYSE: AON), is the world’s leading reinsurance intermediary and fullservice capital advisor. We empower our clients to better understand, manage and transfer risk through innovative solutions and personalized access to all forms of global reinsurance capital across treaty, facultative and capital markets. As a trusted advocate, we deliver local reach to the world’s markets, an unparalleled investment in innovative analytics, including catastrophe management, actuarial and rating agency advisory. Through our professionals’ expertise and experience, we advise clients in making optimal capital choices that will empower results and improve operational effectiveness for their business. With more than 80 offices in 50 countries, our worldwide client base has access to the broadest portfolio of integrated capital solutions and services.
To learn how Aon Benfield helps empower results, please visit aonbenfield.com. Copyright © by Impact Forecasting® No claim to original government works. The text and graphics of this publication are provided for ® informational purposes only. While Impact Forecasting has tried to provide accurate and timely information, inadvertent technical inaccuracies and typographical errors may exist, and Impact ® Forecasting does not warrant that the information is accurate, complete or current.
The data presented at this site is intended to convey only general information on current natural perils and must not be used to make life-or-death decisions or decisions relating to the protection of property, as the data may not be accurate. Please listen to official information sources for current storm information. This data has no official status and should not be used for emergency response decision-making under any circumstances. ® Cat Alerts use publicly available data from the internet and other sources.
Impact Forecasting summarizes this publicly available information for the convenience of those individuals who have ® contacted Impact Forecasting and expressed an interest in natural catastrophes of various types. To find out more about Impact Forecasting or to sign up for the Cat Reports, visit Impact Forecasting’s webpage at impactforecasting.com. Copyright © by Aon plc. All rights reserved. No part of this document may be reproduced, stored in a retrieval system, or transmitted in any form or by any means, electronic, mechanical, photocopying, recording or otherwise. Impact Forecasting® is a wholly owned subsidiary of Aon plc. Global Catastrophe Recap: December 2015 17 .


