


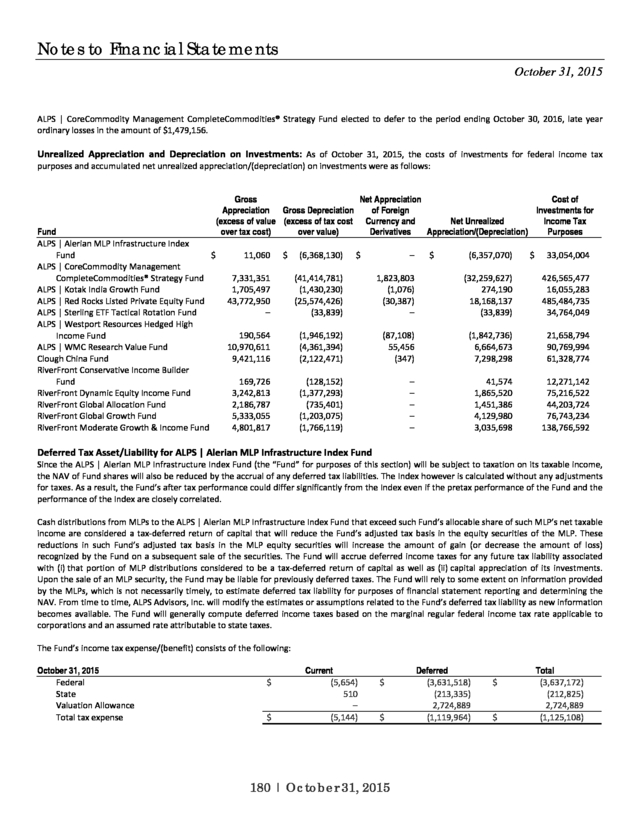


Description
October 31, 2015
annual
REPORT
ALPS | Alerian MLP Infrastructure Index Fund
ALPS | CoreCommodity Management CompleteCommodities® Strategy Fund
ALPS | Kotak India Growth Fund
ALPS | Red Rocks Listed Private Equity Fund
ALPS | Sterling ETF Tactical Rotation Fund
ALPS | Westport Resources Hedged High Income Fund
ALPS | WMC Research Value Fund
Clough China Fund
RiverFront Global Allocation Series
An ALPS Advisors Solution
. table of
CONTENTS
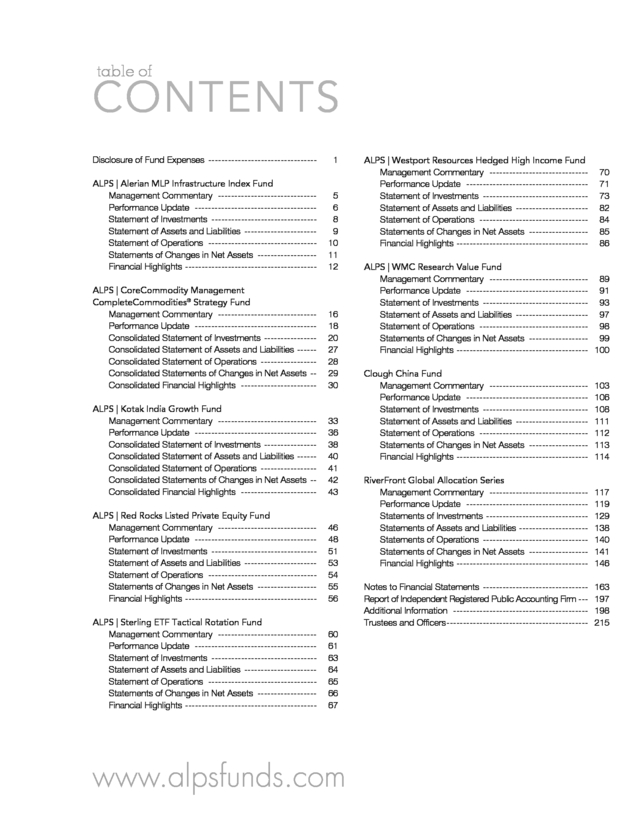
Disclosure of Fund Expenses ---------------------------------- 1
ALPS | Alerian MLP Infrastructure Index Fund
Management Commentary ------------------------------- 5
Performance Update -------------------------------------- 6
Statement of Investments --------------------------------- 8
Statement of Assets and Liabilities ----------------------- 9
Statement of Operations ---------------------------------- 10
Statements of Changes in Net Assets ------------------- 11
Financial Highlights ----------------------------------------- 12
ALPS | CoreCommodity Management
CompleteCommodities® Strategy Fund
Management Commentary ------------------------------- 16
Performance Update -------------------------------------- 18
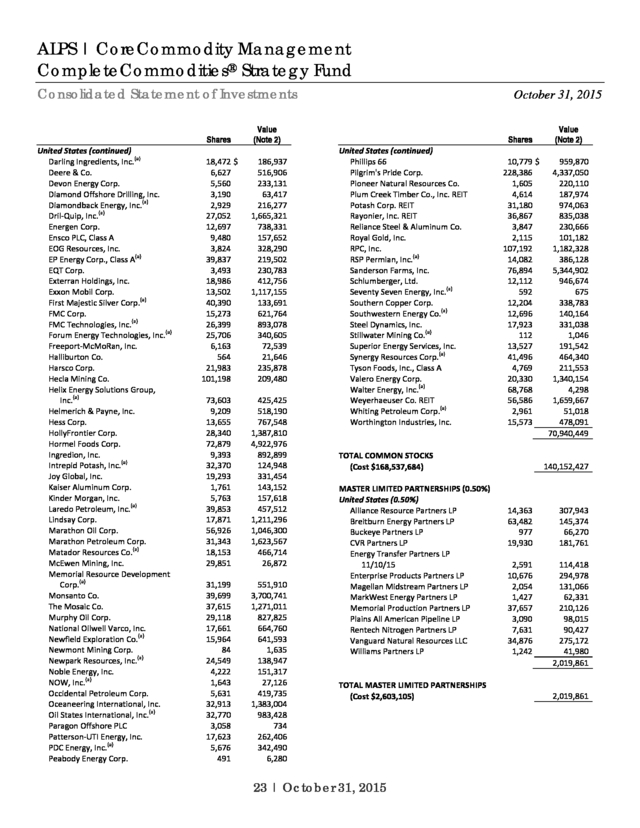
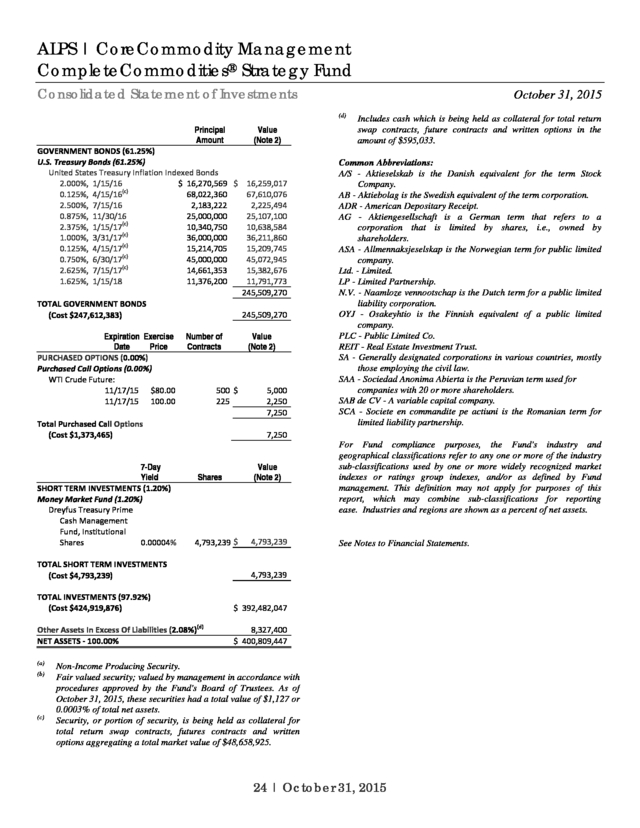
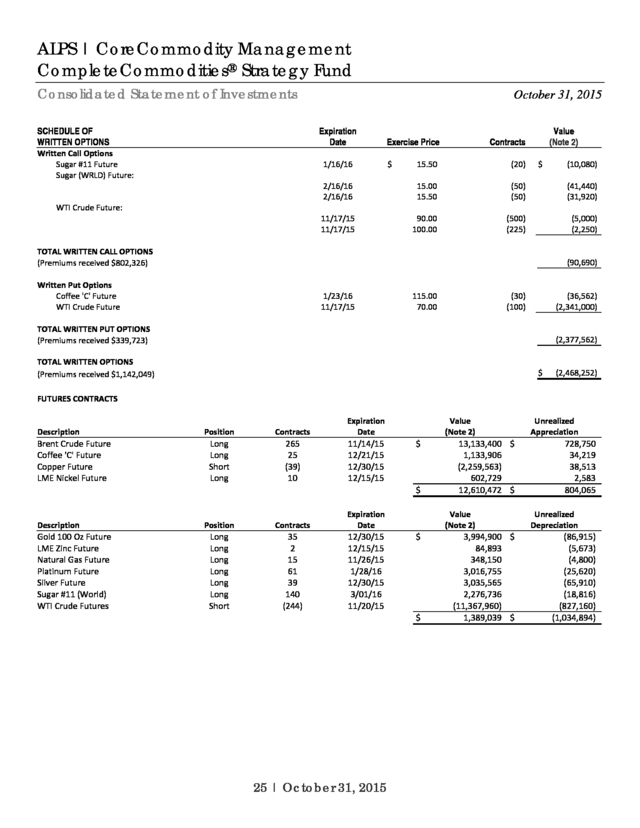
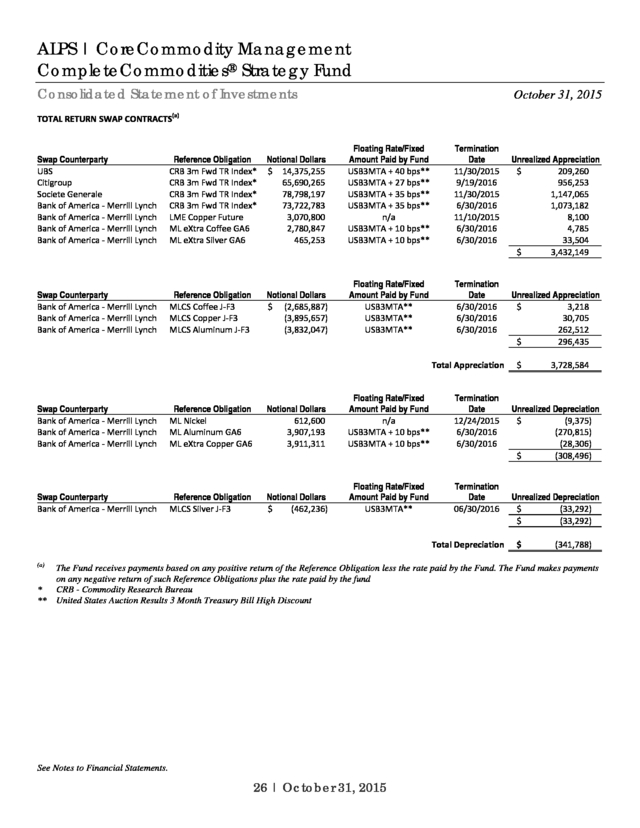
Consolidated Statement of Investments ----------------- 20
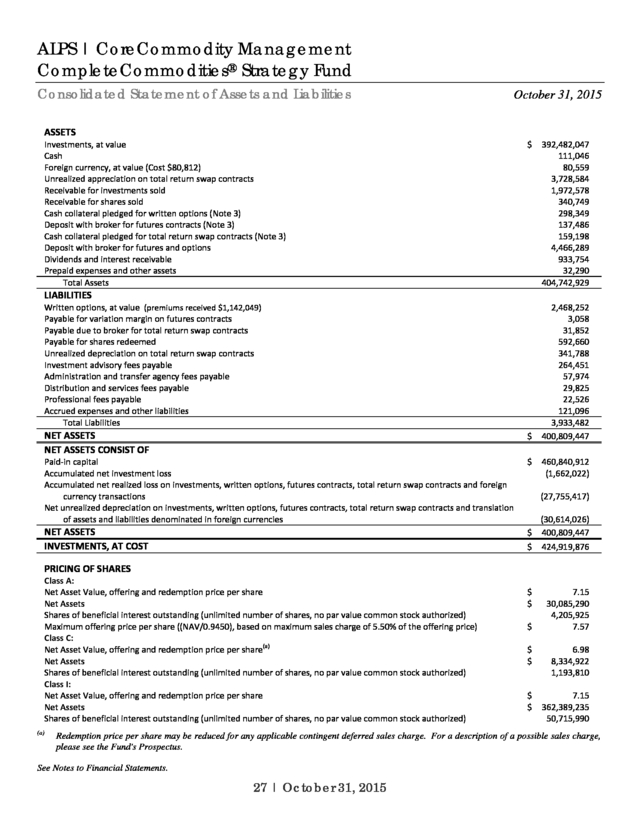
Consolidated Statement of Assets and Liabilities ------- 27
Consolidated Statement of Operations ------------------ 28
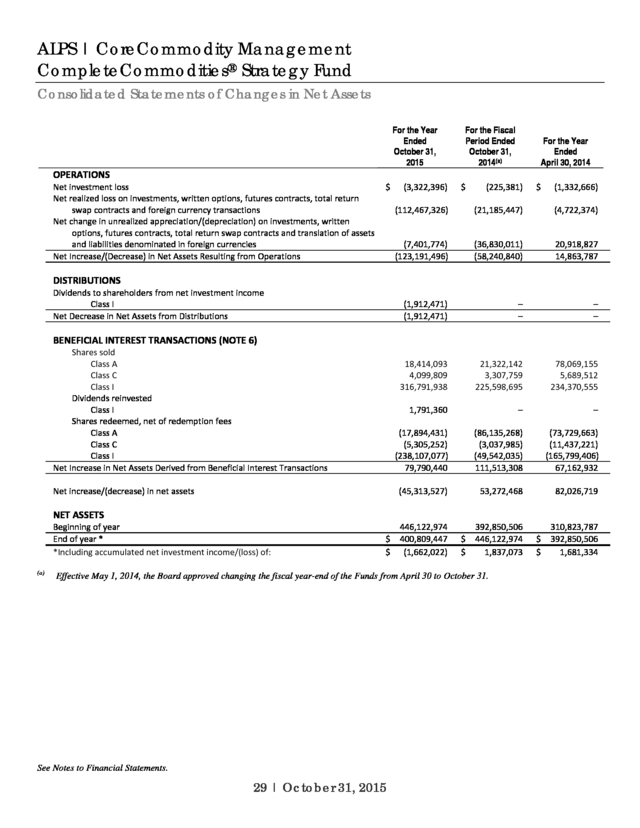
Consolidated Statements of Changes in Net Assets --- 29
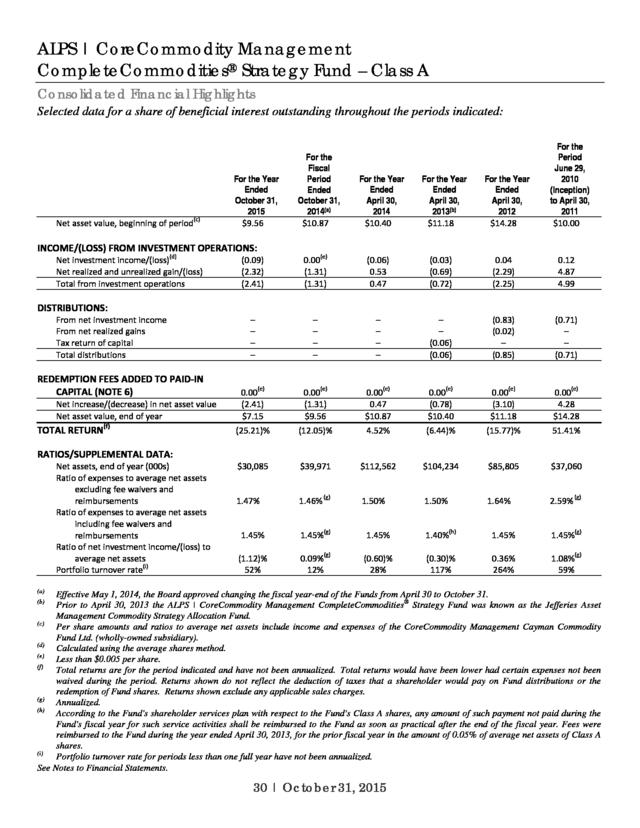
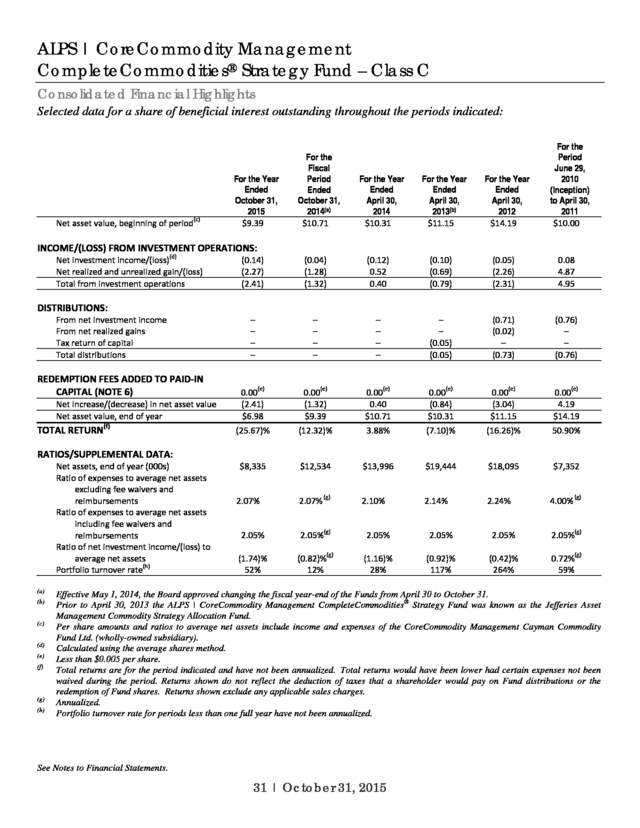
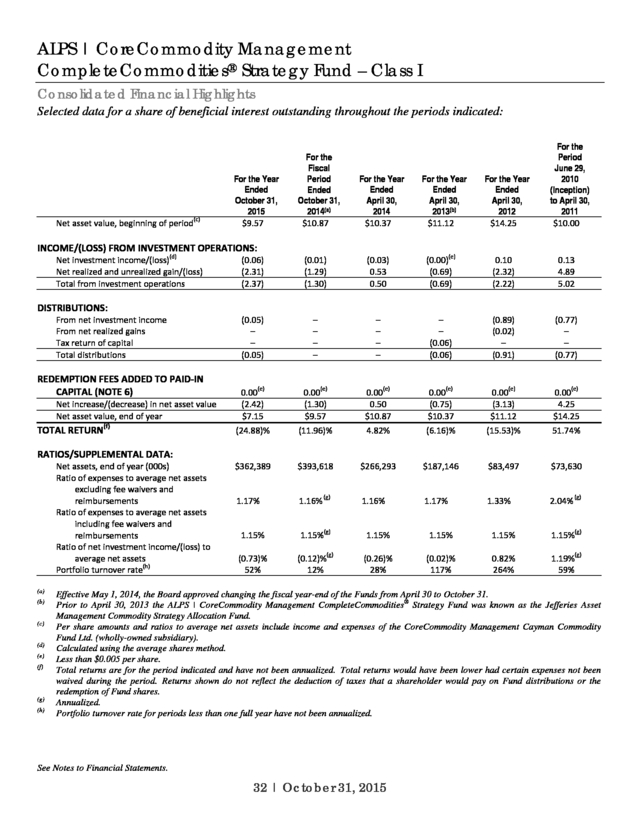
Consolidated Financial Highlights ------------------------ 30
ALPS | Kotak India Growth Fund
Management Commentary ------------------------------- 33
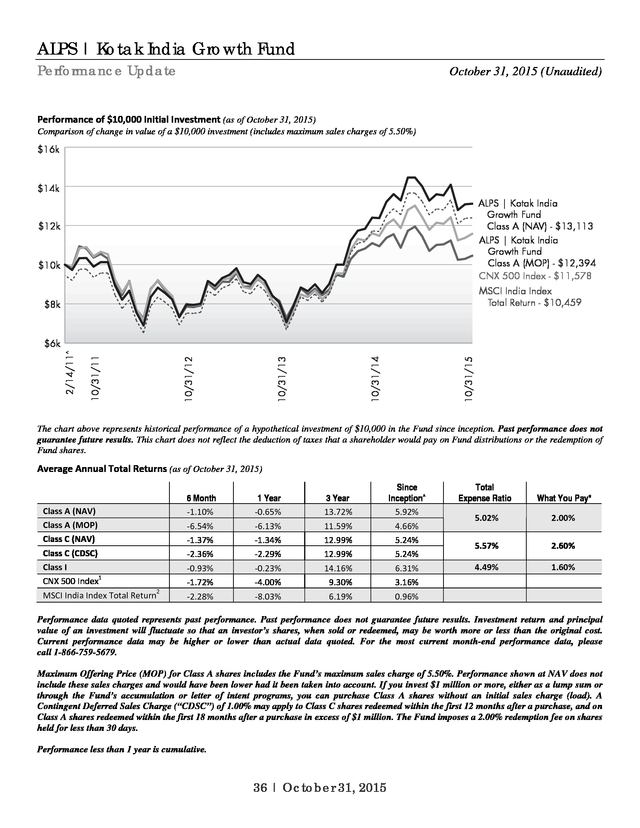
Performance Update -------------------------------------- 36
Consolidated Statement of Investments ----------------- 38
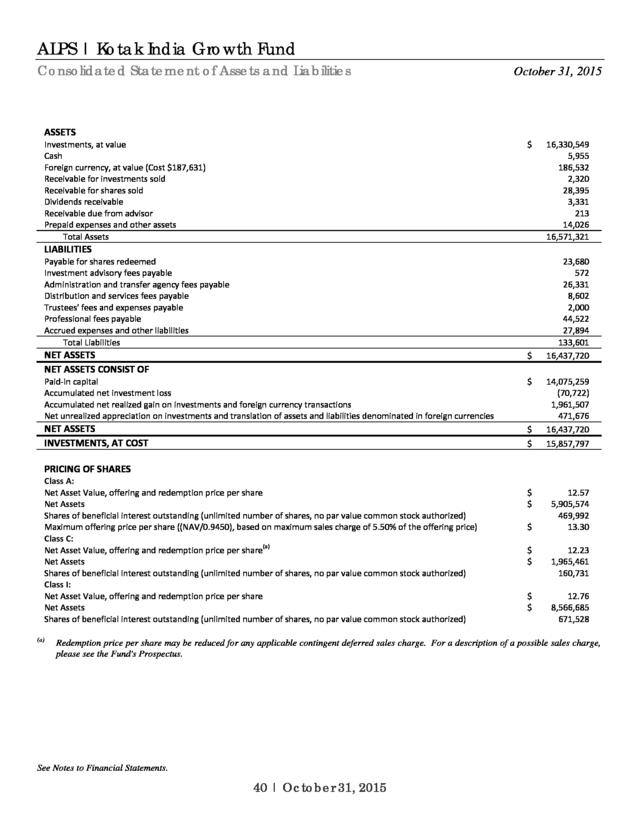
Consolidated Statement of Assets and Liabilities ------- 40
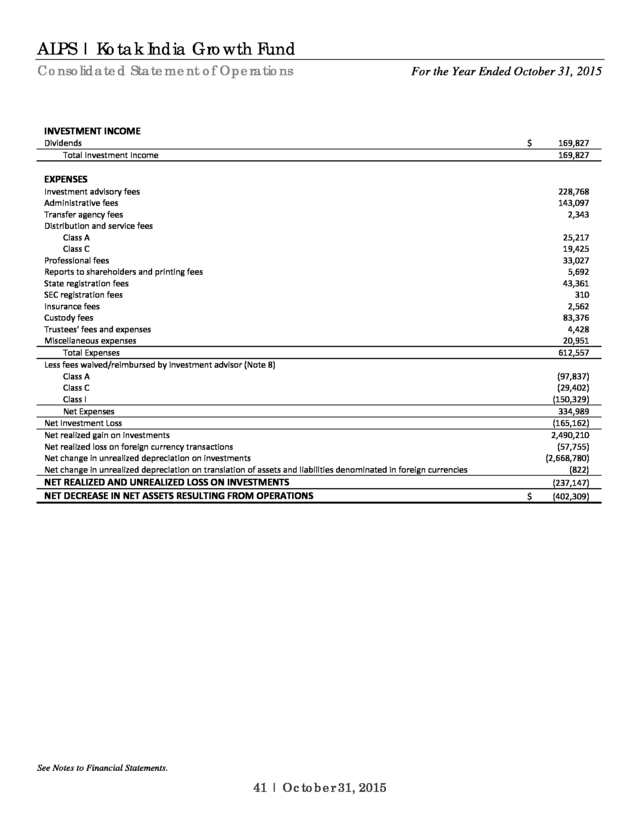
Consolidated Statement of Operations ------------------ 41
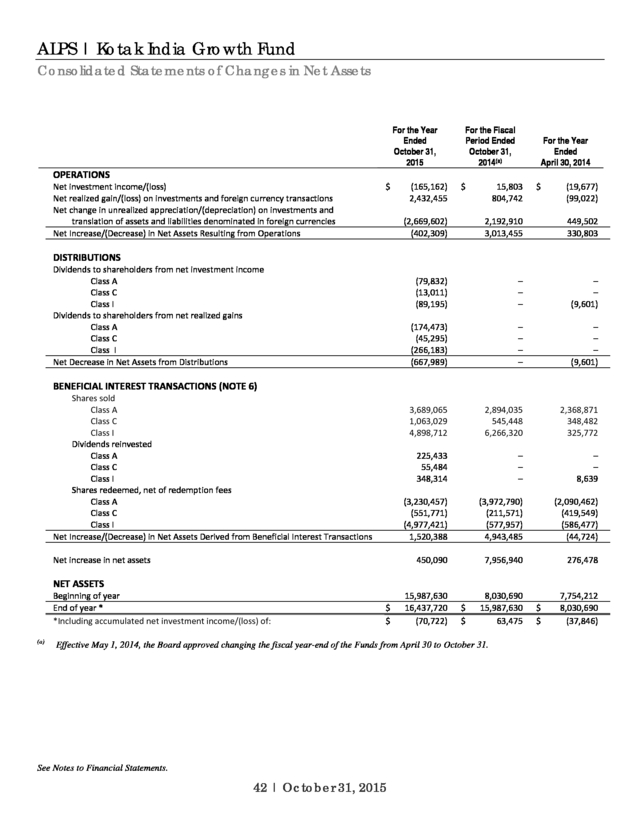
Consolidated Statements of Changes in Net Assets --- 42
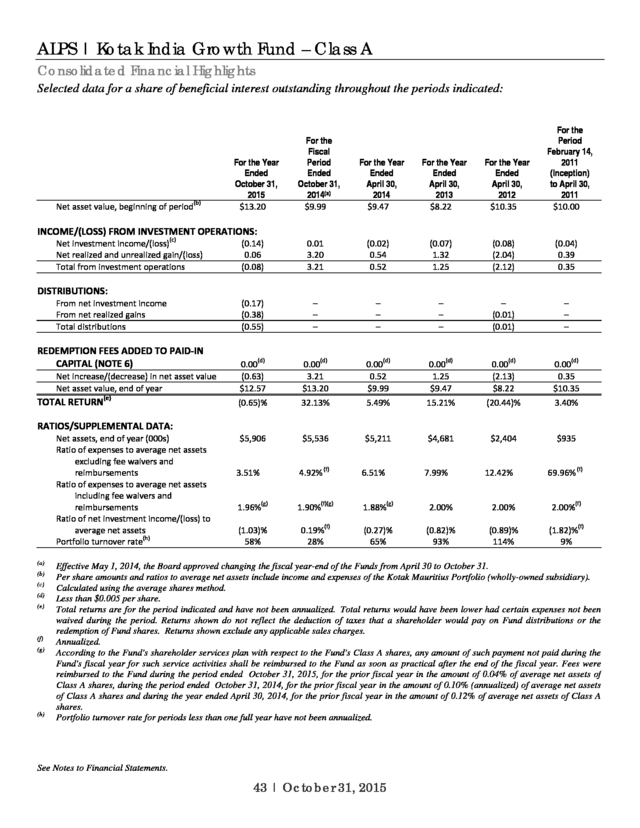
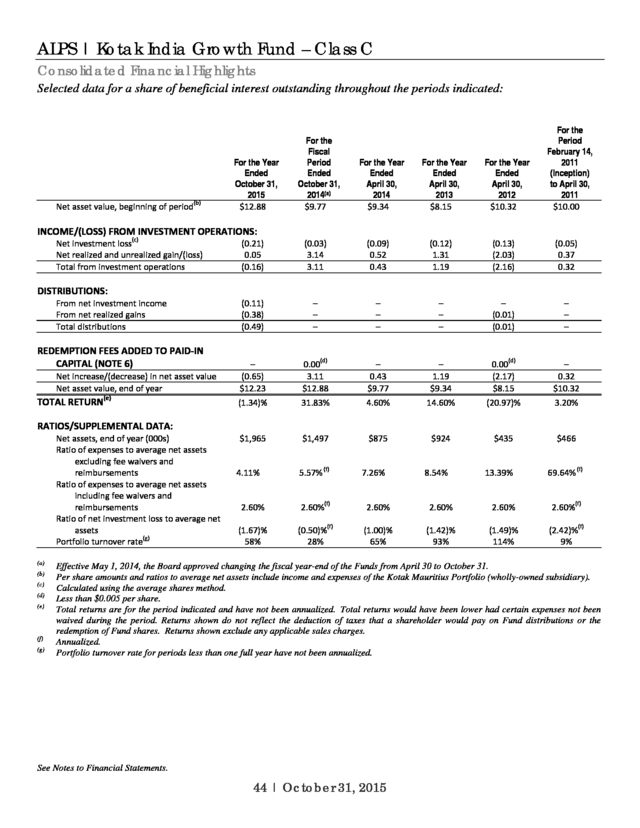
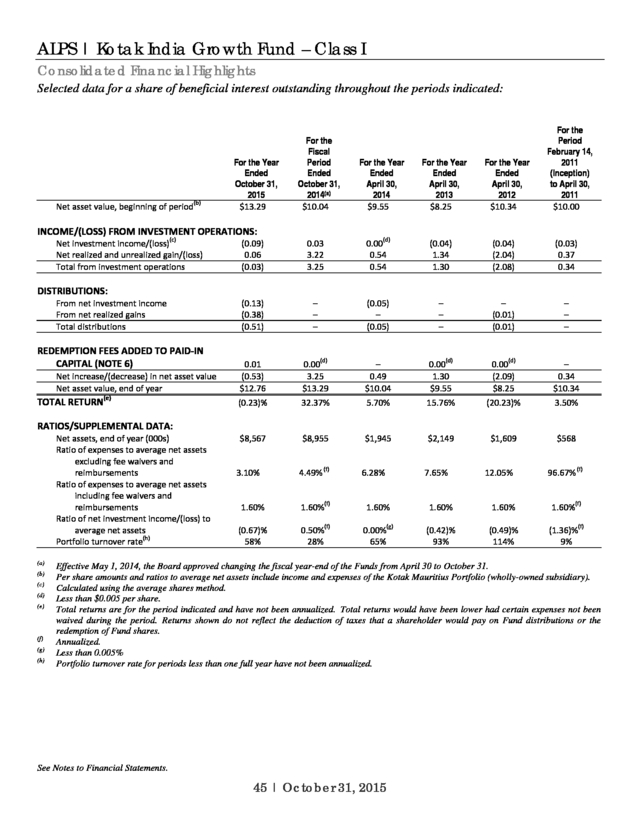
Consolidated Financial Highlights ------------------------ 43
ALPS | Red Rocks Listed Private Equity Fund
Management Commentary ------------------------------- 46
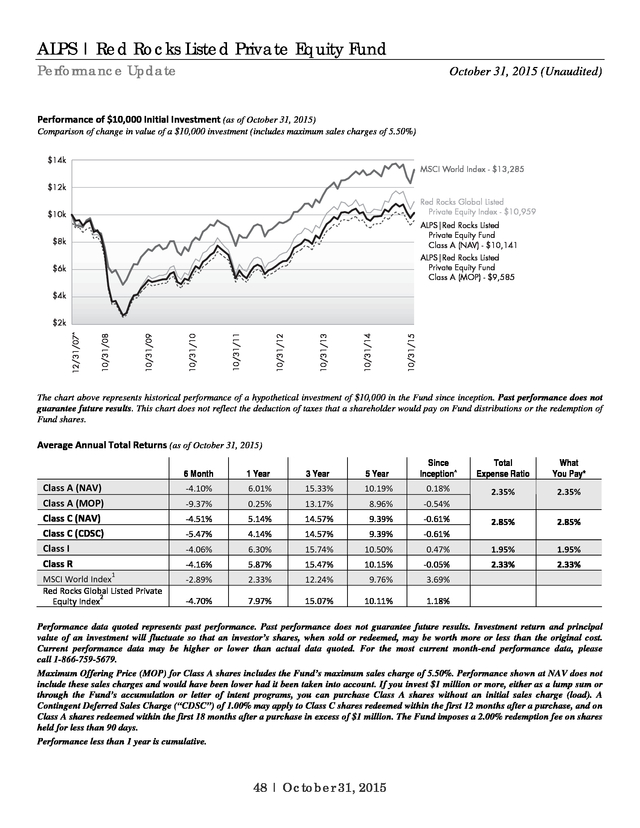
Performance Update -------------------------------------- 48
Statement of Investments --------------------------------- 51
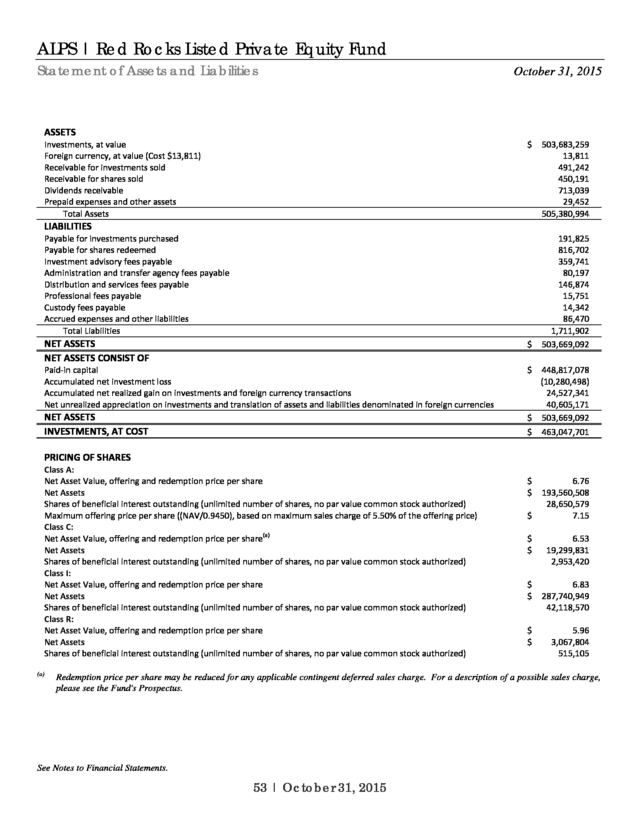
Statement of Assets and Liabilities ----------------------- 53
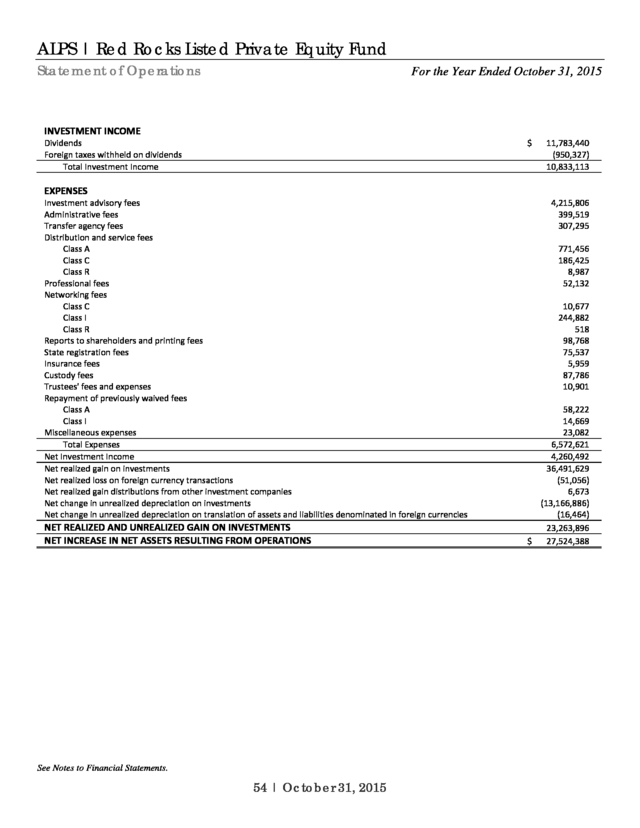
Statement of Operations ---------------------------------- 54
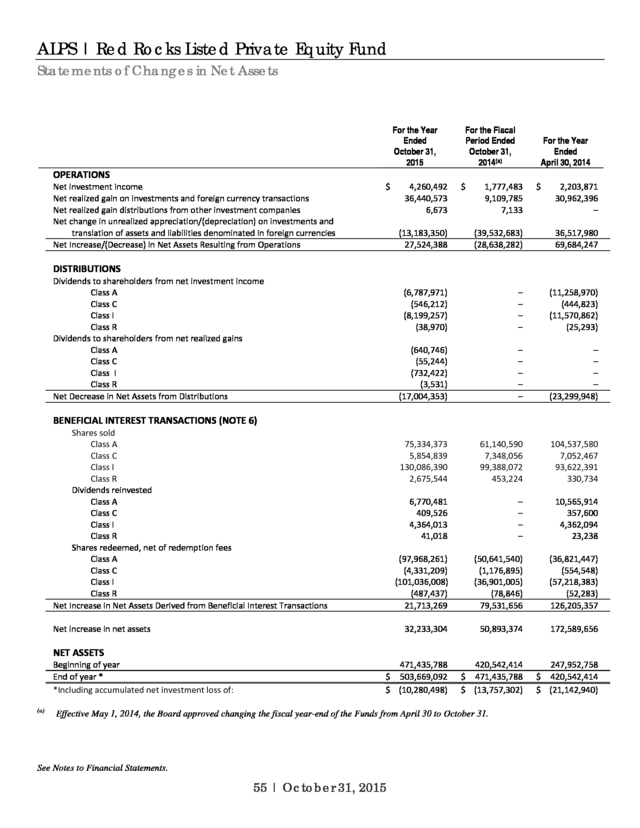
Statements of Changes in Net Assets ------------------- 55
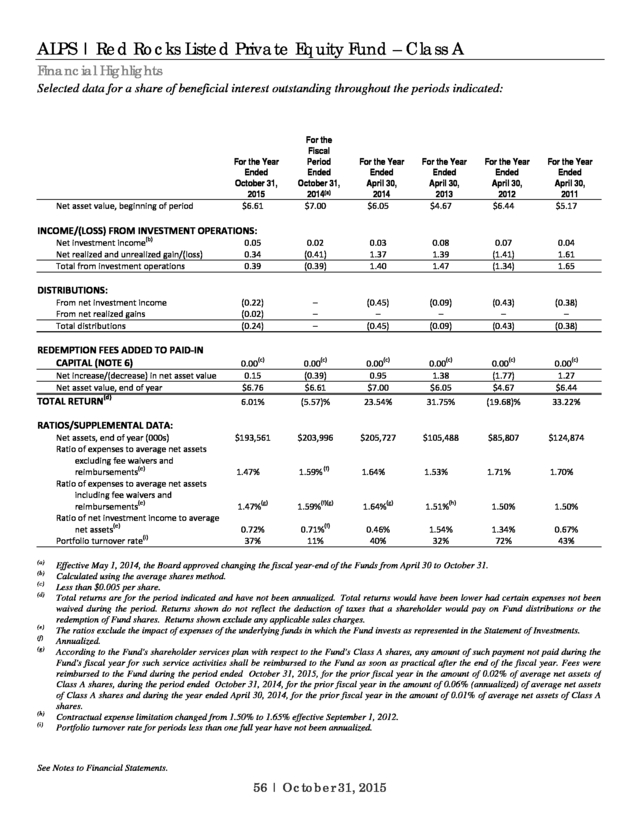
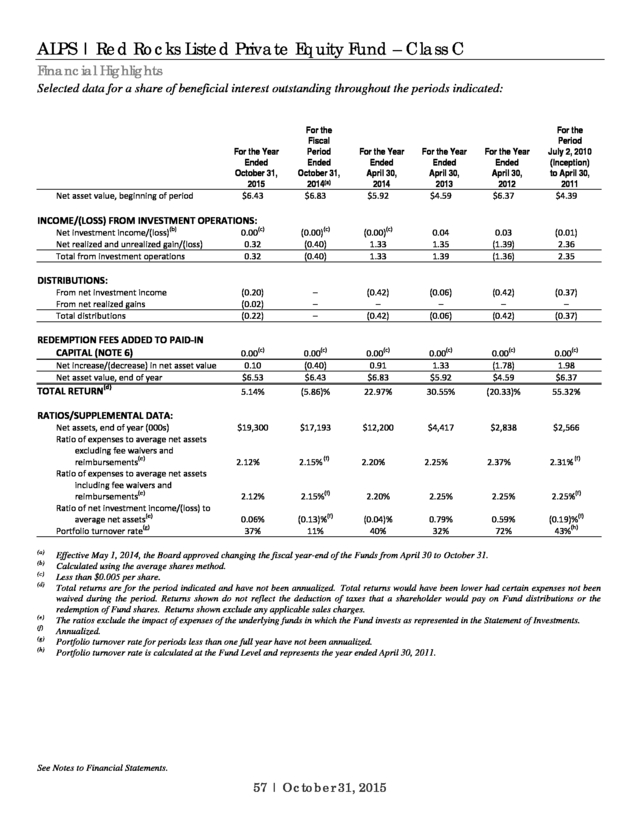
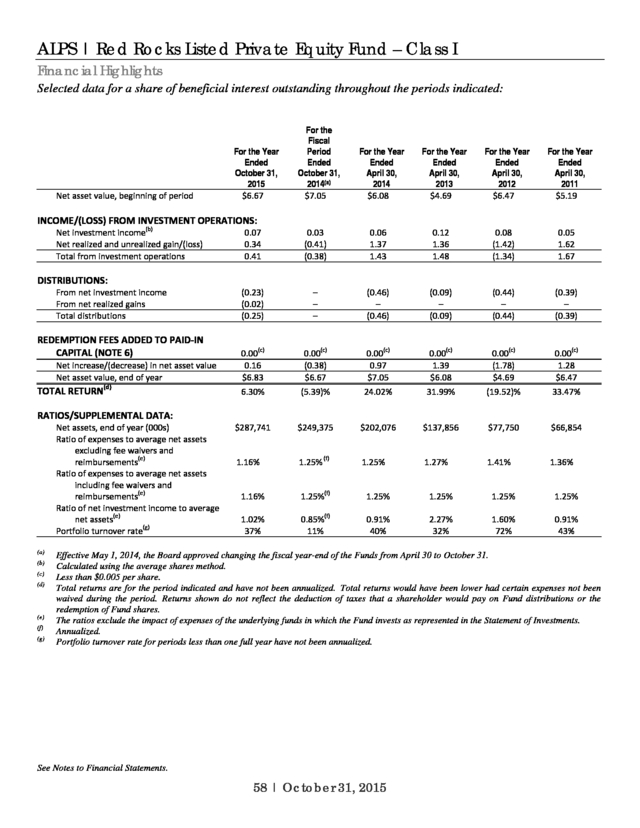
Financial Highlights ----------------------------------------- 56
ALPS | Sterling ETF Tactical Rotation Fund
Management Commentary ------------------------------- 60
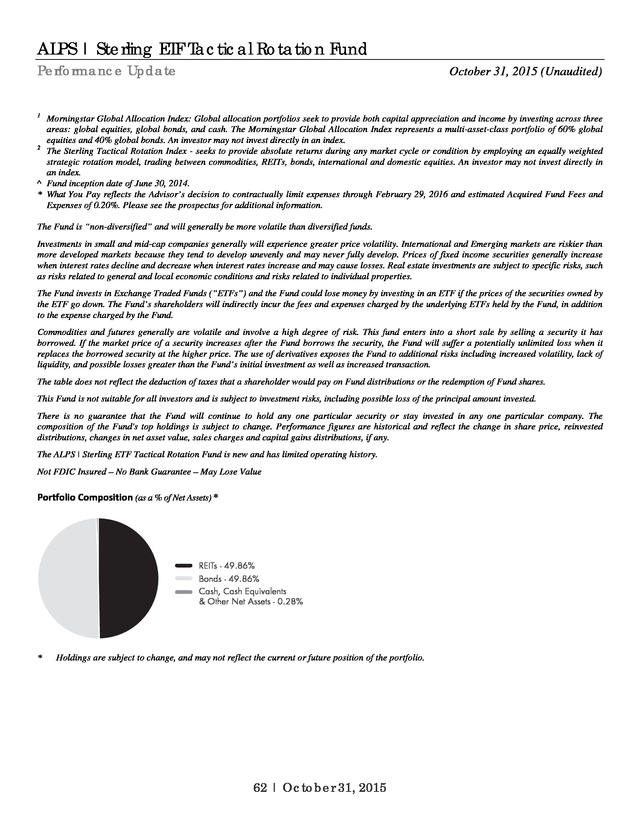
Performance Update -------------------------------------- 61
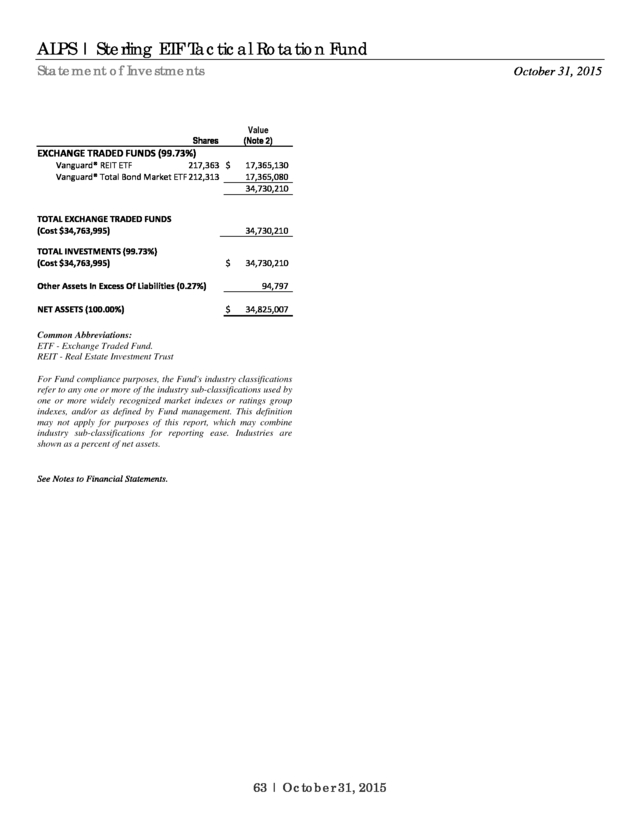
Statement of Investments --------------------------------- 63
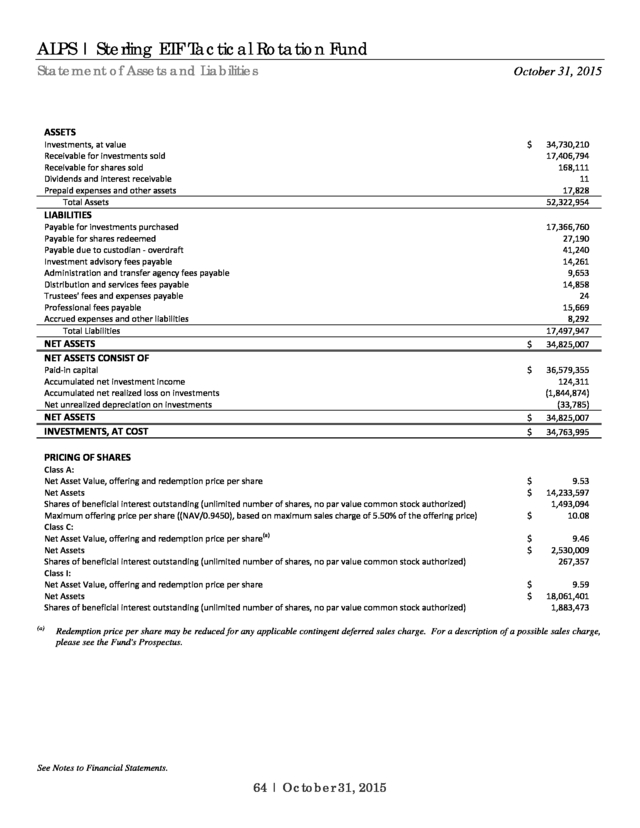
Statement of Assets and Liabilities ----------------------- 64
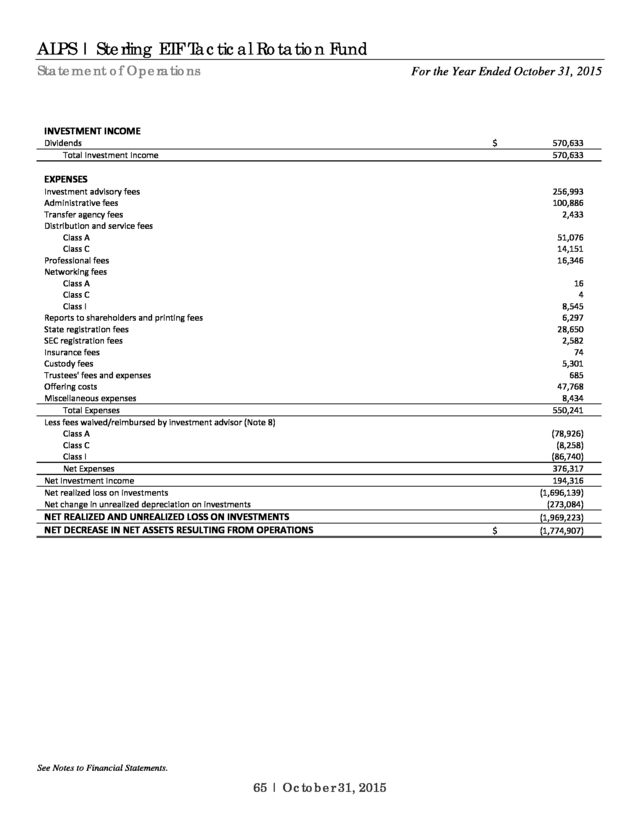
Statement of Operations ---------------------------------- 65
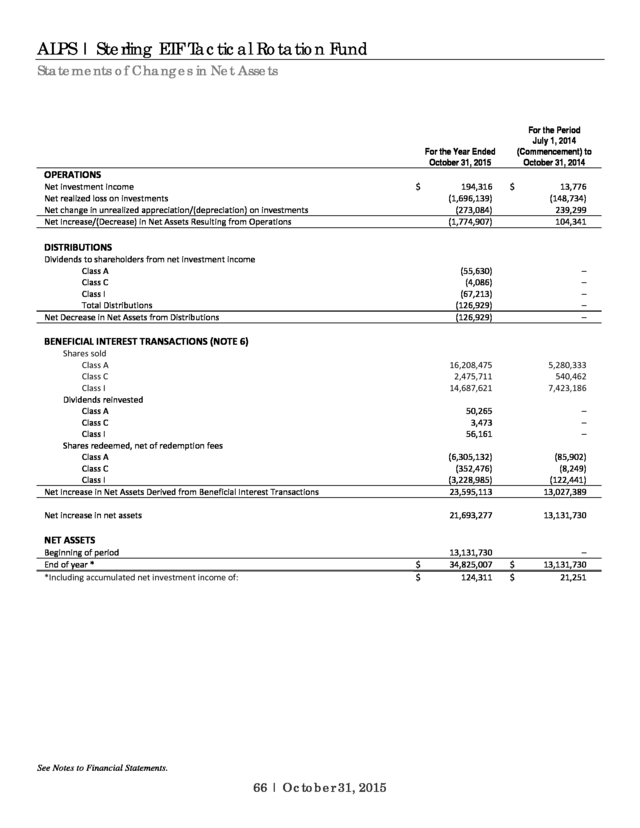
Statements of Changes in Net Assets ------------------- 66
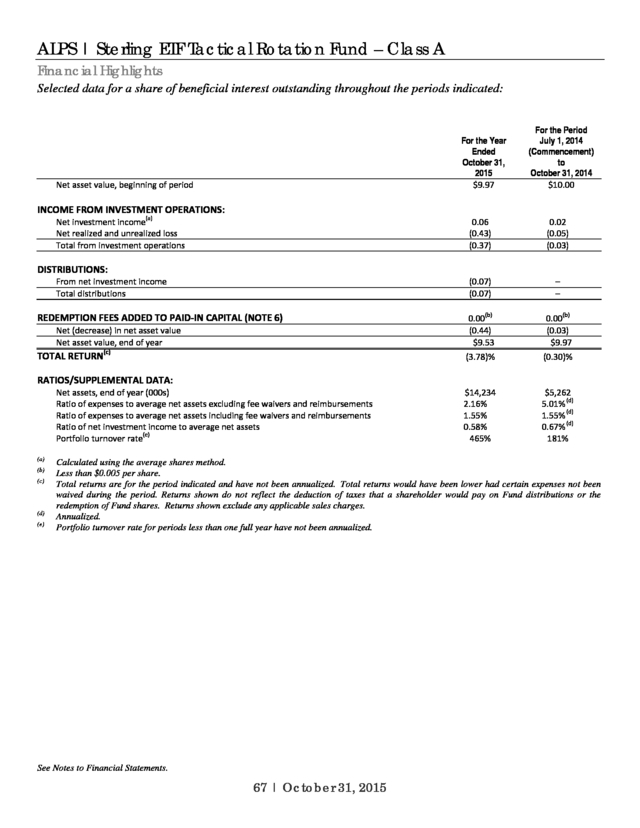
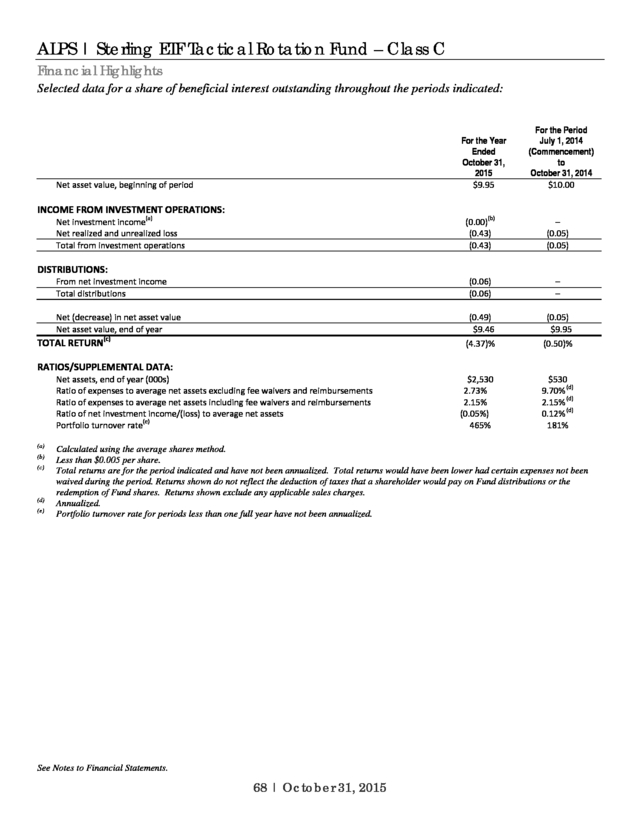
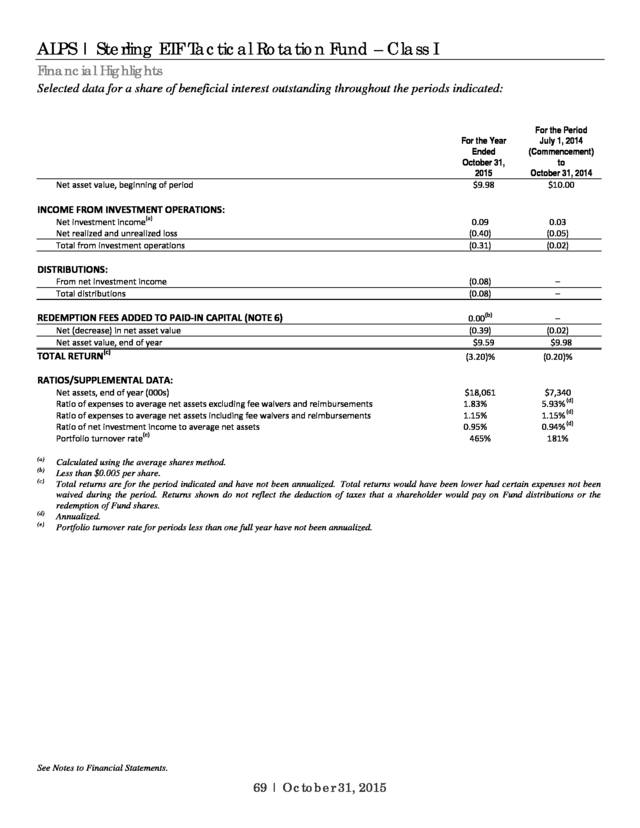
Financial Highlights ----------------------------------------- 67
www.alpsfunds.com
ALPS | Westport Resources Hedged High Income Fund
Management Commentary ------------------------------- 70
Performance Update -------------------------------------- 71
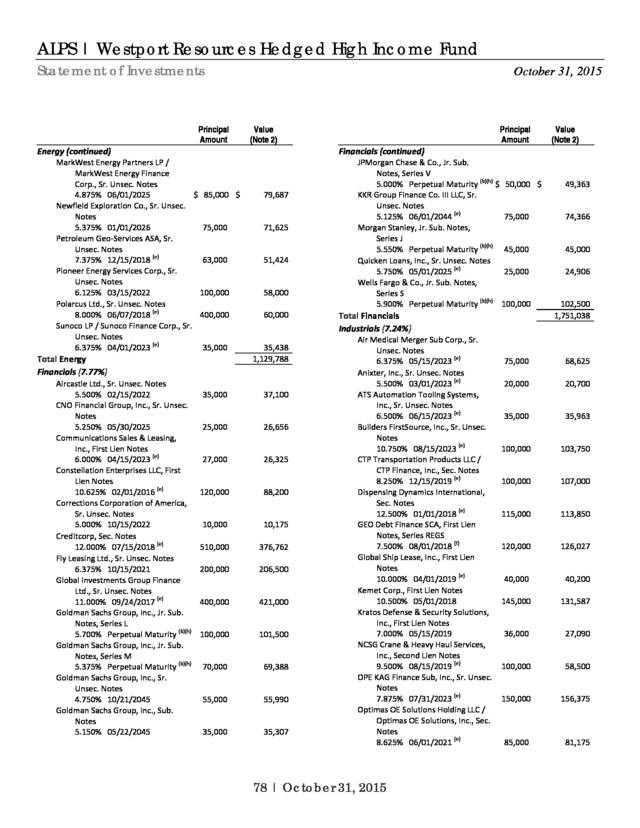
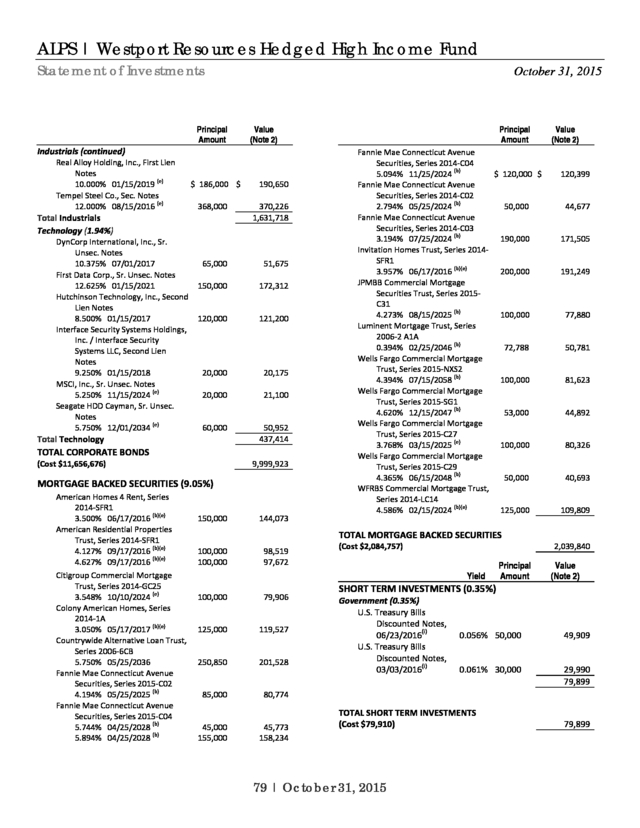
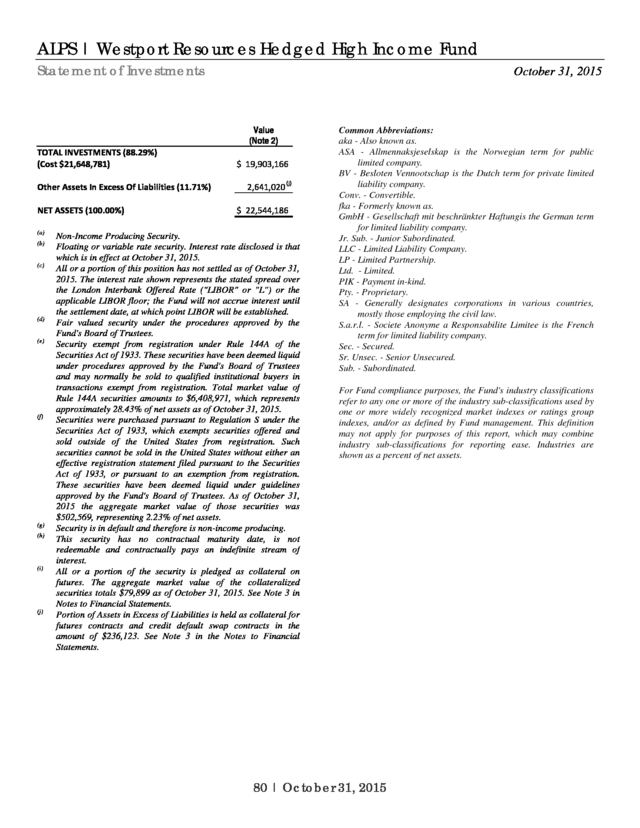
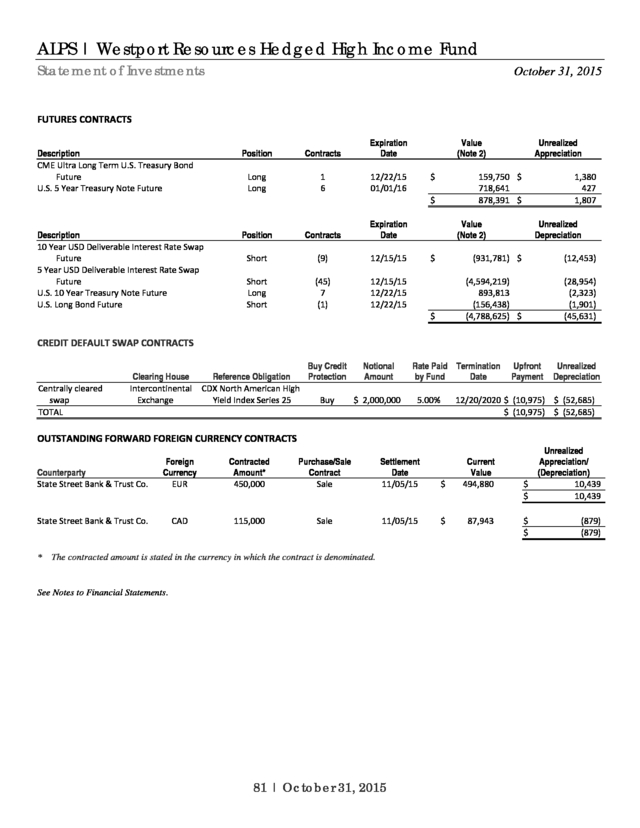
Statement of Investments --------------------------------- 73
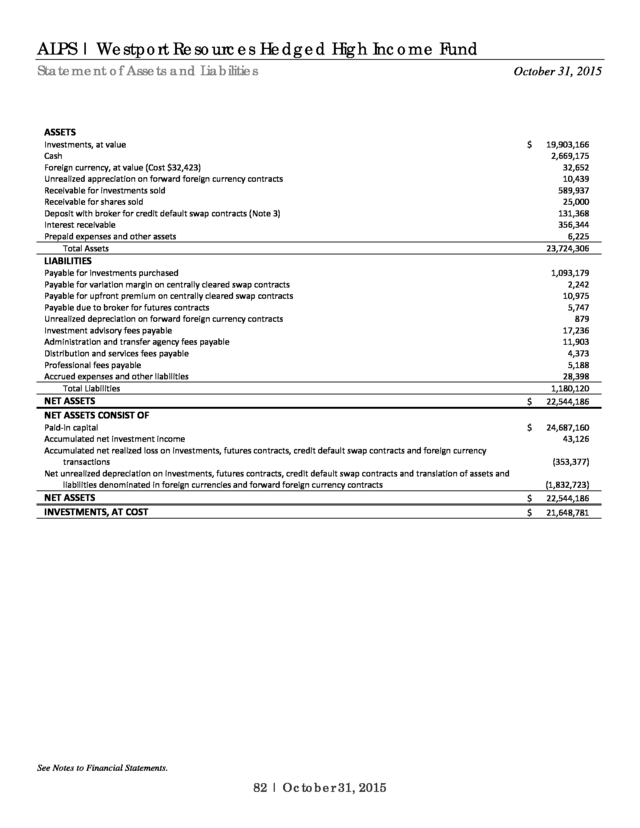
Statement of Assets and Liabilities ----------------------- 82
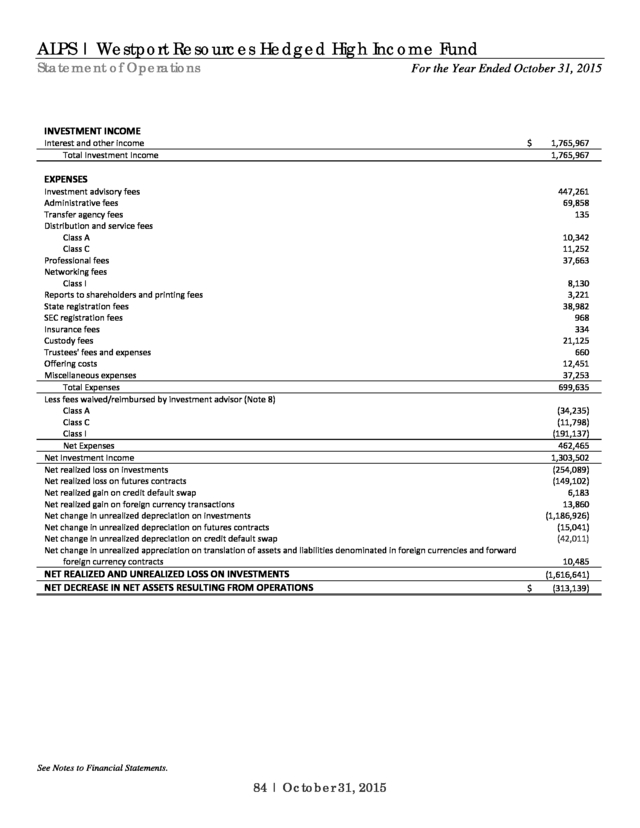
Statement of Operations ---------------------------------- 84
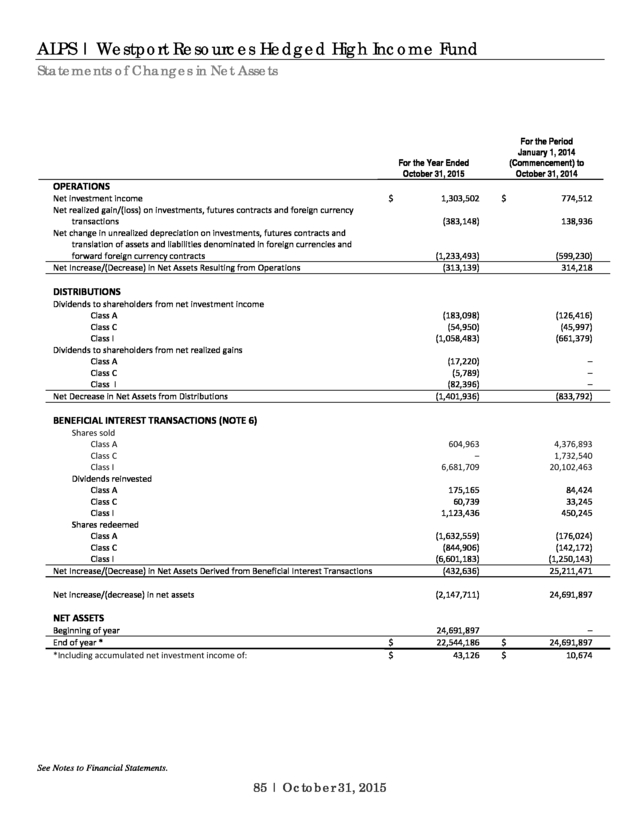
Statements of Changes in Net Assets ------------------- 85
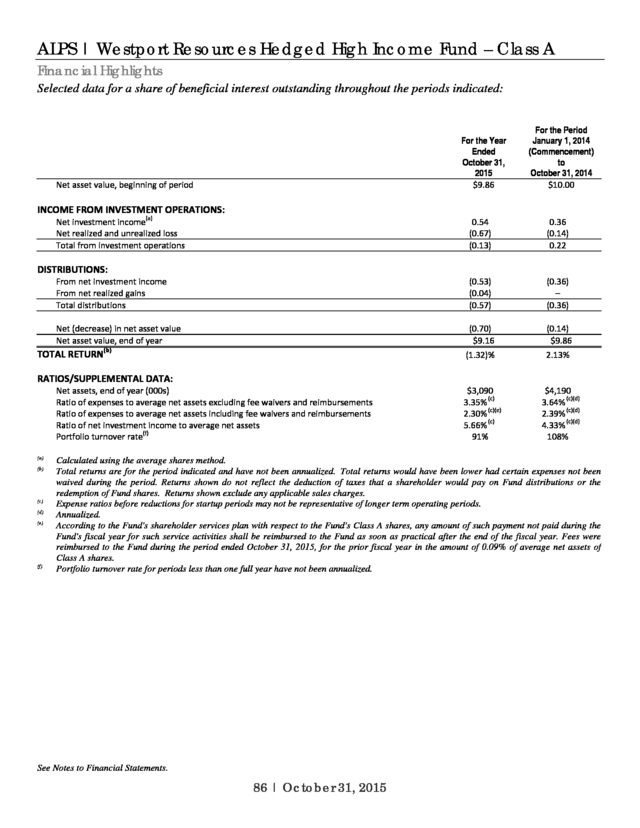
Financial Highlights ----------------------------------------- 86
ALPS | WMC Research Value Fund
Management Commentary ------------------------------- 89
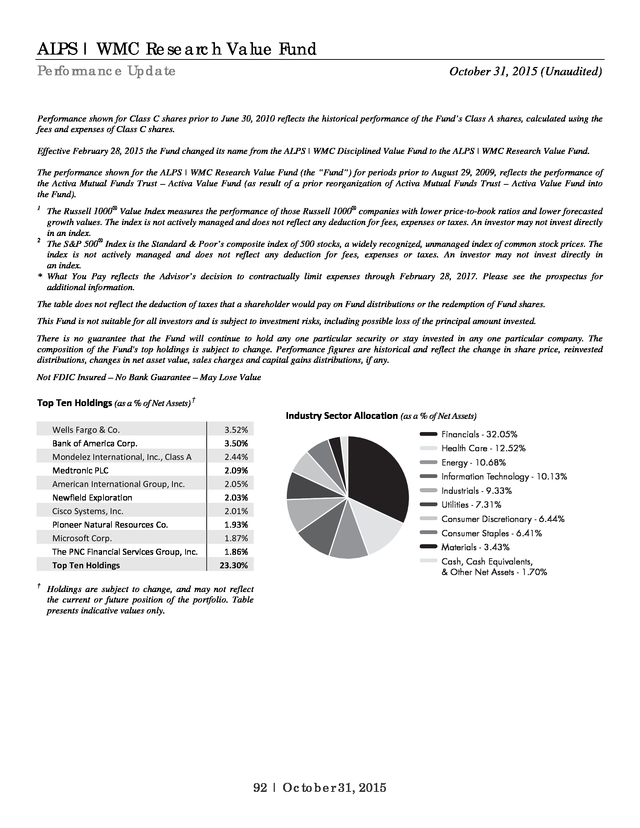
Performance Update -------------------------------------- 91
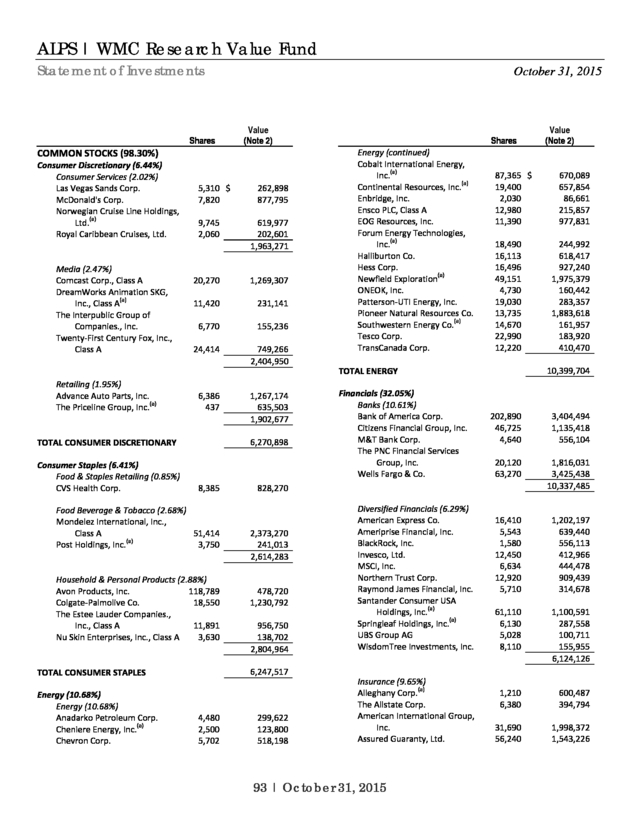
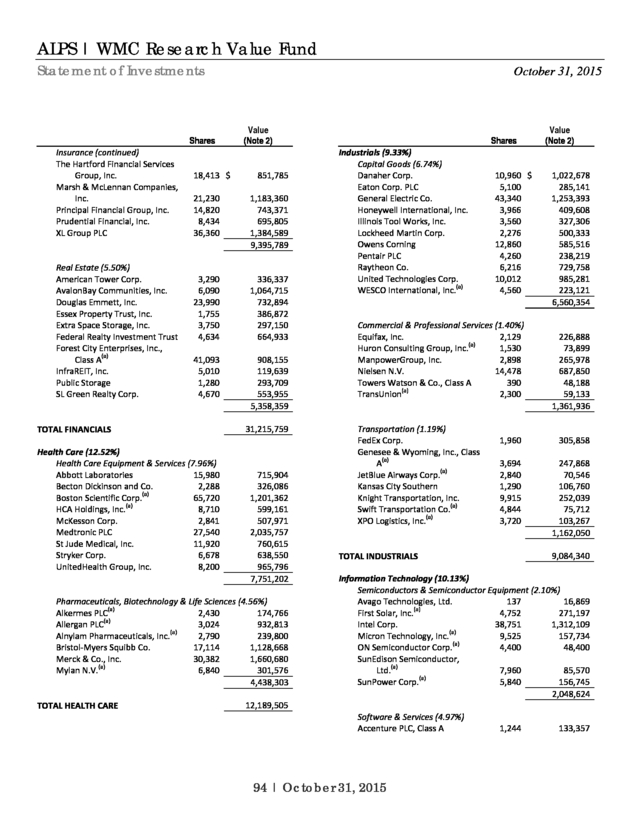
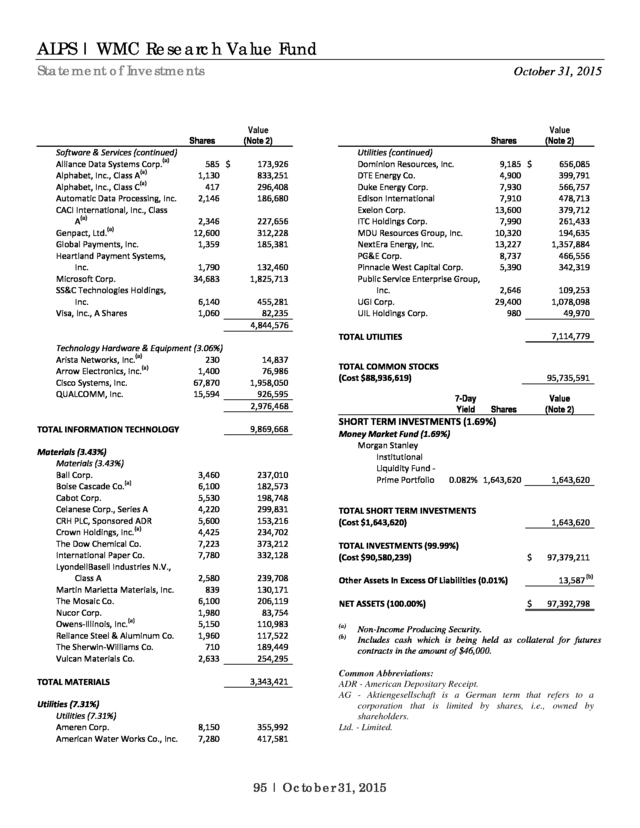
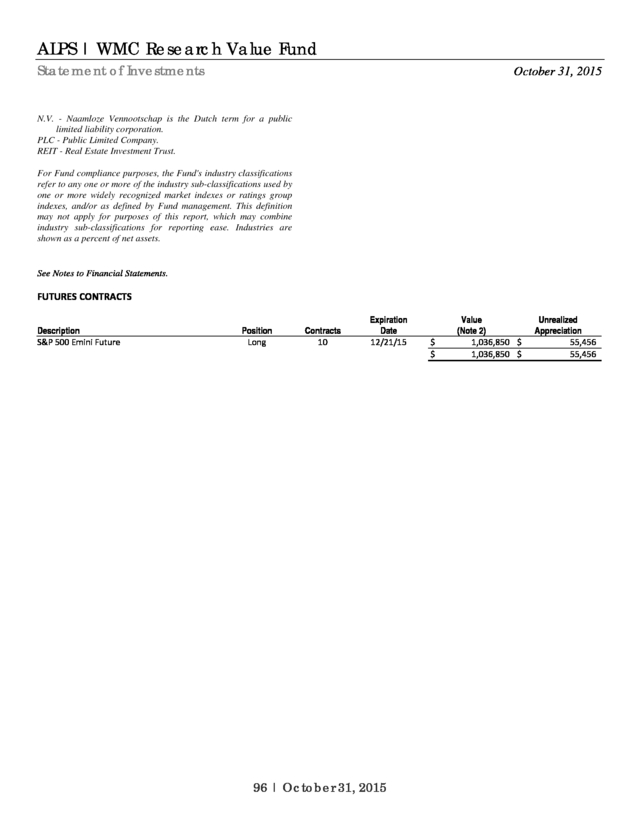
Statement of Investments --------------------------------- 93
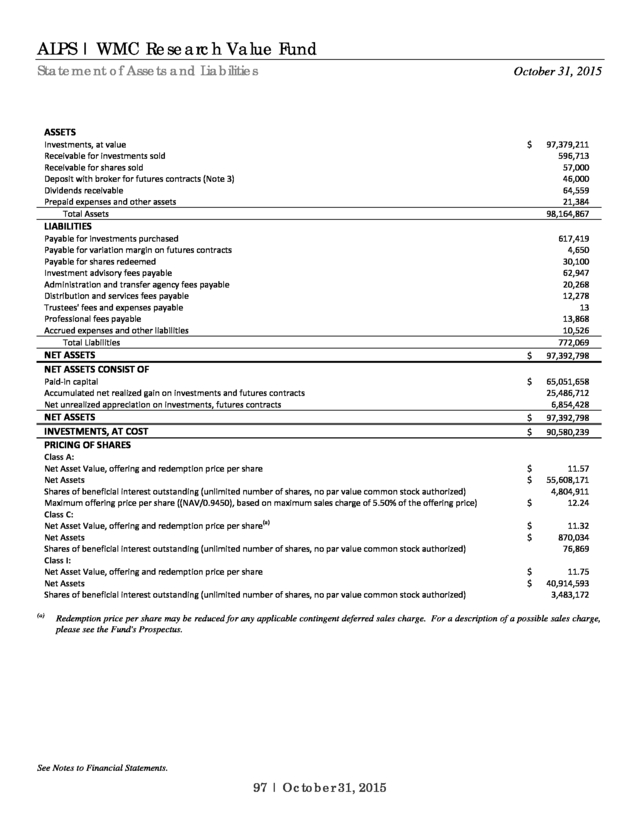
Statement of Assets and Liabilities ----------------------- 97
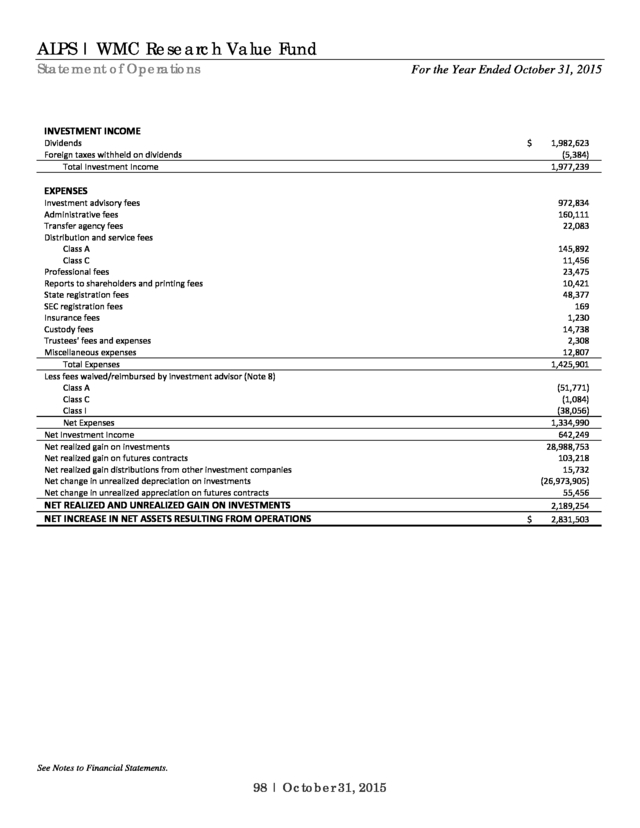
Statement of Operations ---------------------------------- 98
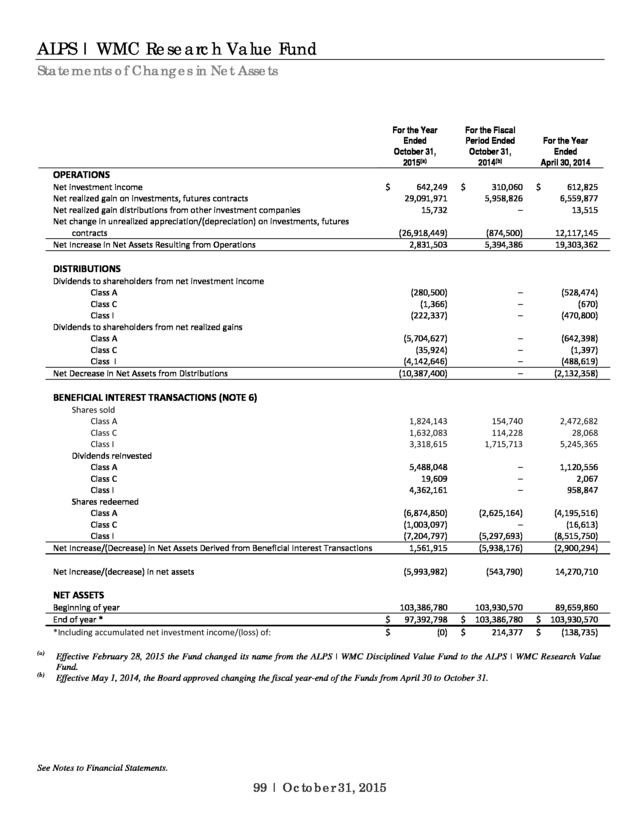
Statements of Changes in Net Assets ------------------- 99
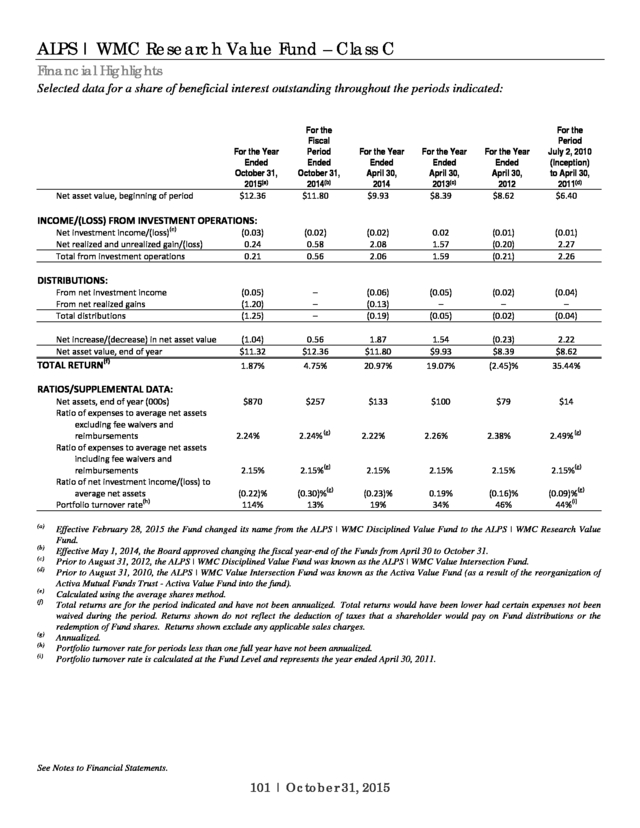
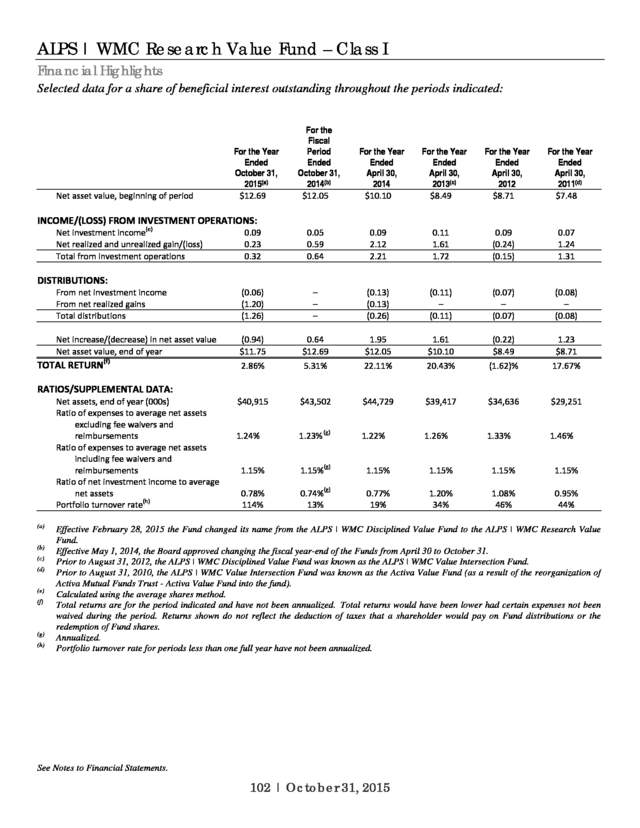
Financial Highlights ----------------------------------------- 100
Clough China Fund
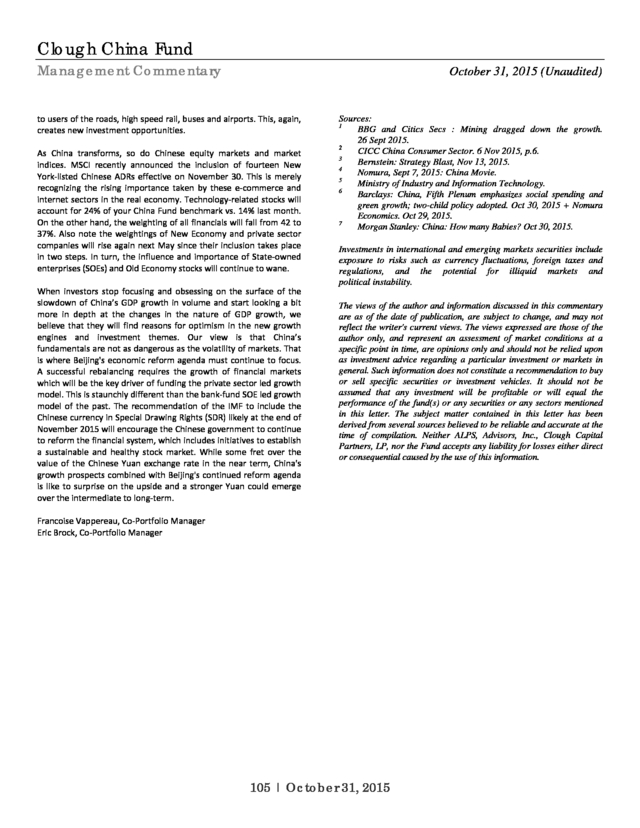
Management Commentary ------------------------------- 103
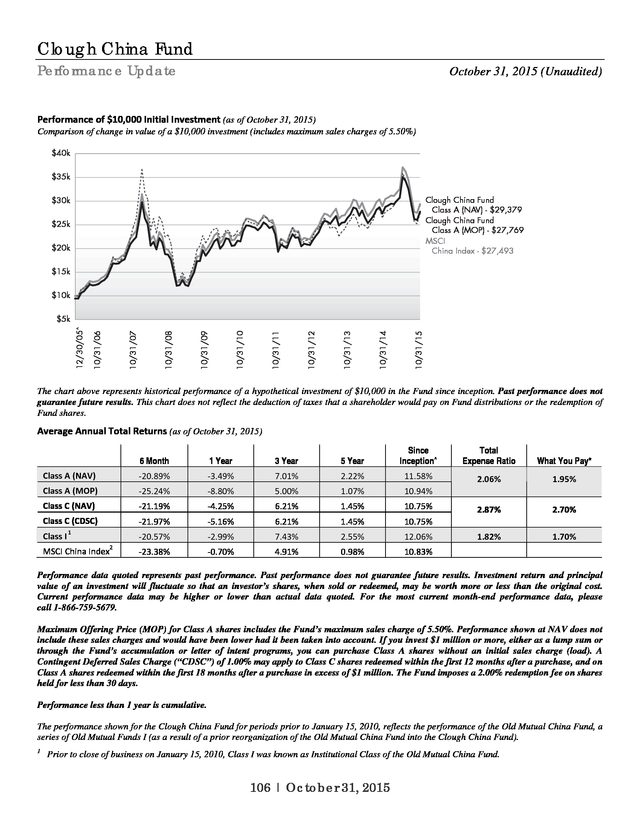
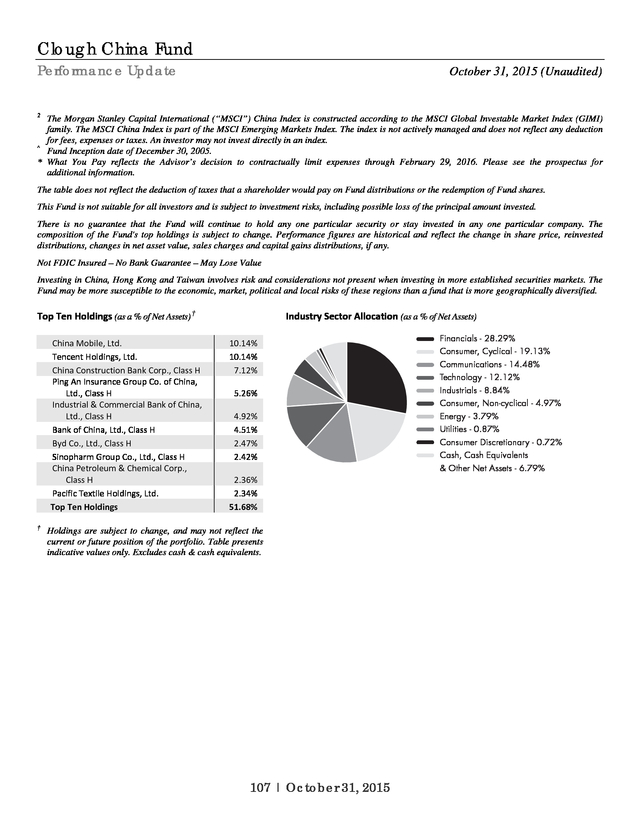
Performance Update -------------------------------------- 106
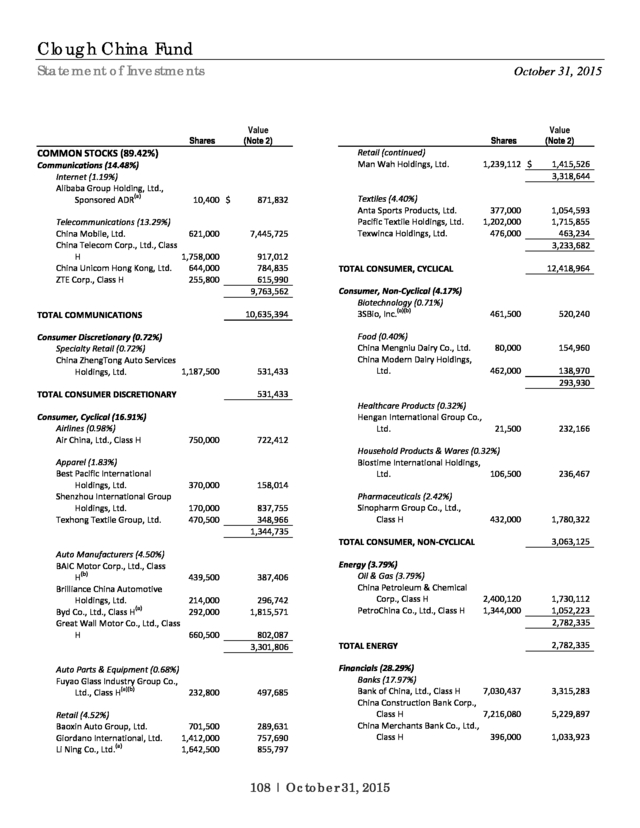
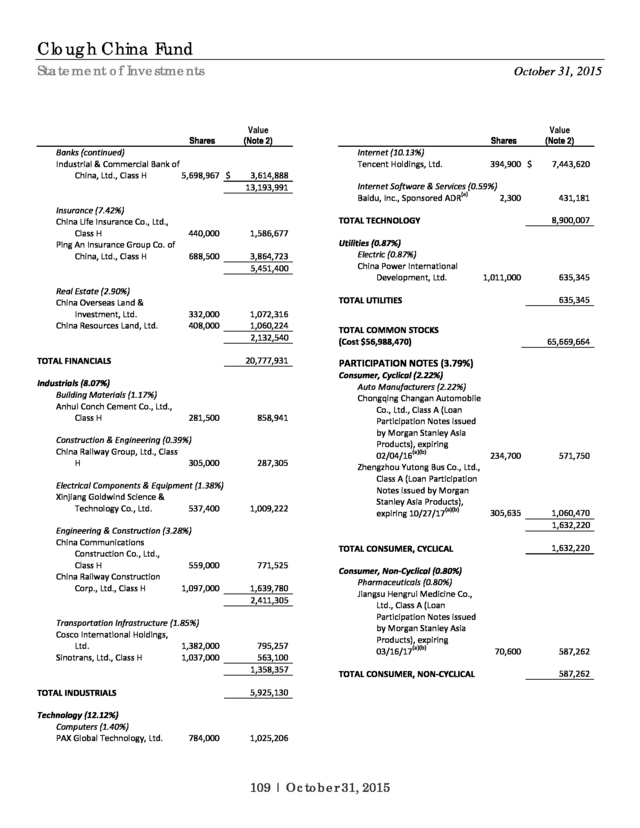
Statement of Investments --------------------------------- 108
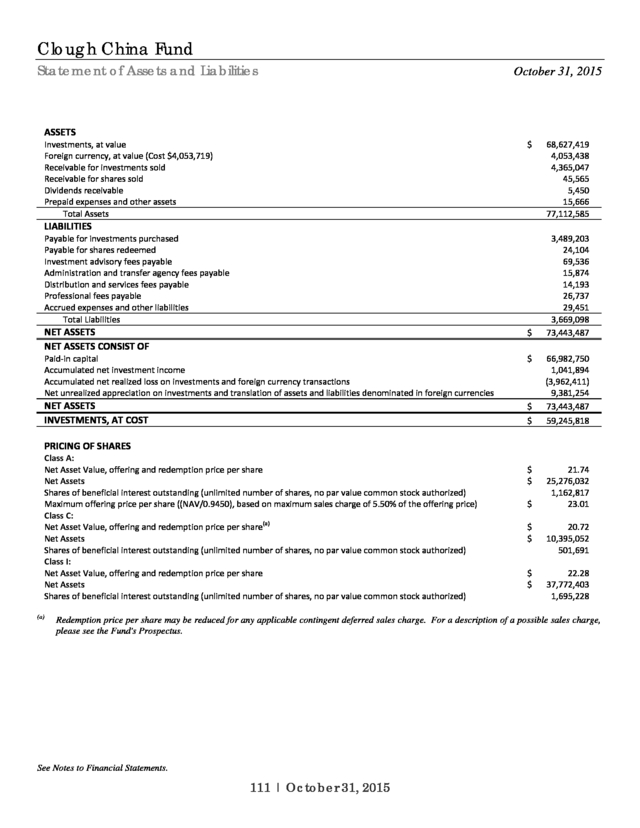
Statement of Assets and Liabilities ----------------------- 111
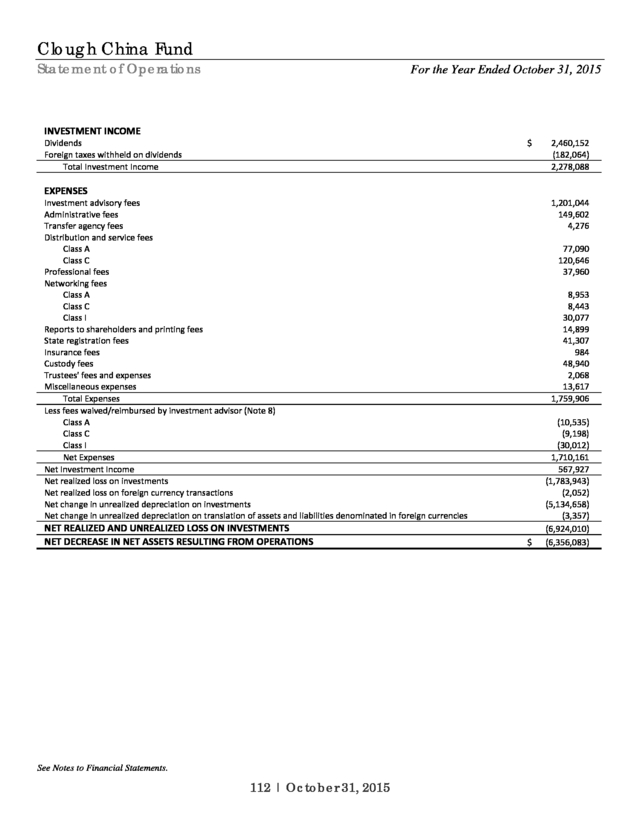
Statement of Operations ---------------------------------- 112
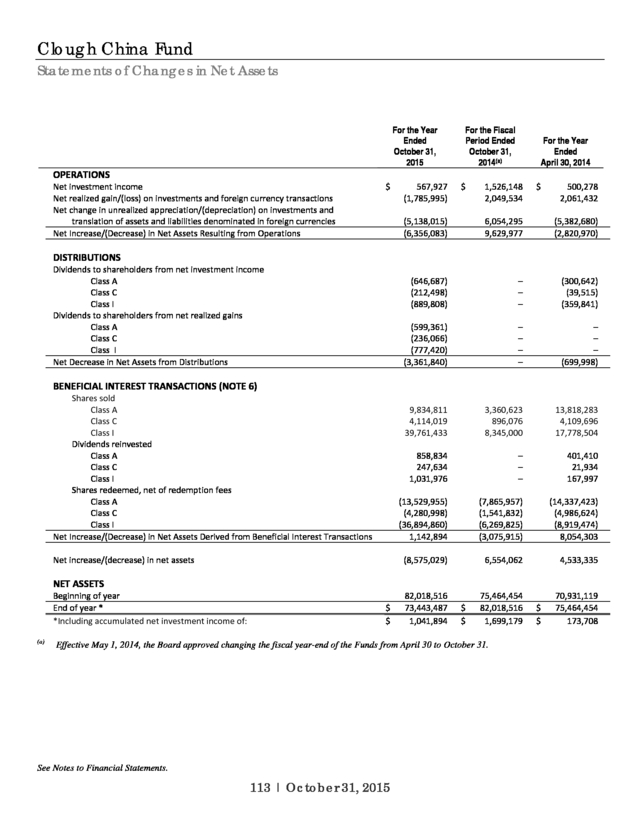
Statements of Changes in Net Assets ------------------- 113
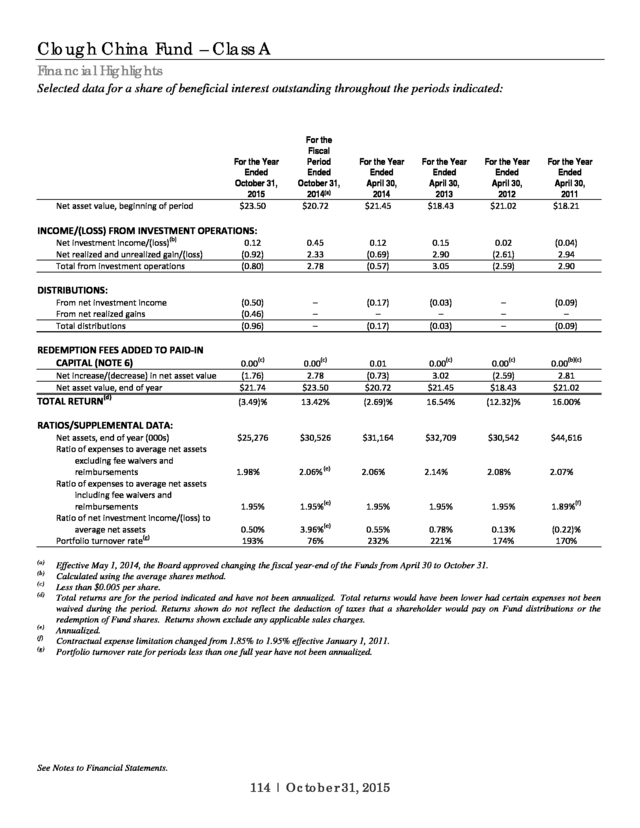
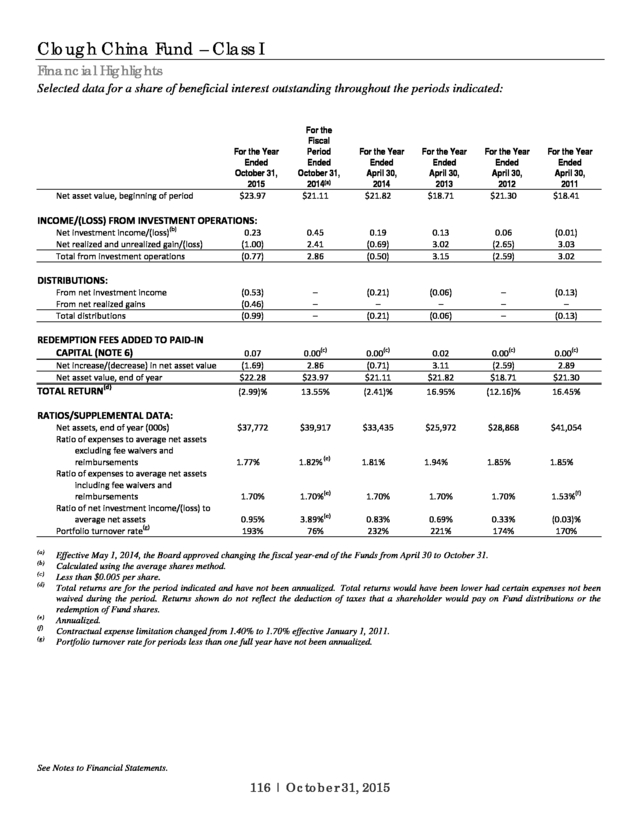
Financial Highlights ----------------------------------------- 114
RiverFront Global Allocation Series
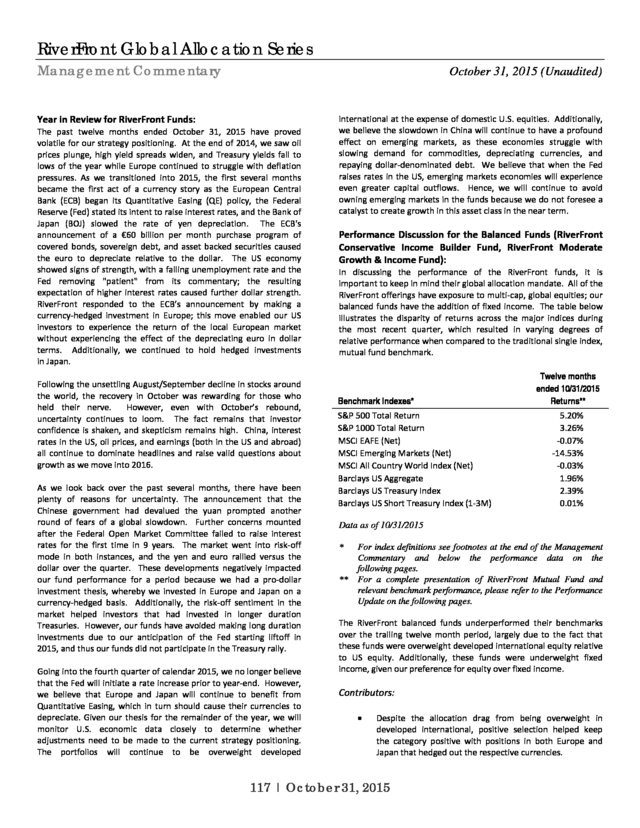
Management Commentary ------------------------------- 117
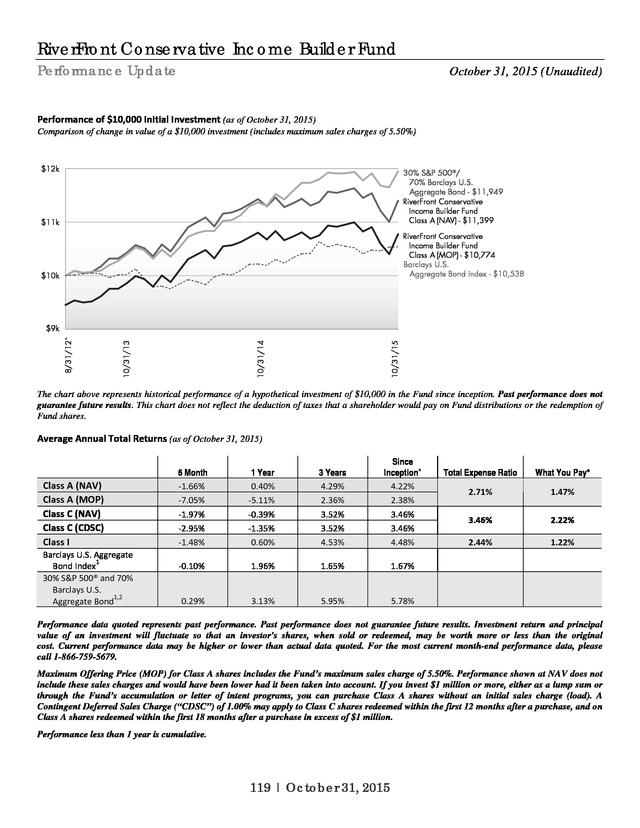
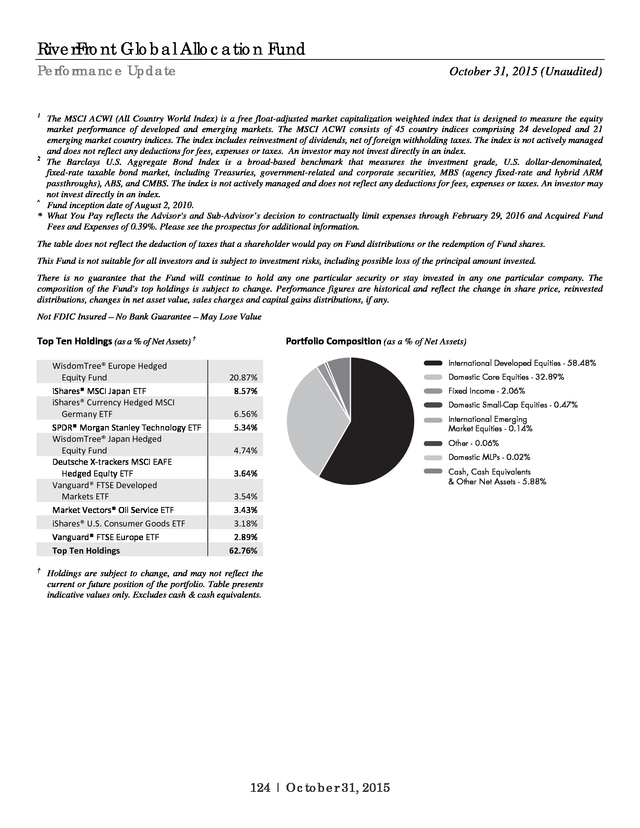
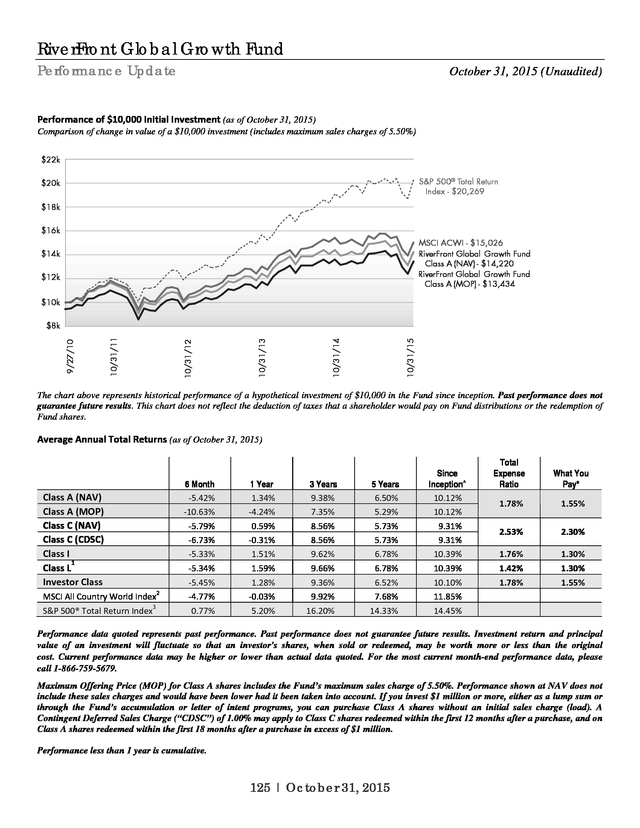
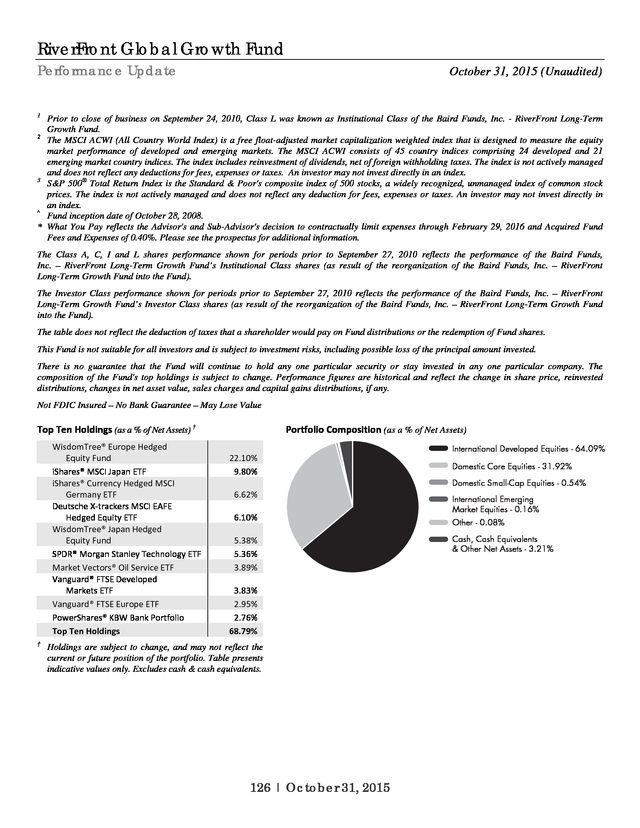
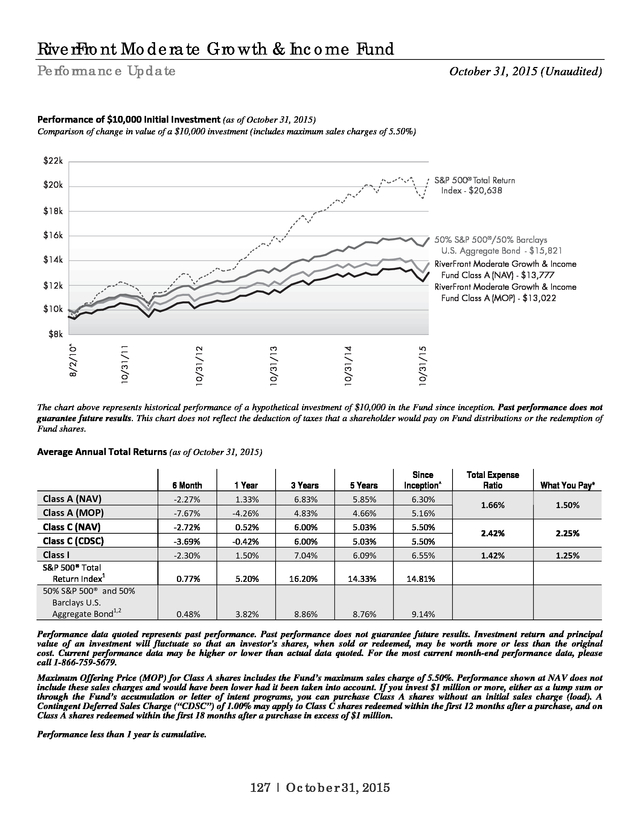
Performance Update -------------------------------------- 119
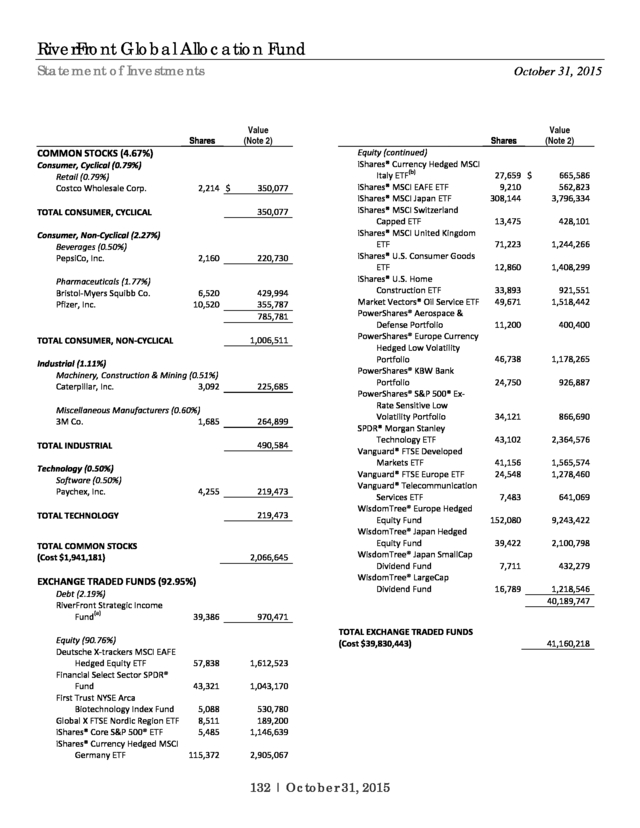
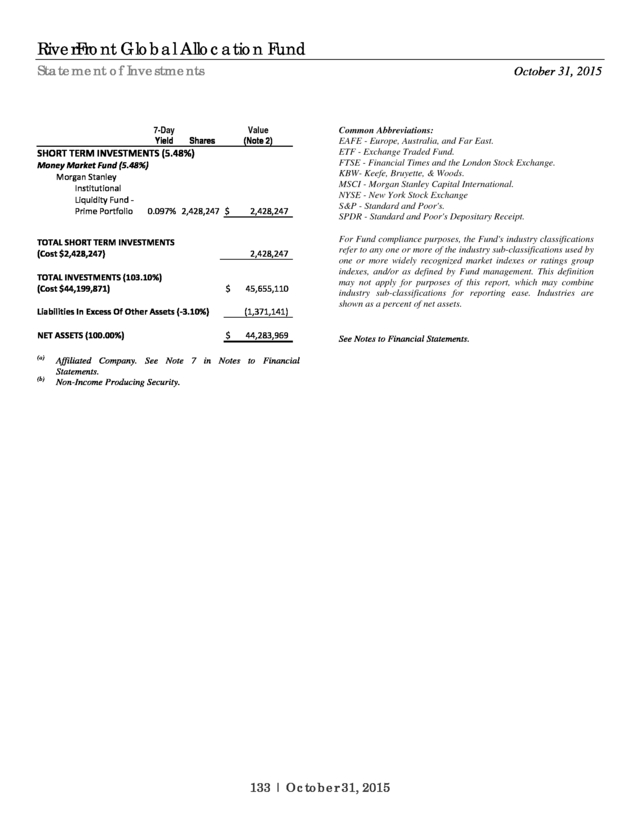
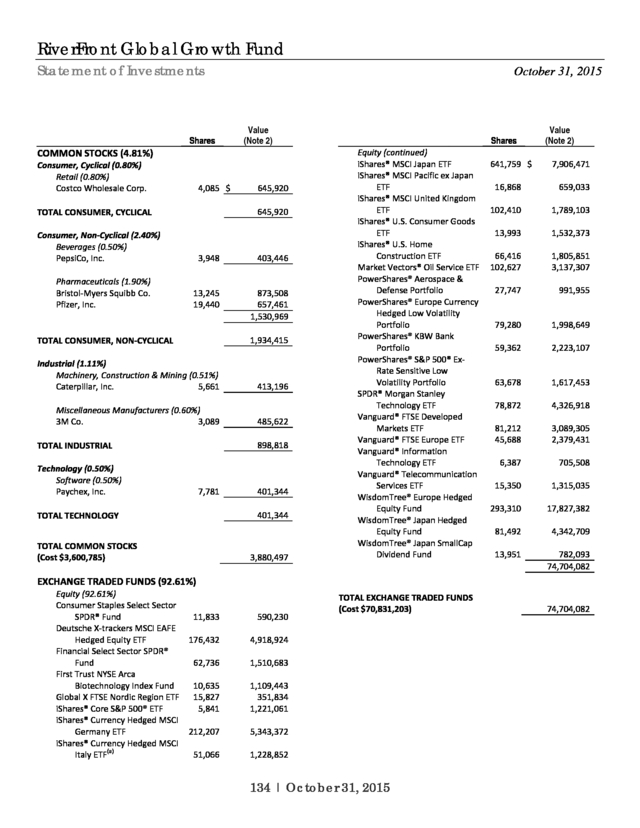
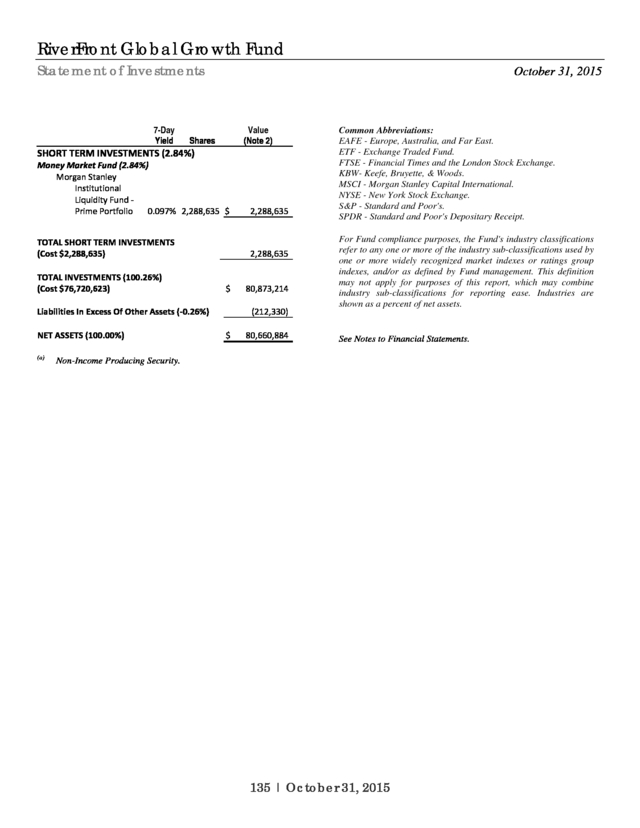
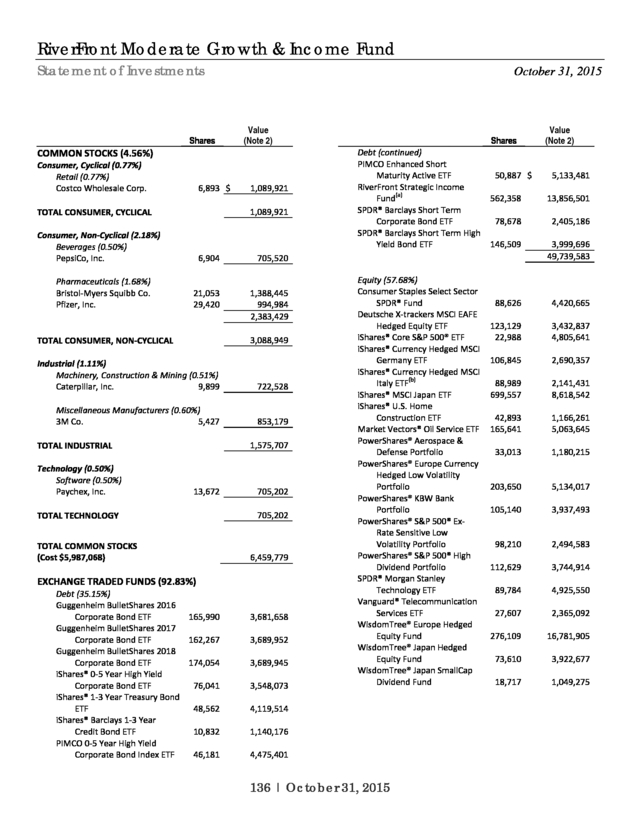
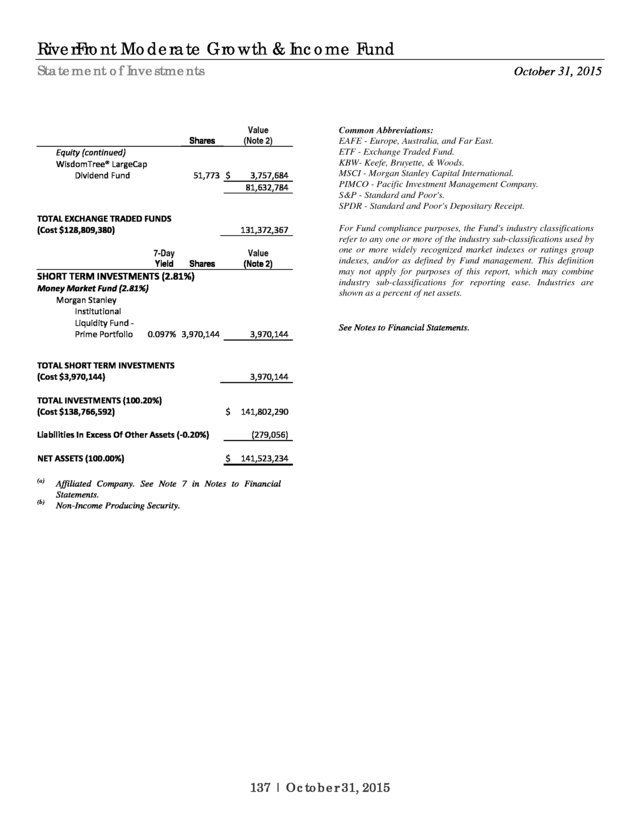
Statements of Investments -------------------------------- 129
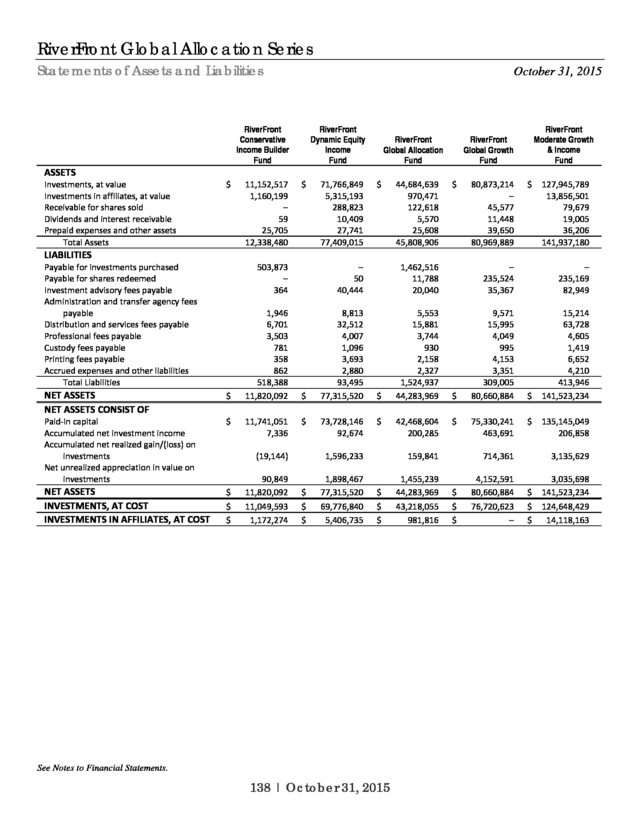
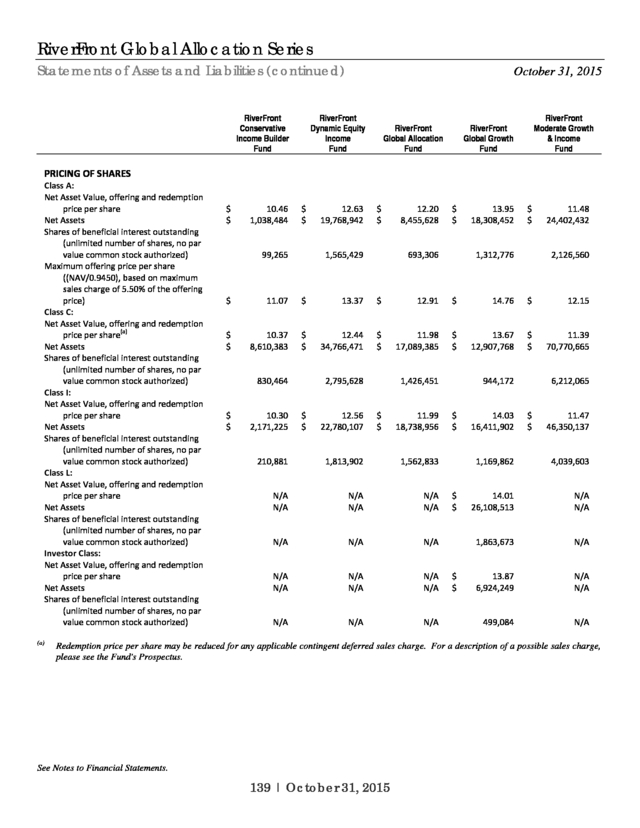
Statements of Assets and Liabilities ---------------------- 138
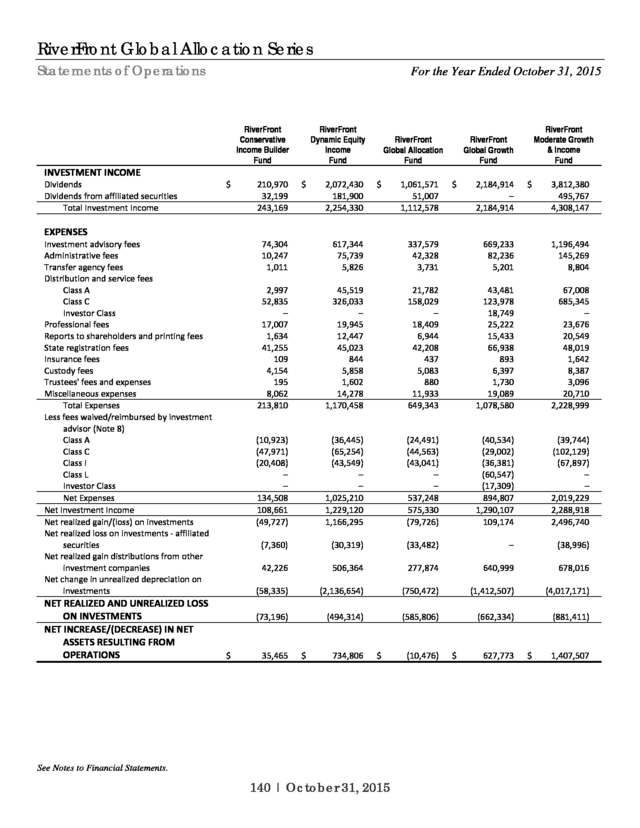
Statements of Operations --------------------------------- 140
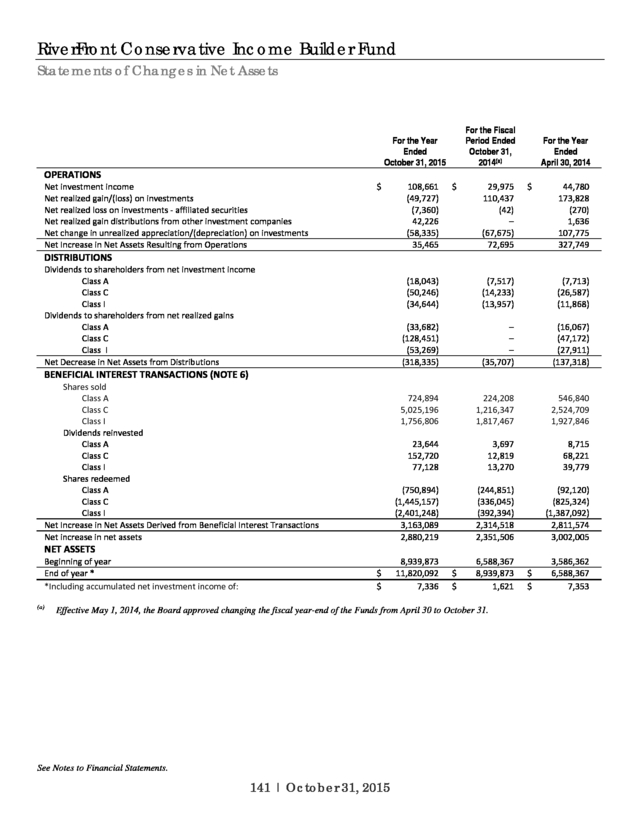
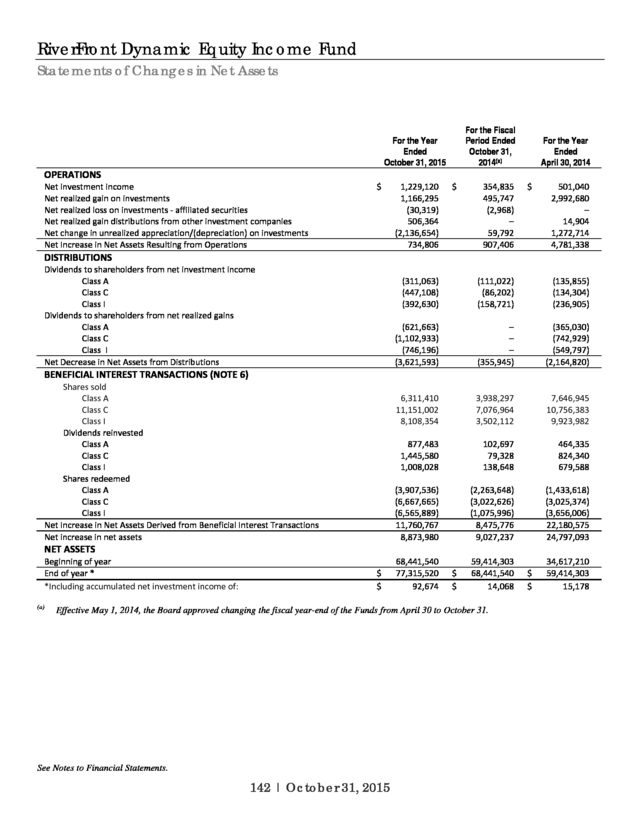
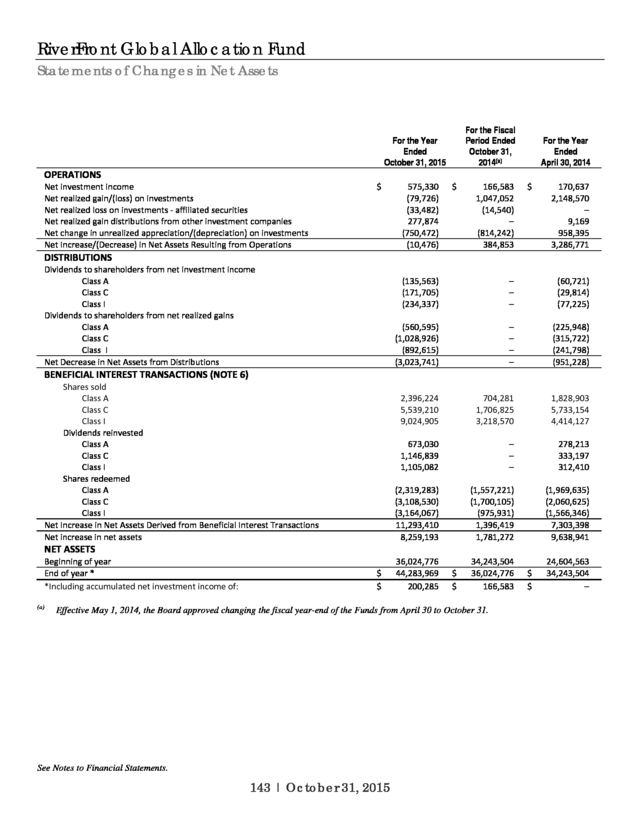
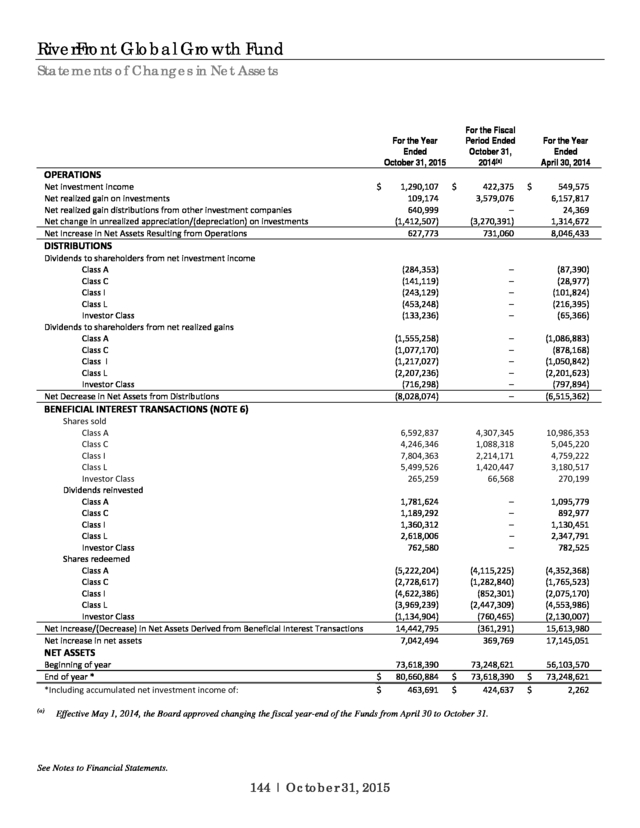
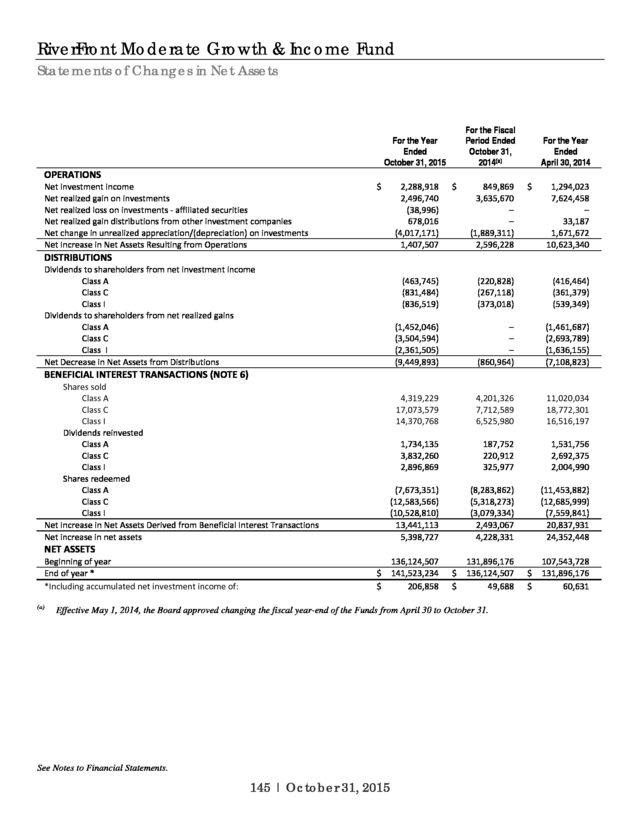
Statements of Changes in Net Assets ------------------- 141
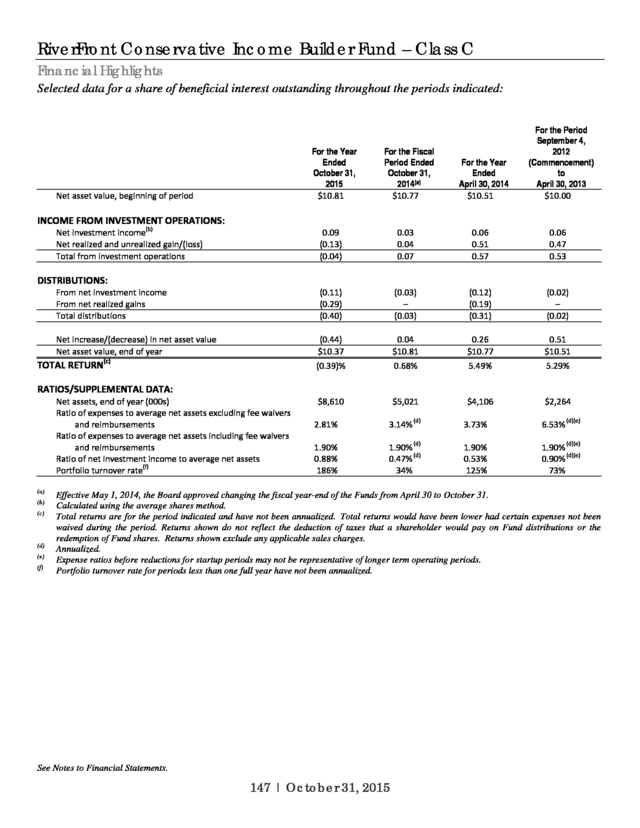
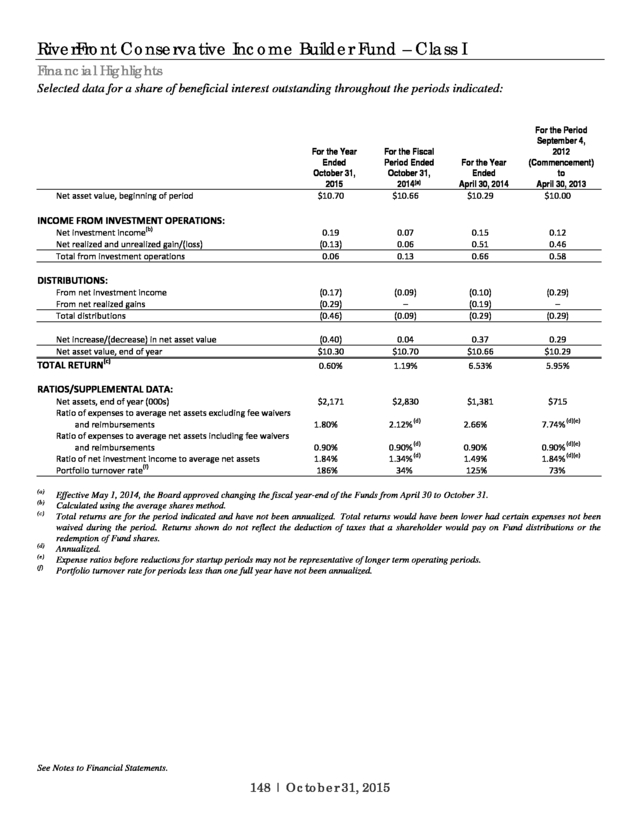
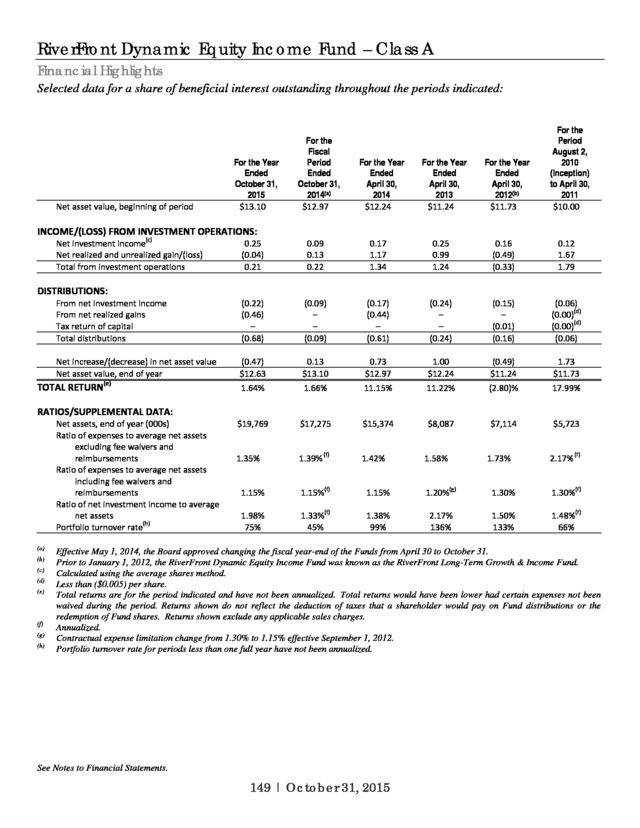
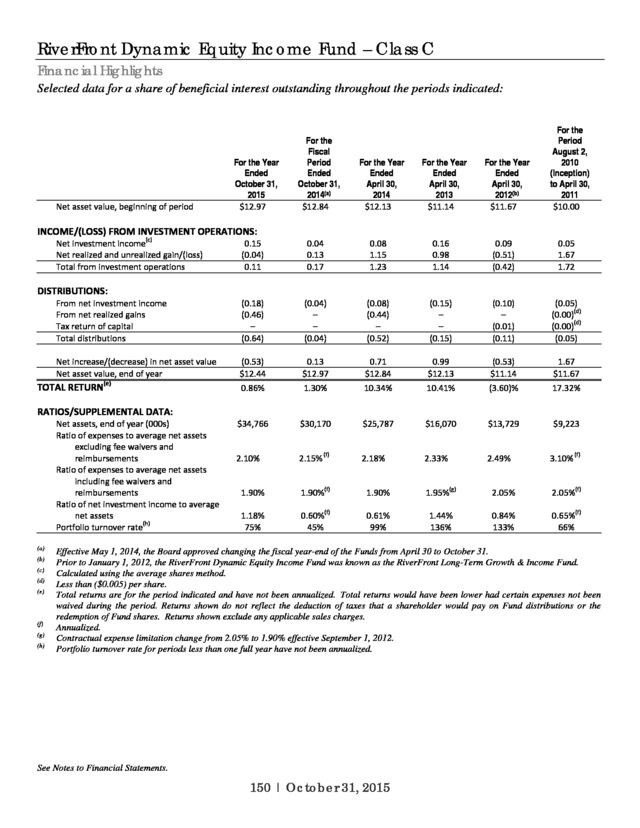
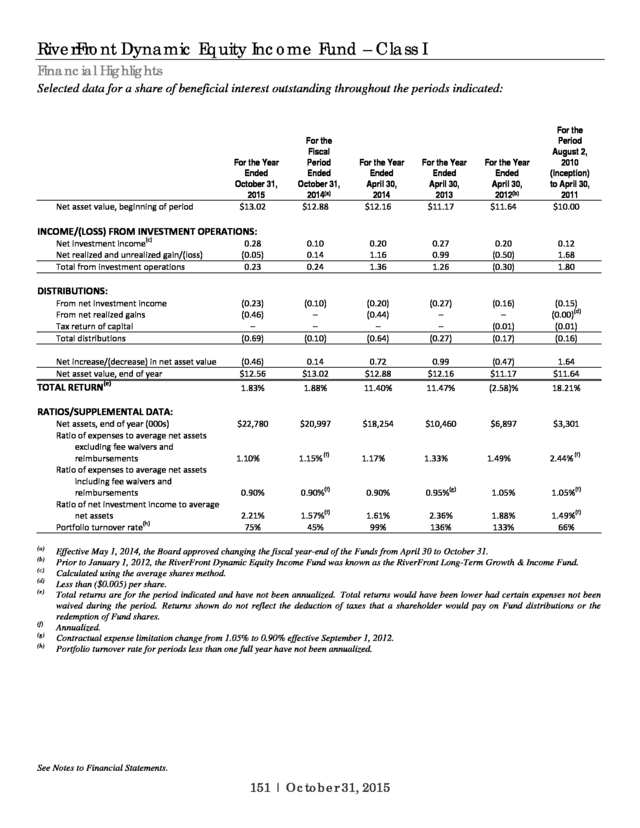
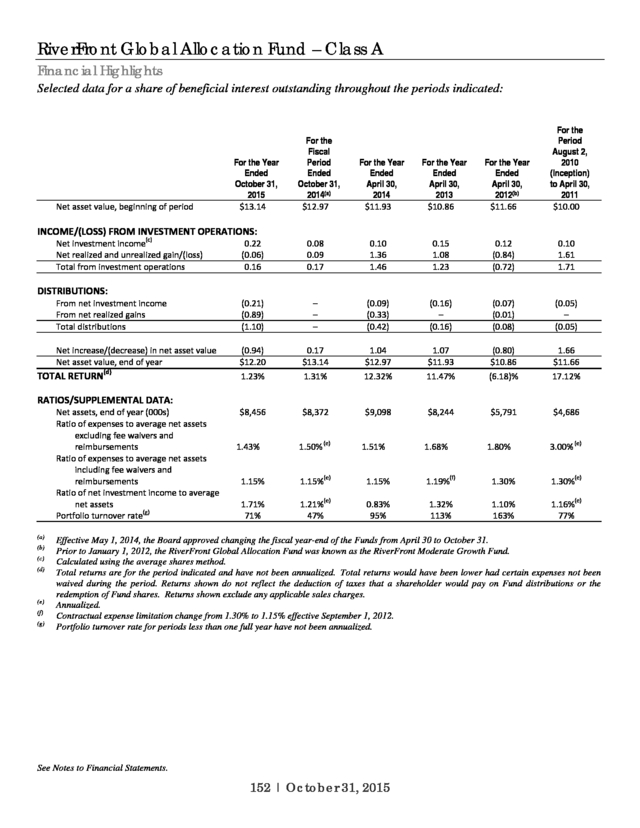
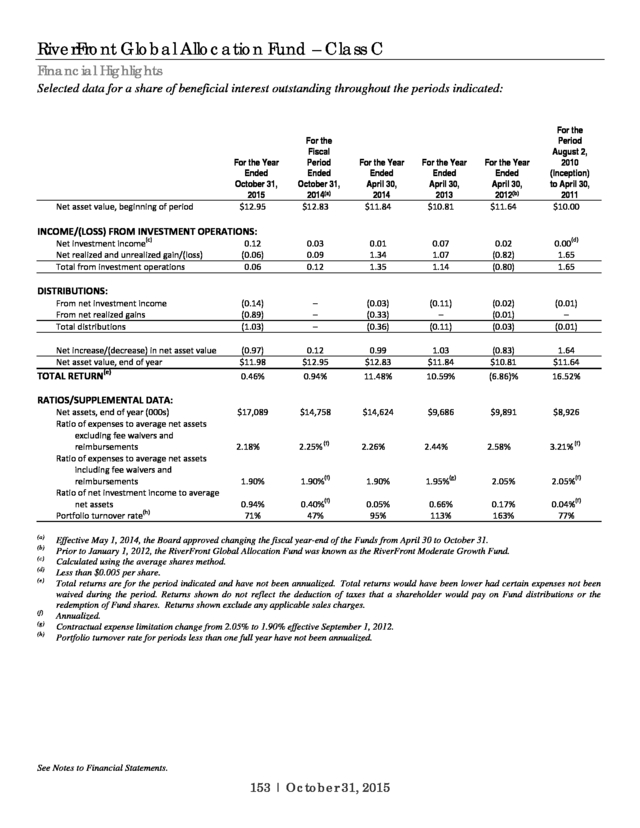
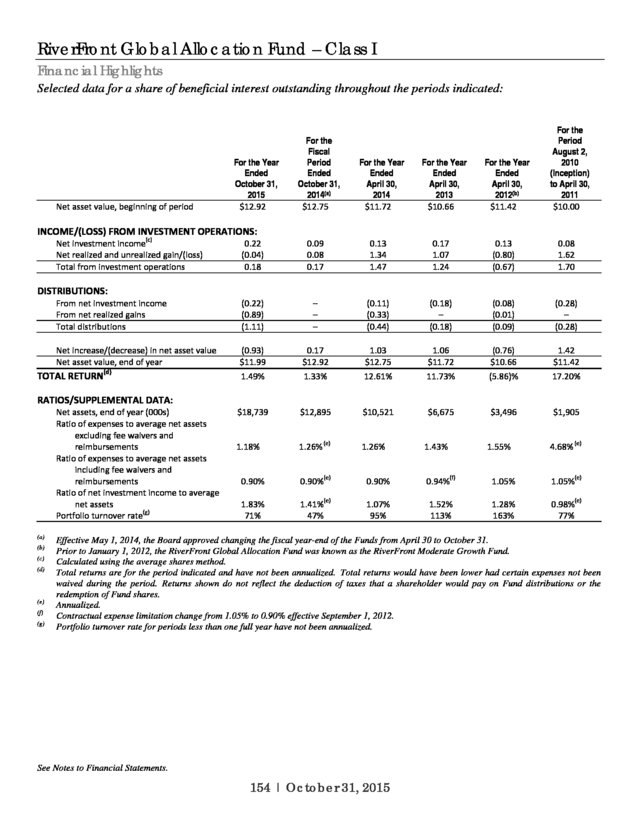
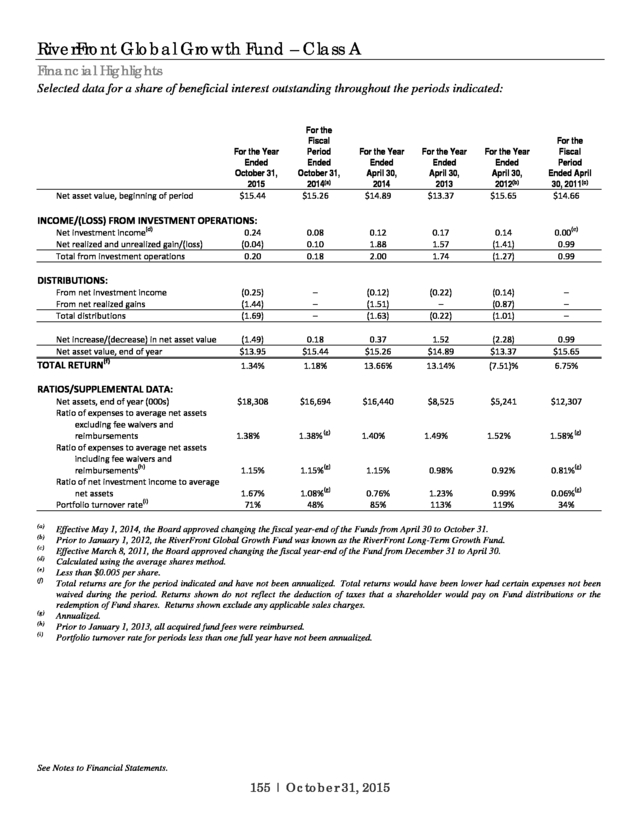
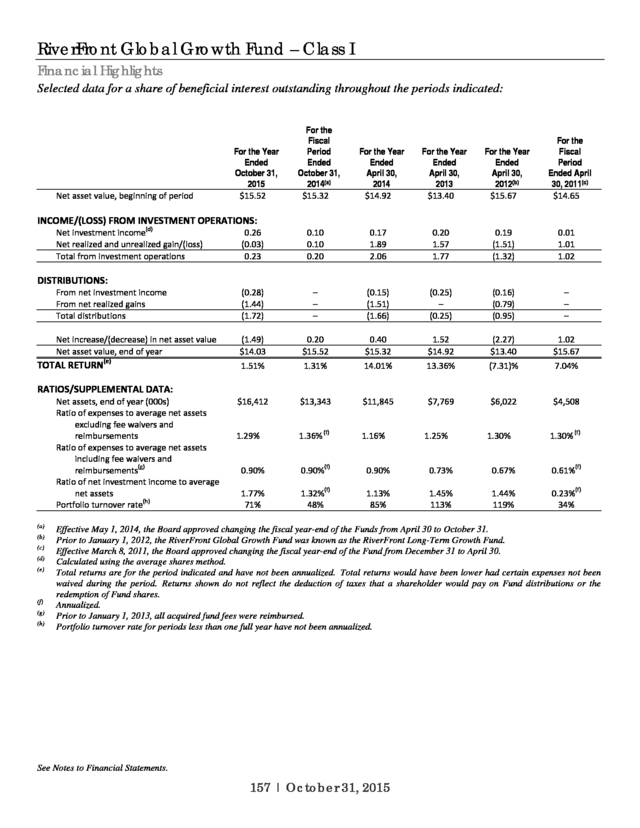
Financial Highlights ----------------------------------------- 146
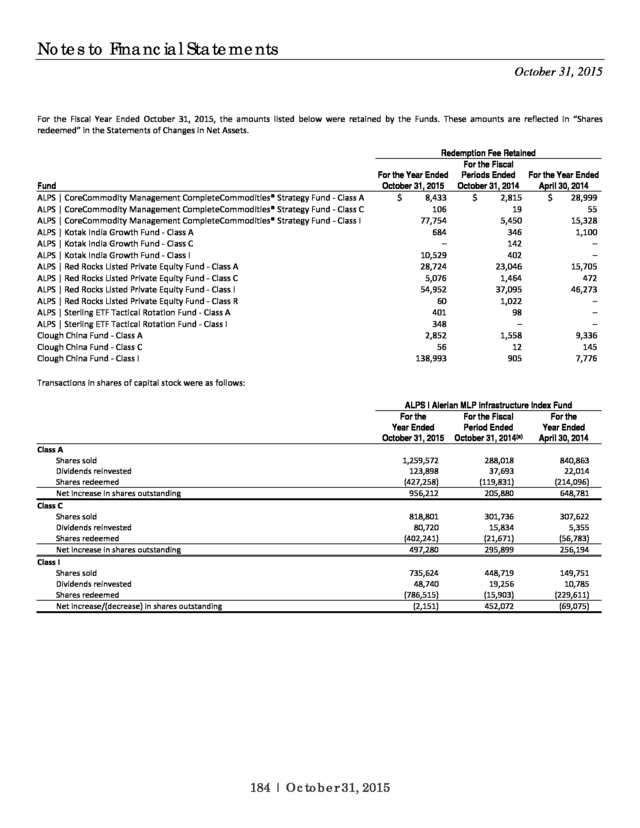
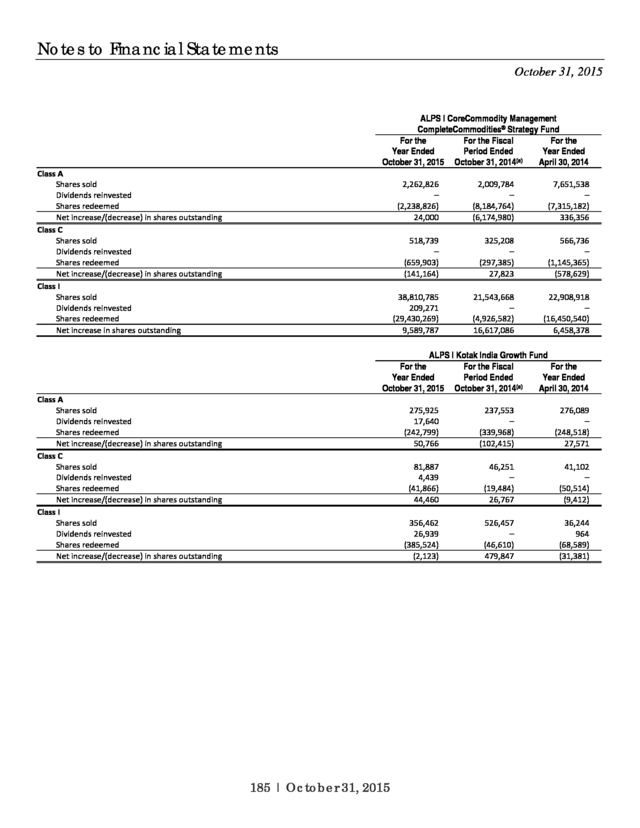
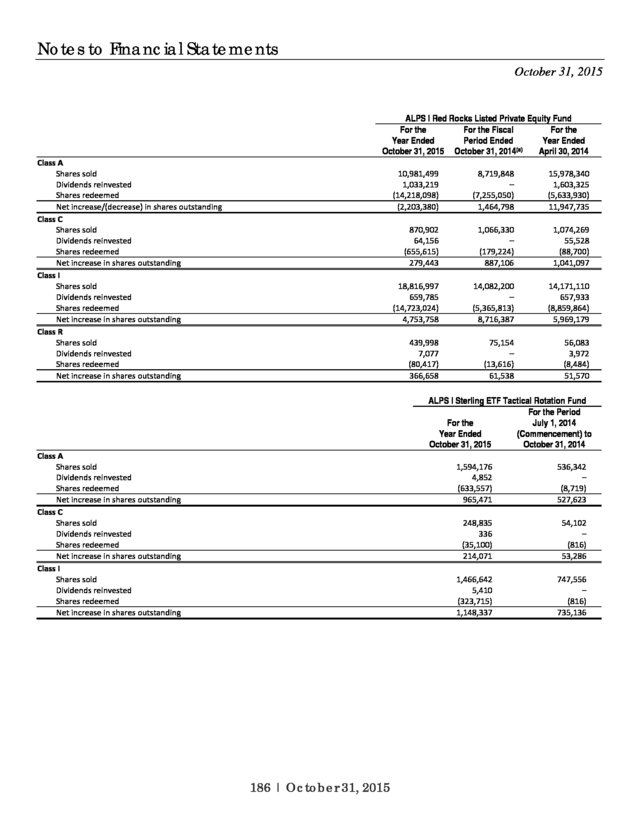
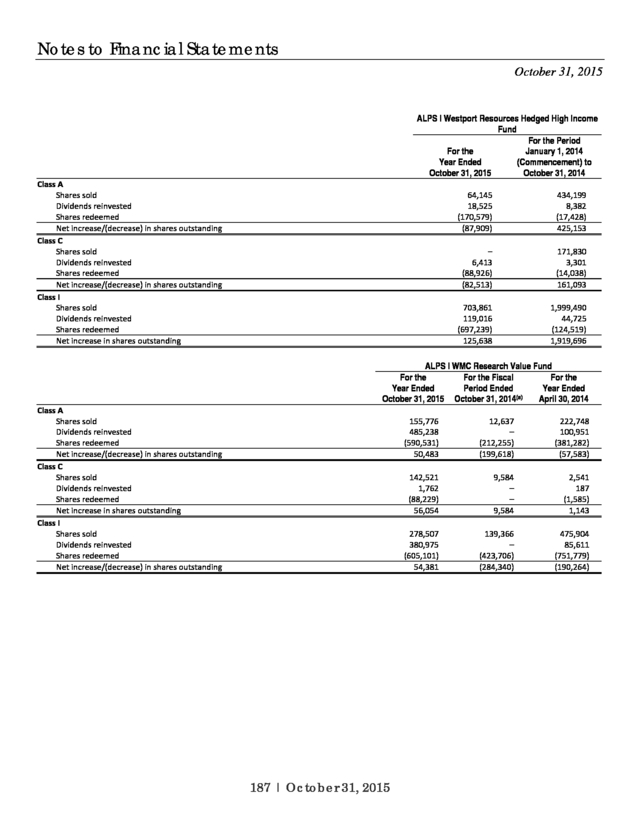
Notes to Financial Statements --------------------------------- 163
Report of Independent Registered Public Accounting Firm---- 197
Additional Information ------------------------------------------ 198
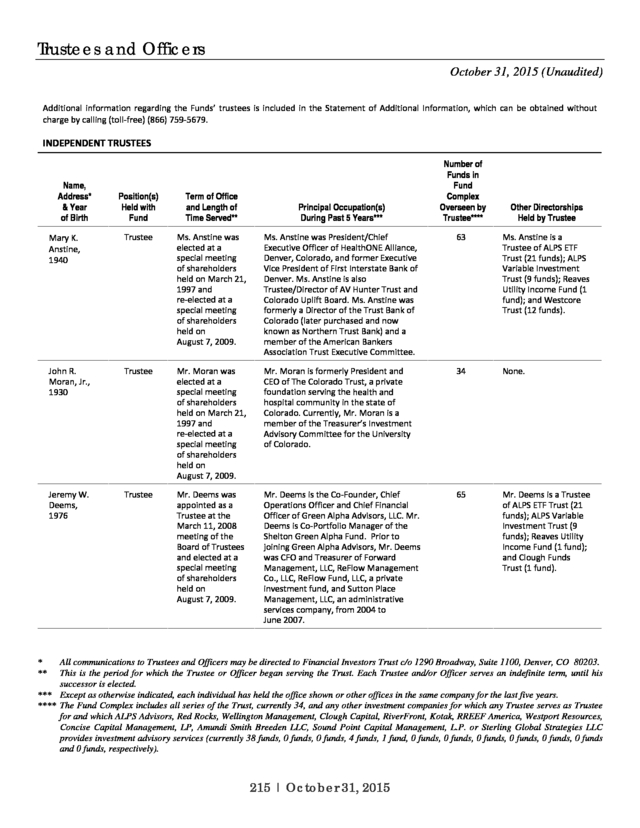
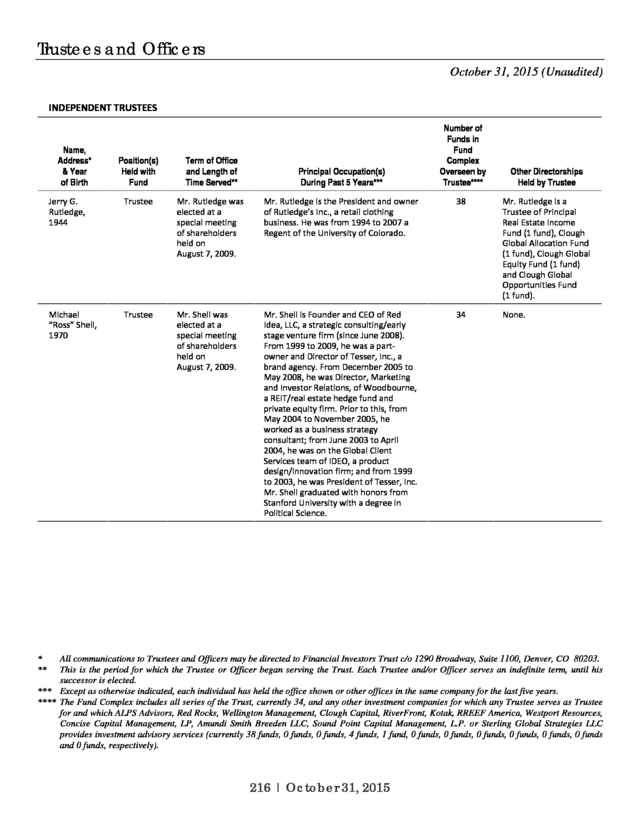
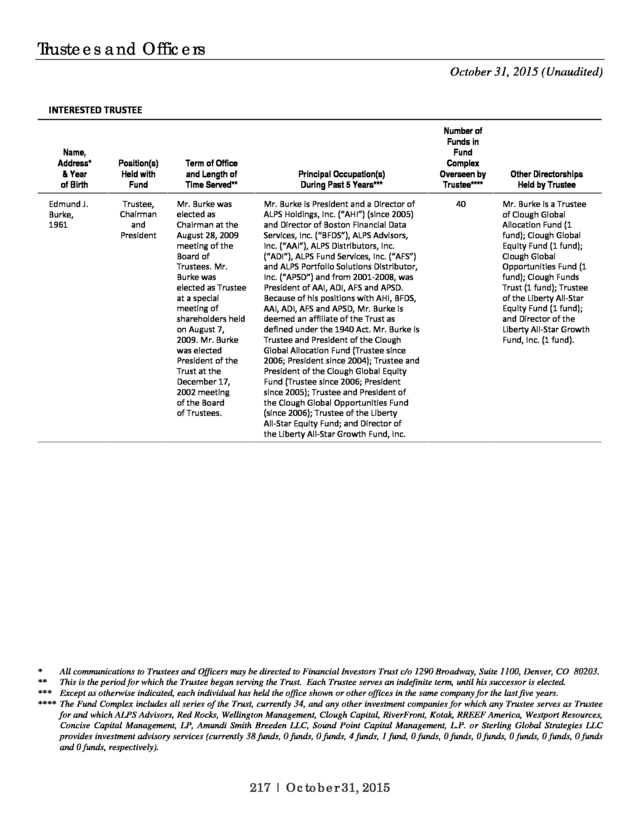
Trustees and Officers-------------------------------------------- 215
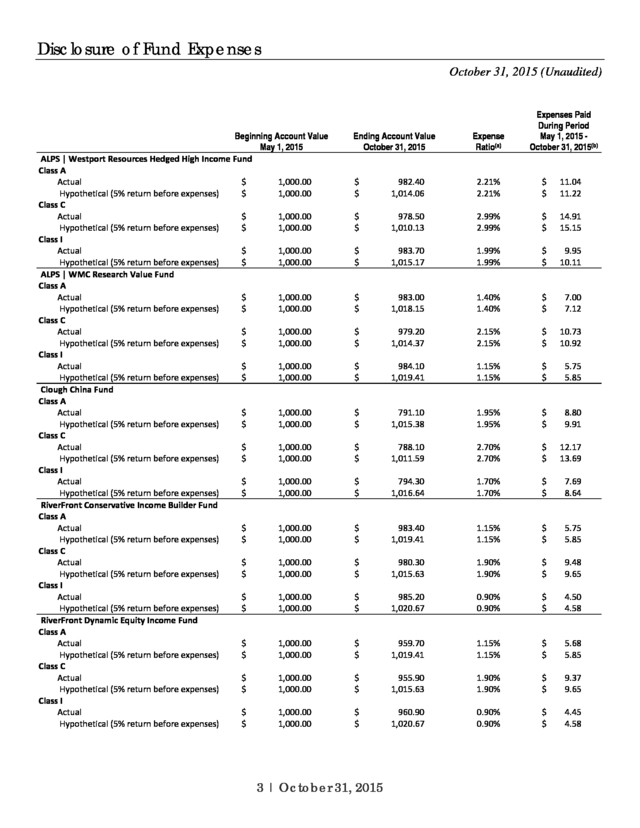
. Disclosure of Fund Expenses
October 31, 2015 (Unaudited)
Examples. As a shareholder of the Funds, you will incur two types of costs: (1) transaction costs, including applicable sales charges (loads) and
redemption fees; and (2) ongoing costs, including management fees, distribution and service (12bâ€1) fees, shareholder service fees and other Fund
expenses. The following examples are intended to help you understand your ongoing costs (in dollars) of investing in the Funds and to compare
these costs with the ongoing costs of investing in other mutual funds. The examples are based on an investment of $1,000 invested on May 1, 2015
and held until October 31, 2015.
Actual Expenses. The first line under each class in the following table provides information about actual account values and actual expenses. You
may use the information in this line, together with the amount you invested, to estimate the expenses that you paid over the period. Simply divide
your account value by $1,000 (for example, an $8,600 account value divided by $1,000 = 8.6), then multiply the result by the number in the first line
under the heading “Expenses Paid During Period May 1, 2015 – October 31, 2015” to estimate the expenses you paid on your account during
this period.
Hypothetical Example for Comparison Purposes. The second line under each class in the following table provides information about
hypothetical account values and hypothetical expenses based on the Fund’s actual expense ratio and an assumed rate of return of 5% per year
before expenses, which is not the Fund’s actual return. The hypothetical account values and expenses may not be used to estimate the actual
ending account balance or expenses you paid for the period. You may use this information to compare the ongoing costs of investing in the Funds
and other mutual funds. To do so, compare these 5% hypothetical examples with the 5% hypothetical examples that appear in the shareholder
reports of the other funds.
Please note that the expenses shown in the table are meant to highlight your ongoing costs only and do not reflect any transactional costs, such as
sales charges or redemption fees. Therefore, the second line under each class in the following table is useful in comparing ongoing costs only, and
will not help you determine the relative total costs of owning different funds. In addition, if these transactional costs were included, your costs
would have been higher.
1 | October 31, 2015
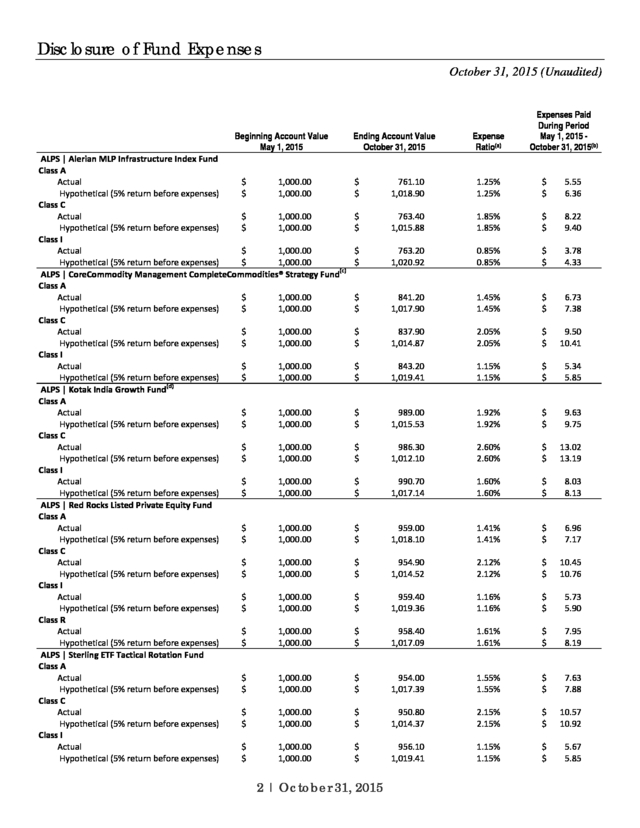
. Disclosure of Fund Expenses
October 31, 2015 (Unaudited)
Beginning Account Value
May 1, 2015
ALPS | Alerian MLP Infrastructure Index Fund
Class A
Actual
1,000.00
$
Hypothetical (5% return before expenses)
1,000.00
$
Class C
Actual
1,000.00
$
Hypothetical (5% return before expenses)
1,000.00
$
Class I
Actual
1,000.00
$
Hypothetical (5% return before expenses)
$
1,000.00
ALPS | CoreCommodity Management CompleteCommodities® Strategy Fund(c)
Class A
Actual
1,000.00
$
Hypothetical (5% return before expenses)
$
1,000.00
Class C
Actual
1,000.00
$
Hypothetical (5% return before expenses)
1,000.00
$
Class I
Actual
1,000.00
$
Hypothetical (5% return before expenses)
1,000.00
$
(d)
ALPS | Kotak India Growth Fund
Class A
Actual
1,000.00
$
Hypothetical (5% return before expenses)
1,000.00
$
Class C
Actual
1,000.00
$
Hypothetical (5% return before expenses)
1,000.00
$
Class I
Actual
1,000.00
$
Hypothetical (5% return before expenses)
$
1,000.00
ALPS | Red Rocks Listed Private Equity Fund
Class A
Actual
1,000.00
$
Hypothetical (5% return before expenses)
$
1,000.00
Class C
Actual
1,000.00
$
Hypothetical (5% return before expenses)
1,000.00
$
Class I
Actual
1,000.00
$
Hypothetical (5% return before expenses)
1,000.00
$
Class R
Actual
1,000.00
$
Hypothetical (5% return before expenses)
$
1,000.00
ALPS | Sterling ETF Tactical Rotation Fund
Class A
Actual
1,000.00
$
Hypothetical (5% return before expenses)
$
1,000.00
Class C
Actual
1,000.00
$
Hypothetical (5% return before expenses)
1,000.00
$
Class I
Actual
1,000.00
$
Hypothetical (5% return before expenses)
1,000.00
$
Ending Account Value
October 31, 2015
$
$
$
$
$
$
$
$
$
$
$
$
$
$
$
$
$
$
$
$
$
$
$
$
$
$
$
$
$
$
$
$
761.10
1,018.90
763.40
1,015.88
763.20
1,020.92
841.20
1,017.90
837.90
1,014.87
843.20
1,019.41
989.00
1,015.53
986.30
1,012.10
990.70
1,017.14
959.00
1,018.10
954.90
1,014.52
959.40
1,019.36
958.40
1,017.09
954.00
1,017.39
950.80
1,014.37
956.10
1,019.41
2 | October 31, 2015
Expense
Ratio(a)
Expenses Paid
During Period
May 1, 2015 October 31, 2015(b)
1.25%
1.25%
1.85%
1.85%
0.85%
0.85%
$
$
$
$
$
$
1.45%
1.45%
2.05%
2.05%
1.15%
1.15%
$
$
$
$
$
$
1.92%
1.92%
2.60%
2.60%
1.60%
1.60%
$
$
$
$
$
$
1.41%
1.41%
2.12%
2.12%
1.16%
1.16%
1.61%
1.61%
$
$
$
$
$
$
$
$
1.55%
1.55%
2.15%
2.15%
1.15%
1.15%
$
$
$
$
$
$
5.55
6.36
8.22
9.40
3.78
4.33
6.73
7.38
9.50
10.41
5.34
5.85
9.63
9.75
13.02
13.19
8.03
8.13
6.96
7.17
10.45
10.76
5.73
5.90
7.95
8.19
7.63
7.88
10.57
10.92
5.67
5.85
. Disclosure of Fund Expenses
October 31, 2015 (Unaudited)
Beginning Account Value
May 1, 2015
ALPS | Westport Resources Hedged High Income Fund
Class A
Actual
1,000.00
$
Hypothetical (5% return before expenses)
1,000.00
$
Class C
Actual
1,000.00
$
Hypothetical (5% return before expenses)
1,000.00
$
Class I
Actual
1,000.00
$
Hypothetical (5% return before expenses)
$
1,000.00
ALPS | WMC Research Value Fund
Class A
Actual
1,000.00
$
Hypothetical (5% return before expenses)
$
1,000.00
Class C
Actual
1,000.00
$
Hypothetical (5% return before expenses)
1,000.00
$
Class I
Actual
1,000.00
$
Hypothetical (5% return before expenses)
1,000.00
$
Clough China Fund
Class A
Actual
1,000.00
$
Hypothetical (5% return before expenses)
1,000.00
$
Class C
Actual
1,000.00
$
Hypothetical (5% return before expenses)
1,000.00
$
Class I
Actual
1,000.00
$
Hypothetical (5% return before expenses)
$
1,000.00
RiverFront Conservative Income Builder Fund
Class A
Actual
1,000.00
$
Hypothetical (5% return before expenses)
$
1,000.00
Class C
Actual
1,000.00
$
Hypothetical (5% return before expenses)
1,000.00
$
Class I
Actual
1,000.00
$
Hypothetical (5% return before expenses)
1,000.00
$
RiverFront Dynamic Equity Income Fund
Class A
Actual
1,000.00
$
Hypothetical (5% return before expenses)
1,000.00
$
Class C
Actual
1,000.00
$
Hypothetical (5% return before expenses)
$
1,000.00
Class I
Actual
1,000.00
$
Hypothetical (5% return before expenses) $
1,000.00
Ending Account Value
October 31, 2015
$
$
$
$
$
$
$
$
$
$
$
$
$
$
$
$
$
$
$
$
$
$
$
$
$
$
$
$
$
$
984.10
1,019.41
791.10
1,015.38
788.10
1,011.59
794.30
1,016.64
983.40
1,019.41
980.30
1,015.63
985.20
1,020.67
959.70
1,019.41
955.90
1,015.63
960.90
1,020.67
3 | October 31, 2015
$
$
$
$
$
$
1.15%
1.15%
1.90%
1.90%
0.90%
0.90%
979.20
1,014.37
$
$
$
$
$
$
1.95%
1.95%
2.70%
2.70%
1.70%
1.70%
983.00
1,018.15
$
$
$
$
$
$
1.40%
1.40%
2.15%
2.15%
1.15%
1.15%
983.70
1,015.17
2.21%
2.21%
2.99%
2.99%
1.99%
1.99%
978.50
1,010.13
Expense
Ratio(a)
982.40
1,014.06
Expenses Paid
During Period
May 1, 2015 October 31, 2015(b)
$
$
$
$
$
$
1.15%
1.15%
1.90%
1.90%
0.90%
0.90%
$
$
$
$
$
$
11.04
11.22
14.91
15.15
9.95
10.11
7.00
7.12
10.73
10.92
5.75
5.85
8.80
9.91
12.17
13.69
7.69
8.64
5.75
5.85
9.48
9.65
4.50
4.58
5.68
5.85
9.37
9.65
4.45
4.58
. Disclosure of Fund Expenses
October 31, 2015 (Unaudited)
Ending Account Value
October 31, 2015
Beginning Account Value
May 1, 2015
Expenses Paid
During Period
May 1, 2015 October 31, 2015(b)
Expense
Ratio(a)
RiverFront Global Allocation Fund
Class A
Actual
1,000.00
$
950.90
1.15%
5.65
$
$
Hypothetical (5% return before expenses)
$
1,000.00
$
1,019.41
1.15%
$
5.85
Class C
Actual
1,000.00
$
947.00
1.90%
9.32
$
$
Hypothetical (5% return before expenses)
1,000.00
$
1,015.63
1.90%
9.65
$
$
Class I
Actual
$
1,000.00
$
952.30
0.90%
4.43
$
Hypothetical (5% return before expenses)
1,000.00
$
1,020.67
0.90%
4.58
$
$
RiverFront Global Growth Fund
Class A
Actual
$
1,000.00
$
945.80
1.15%
5.64
$
Hypothetical (5% return before expenses)
1,000.00
$
1,019.41
1.15%
5.85
$
$
Class C
Actual
1,000.00
$
942.10
1.90%
9.30
$
$
Hypothetical (5% return before expenses)
$
1,000.00
$
1,015.63
1.90%
$
9.65
Class I
Actual
1,000.00
$
946.70
0.90%
4.42
$
$
Hypothetical (5% return before expenses)
1,000.00
$
1,020.67
0.90%
4.58
$
$
Class L
Actual
1,000.00
$
946.60
0.90%
4.42
$
$
Hypothetical (5% return before expenses)
1,000.00
$
1,020.67
0.90%
4.58
$
$
Investor Class
Actual
1,000.00
$
945.50
1.15%
5.64
$
$
Hypothetical (5% return before expenses)
1,000.00
$
1,019.41
1.15%
5.85
$
$
RiverFront Moderate Growth & Income Fund
Class A
Actual
$
1,000.00
$
977.30
1.15%
5.73
$
Hypothetical (5% return before expenses)
1,000.00
$
1,019.41
1.15%
5.85
$
$
Class C
Actual
1,000.00
$
972.80
1.90%
9.45
$
$
Hypothetical (5% return before expenses)
$
1,000.00
$
1,015.63
1.90%
$
9.65
Class I
Actual
1,000.00
$
977.00
0.90%
4.48
$
$
Hypothetical (5% return before expenses) $
1,000.00
1,020.67
0.90%
4.58
$
$
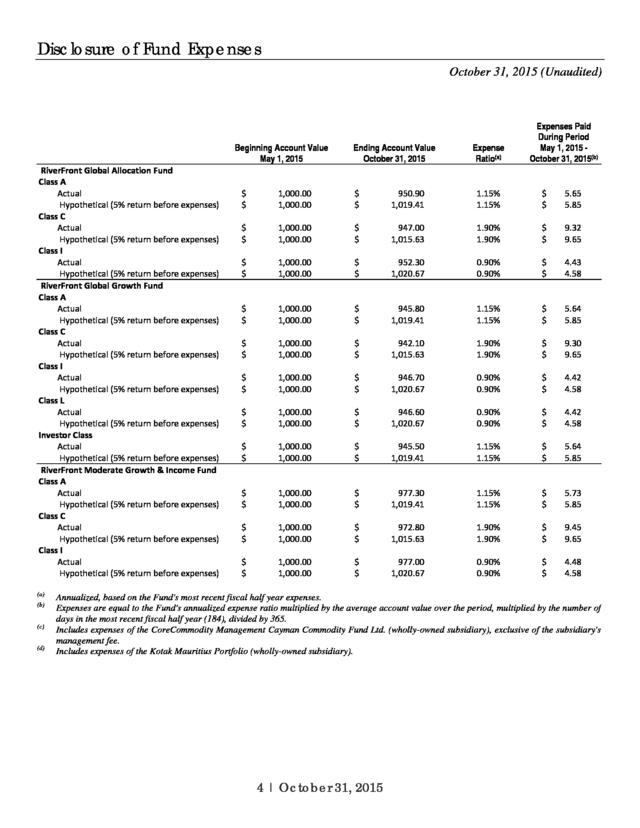
(a)
Annualized, based on the Fund's most recent fiscal half year expenses.
(b)
Expenses are equal to the Fund's annualized expense ratio multiplied by the average account value over the period, multiplied by the number of
days in the most recent fiscal half year (184), divided by 365.
(c)
Includes expenses of the CoreCommodity Management Cayman Commodity Fund Ltd. (wholly-owned subsidiary), exclusive of the subsidiary's
management fee.
(d)
Includes expenses of the Kotak Mauritius Portfolio (wholly-owned subsidiary).
4 | October 31, 2015
. ALPS | Alerian MLP Infrastructure Index Fund
Management Commentary
October 31, 2015 (Unaudited)
During the twelveâ€month period of November 1, 2014 to October 31, 2015 the Alerian MLP Infrastructure Index Fund’s (“Fund”) Class A shares
delivered a net return of â€27.23% at Net Asset Value. Class A delivered a net return of â€31.24% at MOP, Class C was â€27.85% with CDSC, and Class I
was â€26.95%. This compares to the Fund’s index, the Alerian MLP Infrastructure Index (“AMZI”), which fell â€33.3% on a priceâ€return and â€29.1% on a
totalâ€return basis. The difference in performance for this period between the AMZI and the Fund is primarily attributable to the Fund’s operating
expenses and the impact of the Fund’s C Corporation tax election.
During the period, the fund paid four distributions*:
• $0.1820 on February 19, 2015
• $0.1839 on May 20, 2015
• $0.1860 on August 19, 2015
• $0.1879 on October 30, 2015
These distributions represent 1.1%, 1.0%, 1.1%, and 1.0% increases respectively from their previous quarters. On an annual basis, the Fund
increased its distribution by 4.3% when comparing the October 30, 2015 distribution versus the October 31, 2014 distribution of $0.1800.
The majority of master limited partnerships (MLPs) in the AMZI generated negative returns during the period. The top contributor to the AMZI
during the period was Tesoro Logistics Partners LP (TLLP), which fell 0.4%. Bottom contributors included Targa Resource Partners (NGLS), NGL
Energy Partners (NGL), and DCP Midstream (DPM).
During the period, Shell Midstream Partners (SHLX) was added to the AMZI and Williams Partners, Atlas Pipeline Partners, Regency Energy Partners,
and Crestwood Midstream Partners were removed due to merger activity.
Weakness in the energy markets persisted, with crude oil prices falling over 60% from $80/barrel to roughly $46 by the end of October, with a brief
stint of subâ€$40/barrel prices in late August. During the period, MLP price performance exhibited strong correlations to falling energy prices.
Historically however, MLPs have exhibited weak correlations to commodity prices over a longer time frame. Investor sentiment for the energy
macro picture remains weak, particularly since North American crude production has not slowed enough to address global oversupply issues.
Continued growth in US production through May 2015—despite prices peaking 11 months earlier—and the slowdown in China and Europe
exacerbated the supply/demand imbalance during the period.
Infrastructure MLPs have not been immune. Estimates for capital spending, distribution growth, and cash flow have come down to reflect a
moderated growth outlook. While we recognize these adjustments are necessary, we note they do not signal that infrastructure MLP distributions
are no longer growing, nor do they signal that infrastructure MLP distributions are in jeopardy. Rather, distributions may not grow at similar rates
as previous years in the near term. During the period, AMZI distribution growth totaled 7.6%. Of the 22 MLPs in the AMZI, 15 increased their
distribution during the third calendar quarter of 2015 and the remaining 7 maintained their distribution.
Unlike the last commodity downturn during 2007â€2008, access to capital is still available to MLPs. Not to mention, many MLPs can finance growth
internally by maintaining higher distribution coverage. MLPs continue to announce organic projects backed by longâ€term binding commitments.
These projects vary by product handled, including crude oil, natural gas, NGLs, refined products, and propane. They also vary by asset type,
including pipelines, processing plants, and fractionation plants. While the nearâ€term outlook for energy seems uncertain, the longâ€term
fundamentals for energy infrastructure MLPs to support the domestic supply of energy resources remain intact. We continue to believe that MLPs
represent a potentially compelling investment opportunity for investors seeking afterâ€tax yield and access to real assets.
The views of the author and information discussed in this commentary are as of the date of publication, are subject to change, and may not reflect the
writer’s current views. The views expressed are those of the author only, and represent an assessment of market conditions at a specific point in time,
are opinions only and should not be relied upon as investment advice regarding a particular investment or markets in general. Such information does
not constitute a recommendation to buy or sell specific securities or investment vehicles. It should not be assumed that any investment will be
profitable or will equal the performance of the fund(s) or any securities or any sectors mentioned in this letter.
The subject matter contained in this letter has been derived from several sources believed to be reliable and accurate at the time of compilation. Neither ALPS Advisors, Inc., Alerian, nor the Fund accept any liability for losses either direct or consequential caused by the use of this information. Diversification cannot guarantee gain or prevent losses. * At the time of the distribution the character was estimated to be 100% return of capital. Please reference the year-end tax forms for the final character. 5 | October 31, 2015 .
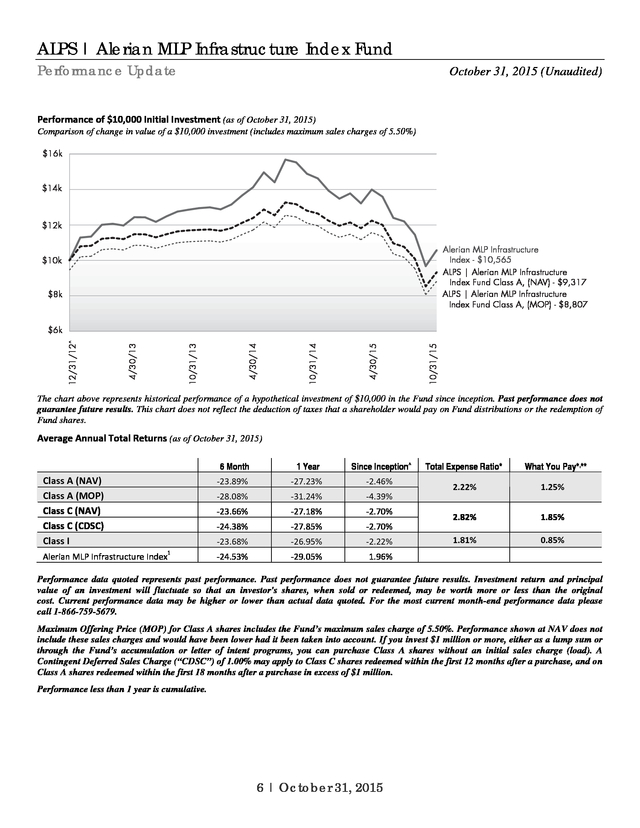
ALPS | Alerian MLP Infrastructure Index Fund Performance Update October 31, 2015 (Unaudited) Performance of $10,000 Initial Investment (as of October 31, 2015) Comparison of change in value of a $10,000 investment (includes maximum sales charges of 5.50%) $16k $14k $12k Alerian MLP Infrastructure Index - $10,565 ALPS | Alerian MLP Infrastructure Index Fund Class A, (NAV) - $9,317 ALPS | Alerian MLP Infrastructure Index Fund Class A, (MOP) - $8,807 $10k $8k 10/31/15 4/30/15 10/31/14 4/30/14 10/31/13 4/30/13 12/31/12^ $6k The chart above represents historical performance of a hypothetical investment of $10,000 in the Fund since inception. Past performance does not guarantee future results. This chart does not reflect the deduction of taxes that a shareholder would pay on Fund distributions or the redemption of Fund shares. Average Annual Total Returns (as of October 31, 2015) 6 Month â€2.46% â€31.24% â€4.39% â€27.18% â€2.70% â€24.38% â€27.85% â€2.70% â€23.68% Alerian MLP Infrastructure Index â€27.23% â€23.66% 1 Since Inception^ â€28.08% Class A (NAV) Class A (MOP) Class C (NAV) Class C (CDSC) Class I 1 Year â€23.89% â€26.95% â€2.22% â€24.53% â€29.05% 1.96% Total Expense Ratio* What You Pay*,** 2.22% 1.25% 2.82% 1.85% 1.81% 0.85% Performance data quoted represents past performance. Past performance does not guarantee future results.
Investment return and principal value of an investment will fluctuate so that an investor's shares, when sold or redeemed, may be worth more or less than the original cost. Current performance data may be higher or lower than actual data quoted. For the most current month-end performance data please call 1-866-759-5679. Maximum Offering Price (MOP) for Class A shares includes the Fund’s maximum sales charge of 5.50%.
Performance shown at NAV does not include these sales charges and would have been lower had it been taken into account. If you invest $1 million or more, either as a lump sum or through the Fund’s accumulation or letter of intent programs, you can purchase Class A shares without an initial sales charge (load). A Contingent Deferred Sales Charge (“CDSC”) of 1.00% may apply to Class C shares redeemed within the first 12 months after a purchase, and on Class A shares redeemed within the first 18 months after a purchase in excess of $1 million. Performance less than 1 year is cumulative. 6 | October 31, 2015 .
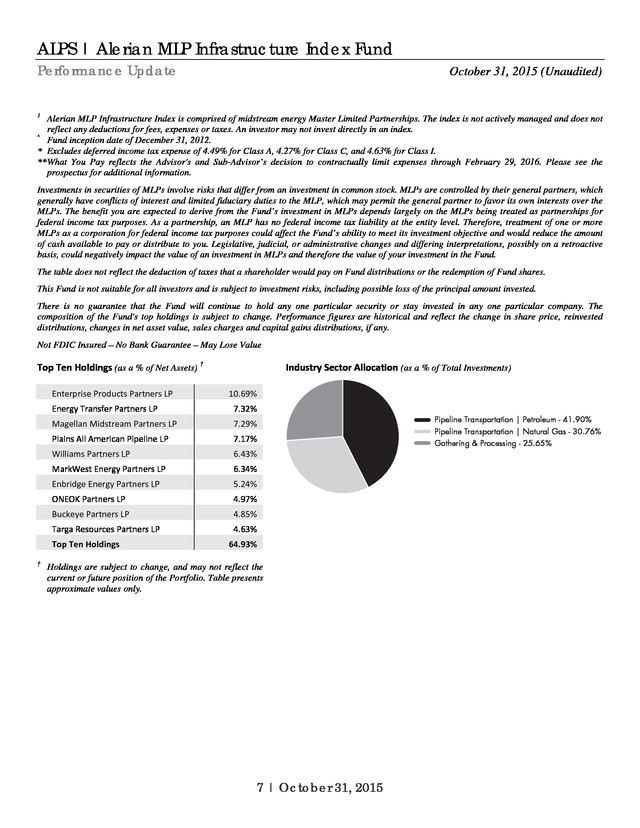
ALPS | Alerian MLP Infrastructure Index Fund Performance Update October 31, 2015 (Unaudited) 1 Alerian MLP Infrastructure Index is comprised of midstream energy Master Limited Partnerships. The index is not actively managed and does not reflect any deductions for fees, expenses or taxes. An investor may not invest directly in an index. ^ Fund inception date of December 31, 2012. * Excludes deferred income tax expense of 4.49% for Class A, 4.27% for Class C, and 4.63% for Class I. ** What You Pay reflects the Advisor's and Sub-Advisor’s decision to contractually limit expenses through February 29, 2016. Please see the prospectus for additional information. Investments in securities of MLPs involve risks that differ from an investment in common stock.
MLPs are controlled by their general partners, which generally have conflicts of interest and limited fiduciary duties to the MLP, which may permit the general partner to favor its own interests over the MLPs. The benefit you are expected to derive from the Fund’s investment in MLPs depends largely on the MLPs being treated as partnerships for federal income tax purposes. As a partnership, an MLP has no federal income tax liability at the entity level.
Therefore, treatment of one or more MLPs as a corporation for federal income tax purposes could affect the Fund’s ability to meet its investment objective and would reduce the amount of cash available to pay or distribute to you. Legislative, judicial, or administrative changes and differing interpretations, possibly on a retroactive basis, could negatively impact the value of an investment in MLPs and therefore the value of your investment in the Fund. The table does not reflect the deduction of taxes that a shareholder would pay on Fund distributions or the redemption of Fund shares. This Fund is not suitable for all investors and is subject to investment risks, including possible loss of the principal amount invested. There is no guarantee that the Fund will continue to hold any one particular security or stay invested in any one particular company. The composition of the Fund's top holdings is subject to change.
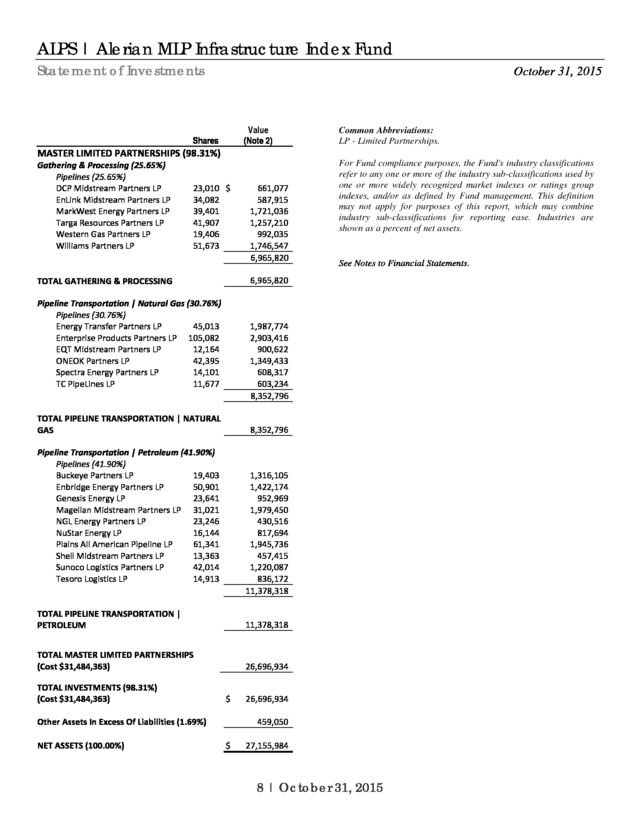
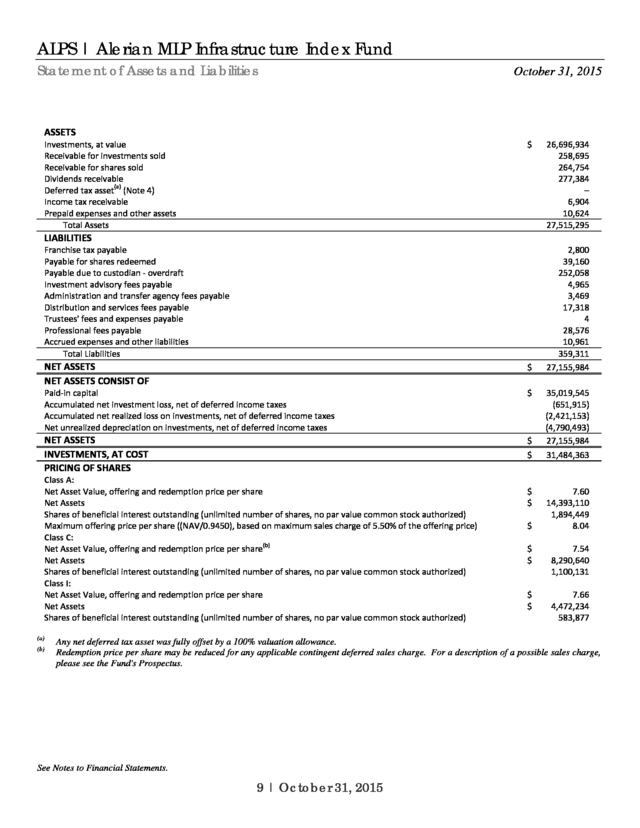
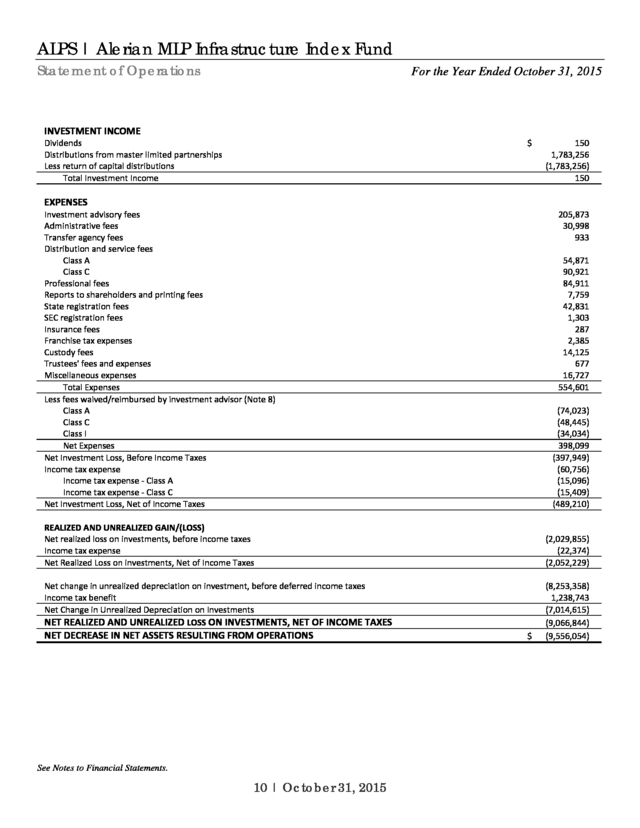
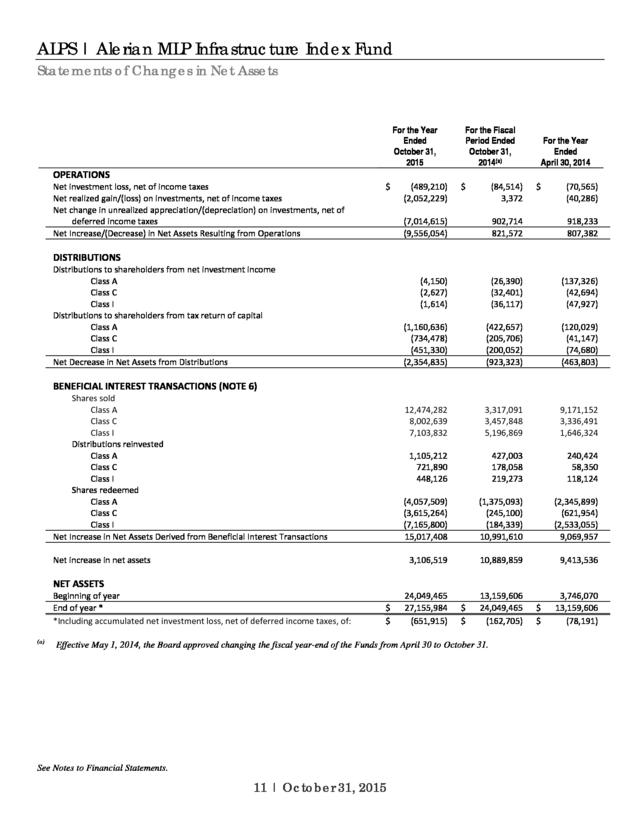
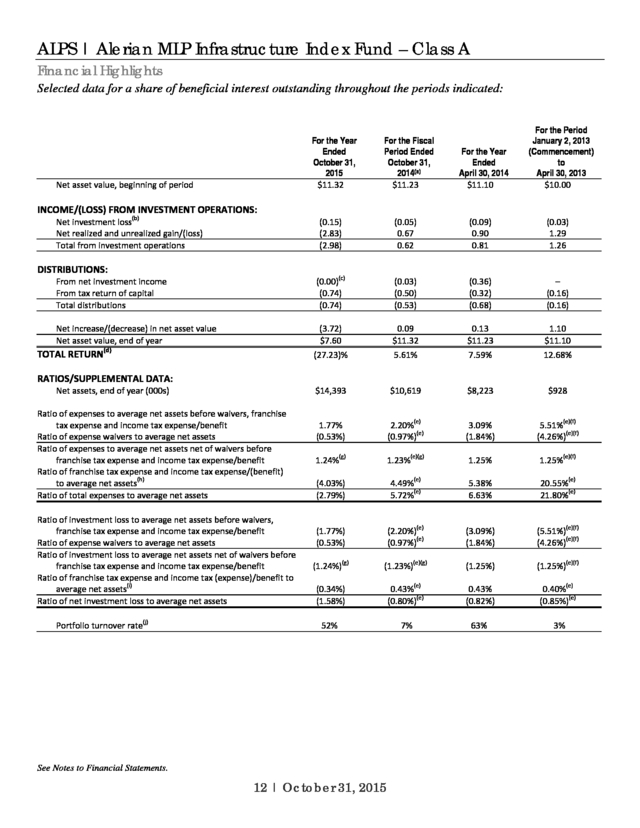
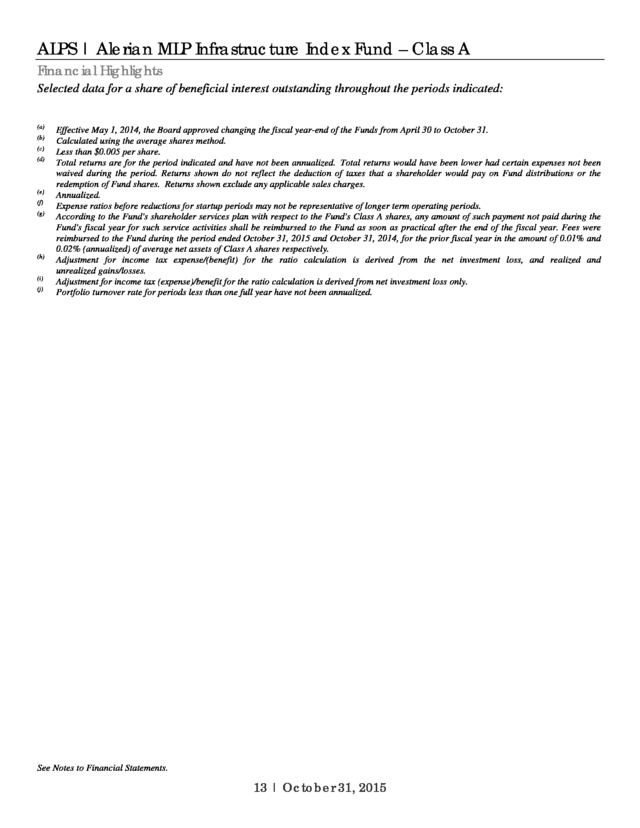
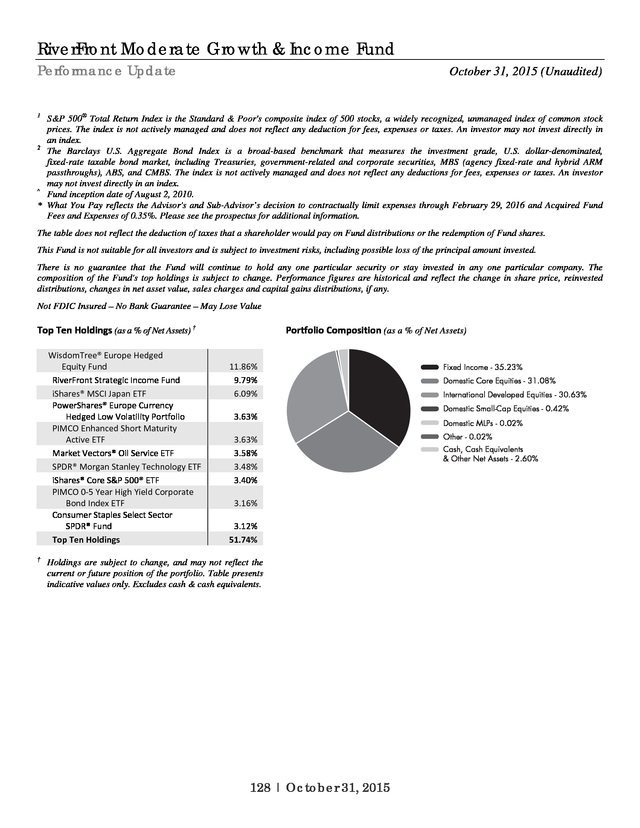
Performance figures are historical and reflect the change in share price, reinvested distributions, changes in net asset value, sales charges and capital gains distributions, if any. Not FDIC Insured – No Bank Guarantee – May Lose Value Top Ten Holdings (as a % of Net Assets) † Industry Sector Allocation (as a % of Total Investments) Enterprise Products Partners LP 10.69% Energy Transfer Partners LP 7.32% Magellan Midstream Partners LP 7.29% Plains All American Pipeline LP 7.17% Williams Partners LP 6.43% MarkWest Energy Partners LP 6.34% Enbridge Energy Partners LP 5.24% ONEOK Partners LP 4.97% Buckeye Partners LP 4.85% Targa Resources Partners LP Top Ten Holdings Pipeline Transportation | Petroleum - 41.90% Pipeline Transportation | Natural Gas - 30.76% Gathering & Processing - 25.65% 4.63% 64.93% † Holdings are subject to change, and may not reflect the current or future position of the Portfolio. Table presents approximate values only. 7 | October 31, 2015 . ALPS | Alerian MLP Infrastructure Index Fund Statement of Investments October 31, 2015 Value (Note 2) Shares MASTER LIMITED PARTNERSHIPS (98.31%) Gathering & Processing (25.65%) Pipelines (25.65%) DCP Midstream Partners LP EnLink Midstream Partners LP MarkWest Energy Partners LP Targa Resources Partners LP Western Gas Partners LP Williams Partners LP 23,010 34,082 39,401 41,907 19,406 51,673 $ 661,077 587,915 1,721,036 1,257,210 992,035 1,746,547 6,965,820 TOTAL GATHERING & PROCESSING 6,965,820 Common Abbreviations: LP - Limited Partnerships. For Fund compliance purposes, the Fund's industry classifications refer to any one or more of the industry sub-classifications used by one or more widely recognized market indexes or ratings group indexes, and/or as defined by Fund management. This definition may not apply for purposes of this report, which may combine industry sub-classifications for reporting ease. Industries are shown as a percent of net assets. See Notes to Financial Statements. 1,987,774 2,903,416 900,622 1,349,433 608,317 603,234 8,352,796 Pipeline Transportation | Natural Gas (30.76%) Pipelines (30.76%) Energy Transfer Partners LP 45,013 Enterprise Products Partners LP 105,082 EQT Midstream Partners LP 12,164 ONEOK Partners LP 42,395 Spectra Energy Partners LP 14,101 TC PipeLines LP 11,677 TOTAL PIPELINE TRANSPORTATION | NATURAL GAS 8,352,796 Pipeline Transportation | Petroleum (41.90%) Pipelines (41.90%) Buckeye Partners LP 19,403 Enbridge Energy Partners LP 50,901 Genesis Energy LP 23,641 Magellan Midstream Partners LP 31,021 NGL Energy Partners LP 23,246 NuStar Energy LP 16,144 Plains All American Pipeline LP 61,341 Shell Midstream Partners LP 13,363 Sunoco Logistics Partners LP 42,014 Tesoro Logistics LP 14,913 1,316,105 1,422,174 952,969 1,979,450 430,516 817,694 1,945,736 457,415 1,220,087 836,172 11,378,318 11,378,318 TOTAL PIPELINE TRANSPORTATION | PETROLEUM TOTAL MASTER LIMITED PARTNERSHIPS (Cost $31,484,363) 26,696,934 TOTAL INVESTMENTS (98.31%) (Cost $31,484,363) Other Assets In Excess Of Liabilities (1.69%) NET ASSETS (100.00%) $ 26,696,934 459,050 $ 27,155,984 8 | October 31, 2015 . ALPS | Alerian MLP Infrastructure Index Fund Statement of Assets and Liabilities October 31, 2015 ASSETS Investments, at value Receivable for investments sold Receivable for shares sold Dividends receivable Deferred tax asset(a) (Note 4) Income tax receivable Prepaid expenses and other assets Total Assets $ 26,696,934 258,695 264,754 277,384 – 6,904 10,624 27,515,295 $ 2,800 39,160 252,058 4,965 3,469 17,318 4 28,576 10,961 359,311 27,155,984 $ $ LIABILITIES Franchise tax payable Payable for shares redeemed Payable due to custodian †overdraft Investment advisory fees payable Administration and transfer agency fees payable Distribution and services fees payable Trustees' fees and expenses payable Professional fees payable Accrued expenses and other liabilities Total Liabilities NET ASSETS NET ASSETS CONSIST OF Paidâ€in capital Accumulated net investment loss, net of deferred income taxes Accumulated net realized loss on investments, net of deferred income taxes Net unrealized depreciation on investments, net of deferred income taxes NET ASSETS INVESTMENTS, AT COST PRICING OF SHARES $ 31,484,363 Class A: Net Asset Value, offering and redemption price per share Net Assets Shares of beneficial interest outstanding (unlimited number of shares, no par value common stock authorized) Maximum offering price per share ((NAV/0.9450), based on maximum sales charge of 5.50% of the offering price) Class C: Net Asset Value, offering and redemption price per share(b) Net Assets Shares of beneficial interest outstanding (unlimited number of shares, no par value common stock authorized) Class I: Net Asset Value, offering and redemption price per share Net Assets Shares of beneficial interest outstanding (unlimited number of shares, no par value common stock authorized) $ $ $ (b) 7.60 14,393,110 1,894,449 8.04 $ $ 7.54 8,290,640 1,100,131 $ $ 7.66 4,472,234 583,877 (a) 35,019,545 (651,915) (2,421,153) (4,790,493) 27,155,984 Any net deferred tax asset was fully offset by a 100% valuation allowance. Redemption price per share may be reduced for any applicable contingent deferred sales charge. For a description of a possible sales charge, please see the Fund's Prospectus. See Notes to Financial Statements. 9 | October 31, 2015 . ALPS | Alerian MLP Infrastructure Index Fund Statement of Operations For the Year Ended October 31, 2015 INVESTMENT INCOME Dividends Distributions from master limited partnerships Less return of capital distributions Total Investment Income $ 150 1,783,256 (1,783,256) 150 EXPENSES Investment advisory fees Administrative fees Transfer agency fees Distribution and service fees Class A Class C Professional fees Reports to shareholders and printing fees State registration fees SEC registration fees Insurance fees Franchise tax expenses Custody fees Trustees' fees and expenses Miscellaneous expenses Total Expenses Less fees waived/reimbursed by investment advisor (Note 8) Class A Class C Class I Net Expenses Net Investment Loss, Before Income Taxes Income tax expense Income tax expense †Class A Income tax expense †Class C Net Investment Loss, Net of Income Taxes REALIZED AND UNREALIZED GAIN/(LOSS) Net realized loss on investments, before income taxes Income tax expense Net Realized Loss on investments, Net of Income Taxes Net change in unrealized depreciation on investment, before deferred income taxes Income tax benefit Net Change in Unrealized Depreciation on Investments NET REALIZED AND UNREALIZED LOSS ON INVESTMENTS, NET OF INCOME TAXES See Notes to Financial Statements. 10 | October 31, 2015 54,871 90,921 84,911 7,759 42,831 1,303 287 2,385 14,125 677 16,727 554,601 (74,023) (48,445) (34,034) 398,099 (397,949) (60,756) (15,096) (15,409) (489,210) (2,029,855) (22,374) (2,052,229) NET DECREASE IN NET ASSETS RESULTING FROM OPERATIONS 205,873 30,998 933 $ (8,253,358) 1,238,743 (7,014,615) (9,066,844) (9,556,054) . ALPS | Alerian MLP Infrastructure Index Fund Statements of Changes in Net Assets For the Year Ended October 31, 2015 For the Fiscal Period Ended October 31, 2014(a) For the Year Ended April 30, 2014 OPERATIONS Net investment loss, net of income taxes Net realized gain/(loss) on investments, net of income taxes Net change in unrealized appreciation/(depreciation) on investments, net of deferred income taxes Net Increase/(Decrease) in Net Assets Resulting from Operations $ (489,210) $ (2,052,229) (84,514) $ 3,372 (70,565) (40,286) (7,014,615) (9,556,054) 902,714 821,572 918,233 807,382 DISTRIBUTIONS Distributions to shareholders from net investment income Class A Class C Class I Distributions to shareholders from tax return of capital Class A Class C Class I Net Decrease in Net Assets from Distributions (4,150) (2,627) (1,614) (1,160,636) (734,478) (451,330) (2,354,835) (26,390) (32,401) (36,117) (422,657) (205,706) (200,052) (923,323) (137,326) (42,694) (47,927) (120,029) (41,147) (74,680) (463,803) BENEFICIAL INTEREST TRANSACTIONS (NOTE 6) Shares sold Class A Class C Class I Distributions reinvested Class A Class C Class I Shares redeemed Class A Class C Class I Net Increase in Net Assets Derived from Beneficial Interest Transactions Net increase in net assets NET ASSETS Beginning of year End of year * *Including accumulated net investment loss, net of deferred income taxes, of: (a) 12,474,282 8,002,639 7,103,832 1,105,212 721,890 448,126 (4,057,509) (3,615,264) (7,165,800) 15,017,408 3,106,519 24,049,465 $ 27,155,984 $ (651,915) $ $ 3,317,091 3,457,848 5,196,869 427,003 178,058 219,273 (1,375,093) (245,100) (184,339) 10,991,610 10,889,859 13,159,606 24,049,465 (162,705) Effective May 1, 2014, the Board approved changing the fiscal year-end of the Funds from April 30 to October 31. See Notes to Financial Statements. 11 | October 31, 2015 $ $ 9,171,152 3,336,491 1,646,324 240,424 58,350 118,124 (2,345,899) (621,954) (2,533,055) 9,069,957 9,413,536 3,746,070 13,159,606 (78,191) . ALPS | Alerian MLP Infrastructure Index Fund – Class A Financial Highlights Selected data for a share of beneficial interest outstanding throughout the periods indicated: For the Year Ended October 31, 2015 $11.32 DISTRIBUTIONS: From net investment income From tax return of capital Total distributions Net increase/(decrease) in net asset value Net asset value, end of year TOTAL RETURN(d) (0.05) 0.67 0.62 (0.03) (0.50) (0.53) 0.09 $11.32 (0.09) 0.90 0.81 (0.36) (0.32) (0.68) 0.13 $11.23 (0.03) 1.29 1.26 – (0.16) (0.16) 1.10 $11.10 (27.23)% Net investment loss(b) Net realized and unrealized gain/(loss) Total from investment operations For the Year Ended April 30, 2014 $11.10 For the Period January 2, 2013 (Commencement) to April 30, 2013 $10.00 (0.15) (2.83) (2.98) (c) (0.00) (0.74) (0.74) (3.72) $7.60 Net asset value, beginning of period INCOME/(LOSS) FROM INVESTMENT OPERATIONS: For the Fiscal Period Ended October 31, 2014(a) $11.23 5.61% 7.59% 12.68% $14,393 $10,619 $8,223 $928 1.77% (0.53%) 2.20%(e) (e) (0.97%) 3.09% (1.84%) 5.51%(e)(f) (4.26%)(e)(f) 1.24%(g) 1.23%(e)(g) 1.25% 1.25%(e)(f) (4.03%) (2.79%) 4.49%(e) 5.72%(e) 5.38% 6.63% 20.55%(e) 21.80%(e) (1.77%) (0.53%) (e) (2.20%) (e) (0.97%) (3.09%) (1.84%) (5.51%)(e)(f) (4.26%)(e)(f) (1.24%)(g) (1.23%)(e)(g) (1.25%) (1.25%)(e)(f) RATIOS/SUPPLEMENTAL DATA: Net assets, end of year (000s) Ratio of expenses to average net assets before waivers, franchise tax expense and income tax expense/benefit Ratio of expense waivers to average net assets Ratio of expenses to average net assets net of waivers before franchise tax expense and income tax expense/benefit Ratio of franchise tax expense and income tax expense/(benefit) to average net assets(h) Ratio of total expenses to average net assets Ratio of investment loss to average net assets before waivers, franchise tax expense and income tax expense/benefit Ratio of expense waivers to average net assets Ratio of investment loss to average net assets net of waivers before franchise tax expense and income tax expense/benefit Ratio of franchise tax expense and income tax (expense)/benefit to average net assets(i) Ratio of net investment loss to average net assets Portfolio turnover rate(j) (0.34%) (1.58%) 52% 0.43%(e) (0.80%)(e) 7% See Notes to Financial Statements. 12 | October 31, 2015 0.43% (0.82%) 63% 0.40%(e) (0.85%)(e) 3% . ALPS | Alerian MLP Infrastructure Index Fund – Class A Financial Highlights Selected data for a share of beneficial interest outstanding throughout the periods indicated: (a) (c) (d) (b) (e) (g) (f) (h) (i) (j) Effective May 1, 2014, the Board approved changing the fiscal year-end of the Funds from April 30 to October 31. Calculated using the average shares method. Less than $0.005 per share. Total returns are for the period indicated and have not been annualized. Total returns would have been lower had certain expenses not been waived during the period. Returns shown do not reflect the deduction of taxes that a shareholder would pay on Fund distributions or the redemption of Fund shares. Returns shown exclude any applicable sales charges. Annualized. Expense ratios before reductions for startup periods may not be representative of longer term operating periods. According to the Fund's shareholder services plan with respect to the Fund's Class A shares, any amount of such payment not paid during the Fund's fiscal year for such service activities shall be reimbursed to the Fund as soon as practical after the end of the fiscal year.
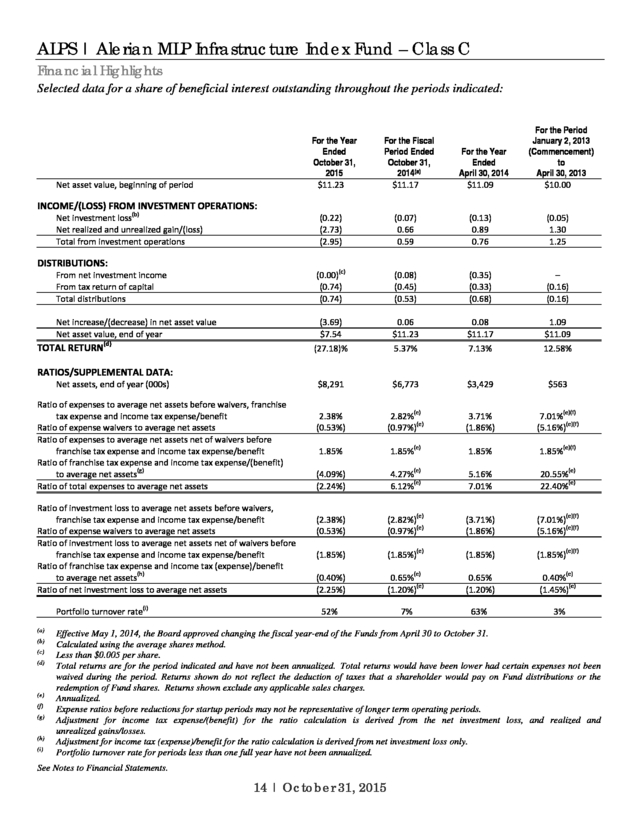
Fees were reimbursed to the Fund during the period ended October 31, 2015 and October 31, 2014, for the prior fiscal year in the amount of 0.01% and 0.02% (annualized) of average net assets of Class A shares respectively. Adjustment for income tax expense/(benefit) for the ratio calculation is derived from the net investment loss, and realized and unrealized gains/losses. Adjustment for income tax (expense)/benefit for the ratio calculation is derived from net investment loss only. Portfolio turnover rate for periods less than one full year have not been annualized. See Notes to Financial Statements. 13 | October 31, 2015 . ALPS | Alerian MLP Infrastructure Index Fund – Class C Financial Highlights Selected data for a share of beneficial interest outstanding throughout the periods indicated: For the Year Ended October 31, 2015 $11.23 For the Year Ended April 30, 2014 $11.09 For the Period January 2, 2013 (Commencement) to April 30, 2013 $10.00 (0.22) (2.73) (2.95) (c) (0.00) (0.74) (0.74) (3.69) $7.54 (0.07) 0.66 0.59 (0.08) (0.45) (0.53) 0.06 $11.23 (0.13) 0.89 0.76 (0.35) (0.33) (0.68) 0.08 $11.17 (0.05) 1.30 1.25 – (0.16) (0.16) 1.09 $11.09 (27.18)% 5.37% 7.13% 12.58% $8,291 $6,773 $3,429 $563 2.38% (0.53%) 2.82%(e) (e) (0.97%) 3.71% (1.86%) 7.01%(e)(f) (5.16%)(e)(f) 1.85% 1.85%(e) 1.85% 1.85%(e)(f) (4.09%) (2.24%) Net asset value, beginning of period For the Fiscal Period Ended October 31, 2014(a) $11.17 4.27%(e) 6.12%(e) 5.16% 7.01% 20.55%(e) 22.40%(e) (2.38%) (0.53%) (2.82%)(e) (e) (0.97%) (3.71%) (1.86%) (7.01%)(e)(f) (5.16%)(e)(f) (1.85%) (1.85%)(e) (1.85%) (1.85%)(e)(f) (0.40%) (2.25%) 52% 0.65%(e) (1.20%)(e) 7% 0.65% (1.20%) 63% INCOME/(LOSS) FROM INVESTMENT OPERATIONS: Net investment loss(b) Net realized and unrealized gain/(loss) Total from investment operations DISTRIBUTIONS: From net investment income From tax return of capital Total distributions Net increase/(decrease) in net asset value Net asset value, end of year TOTAL RETURN(d) RATIOS/SUPPLEMENTAL DATA: Net assets, end of year (000s) Ratio of expenses to average net assets before waivers, franchise tax expense and income tax expense/benefit Ratio of expense waivers to average net assets Ratio of expenses to average net assets net of waivers before franchise tax expense and income tax expense/benefit Ratio of franchise tax expense and income tax expense/(benefit) to average net assets(g) Ratio of total expenses to average net assets Ratio of investment loss to average net assets before waivers, franchise tax expense and income tax expense/benefit Ratio of expense waivers to average net assets Ratio of investment loss to average net assets net of waivers before franchise tax expense and income tax expense/benefit Ratio of franchise tax expense and income tax (expense)/benefit to average net assets(h) Ratio of net investment loss to average net assets Portfolio turnover rate(i) (a) (c) (d) (b) (e) (g) (f) (h) (i) 0.40%(e) (1.45%)(e) 3% Effective May 1, 2014, the Board approved changing the fiscal year-end of the Funds from April 30 to October 31. Calculated using the average shares method. Less than $0.005 per share. Total returns are for the period indicated and have not been annualized. Total returns would have been lower had certain expenses not been waived during the period. Returns shown do not reflect the deduction of taxes that a shareholder would pay on Fund distributions or the redemption of Fund shares. Returns shown exclude any applicable sales charges. Annualized. Expense ratios before reductions for startup periods may not be representative of longer term operating periods. Adjustment for income tax expense/(benefit) for the ratio calculation is derived from the net investment loss, and realized and unrealized gains/losses. Adjustment for income tax (expense)/benefit for the ratio calculation is derived from net investment loss only. Portfolio turnover rate for periods less than one full year have not been annualized. See Notes to Financial Statements. 14 | October 31, 2015 .
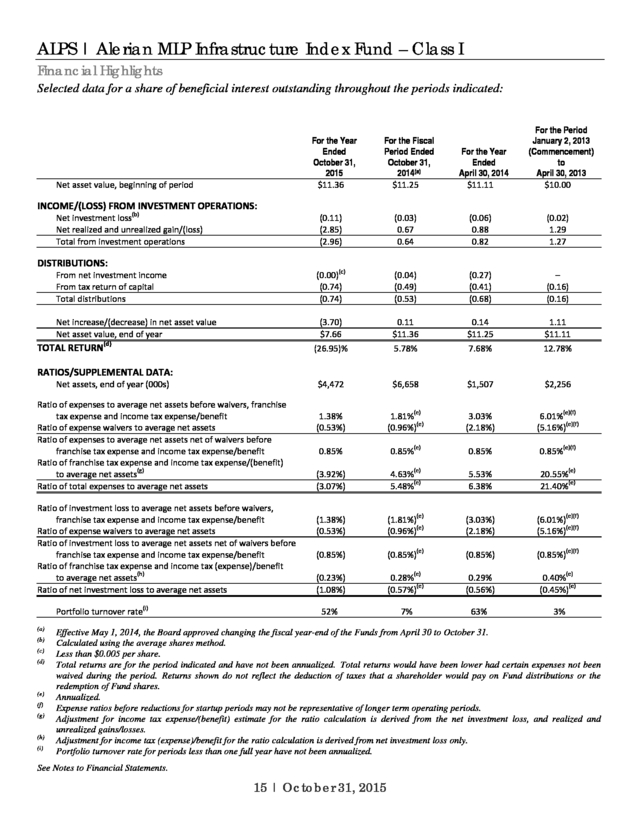
ALPS | Alerian MLP Infrastructure Index Fund – Class I Financial Highlights Selected data for a share of beneficial interest outstanding throughout the periods indicated: For the Year Ended October 31, 2015 $11.36 For the Year Ended April 30, 2014 $11.11 For the Period January 2, 2013 (Commencement) to April 30, 2013 $10.00 (0.11) (2.85) (2.96) (c) (0.00) (0.74) (0.74) (3.70) $7.66 (0.03) 0.67 0.64 (0.04) (0.49) (0.53) 0.11 $11.36 (0.06) 0.88 0.82 (0.27) (0.41) (0.68) 0.14 $11.25 (0.02) 1.29 1.27 – (0.16) (0.16) 1.11 $11.11 (26.95)% 5.78% 7.68% 12.78% $4,472 $6,658 $1,507 $2,256 1.38% (0.53%) 1.81%(e) (e) (0.96%) 3.03% (2.18%) 6.01%(e)(f) (5.16%)(e)(f) 0.85% 0.85%(e) 0.85% 0.85%(e)(f) (3.92%) (3.07%) Net asset value, beginning of period For the Fiscal Period Ended October 31, 2014(a) $11.25 4.63%(e) 5.48%(e) 5.53% 6.38% 20.55%(e) 21.40%(e) (1.38%) (0.53%) (1.81%)(e) (e) (0.96%) (3.03%) (2.18%) (6.01%)(e)(f) (5.16%)(e)(f) (0.85%) (0.85%)(e) (0.85%) (0.85%)(e)(f) (0.23%) (1.08%) 52% 0.28%(e) (0.57%)(e) 7% 0.29% (0.56%) 63% INCOME/(LOSS) FROM INVESTMENT OPERATIONS: Net investment loss(b) Net realized and unrealized gain/(loss) Total from investment operations DISTRIBUTIONS: From net investment income From tax return of capital Total distributions Net increase/(decrease) in net asset value Net asset value, end of year TOTAL RETURN(d) RATIOS/SUPPLEMENTAL DATA: Net assets, end of year (000s) Ratio of expenses to average net assets before waivers, franchise tax expense and income tax expense/benefit Ratio of expense waivers to average net assets Ratio of expenses to average net assets net of waivers before franchise tax expense and income tax expense/benefit Ratio of franchise tax expense and income tax expense/(benefit) to average net assets(g) Ratio of total expenses to average net assets Ratio of investment loss to average net assets before waivers, franchise tax expense and income tax expense/benefit Ratio of expense waivers to average net assets Ratio of investment loss to average net assets net of waivers before franchise tax expense and income tax expense/benefit Ratio of franchise tax expense and income tax (expense)/benefit to average net assets(h) Ratio of net investment loss to average net assets Portfolio turnover rate(i) (a) (c) (d) (b) (e) (g) (f) (h) (i) 0.40%(e) (0.45%)(e) 3% Effective May 1, 2014, the Board approved changing the fiscal year-end of the Funds from April 30 to October 31. Calculated using the average shares method. Less than $0.005 per share. Total returns are for the period indicated and have not been annualized. Total returns would have been lower had certain expenses not been waived during the period. Returns shown do not reflect the deduction of taxes that a shareholder would pay on Fund distributions or the redemption of Fund shares. Annualized. Expense ratios before reductions for startup periods may not be representative of longer term operating periods. Adjustment for income tax expense/(benefit) estimate for the ratio calculation is derived from the net investment loss, and realized and unrealized gains/losses. Adjustment for income tax (expense)/benefit for the ratio calculation is derived from net investment loss only. Portfolio turnover rate for periods less than one full year have not been annualized. See Notes to Financial Statements. 15 | October 31, 2015 . ALPS | CoreCommodity Management CompleteCommodities® Strategy Fund Management Commentary October 31, 2015 (Unaudited) The twelve month period ending on October 31, 2015 produced negative returns for commodities. Commodity futures prices, as measured by the diversified Bloomberg Commodities Total Return Index, were down (25.72%). Thomson Reuters/CoreCommodity CRB Total Return Index was down (28.05%) for the same period. Commodity equities also declined during the period, down (21.44%) as measured by the Standard and Poor’s Global Natural Resources Net Total Return Index. Commodity equities diverged notably from the performance of the broader Standard & Poor’s 500 Total Return Index for the period which posted +5.20% gains. The ALPS CoreCommodity Management Complete Commodities® Strategy Fund (JCRIX)(the “Fund”) delivered a net negative return of â€24.88% (JCRAX was †29.35% at MOP and JCRCX was down â€26.41% with CDSC). The Fund outperformed its benchmark, the Bloomberg Commodity Total Return Index, by 84 basis points during this period (measured against the performance of the “I” shares). The Fund employs a strategy that combines an actively managed portfolio of commodity futures related exposure (collateralized by U.S. Treasury Inflation Protected Securities – TIPS), commodity equities, and physical commodity ETF’s. At the end of October, the Fund allocated approximately 65% of its assets toward commodity futures related investments and approximately 35% of its assets in commodity equities. The Fund was more than 99% invested at the end of the period. Commodity prices were under considerable pressure during the twelve month period ended October 31, 2015. Cocoa was the only major commodity constituent to appreciate for the period, up 12.42%. Cocoa was supported by robust global demand and production difficulties in the key West African nations of the Ivory Coast, Ghana, Nigeria, Cameroon, and Togo. The most noteworthy decline in the price of commodities occurred in crude oil. West Texas Intermediate (WTI), the US benchmark crude, fell (42.15%) in the twelve month period ending in October. Natural gas prices posted nearly similar losses (40.07%). Crude oil product prices dropped as well, but not quite as sharply; heating oil down (39.60%) and reformulated gasoline (36.14%). Decisions that were made last November by OPEC and voiced by Saudi Arabia during our 2014 Thanksgiving holiday had a meaningful effect on an already oversupplied and declining energy complex. No production cuts were called for by OPEC and prices recoiled further. Reductions in energy costs weighed on the cost of production for other commodities. Global gross domestic product (GDP) growth was challenged by a variety of factors. The decline in growth rates led to hiring slowdowns, reductions in wages, and smaller amounts of disposable incomes. The effects could be felt throughout the commodity asset class. Industrial metals like nickel, essential in the manufacturing of stainless steel (36.22%), copper (23.94%), and aluminum (29.08%) clearly reflect the lowered demand and high inventory pressure. Calm weather conditions without any major disruptions around the globe led to high yields and lowered prices for many agricultural commodities. Fertilizer and seed costs were negatively impacted by energy price reductions. Soybean prices fell (15.58%), wheat dropped (11.42%) and corn prices declined by (8.26%). Coffee prices (35.66%), were hurt by expanding supplies and currency devaluations of more than 40% in Brazil, the leading producer of premium coffee in the world. Protein prices, represented by lean hogs (32.75%) and live cattle (14.65%), were pushed lower in part by reductions in feed costs. The US Dollar strengthened significantly during the year ending in October, up +11.55% as measured by the US Dollar Index (DXY). Since most commodities are priced in Dollars, commodity prices tend to be inversely related to Dollar moves. The strength of the Dollar was certainly a contributing factor in the slide of commodity prices over the same time frame. With that thought in mind, precious metals – gold (2.58%) and silver (3.35%) – performed better than most other commodities. In fact, precious metal prices were up relative to other weaker currencies. The Fund’s top equity holdings at the end of October 2015 included Sanderson Farms Inc (SAFM) (17.27%) YTD, Hormel Foods Corp. (HRL) +29.65% YTD, Pilgrim’s Pride (PPC) (42.09%) YTD, Monsanto (MON) (21.97%) YTD, Yara International (YAR NO) +15.55% YTD, Sociedad Quimica Minera de Chile (SQM) (18.84%) YTD, Calâ€Maine Foods (CALM) +36.97% YTD, Kubota Corp (6326 JP) +7.38% YTD, Dril†Quip Inc (DRQ) (19.77%) YTD, Weyerhauser Co (WY) (18.28%), YTD. TIPS and nominal US Treasuries are held by the Fund to invest excess cash and as collateral for commodity futures related investments held in our Cayman Island subsidiary. Nominal yields on the benchmark 10 year note were at 2.335% at the end of October 2014 and ended the twelve month period lower, 2.142%. Committee members of the FOMC, including Chairman Yellen, have recently voiced their desire to begin to raise and normalize interest rates, if certain data justifies the move. We believe we may be nearing the end of what has been a significant multiâ€year rally in US treasury prices. As a result, we continue to invest in TIPS with limited duration exposure. At the end of October, our weighted average maturity was approximately 1.10 years in our TIPS portfolio. We strongly believe that the long term fundamental drivers of commodity demand and ultimately higher prices are still in place. Population growth is likely to remain unabated regardless of the economic environment in the US and Europe. A billion more people are likely to be added to the world population over the next decade or so. The trend of wealth distribution is tipping toward the developing world as those economies grow at faster rates relative to the slow or negative growth occurring in the developed countries. The improving global quality of life is contributing to ever increasing demand for raw materials and food. Incremental gains in disposable income in the developing nations have led to competition for the commodities needed for more complex and costly lifestyles. The recent significant decline in prices of many commodities has resulted in serious curtailment of capital expenditures of global sovereign and corporate producers. Profits for these producers have 16 | October 31, 2015 . ALPS | CoreCommodity Management CompleteCommodities® Strategy Fund Management Commentary October 31, 2015 (Unaudited) been dramatically reduced and in some cases prices do not support marginal or ongoing operations. As a result, future supplies may be negatively impacted. In a world with limited supplies of food, fuel, building materials, and other necessities of life, price may become the ultimate allocator of these commodities. Additionally, the aggressively accommodative central bank monetary policies recently announced coupled with measures already in place globally are likely to make commodities and other real assets more attractive over time as currencies, including the US Dollar, may decline in value. Robert Hyman Portfolio Manager Standard & Poor’s 500 Index is a composite index of 500 stocks, a widely recognized, unmanaged index of common stock prices which does not reflect any deduction for fees, expenses, or taxes. An investor may not invest directly in an index. The Standard & Poor’s Global Natural Resources Index includes 90 of the largest publicly-traded companies in natural resources and commodities businesses that meet specific investability requirements, offering investors diversified and investable equity exposure across 3 primary commodity-related sectors: agribusiness, energy, and metals & mining. The views of the author and information discussed in this commentary are as of the date of publication, are subject to change, and may not reflect the writer's current views. The views expressed are those of the author only, and represent an assessment of market conditions at a specific point in time, are opinions only and should not be relied upon as investment advice regarding a particular investment or markets in general. Such information does not constitute a recommendation to buy or sell specific securities or investment vehicles.
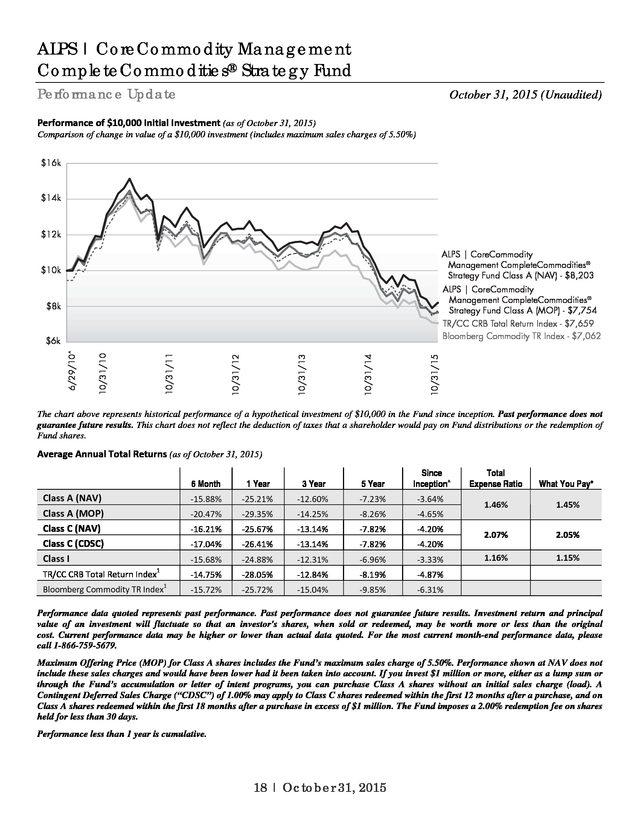
It should not be assumed that any investment will be profitable or will equal the performance of the fund(s) or any securities or any sectors mentioned in this letter. The subject matter contained in this letter has been derived from several sources believed to be reliable and accurate at the time of compilation. Neither ALPS Advisors, Inc., CoreCommodity Management, LLC, nor the Fund accepts any liability for losses either direct or consequential caused by the use of this information. Diversification cannot guarantee gain or prevent losses. 17 | October 31, 2015 . ALPS | CoreCommodity Management CompleteCommodities® Strategy Fund Performance Update October 31, 2015 (Unaudited) Performance of $10,000 Initial Investment (as of October 31, 2015) Comparison of change in value of a $10,000 investment (includes maximum sales charges of 5.50%) $16k $14k $12k ALPS | CoreCommodity Management CompleteCommodities® Strategy Fund Class A (NAV) - $8,203 $10k ALPS | CoreCommodity Management CompleteCommodities® Strategy Fund Class A (MOP) - $7,754 $8k TR/CC CRB Total Return Index - $7,659 Bloomberg Commodity TR Index - $7,062 10/31/15 10/31/14 10/31/13 10/31/12 10/31/11 10/31/10 6/29/10^ $6k The chart above represents historical performance of a hypothetical investment of $10,000 in the Fund since inception. Past performance does not guarantee future results. This chart does not reflect the deduction of taxes that a shareholder would pay on Fund distributions or the redemption of Fund shares. Average Annual Total Returns (as of October 31, 2015) 6 Month 3 Year 5 Year Since Inception^ â€25.21% â€12.60% â€7.23% â€3.64% â€20.47% â€29.35% â€14.25% â€8.26% â€4.65% â€16.21% â€25.67% â€13.14% â€7.82% â€4.20% â€17.04% â€26.41% â€13.14% â€7.82% â€4.20% â€15.68% 1 1 Year â€15.88% Class A (NAV) Class A (MOP) Class C (NAV) Class C (CDSC) Class I â€24.88% â€12.31% â€6.96% â€3.33% TR/CC CRB Total Return Index â€14.75% â€28.05% â€12.84% â€8.19% â€4.87% Bloomberg Commodity TR Index1 â€15.72% â€25.72% â€15.04% â€9.85% â€6.31% Total Expense Ratio What You Pay* 1.46% 1.45% 2.07% 2.05% 1.16% 1.15% Performance data quoted represents past performance. Past performance does not guarantee future results.
Investment return and principal value of an investment will fluctuate so that an investor's shares, when sold or redeemed, may be worth more or less than the original cost. Current performance data may be higher or lower than actual data quoted. For the most current month-end performance data, please call 1-866-759-5679. Maximum Offering Price (MOP) for Class A shares includes the Fund’s maximum sales charge of 5.50%.
Performance shown at NAV does not include these sales charges and would have been lower had it been taken into account. If you invest $1 million or more, either as a lump sum or through the Fund’s accumulation or letter of intent programs, you can purchase Class A shares without an initial sales charge (load). A Contingent Deferred Sales Charge (“CDSC”) of 1.00% may apply to Class C shares redeemed within the first 12 months after a purchase, and on Class A shares redeemed within the first 18 months after a purchase in excess of $1 million.
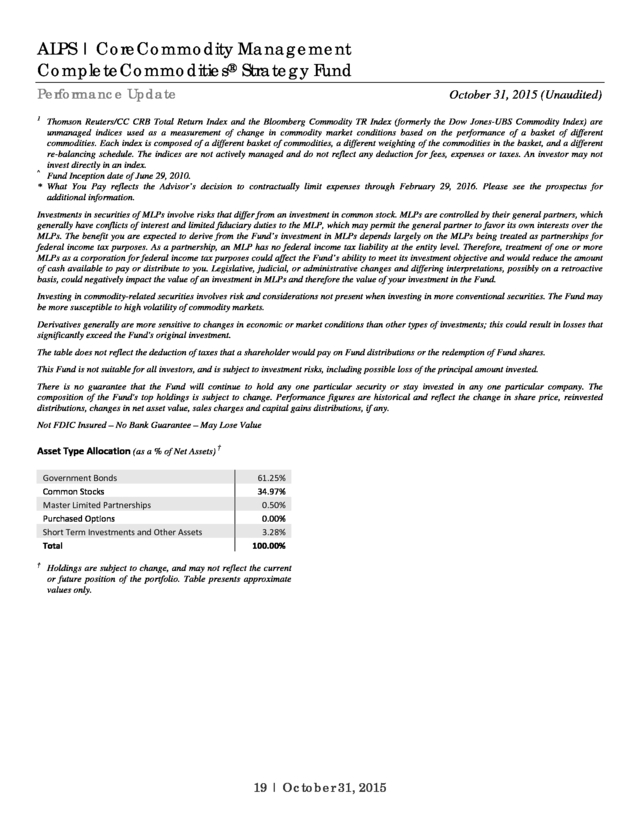
The Fund imposes a 2.00% redemption fee on shares held for less than 30 days. Performance less than 1 year is cumulative. 18 | October 31, 2015 . ALPS | CoreCommodity Management CompleteCommodities® Strategy Fund Performance Update October 31, 2015 (Unaudited) 1 Thomson Reuters/CC CRB Total Return Index and the Bloomberg Commodity TR Index (formerly the Dow Jones-UBS Commodity Index) are unmanaged indices used as a measurement of change in commodity market conditions based on the performance of a basket of different commodities. Each index is composed of a different basket of commodities, a different weighting of the commodities in the basket, and a different re-balancing schedule. The indices are not actively managed and do not reflect any deduction for fees, expenses or taxes. An investor may not invest directly in an index. ^ Fund Inception date of June 29, 2010. * What You Pay reflects the Advisor’s decision to contractually limit expenses through February 29, 2016.
Please see the prospectus for additional information. Investments in securities of MLPs involve risks that differ from an investment in common stock. MLPs are controlled by their general partners, which generally have conflicts of interest and limited fiduciary duties to the MLP, which may permit the general partner to favor its own interests over the MLPs. The benefit you are expected to derive from the Fund’s investment in MLPs depends largely on the MLPs being treated as partnerships for federal income tax purposes.
As a partnership, an MLP has no federal income tax liability at the entity level. Therefore, treatment of one or more MLPs as a corporation for federal income tax purposes could affect the Fund’s ability to meet its investment objective and would reduce the amount of cash available to pay or distribute to you. Legislative, judicial, or administrative changes and differing interpretations, possibly on a retroactive basis, could negatively impact the value of an investment in MLPs and therefore the value of your investment in the Fund. Investing in commodity-related securities involves risk and considerations not present when investing in more conventional securities.
The Fund may be more susceptible to high volatility of commodity markets. Derivatives generally are more sensitive to changes in economic or market conditions than other types of investments; this could result in losses that significantly exceed the Fund's original investment. The table does not reflect the deduction of taxes that a shareholder would pay on Fund distributions or the redemption of Fund shares. This Fund is not suitable for all investors, and is subject to investment risks, including possible loss of the principal amount invested. There is no guarantee that the Fund will continue to hold any one particular security or stay invested in any one particular company. The composition of the Fund's top holdings is subject to change. Performance figures are historical and reflect the change in share price, reinvested distributions, changes in net asset value, sales charges and capital gains distributions, if any. Not FDIC Insured – No Bank Guarantee – May Lose Value Asset Type Allocation (as a % of Net Assets) † † Government Bonds Common Stocks Master Limited Partnerships Purchased Options Short Term Investments and Other Assets Total 61.25% 34.97% 0.50% 0.00% 3.28% 100.00% Holdings are subject to change, and may not reflect the current or future position of the portfolio.
Table presents approximate values only. 19 | October 31, 2015 . ALPS | CoreCommodity Management CompleteCommodities® Strategy Fund Consolidated Statement of Investments Shares COMMON STOCKS (34.97%) Argentina (0.11%) YPF SA, Sponsored ADR Australia (0.83%) BHP Billiton, Ltd. BlueScope Steel, Ltd. Fortescue Metals Group, Ltd. GrainCorp, Ltd., Class A Iluka Resources, Ltd. Incitec Pivot, Ltd. Nufarm, Ltd. Regis Resources, Ltd. Sandfire Resources NL South32, Ltd.(a) South32, Ltd., ADR(a) Woodside Petroleum, Ltd. Austria (0.13%) OMV AG Voestalpine AG Bermuda (0.25%) Kosmos Energy, Ltd.(a) Nabors Industries, Ltd. Seadrill, Ltd.(a) Brazil (0.54%) BRF SA, ADR(a) Cia de Saneamento Basico do Estado de Sao Paulo, ADR(a) Cia Siderurgica Nacional SA, Sponsored ADR Gerdau SA, Sponsored ADR Petroleo Brasileiro SA, Sponsored ADR(a) Vale SA, Sponsored ADR Canada (5.90%) Advantage Oil & Gas, Ltd.(a) Agnicoâ€Eagle Mines, Ltd. Alamos Gold, Inc., Class A ARC Resources, Ltd. Argonaut Gold, Inc.(a) AuRico Metals, Inc.(a) B2Gold Corp.(a) Barrick Gold Corp. Baytex Energy Corp.(a) Birchcliff Energy, Ltd.(a) Bonavista Energy Corp. Cameco Corp. Value (Note 2) 21,316 $ 455,310 402,263 400,991 46,668 366,252 276,650 529,692 369,447 306,350 188,777 71,895 6,631 372,910 3,338,526 24,505 126,081 31,313 56,752 60,429 188,051 61,898 206,540 41,755 68,819 1,290 17,661 425,412 83,299 508,711 15,986 2,300 462,696 119,637 418,117 1,000,450 67,844 11,916 64,624 31,540 483,508 241,150 1,058,649 1,580 190,337 1,943 264,568 35,152 42,979 171,542 187,389 2,167,599 35,400 40,269 96,038 69,987 14,775 42,229 168,500 5,870 113,300 51,600 84,800 22,228 196,817 1,139,163 369,203 1,031,928 15,254 25,513 181,695 45,140 460,964 224,931 189,367 314,971 October 31, 2015 Value (Note 2) Shares Canada (continued) Canadian Energy Services & Technology Corp. Canadian Natural Resources, Ltd. Canadian Oil Sands, Ltd. Cenovus Energy, Inc. Centerra Gold, Inc. Crescent Point Energy Corp. Detour Gold Corp.(a) Eldorado Gold Corp. Encana Corp. Endeavour Silver Corp.(a) Enerplus Corp. Ensign Energy Services, Inc. First Quantum Minerals, Ltd. Francoâ€Nevada Corp. Freehold Royalties, Ltd. Goldcorp, Inc. HudBay Minerals, Inc. Husky Energy, Inc. IAMGOLD Corp.(a) Imperial Oil, Ltd. Maple Leaf Foods, Inc. MEG Energy Corp.(a) Mullen Group, Ltd. New Gold, Inc.(a) Osisko Gold Royalties, Ltd. Pacific Rubiales Energy Corp. Pan American Silver Corp. Paramount Resources, Ltd., Class A(a) Parex Resources, Inc.(a) Pason Systems, Inc. Pengrowth Energy Corp.(a) Peyto Exploration & Development Corp. Potash Corp. of Saskatchewan, Inc. Precision Drilling Corp. Primero Mining Corp.(a) Raging River Exploration, Inc.(a) Sandstorm Gold, Ltd.(a) Secure Energy Services, Inc. SEMAFO, Inc.(a) Seven Generations Energy, Ltd., Class A(a) ShawCor, Ltd. Silver Standard Resources, Inc.(a) Silver Wheaton Corp. SunCoke Energy, Inc. Suncor Energy, Inc. Tahoe Resources, Inc. Teck Resources, Ltd., Class B TORC Oil & Gas, Ltd. Tourmaline Oil Corp.(a) Turquoise Hill Resources, Ltd.(a) Vermilion Energy, Inc. 20 | October 31, 2015 57,800 $ 5,741 197,808 105,029 78,900 10,981 16,587 65,346 118,905 18,980 90,600 27,700 33,447 9,227 22,900 31,061 23,000 10,586 456 25,209 10,500 48,000 20,800 69,617 2,569 28,200 8,431 249,748 133,306 1,493,090 1,564,672 444,099 149,649 184,441 228,711 907,245 31,317 427,502 174,131 178,541 467,717 177,757 398,202 119,433 143,052 821 838,822 166,943 399,388 277,736 170,562 26,680 54,994 63,823 19,800 43,000 13,400 164,500 200,332 322,928 197,167 161,028 10,500 58,870 89,606 37,900 62,300 39,467 42,200 110,100 216,809 1,190,940 353,944 87,243 395,450 104,588 280,451 250,074 24,900 12,700 44,960 88,221 16,171 46,695 110,700 10,972 35,600 21,200 81,758 18,900 265,262 269,520 310,224 1,198,923 80,208 1,389,243 924,475 64,385 180,505 441,153 222,382 665,027 . ALPS | CoreCommodity Management CompleteCommodities® Strategy Fund Consolidated Statement of Investments Shares Canada (continued) Yamana Gold, Inc. Chile (0.45%) Sociedad Quimica y Minera de Chile SA, Sponsored ADR China (0.66%) China Petroleum & Chemical Corp., ADR China Petroleum & Chemical Corp., Class H China Shenhua Energy Co., Ltd., Class H CNOOC, Ltd. CNOOC, Ltd., Sponsored ADR Jiangxi Copper Co., Ltd., Class H PetroChina Co., Ltd., ADR PetroChina Co., Ltd., Class H Zijin Mining Group Co., Ltd., Class H Colombia (0.12%) Ecopetrol SA, Sponsored ADR Denmark (0.06%) FLSmidth & Co. A/S Finland (0.07%) Kemira OYJ Outotec OYJ France (0.14%) TOTAL SA TOTAL SA, Sponsored ADR Germany (0.21%) Aurubis AG K+S AG Salzgitter AG Great Britain (0.08%) Amec Foster Wheeler PLC John Wood Group PLC India (0.01%) Vedanta, Ltd., ADR Israel (0.06%) The Israel Corp., Ltd. Value (Note 2) 92,948 $ 203,537 23,643,126 92,915 1,800,693 464 33,445 308,358 220,807 95,369 193,001 10,885 50,082 4,087 330,045 161,438 216,393 1,237,407 66,297 321,361 258,054 560,331 151,097 2,666,299 50,903 474,416 6,011 227,594 10,739 43,438 127,303 149,509 276,812 4,886 6,996 237,186 337,417 574,603 639 20,353 10,429 42,723 513,760 301,099 857,582 13,636 18,458 149,461 169,876 319,337 9,014 53,904 785 October 31, 2015 Value (Note 2) Shares Israel (continued) Tower Semiconductor, Ltd.(a) Japan (2.31%) Hitachi Metals, Ltd. Idemitsu Kosan Co., Ltd. Inpex Corp. Iseki & Co., Ltd. Japan Petroleum Exploration Co., Ltd. JFE Holdings, Inc. Kubota Corp. Kurita Water Industries, Ltd. Maruichi Steel Tube, Ltd. Nihon Nohyaku Co., Ltd. Nihon Trim Co., Ltd. Nippon Suisan Kaisha, Ltd. Nisshin Steel Co., Ltd. Osaka Titanium Technologies Co., Ltd. Sumitomo Forestry Co., Ltd. Sumitomo Metal Mining Co., Ltd. Tokyo Steel Manufacturing Co., Ltd. Yamato Kogyo Co., Ltd. Jersey (0.45%) Petrofac, Ltd. Randgold Resources, Ltd., ADR Luxembourg (0.07%) ArcelorMittal Subsea 7 SA(a) Tenaris SA, ADR Marshall Islands (0.07%) Seadrill Partners LLC Mexico (0.25%) Grupo Lala SAB de CV Grupo Mexico SAB de CV, Series B Industrias Penoles SAB de CV Netherlands (0.24%) Frank's International NV Fugro N.V.(a) Royal Dutch Shell PLC, Class A, Sponsored ADR 202,258 21 | October 31, 2015 1,846 $ 25,233 227,491 17,900 8,931 135,133 20,907 204,559 147,209 1,293,993 34,651 10,600 12,600 112,000 70,016 20,000 105,300 4,101 200,600 29,000 319,748 200,063 1,755,134 1,591,563 515,455 689,376 153,613 676,591 300,887 8,500 37,659 21,000 232,804 454,080 262,870 248,977 179,896 9,261,469 37,000 6,700 165,162 1,649,884 1,815,046 12,709 24,673 150,776 42,182 69,316 262,274 26,951 5,410 2,743 25,493 285,776 267,937 547,880 173,627 989,444 104,900 224,783 $ 13,107 27,242 7,518 467,473 142,609 6,890 361,449 971,531 . ALPS | CoreCommodity Management CompleteCommodities® Strategy Fund Consolidated Statement of Investments Shares Norway (1.56%) Aker Solutions ASA Bakkafrost P/F Det Norske OLJ ASA(a) DNO ASA(a) Marine Harvest ASA(a) Norsk Hydro ASA Petroleum Geoâ€Services ASA Statoil ASA TGS Nopec Geophysical Co. ASA Yara International ASA Peru (0.11%) Cia de Minas Buenaventura SAA, ADR Singapore (0.32%) First Resources, Ltd. Golden Agriâ€Resources, Ltd. Olam International, Ltd. Wilmar International, Ltd. South Africa (0.50%) Anglo Platinum, Ltd.(a) Exxaro Resources, Ltd. Gold Fields, Ltd., Sponsored ADR Harmony Gold Mining Co., Ltd., Sponsored ADR(a) Impala Platinum Holdings, Ltd.(a) Kumba Iron Ore, Ltd. Sasol, Ltd. Sibanye Gold, Ltd., Sponsored ADR South Korea (0.03%) POSCO, Sponsored ADR Spain (0.03%) Acerinox SA Sweden (0.34%) Boliden AB Holmen AB, B Shares Lundin Petroleum AB(a) SSAB AB, A Shares(a) Svenska Cellulosa AB SCA, Class B Switzerland (0.53%) Glencore PLC(a) Noble Corp. PLC Syngenta AG Transocean, Ltd. Value (Note 2) 44,620 $ 178,548 3,986 128,070 28,431 174,499 295,286 296,094 108,913 1,459,993 104,109 373,220 64,335 267,887 17,750 284,527 35,976 709,210 52,450 2,380,906 6,252,954 71,096 455,725 102,200 893,758 46,254 366,661 137,152 248,815 66,035 819,223 1,271,225 5,831 35,057 489,941 102,265 145,583 1,239,551 38,989 39,295 22,220 8,185 2,515 26,368 107,388 96,208 262,116 16,423 1,995,902 2,859 114,446 10,270 111,172 7,842 11,000 16,470 41,117 16,465 150,166 331,794 238,080 148,759 485,650 1,354,449 28,003 9,174 4,716 8,890 48,566 123,574 1,587,824 140,729 October 31, 2015 Value (Note 2) Shares Switzerland (continued) Weatherford International, Ltd.(a) United Kingdom (0.84%) Anglo American PLC Antofagasta PLC BG Group PLC BHP Billiton PLC, ADR BP PLC, Sponsored ADR CNH Industrial N.V. Fresnillo PLC Kazakhmys PLC(a) Lonmin PLC(a) Severn Trent PLC United Utilities Group PLC United States (17.70%) AGCO Corp. Allegheny Technologies, Inc. Allied Nevada Gold Corp.(a)(b) American States Water Co. American Vanguard Corp. American Water Works Co., Inc. The Andersons, Inc. Antero Resources Corp.(a) Apache Corp. Aqua America, Inc. Archerâ€Danielsâ€Midland Co. Atwood Oceanics, Inc. Baker Hughes, Inc. Boulder Brands, Inc.(a) BP Prudhoe Bay Royalty Trust Bristow Group, Inc. Bunge, Ltd. Calgon Carbon Corp. California Resources Corp. California Water Service Group Calâ€Maine Foods, Inc. Cameron International Corp.(a) Carpenter Technology Corp. Carrizo Oil & Gas, Inc.(a) Century Aluminum Co.(a) CF Industries Holdings, Inc. Chesapeake Energy Corp. Chevron Corp. Cimarex Energy Co. Civeo Corp. Cliffs Natural Resources, Inc. Coeur Mining, Inc.(a) Commercial Metals Co. ConocoPhillips Continental Resources, Inc.(a) Core Laboratories N.V. CST Brands, Inc. 22 | October 31, 2015 20,498 $ 209,899 2,110,592 6,469 13,306 17,867 3,227 21,309 36,636 14,550 11,431 32,588 18,234 64,416 54,510 107,999 282,324 104,071 760,731 248,758 163,741 20,459 12,811 630,498 981,618 3,367,520 33,294 5,767 28,885 12,117 9,167 3,695 23,477 17,644 4,465 18,258 13,777 25,676 3,155 106,740 5,689 9,527 2,390 20,375 5,559 12,143 33,172 17,026 5,307 1,829 28,070 15,723 39,687 8,502 3,872 14,255 7,741 22,697 24,641 5,846 143 9,180 1,278 1,611,097 84,775 1,127 493,768 122,929 211,945 831,086 415,869 210,435 522,179 629,058 424,938 166,205 945,716 223,578 330,873 174,374 350,450 22,458 271,518 1,773,375 1,157,938 176,776 68,825 101,613 798,257 282,968 772,662 457,128 26,514 21,365 61,282 354,091 311,884 4,849 1,067,909 45,919 . ALPS | CoreCommodity Management CompleteCommodities® Strategy Fund Consolidated Statement of Investments Shares United States (continued) Darling Ingredients, Inc.(a) Deere & Co. Devon Energy Corp. Diamond Offshore Drilling, Inc. Diamondback Energy, Inc.(a) Drilâ€Quip, Inc.(a) Energen Corp. Ensco PLC, Class A EOG Resources, Inc. EP Energy Corp., Class A(a) EQT Corp. Exterran Holdings, Inc. Exxon Mobil Corp. First Majestic Silver Corp.(a) FMC Corp. FMC Technologies, Inc.(a) Forum Energy Technologies, Inc.(a) Freeportâ€McMoRan, Inc. Halliburton Co. Harsco Corp. Hecla Mining Co. Helix Energy Solutions Group, Inc.(a) Helmerich & Payne, Inc. Hess Corp. HollyFrontier Corp. Hormel Foods Corp. Ingredion, Inc. Intrepid Potash, Inc.(a) Joy Global, Inc. Kaiser Aluminum Corp. Kinder Morgan, Inc. Laredo Petroleum, Inc.(a) Lindsay Corp. Marathon Oil Corp. Marathon Petroleum Corp. Matador Resources Co.(a) McEwen Mining, Inc. Memorial Resource Development Corp.(a) Monsanto Co. The Mosaic Co. Murphy Oil Corp. National Oilwell Varco, Inc. Newfield Exploration Co.(a) Newmont Mining Corp. Newpark Resources, Inc.(a) Noble Energy, Inc. NOW, Inc.(a) Occidental Petroleum Corp. Oceaneering International, Inc. Oil States International, Inc.(a) Paragon Offshore PLC Pattersonâ€UTI Energy, Inc. PDC Energy, Inc.(a) Peabody Energy Corp. Value (Note 2) 18,472 $ 186,937 6,627 516,906 5,560 233,131 3,190 63,417 2,929 216,277 27,052 1,665,321 12,697 738,331 9,480 157,652 3,824 328,290 39,837 219,502 230,783 3,493 18,986 412,756 13,502 1,117,155 40,390 133,691 15,273 621,764 26,399 893,078 25,706 340,605 6,163 72,539 564 21,646 21,983 235,878 101,198 209,480 73,603 9,209 13,655 28,340 72,879 9,393 32,370 19,293 1,761 5,763 39,853 17,871 56,926 31,343 18,153 29,851 425,425 518,190 767,548 1,387,810 4,922,976 892,899 124,948 331,454 143,152 157,618 457,512 1,211,296 1,046,300 1,623,567 466,714 26,872 31,199 39,699 37,615 29,118 17,661 15,964 84 24,549 4,222 1,643 5,631 32,913 32,770 3,058 17,623 5,676 491 551,910 3,700,741 1,271,011 827,825 664,760 641,593 1,635 138,947 151,317 27,126 419,735 1,383,004 983,428 734 262,406 342,490 6,280 October 31, 2015 Value (Note 2) Shares United States (continued) Phillips 66 Pilgrim's Pride Corp. Pioneer Natural Resources Co. Plum Creek Timber Co., Inc. REIT Potash Corp. REIT Rayonier, Inc. REIT Reliance Steel & Aluminum Co. Royal Gold, Inc. RPC, Inc. RSP Permian, Inc.(a) Sanderson Farms, Inc. Schlumberger, Ltd. Seventy Seven Energy, Inc.(a) Southern Copper Corp. Southwestern Energy Co.(a) Steel Dynamics, Inc. Stillwater Mining Co.(a) Superior Energy Services, Inc. Synergy Resources Corp.(a) Tyson Foods, Inc., Class A Valero Energy Corp. Walter Energy, Inc.(a) Weyerhaeuser Co. REIT Whiting Petroleum Corp.(a) Worthington Industries, Inc. TOTAL COMMON STOCKS (Cost $168,537,684) MASTER LIMITED PARTNERSHIPS (0.50%) United States (0.50%) Alliance Resource Partners LP Breitburn Energy Partners LP Buckeye Partners LP CVR Partners LP Energy Transfer Partners LP 11/10/15 Enterprise Products Partners LP Magellan Midstream Partners LP MarkWest Energy Partners LP Memorial Production Partners LP Plains All American Pipeline LP Rentech Nitrogen Partners LP Vanguard Natural Resources LLC Williams Partners LP TOTAL MASTER LIMITED PARTNERSHIPS (Cost $2,603,105) 23 | October 31, 2015 10,779 $ 959,870 228,386 4,337,050 1,605 220,110 4,614 187,974 31,180 974,063 36,867 835,038 3,847 230,666 2,115 101,182 107,192 1,182,328 14,082 386,128 76,894 5,344,902 12,112 946,674 592 675 12,204 338,783 12,696 140,164 17,923 331,038 112 1,046 13,527 191,542 41,496 464,340 4,769 211,553 20,330 1,340,154 68,768 4,298 56,586 1,659,667 2,961 51,018 15,573 478,091 70,940,449 140,152,427 14,363 63,482 977 19,930 307,943 145,374 66,270 181,761 2,591 10,676 2,054 1,427 37,657 3,090 7,631 34,876 1,242 114,418 294,978 131,066 62,331 210,126 98,015 90,427 275,172 41,980 2,019,861 2,019,861 . ALPS | CoreCommodity Management CompleteCommodities® Strategy Fund Consolidated Statement of Investments October 31, 2015 (d) Principal Amount Value (Note 2) GOVERNMENT BONDS (61.25%) U.S. Treasury Bonds (61.25%) United States Treasury Inflation Indexed Bonds 2.000%, 1/15/16 $ 16,270,569 $ 16,259,017 0.125%, 4/15/16(c) 68,022,360 67,610,076 2.500%, 7/15/16 2,183,222 2,225,494 0.875%, 11/30/16 25,000,000 25,107,100 2.375%, 1/15/17(c) 10,340,750 10,638,584 1.000%, 3/31/17(c) 36,000,000 36,211,860 0.125%, 4/15/17(c) 15,214,705 15,209,745 0.750%, 6/30/17(c) 45,000,000 45,072,945 2.625%, 7/15/17(c) 14,661,353 15,382,676 1.625%, 1/15/18 11,376,200 11,791,773 245,509,270 TOTAL GOVERNMENT BONDS 245,509,270 (Cost $247,612,383) Expiration Exercise Number of Value Date Price Contracts (Note 2) PURCHASED OPTIONS (0.00%) Purchased Call Options (0.00%) WTI Crude Future: 11/17/15 $80.00 500 $ 5,000 2,250 11/17/15 100.00 225 7,250 Total Purchased Call Options (Cost $1,373,465) 7,250 7-Day Value Yield Shares (Note 2) SHORT TERM INVESTMENTS (1.20%) Money Market Fund (1.20%) Dreyfus Treasury Prime Cash Management Fund, Institutional Shares 0.00004% 4,793,239 $ 4,793,239 TOTAL SHORT TERM INVESTMENTS 4,793,239 (Cost $4,793,239) TOTAL INVESTMENTS (97.92%) (Cost $424,919,876) $ 392,482,047 Other Assets In Excess Of Liabilities (2.08%)(d) 8,327,400 NET ASSETS †100.00% $ 400,809,447 Includes cash which is being held as collateral for total return swap contracts, future contracts and written options in the amount of $595,033. Common Abbreviations: A/S - Aktieselskab is the Danish equivalent for the term Stock Company. AB - Aktiebolag is the Swedish equivalent of the term corporation. ADR - American Depositary Receipt. AG - Aktiengesellschaft is a German term that refers to a corporation that is limited by shares, i.e., owned by shareholders. ASA - Allmennaksjeselskap is the Norwegian term for public limited company. Ltd. - Limited. LP - Limited Partnership. N.V. - Naamloze vennootschap is the Dutch term for a public limited liability corporation. OYJ - Osakeyhtio is the Finnish equivalent of a public limited company. PLC - Public Limited Co. REIT - Real Estate Investment Trust. SA - Generally designated corporations in various countries, mostly those employing the civil law. SAA - Sociedad Anonima Abierta is the Peruvian term used for companies with 20 or more shareholders. SAB de CV - A variable capital company. SCA - Societe en commandite pe actiuni is the Romanian term for limited liability partnership. For Fund compliance purposes, the Fund's industry and geographical classifications refer to any one or more of the industry sub-classifications used by one or more widely recognized market indexes or ratings group indexes, and/or as defined by Fund management. This definition may not apply for purposes of this report, which may combine sub-classifications for reporting ease.
Industries and regions are shown as a percent of net assets. See Notes to Financial Statements. (a) (b) (c) Non-Income Producing Security. Fair valued security; valued by management in accordance with procedures approved by the Fund's Board of Trustees. As of October 31, 2015, these securities had a total value of $1,127 or 0.0003% of total net assets. Security, or portion of security, is being held as collateral for total return swap contracts, futures contracts and written options aggregating a total market value of $48,658,925. 24 | October 31, 2015 .
ALPS | CoreCommodity Management CompleteCommodities® Strategy Fund Consolidated Statement of Investments October 31, 2015 SCHEDULE OF WRITTEN OPTIONS Expiration Date Written Call Options Sugar #11 Future Sugar (WRLD) Future: WTI Crude Future: TOTAL WRITTEN CALL OPTIONS (Premiums received $802,326) Exercise Price Value (Note 2) Contracts 1/16/16 $ 15.50 (20) $ (10,080) 2/16/16 2/16/16 15.00 15.50 (50) (50) (41,440) (31,920) 11/17/15 11/17/15 90.00 100.00 (500) (225) (5,000) (2,250) (90,690) (36,562) (2,341,000) (2,377,562) $ (2,468,252) Written Put Options Coffee 'C' Future WTI Crude Future TOTAL WRITTEN PUT OPTIONS (Premiums received $339,723) TOTAL WRITTEN OPTIONS (Premiums received $1,142,049) 1/23/16 11/17/15 115.00 70.00 (30) (100) Position Contracts Expiration Date Value (Note 2) Long Long Short Long 265 25 (39) 10 11/14/15 12/21/15 12/30/15 12/15/15 FUTURES CONTRACTS Description Brent Crude Future Coffee 'C' Future Copper Future LME Nickel Future Description Gold 100 Oz Future LME Zinc Future Natural Gas Future Platinum Future Silver Future Sugar #11 (World) WTI Crude Futures Contracts Expiration Date Long Long Long Long Long Long Short 35 2 15 61 39 140 (244) 12/30/15 12/15/15 11/26/15 1/28/16 12/30/15 3/01/16 11/20/15 Position $ $ 25 | October 31, 2015 13,133,400 $ 1,133,906 (2,259,563) 602,729 12,610,472 $ Unrealized Appreciation Value (Note 2) $ $ 3,994,900 $ 84,893 348,150 3,016,755 3,035,565 2,276,736 (11,367,960) 1,389,039 $ 728,750 34,219 38,513 2,583 804,065 Unrealized Depreciation (86,915) (5,673) (4,800) (25,620) (65,910) (18,816) (827,160) (1,034,894) . ALPS | CoreCommodity Management CompleteCommodities® Strategy Fund Consolidated Statement of Investments October 31, 2015 TOTAL RETURN SWAP CONTRACTS(a) Swap Counterparty Reference Obligation Notional Dollars UBS CRB 3m Fwd TR Index* $ 14,375,255 Citigroup CRB 3m Fwd TR Index* 65,690,265 Societe Generale CRB 3m Fwd TR Index* 78,798,197 Bank of America †Merrill Lynch CRB 3m Fwd TR Index* 73,722,783 Bank of America †Merrill Lynch LME Copper Future 3,070,800 Bank of America †Merrill Lynch ML eXtra Coffee GA6 2,780,847 Bank of America †Merrill Lynch ML eXtra Silver GA6 465,253 Swap Counterparty Reference Obligation Bank of America †Merrill Lynch MLCS Coffee Jâ€F3 Bank of America †Merrill Lynch MLCS Copper Jâ€F3 Bank of America †Merrill Lynch MLCS Aluminum Jâ€F3 Floating Rate/Fixed Amount Paid by Fund USB3MTA + 40 bps** USB3MTA + 27 bps** USB3MTA + 35 bps** USB3MTA + 35 bps** n/a USB3MTA + 10 bps** USB3MTA + 10 bps** Notional Dollars $ (2,685,887) (3,895,657) (3,832,047) Swap Counterparty Reference Obligation Bank of America †Merrill Lynch ML Nickel Bank of America †Merrill Lynch ML Aluminum GA6 Bank of America †Merrill Lynch ML eXtra Copper GA6 Notional Dollars 612,600 3,907,193 3,911,311 Swap Counterparty Reference Obligation Bank of America †Merrill Lynch MLCS Silver Jâ€F3 Notional Dollars $ (462,236) Floating Rate/Fixed Amount Paid by Fund USB3MTA** USB3MTA** USB3MTA** Termination Date 6/30/2016 6/30/2016 6/30/2016 Total Appreciation Floating Rate/Fixed Amount Paid by Fund n/a USB3MTA + 10 bps** USB3MTA + 10 bps** Floating Rate/Fixed Amount Paid by Fund USB3MTA** (a) Termination Date 11/30/2015 9/19/2016 11/30/2015 6/30/2016 11/10/2015 6/30/2016 6/30/2016 Unrealized Appreciation $ 209,260 956,253 1,147,065 1,073,182 8,100 4,785 33,504 $ 3,432,149 Unrealized Appreciation $ 3,218 30,705 262,512 $ 296,435 $ 3,728,584 Termination Date Unrealized Depreciation 12/24/2015 $ (9,375) 6/30/2016 (270,815) 6/30/2016 (28,306) $ (308,496) Termination Date Unrealized Depreciation 06/30/2016 $ (33,292) $ (33,292) Total Depreciation $ (341,788) The Fund receives payments based on any positive return of the Reference Obligation less the rate paid by the Fund. The Fund makes payments on any negative return of such Reference Obligations plus the rate paid by the fund * CRB - Commodity Research Bureau ** United States Auction Results 3 Month Treasury Bill High Discount See Notes to Financial Statements. 26 | October 31, 2015 . ALPS | CoreCommodity Management CompleteCommodities® Strategy Fund Consolidated Statement of Assets and Liabilities October 31, 2015 ASSETS Investments, at value Cash Foreign currency, at value (Cost $80,812) Unrealized appreciation on total return swap contracts Receivable for investments sold Receivable for shares sold Cash collateral pledged for written options (Note 3) Deposit with broker for futures contracts (Note 3) Cash collateral pledged for total return swap contracts (Note 3) Deposit with broker for futures and options Dividends and interest receivable Prepaid expenses and other assets Total Assets $ 392,482,047 111,046 80,559 3,728,584 1,972,578 340,749 298,349 137,486 159,198 4,466,289 933,754 32,290 404,742,929 $ 2,468,252 3,058 31,852 592,660 341,788 264,451 57,974 29,825 22,526 121,096 3,933,482 400,809,447 LIABILITIES Written options, at value (premiums received $1,142,049) Payable for variation margin on futures contracts Payable due to broker for total return swap contracts Payable for shares redeemed Unrealized depreciation on total return swap contracts Investment advisory fees payable Administration and transfer agency fees payable Distribution and services fees payable Professional fees payable Accrued expenses and other liabilities Total Liabilities NET ASSETS NET ASSETS CONSIST OF Paidâ€in capital Accumulated net investment loss Accumulated net realized loss on investments, written options, futures contracts, total return swap contracts and foreign currency transactions Net unrealized depreciation on investments, written options, futures contracts, total return swap contracts and translation of assets and liabilities denominated in foreign currencies $ 460,840,912 (1,662,022) (27,755,417) (30,614,026) $ 400,809,447 NET ASSETS INVESTMENTS, AT COST $ 424,919,876 PRICING OF SHARES Class A: Net Asset Value, offering and redemption price per share Net Assets Shares of beneficial interest outstanding (unlimited number of shares, no par value common stock authorized) Maximum offering price per share ((NAV/0.9450), based on maximum sales charge of 5.50% of the offering price) Class C: (a) Net Asset Value, offering and redemption price per share Net Assets Shares of beneficial interest outstanding (unlimited number of shares, no par value common stock authorized) Class I: Net Asset Value, offering and redemption price per share Net Assets Shares of beneficial interest outstanding (unlimited number of shares, no par value common stock authorized) $ $ $ $ $ (a) 6.98 8,334,922 1,193,810 7.15 30,085,290 4,205,925 7.57 $ 7.15 $ 362,389,235 50,715,990 Redemption price per share may be reduced for any applicable contingent deferred sales charge. For a description of a possible sales charge, please see the Fund's Prospectus. See Notes to Financial Statements. 27 | October 31, 2015 . ALPS | CoreCommodity Management CompleteCommodities® Strategy Fund Consolidated Statement of Operations For the Year Ended October 31, 2015 INVESTMENT INCOME Dividends Foreign taxes withheld on dividends Interest and other income, net of premium amortization and accretion of discount Total Investment Income $ 3,735,923 (230,971) (1,799,534) 1,705,418 EXPENSES Investment advisory fees Investment advisory fees †subsidiary Administrative fees Transfer agency fees Distribution and service fees Class A Class C Professional fees Networking fees Class I Reports to shareholders and printing fees State registration fees SEC registration fees Insurance fees Custody fees Trustees' fees and expenses Miscellaneous expenses Total Expenses Less fees waived/reimbursed by investment advisor (Note 8) Waiver of investment advisory fees †subsidiary Class A Class C Class I Net Expenses Net Investment Loss Net realized loss on investments Net realized gain on written options Net realized loss on futures contracts Net realized loss on total return swap contracts Net realized gain on foreign currency transactions Net change in unrealized depreciation on investments Net change in unrealized depreciation on written options Net change in unrealized appreciation on futures contracts Net change in unrealized appreciation on total return swap contracts Net change in unrealized depreciation on translation of assets and liabilities denominated in foreign currencies See Notes to Financial Statements. 28 | October 31, 2015 140,662 94,219 73,093 389,977 78,413 58,580 8,859 5,618 60,439 16,991 26,107 5,791,071 3,575,556 668,490 496,960 97,107 NET REALIZED AND UNREALIZED LOSS ON INVESTMENTS NET DECREASE IN NET ASSETS RESULTING FROM OPERATIONS (668,490) (6,800) (1,838) (86,129) 5,027,814 (3,322,396) (23,188,518) 1,666,342 (2,057,904) (88,888,724) 1,478 (16,223,361) (1,573,724) 926,594 9,468,760 (43) (119,869,100) $ (123,191,496) . ALPS | CoreCommodity Management CompleteCommodities® Strategy Fund Consolidated Statements of Changes in Net Assets For the Year Ended October 31, 2015 For the Fiscal Period Ended October 31, 2014(a) For the Year Ended April 30, 2014 OPERATIONS Net investment loss $ (3,322,396) $ (225,381) $ (1,332,666) Net realized loss on investments, written options, futures contracts, total return swap contracts and foreign currency transactions (112,467,326) (21,185,447) (4,722,374) Net change in unrealized appreciation/(depreciation) on investments, written options, futures contracts, total return swap contracts and translation of assets and liabilities denominated in foreign currencies (7,401,774) (36,830,011) 20,918,827 Net Increase/(Decrease) in Net Assets Resulting from Operations (123,191,496) (58,240,840) 14,863,787 DISTRIBUTIONS Dividends to shareholders from net investment income Class I Net Decrease in Net Assets from Distributions (1,912,471) (1,912,471) – – – – BENEFICIAL INTEREST TRANSACTIONS (NOTE 6) Shares sold Class A Class C Class I Dividends reinvested Class I Shares redeemed, net of redemption fees Class A Class C Class I Net Increase in Net Assets Derived from Beneficial Interest Transactions Net increase/(decrease) in net assets NET ASSETS Beginning of year End of year * *Including accumulated net investment income/(loss) of: (a) 18,414,093 4,099,809 316,791,938 1,791,360 (17,894,431) (5,305,252) (238,107,077) 79,790,440 (45,313,527) 446,122,974 $ 400,809,447 $ (1,662,022) 21,322,142 3,307,759 225,598,695 – (86,135,268) (3,037,985) (49,542,035) 111,513,308 53,272,468 392,850,506 $ 446,122,974 $ 1,837,073 Effective May 1, 2014, the Board approved changing the fiscal year-end of the Funds from April 30 to October 31. See Notes to Financial Statements. 29 | October 31, 2015 78,069,155 5,689,512 234,370,555 – (73,729,663) (11,437,221) (165,799,406) 67,162,932 82,026,719 310,823,787 $ 392,850,506 $ 1,681,334 . ALPS | CoreCommodity Management CompleteCommodities® Strategy Fund – Class A Consolidated Financial Highlights Selected data for a share of beneficial interest outstanding throughout the periods indicated: For the Year Ended October 31, 2015 $9.56 For the Year Ended April 30, 2014 $10.40 For the Year Ended April 30, 2013(b) $11.18 For the Year Ended April 30, 2012 $14.28 For the Period June 29, 2010 (Inception) to April 30, 2011 $10.00 (0.09) (2.32) (2.41) – – – – 0.00(e) (1.31) (1.31) – – – – (0.06) 0.53 0.47 – – – – (0.03) (0.69) (0.72) – – (0.06) (0.06) 0.04 (2.29) (2.25) (0.83) (0.02) – (0.85) 0.12 4.87 4.99 (0.71) – – (0.71) 0.00(e) (2.41) $7.15 0.00(e) (1.31) $9.56 0.00(e) 0.47 $10.87 0.00(e) (0.78) $10.40 0.00(e) (3.10) $11.18 0.00(e) 4.28 $14.28 (25.21)% (12.05)% 4.52% (6.44)% (15.77)% 51.41% $30,085 (c) Net asset value, beginning of period For the Fiscal Period Ended October 31, 2014(a) $10.87 $39,971 $112,562 $104,234 $85,805 $37,060 1.50% INCOME/(LOSS) FROM INVESTMENT OPERATIONS: Net investment income/(loss)(d) Net realized and unrealized gain/(loss) Total from investment operations DISTRIBUTIONS: From net investment income From net realized gains Tax return of capital Total distributions REDEMPTION FEES ADDED TO PAIDâ€IN CAPITAL (NOTE 6) Net increase/(decrease) in net asset value Net asset value, end of year TOTAL RETURN(f) RATIOS/SUPPLEMENTAL DATA: Net assets, end of year (000s) Ratio of expenses to average net assets excluding fee waivers and reimbursements Ratio of expenses to average net assets including fee waivers and reimbursements Ratio of net investment income/(loss) to average net assets Portfolio turnover rate(i) 1.47% 1.50% 1.45% 1.46% (g) 1.45% (g) 1.45% (1.12)% 52% (g) 0.09% 12% (0.60)% 28% (a) (h) 2.59% (g) 1.40% 1.64% 1.45% 1.45% (0.30)% 117% 0.36% 264% 1.08%(g) 59% (g) Effective May 1, 2014, the Board approved changing the fiscal year-end of the Funds from April 30 to October 31. Prior to April 30, 2013 the ALPS | CoreCommodity Management CompleteCommodities® Strategy Fund was known as the Jefferies Asset Management Commodity Strategy Allocation Fund. (c) Per share amounts and ratios to average net assets include income and expenses of the CoreCommodity Management Cayman Commodity Fund Ltd. (wholly-owned subsidiary). (d) Calculated using the average shares method. (e) Less than $0.005 per share. (f) Total returns are for the period indicated and have not been annualized. Total returns would have been lower had certain expenses not been waived during the period. Returns shown do not reflect the deduction of taxes that a shareholder would pay on Fund distributions or the redemption of Fund shares.
Returns shown exclude any applicable sales charges. (g) Annualized. (h) According to the Fund's shareholder services plan with respect to the Fund's Class A shares, any amount of such payment not paid during the Fund's fiscal year for such service activities shall be reimbursed to the Fund as soon as practical after the end of the fiscal year. Fees were reimbursed to the Fund during the year ended April 30, 2013, for the prior fiscal year in the amount of 0.05% of average net assets of Class A shares. (i) Portfolio turnover rate for periods less than one full year have not been annualized. See Notes to Financial Statements. (b) 30 | October 31, 2015 . ALPS | CoreCommodity Management CompleteCommodities® Strategy Fund – Class C Consolidated Financial Highlights Selected data for a share of beneficial interest outstanding throughout the periods indicated: For the Year Ended October 31, 2015 $9.39 For the Year Ended April 30, 2014 $10.31 For the Year Ended April 30, 2013(b) $11.15 For the Year Ended April 30, 2012 $14.19 For the Period June 29, 2010 (Inception) to April 30, 2011 $10.00 (0.14) (2.27) (2.41) – – – – (0.04) (1.28) (1.32) – – – – (0.12) 0.52 0.40 – – – – (0.10) (0.69) (0.79) – – (0.05) (0.05) (0.05) (2.26) (2.31) (0.71) (0.02) – (0.73) 0.08 4.87 4.95 (0.76) – – (0.76) 0.00(e) (2.41) $6.98 0.00(e) (1.32) $9.39 0.00(e) 0.40 $10.71 0.00(e) (0.84) $10.31 0.00(e) (3.04) $11.15 0.00(e) 4.19 $14.19 (25.67)% (12.32)% 3.88% (7.10)% (16.26)% 50.90% $8,335 (c) Net asset value, beginning of period For the Fiscal Period Ended October 31, 2014(a) $10.71 $12,534 $13,996 $19,444 $18,095 $7,352 INCOME/(LOSS) FROM INVESTMENT OPERATIONS: Net investment income/(loss)(d) Net realized and unrealized gain/(loss) Total from investment operations DISTRIBUTIONS: From net investment income From net realized gains Tax return of capital Total distributions REDEMPTION FEES ADDED TO PAIDâ€IN CAPITAL (NOTE 6) Net increase/(decrease) in net asset value Net asset value, end of year TOTAL RETURN(f) RATIOS/SUPPLEMENTAL DATA: Net assets, end of year (000s) Ratio of expenses to average net assets excluding fee waivers and reimbursements Ratio of expenses to average net assets including fee waivers and reimbursements Ratio of net investment income/(loss) to average net assets Portfolio turnover rate(h) 2.07% (a) (b) (c) (d) (f) (e) (g) (h) 2.10% 2.14% 2.24% 4.00% (g) 2.05% 2.07% (g) 2.05% (g) 2.05% 2.05% 2.05% 2.05% (1.16)% 28% (0.92)% 117% (0.42)% 264% 0.72%(g) 59% (1.74)% 52% (g) (0.82)% 12% (g) Effective May 1, 2014, the Board approved changing the fiscal year-end of the Funds from April 30 to October 31. Prior to April 30, 2013 the ALPS | CoreCommodity Management CompleteCommodities® Strategy Fund was known as the Jefferies Asset Management Commodity Strategy Allocation Fund. Per share amounts and ratios to average net assets include income and expenses of the CoreCommodity Management Cayman Commodity Fund Ltd. (wholly-owned subsidiary). Calculated using the average shares method. Less than $0.005 per share. Total returns are for the period indicated and have not been annualized. Total returns would have been lower had certain expenses not been waived during the period. Returns shown do not reflect the deduction of taxes that a shareholder would pay on Fund distributions or the redemption of Fund shares.
Returns shown exclude any applicable sales charges. Annualized. Portfolio turnover rate for periods less than one full year have not been annualized. See Notes to Financial Statements. 31 | October 31, 2015 . ALPS | CoreCommodity Management CompleteCommodities® Strategy Fund – Class I Consolidated Financial Highlights Selected data for a share of beneficial interest outstanding throughout the periods indicated: For the Year Ended October 31, 2015 $9.57 For the Year Ended April 30, 2014 $10.37 For the Year Ended April 30, 2013(b) $11.12 For the Year Ended April 30, 2012 $14.25 For the Period June 29, 2010 (Inception) to April 30, 2011 $10.00 (0.06) (2.31) (2.37) (0.05) – – (0.05) (0.01) (1.29) (1.30) – – – – (0.03) 0.53 0.50 – – – – (0.00)(e) (0.69) (0.69) – – (0.06) (0.06) 0.10 (2.32) (2.22) (0.89) (0.02) – (0.91) 0.13 4.89 5.02 (0.77) – – (0.77) 0.00(e) (2.42) $7.15 0.00(e) (1.30) $9.57 0.00(e) 0.50 $10.87 0.00(e) (0.75) $10.37 0.00(e) (3.13) $11.12 0.00(e) 4.25 $14.25 (24.88)% (11.96)% 4.82% (6.16)% (15.53)% 51.74% $362,389 $393,618 $266,293 $187,146 $83,497 $73,630 1.17% 1.16% (g) 1.16% 1.17% 1.33% 2.04% (g) 1.15% (c) Net asset value, beginning of period For the Fiscal Period Ended October 31, 2014(a) $10.87 1.15% (g) 1.15% 1.15% 1.15% 1.15% (0.26)% 28% (0.02)% 117% 0.82% 264% 1.19%(g) 59% INCOME/(LOSS) FROM INVESTMENT OPERATIONS: Net investment income/(loss)(d) Net realized and unrealized gain/(loss) Total from investment operations DISTRIBUTIONS: From net investment income From net realized gains Tax return of capital Total distributions REDEMPTION FEES ADDED TO PAIDâ€IN CAPITAL (NOTE 6) Net increase/(decrease) in net asset value Net asset value, end of year TOTAL RETURN(f) RATIOS/SUPPLEMENTAL DATA: Net assets, end of year (000s) Ratio of expenses to average net assets excluding fee waivers and reimbursements Ratio of expenses to average net assets including fee waivers and reimbursements Ratio of net investment income/(loss) to average net assets Portfolio turnover rate(h) (a) (b) (c) (d) (f) (e) (g) (h) (0.73)% 52% (g) (0.12)% 12% (g) Effective May 1, 2014, the Board approved changing the fiscal year-end of the Funds from April 30 to October 31. Prior to April 30, 2013 the ALPS | CoreCommodity Management CompleteCommodities® Strategy Fund was known as the Jefferies Asset Management Commodity Strategy Allocation Fund. Per share amounts and ratios to average net assets include income and expenses of the CoreCommodity Management Cayman Commodity Fund Ltd. (wholly-owned subsidiary). Calculated using the average shares method. Less than $0.005 per share. Total returns are for the period indicated and have not been annualized. Total returns would have been lower had certain expenses not been waived during the period. Returns shown do not reflect the deduction of taxes that a shareholder would pay on Fund distributions or the redemption of Fund shares. Annualized. Portfolio turnover rate for periods less than one full year have not been annualized. See Notes to Financial Statements. 32 | October 31, 2015 .
ALPS | Kotak India Growth Fund Management Commentary October 31, 2015 (Unaudited) Performance ALPS | Kotak India Growth Fund (the “Fund”) was launched on February 14, 2011. During the 12â€month period ended October 31, 2015 (hereinafter also referred to as “the period”), the Fund’s Class A Shares, INDAX, delivered a total return of â€0.65% at Net Asset Value, Class C, INFCX, delivered â€2.29% with CDSC, and Class I, INDIX, delivered â€0.23%. The Fund outperformed the benchmark CNX 500 Index (“CNX 500”) which returned â€4.00% during the period (without taking into account sales charges for Class A Shares). Some key global events led to higher volatility in the emerging markets during the year. A key macroeconomic event for the year was around worries of a possible sovereign default from Greece and in the dire event, a possible “Grexit” – or exit from the European Union in order to be able to devalue and dig itself out of the piles of debt. Global markets turned extremely volatile on concerns emanating from the Greek crisis. After months of brinkmanship between Greece and the troika, Greece went in for a referendum on July 5, and eventually agreeing to enact the reforms package which comprised of sweeping austerity measures as demanded by lenders. However, the capping of the European Central Bank’s (the “ECB”) Emergency Liquidity Assistance (ELA) led to liquidity shock and thus, capital controls in Greece. The period also saw worries on the Chinese economy as the stock market saw a precipitous correction from its peak of June 12th and has entered the bear market territory. The People’s Bank of China (the “PBOC”) cut both base lending and base deposit rates multiple times during the first half of 2015 and injected liquidity via rate/RRR (Reserve Requirement Ratio) cuts by as many as 3 times. The deposit rate ceiling was also widened from a previous base of 130% to now 150%. The volatility in Chinese stock market has raised concerns around (a) an investment bubble in China with the investment share of Gross Domestic Product (“GDP”) already being higher than it ever was in Japan and Korea, (b) a real estate bubble with the real estate (directly and indirectly) being around 23% of GDP as per Moody’s, and (c) very high indebtedness with China’s private sector debt to GDP now at 196% (40% higher than the trend rate). Direct fallout of the slowdown in Chinese economic growth has been a collapse in global commodities which have entered a bear market. The US Federal Reserve incrementally moved closer through the year to policy rate normalization as the labor market continued to improve and the US economic recovery stabilized. The ECB, BOE (Bank of England) and BOJ (Bank of Japan), on the other hand continued on their dovish stance – reaffirming their preparedness to persist with monetary easing to support flagging growth and near†deflation in their economies. In India, during the year NIFTY, CNXMCAP, and CNX500 Index returned â€9.01%, 4.96%, and â€4.00% respectively. On the currency side, the Indian Rupee (INR) depreciated moderately by ~6.0% to 65.26/USD on 30 Oct 2015 from 61.36/USD on 31 Oct 2014. The INR, however, did relatively better than other commodityâ€linked currencies as well as currencies of economies with strong trade linkages to China – Brazilian Real depreciated ~36%, Russian Ruble down ~33%, South African Rand down ~20% and Australian Dollar down ~19% and Singapore Dollar down ~8.3%. The period saw net foreign institutional investor (FII) outflows to the tune of USD 300 million (mn) from the Indian equity market, while the domestic institutional investors (DIIs) poured in close to USD 8.0 billion (bn) to buy Indian equities. Some key highlights of the investment environment during the period are as follows: ï‚· Macro: India clearly emerged in a situation whereby macro parameters have improved and are on a strong footing on the back of the improvement in the Current Account Deficit (aided by lower oil, gold and commodity prices), higher forex reserves and steady inflation. ï‚· Oil: Brent oil declined from USD 90/barrel (bbl) to USD 50.2/bbl on 30 Oct 2015. We estimate that every USD 1 fall in oil price leads to a saving of close to USD 1 bn on the trade deficit, leading to a cumulative savings of about USD 40bn ~1.8% GDP. This has led to a significant contraction of India’s current account deficit. During the year India removed subsidies on the principal fuel †diesel, and also reduced subsidies on cooking gas leading to significant benefit on the fiscal deficit side. Oil decline is a key macro variable which is benefiting India on multiple fronts – namely current account deficit, fiscal deficit, inflation and currency. ï‚· Corporate earnings: On the corporate earnings front, the picture has been quite different and the performance has been mixed and patchy. The sectors that beat estimates were materials and consumer discretionary. Trends in the information technology (IT) sector were mixed with large cap IT services companies exhibiting resilience in terms of revenue growth whereas mid cap IT services companies have been plagued by client specific issues which have hampered growth. Public sector banks continued to report muted core operating performance trends and there are few signs of improvement in asset quality. ï‚· Banking Reforms: The Indian government announced the PSB (Public Sector Bank) revamp planâ€named “Indradhanush” (or rainbow). The government announced a seven point agenda which includes: (1) Appointments of top management, (2) setting up of the Bank Board Bureau, (3) Capitalization of the banks, (4) Deâ€stressing banks and improving NPA disclosures, (5) Empowerment, (6) framework of accountability, and (7) Governance reforms. ï‚· Monetary policy: The Reserve Bank of India (the “RBI”) cut key policy rates during the period by 125 basis points (“bps”) including a 50bps cut in September 2015. The Repo Rate now stands at 6.75% and the Reverse Repo rate at 5.75%. We feel the overall tone of the RBI has also turned mildly dovish in recent months and monetary policy will be likely stay accommodative to the extent possible given that inflation is under control (with stable food prices despite poor monsoons), global commodity prices are likely to remain weak. Domestic demand is needed to substitute weakening global demand so as to ensure pick up in the investment cycle. In fiscal year (FY) 17, given that RBI expects inflation to fall to around 4.8% †5% 33 | October 31, 2015 . ALPS | Kotak India Growth Fund Management Commentary October 31, 2015 (Unaudited) ï‚· ï‚· ï‚· ï‚· range and keeping real rate at ~1.5%, there is room for RBI to cut rates by another 25â€50bps. Inflation: India’s Wholesale Price Inflation (WPI) continued to be in a secular decline all through the year, being (â€) 4.54% in Sep 2015. The deceleration in the headline inflation was largely driven by a contraction in energy (petrol and diesel) and manufactured goods (chemicals and base metals). Core inflation, however, picked up to 4.41% in Sep 2015 after being in a declining trajectory for many months prior to that. Index of Industrial Production (IIP): In terms of economic activity, IIP growth has picked up in recent months – accelerating to 6.4% in Aug 2015, with the underlying momentum remaining healthy. Sectorâ€wise, mining, manufacturing and electricity have printed good recovery growth numbers in recent months. Within manufacturing, there are encouraging signs of some domestic recovery in components such as fabricated metal products and electrical machinery showing signs of strength. U.S. Federal Reserve (Fed): In its September policy review meeting the Fed maintained its 0â€0.25% target range for the federal funds rate, expressing its concerns over recent developments in global economy as it may “restrain economic activity somewhat” and risk pushing inflation down in the near term. The Fed did acknowledge the improvement in economic conditions, particularly the diminishing labor market slack, and expects inflation to rise gradually to 2% target due to the transitory effects of the fall in energy and imported inflation. The European Central Bank (ECB) in its policy meeting signaled that it stands ready to deploy another stimulus program which could include more bond purchases and additional cuts to the already negative deposit rate as the region remains stuck in ultraâ€low inflation and the recovery was tepid. ECB’s Draghi blamed the slowdown in emerging markets, including China, for the renewed weakness in Eurozone. Portfolio Composition We believe the portfolio continues to be positioned in a way as to benefit from a revival in the economy and improving macroeconomic tailwinds from the four broad investment themes in India – consumption lead by favourable demographics, financial services, infrastructure and outsourcing. The Fund mandate is flexible to invest across the spectrum of market capitalizations in order to take advantage of any opportunistic mispricing arising from market conditions, valuation differential, earnings growth or liquidity flows. As of 31st Oct 2015, Banking & Finance remains the largest sector (26.91% wt.), followed by Information Technology (12.98%) and Auto & Auto Ancillary (10.61%). The top 5 holdings in the portfolio are Infosys Ltd, HDFC Bank, TCS, ICICI Bank and ITC Ltd. Large active deviations in the portfolio are in Cement & Cement Products (+6.1% deviation from benchmark), Auto & Auto Ancillary (+1.2% deviation), Oil & Gas (â€3.1% deviation) and Utilities (â€2.4% deviation). In terms st of market capitalization focus, as of 31 Oct, the Fund is invested 69.3% in large caps, 26.93% in midcaps and 2.39% in smallâ€caps. Thematically, Consumption (at ~34% of portfolio) and Financials (at ~26% of portfolio) constitute the most bullish themes, while Infrastructure (at ~11.2% of exposure) is the smallest thematic bet in the portfolio as of the period end. During the period, some of the names within our favored sectors where we initiated new positions and continue to hold on are Akzo India, Bayer Crop Sciences, Colgate Palmolive, Gulf Oil, Just Dial, Gateway Distriparks, Finolex Cables, TVS Motors and Solar Industries. Some of the stocks where we booked profit and exited completely include Bata India, Bajaj Auto, Emami, Hindustan Zinc, Bharti Airtel, KSK Energy and Tata Chemical. Outlook After a volatile last few months, global investor sentiment has stabilized on the back of a delay in Fed's rate hike and policy announcement by China, especially the rate cut. The monetary stimulus in China is assuaging some concerns over the outlook of Chinese economy. The ECB under Mr. Mario Draghi is expected to evaluate the need for further easing in the month of December. The Fed is expected to ascertain the need for first rate hike in almost a decade in their scheduled December meeting. Currently, the expectation of a rate hike is 50:50. Domestic corporate earnings have been below expectations for the Jul†Sep quarter so far. While the season started on a decent note, overall we see revenue weakness leading to disappointing earnings and also the banking sector continues to see asset quality challenges. Significant part of the weakness can be attributed to weak rural economy which is seeing stress on the back of weak monsoons. However, margins continued to expand on the back of continued fall in commodity prices. While the earnings have been disappointing, we are seeing some encouraging data points which suggest some turnaround in the current quarter. We have seen very robust grown in passenger car sales and recently even two wheeler sales have picked up. Domestic airline passenger traffic has been robust for many months running now. Even cement dispatches have shown some uptick in recent months. Coal production and offâ€take both have seen strong growth and suggests an improving energy demand. Some of the uptick could be seasonal and festive demand and follow up in the next 2â€3 months will only tell whether this is a trend change or just festive demand. NIFTY is presently trading at 15.3x Mar 2017 earnings (source: Kotak Securities) and markets need earnings support to make the next move up. We feel that Octâ€Dec quarter could well be the first quarter of better earnings. In the near term, risk appetite will likely turn volatile on account of the midâ€December Fed decision on the liftâ€off. Nitin Jain – Portfolio Manager Important Notice Investments in India are subject to a number of risks including, but not limited to, risk of losing some or all of the capital invested, high 34 | October 31, 2015 . ALPS | Kotak India Growth Fund Management Commentary October 31, 2015 (Unaudited) market volatility, variable market liquidity, geopolitical risks (including political instability), exchange rate fluctuations (between the currency of the fund’s share class and the Indian Rupee), changes in tax regime and restrictions on investment activities of foreign investors. Basis Point – a unit that is equal to 1/100th of 1% and is used to denote the change in a financial instrument. NIFTY – NIFTY is an Index computed from performance of top stocks from different sectors listed on NSE (National stock exchange). NIFTY consists of 50 companies from 24 different sectors. NIFTY stands for National Stock Exchange’s fifty. The companies which form index of NIFTY may vary from time to time based on many factors considered by NSE. CNXMCAP – The CNX Midcap Index comprises 100 tradable stocks listed on the National Stock Exchange (NSE). The primary objective of the CNX Midcap Index is to capture the movement of the midcap segment of the market.
CNX Midcap Index is computed using free float market capitalization method, wherein the level of the index reflects the total free float market value of all the stocks in the index relative to particular base market capitalization value. The views of the author and information discussed in this commentary are as of the date of publication, are subject to change, and may not reflect the writer's current views. The views expressed are those of the author only, and represent an assessment of market conditions at a specific point in time, are opinions only and should not be relied upon as investment advice regarding a particular investment or markets in general. Such information does not constitute a recommendation to buy or sell specific securities or investment vehicles.
It should not be assumed that any investment will be profitable or will equal the performance of the fund or any securities or any sectors mentioned in this letter. The subject matter contained in this letter has been derived from several sources believed to be reliable and accurate at the time of compilation. Neither ALPS Advisors, Inc., Kotak Mahindra (UK) Limited, nor the Fund accepts any liability for losses either direct or consequential caused by the use of this information. Diversification cannot guarantee gain or prevent losses. 35 | October 31, 2015 . ALPS | Kotak India Growth Fund Performance Update October 31, 2015 (Unaudited) Performance of $10,000 Initial Investment (as of October 31, 2015) Comparison of change in value of a $10,000 investment (includes maximum sales charges of 5.50%) $16k $14k ALPS | Kotak India Growth Fund Class A (NAV) - $13,113 ALPS | Kotak India Growth Fund Class A (MOP) - $12,394 CNX 500 Index - $11,578 $12k $10k MSCI India Index Total Return - $10,459 $8k 10/31/15 10/31/14 10/31/13 10/31/12 10/31/11 2/14/11^ $6k The chart above represents historical performance of a hypothetical investment of $10,000 in the Fund since inception. Past performance does not guarantee future results. This chart does not reflect the deduction of taxes that a shareholder would pay on Fund distributions or the redemption of Fund shares. Average Annual Total Returns (as of October 31, 2015) Class A (NAV) Class A (MOP) Class C (NAV) Class C (CDSC) Class I CNX 500 Index1 MSCI India Index Total Return2 6 Month â€1.10% â€6.54% â€1.37% â€2.36% â€0.93% â€1.72% 1 Year â€0.65% â€6.13% â€1.34% â€2.29% â€0.23% â€4.00% 3 Year 13.72% 11.59% 12.99% 12.99% 14.16% 9.30% Since Inception^ 5.92% 4.66% 5.24% 5.24% 6.31% 3.16% Total Expense Ratio What You Pay* 5.02% 2.00% 5.57% 2.60% 4.49% 1.60% â€2.28% â€8.03% 6.19% 0.96% Performance data quoted represents past performance. Past performance does not guarantee future results.
Investment return and principal value of an investment will fluctuate so that an investor’s shares, when sold or redeemed, may be worth more or less than the original cost. Current performance data may be higher or lower than actual data quoted. For the most current month-end performance data, please call 1-866-759-5679. Maximum Offering Price (MOP) for Class A shares includes the Fund’s maximum sales charge of 5.50%. Performance shown at NAV does not include these sales charges and would have been lower had it been taken into account.
If you invest $1 million or more, either as a lump sum or through the Fund’s accumulation or letter of intent programs, you can purchase Class A shares without an initial sales charge (load). A Contingent Deferred Sales Charge (“CDSC”) of 1.00% may apply to Class C shares redeemed within the first 12 months after a purchase, and on Class A shares redeemed within the first 18 months after a purchase in excess of $1 million. The Fund imposes a 2.00% redemption fee on shares held for less than 30 days. Performance less than 1 year is cumulative. 36 | October 31, 2015 .
ALPS | Kotak India Growth Fund Performance Update October 31, 2015 (Unaudited) Derivatives generally are more sensitive to changes in economic or market conditions than other types of investments; this could result in losses that significantly exceed the funds original investment. 1 CNX 500 Index - India's first broad based benchmark of the Indian capital market. The CNX 500 companies are disaggregated into 72 industry indices. Industry weightages in the index reflect the industry weightages in the market. The index is not actively managed and does not reflect any deduction for fees, expenses or taxes.
An investor may not invest directly in an index. 2 MSCI India Index - designed to measure the performance of the large and mid cap segments of the Indian market. With 64 constituents, the index covers approximately 85% of the Indian equity universe. ^ Fund inception date of February 14, 2011. * What You Pay reflects the Advisor's and Sub-Advisor’s decision to contractually limit expenses through February 29, 2016. Please see the prospectus for additional information. The table does not reflect the deduction of taxes that a shareholder would pay on Fund distributions or the redemption of Fund shares. This Fund is not suitable for all investors and is subject to investment risks, including possible loss of the principal amount invested. There is no guarantee that the Fund will continue to hold any one particular security or stay invested in any one particular company.
The composition of the Fund's top holdings is subject to change. Performance figures are historical and reflect the change in share price, reinvested distributions, changes in net asset value, sales charges and capital gains distributions, if any. Not FDIC Insured – No Bank Guarantee – May Lose Value Investing in India involves risk and considerations not present when investing in more established securities markets. The Fund may be more susceptible to economic, market, political and local risks of the region than a fund that is more geographically diversified.
Investments in India are subject to a number of risks including, but not limited to, risk of losing some or all of the capital invested, high market volatility, variable market liquidity, geopolitical risks (including political instability), exchange rate fluctuations (between the currency of the fund’s share class and the Indian Rupee), changes in tax regime and restrictions on investment activities of foreign investors. Industry Sector Allocation (as a % of Net Assets) Top Ten Holdings (as a % of Net Assets) † Infosys, Ltd. HDFC Bank, Ltd. Tata Consultancy Services, Ltd. ICICI Bank, Ltd. ITC, Ltd. Axis Bank, Ltd. Sun Pharmaceutical Industries, Ltd. Maruti Suzuki India, Ltd. Housing Development Finance Corp., Ltd. Larsen & Toubro, Ltd. Top Ten Holdings Financials - 27.89% Materials - 13.08% 5.57% 4.90% 4.23% 3.60% 3.58% 3.46% 3.18% 3.15% 2.90% 2.71% 37.28% Information Technology - 13.05% Industrials - 12.09% Consumer Discretionary - 10.92% Consumer Staples - 9.49% Health Care - 7.26% Energy - 3.77% Telecommunication Services - 1.51% Cash, Cash Equivalents & Other Net Assets - 0.94% † Holdings are subject to change, and may not reflect the current or future position of the portfolio. Table presents approximate values only. 37 | October 31, 2015 . ALPS | Kotak India Growth Fund Consolidated Statement of Investments October 31, 2015 Value (Note 2) Shares COMMON STOCKS (99.06%) Consumer Discretionary (10.92%) Auto Components (2.39%) Motherson Sumi Systems, Ltd. MRF, Ltd. 45,520 $ 171,221 363 220,859 392,080 Automobiles (6.87%) Maruti Suzuki India, Ltd. Tata Motors, Ltd., Class A(a) TVS Motor Co., Ltd. Media (1.66%) (a) Dish TV India, Ltd. 7,600 517,244 96,894 384,496 56,000 227,205 1,128,945 273,342 12,500 22,360 326,177 115,011 587,743 TOTAL CONSUMER STAPLES 136,114 1,559,720 Energy (3.77%) Oil, Gas & Consumable Fuels (3.77%) Hindustan Petroleum Corp., Ltd. 24,500 287,645 Reliance Industries, Ltd. 22,959 332,515 620,160 78,364 101,240 48,033 140,000 29,135 110,900 567,926 246,653 804,826 591,989 405,641 400,776 191,453 148,110 477,278 4,584,484 174,916 226,738 268,113 523,527 1,193,294 1,193,294 Health Care (7.26%) Pharmaceuticals (7.26%) Cadila Healthcare, Ltd. 27,445 Cipla, Ltd. 21,500 Lupin, Ltd. 9,100 Sun Pharmaceutical Industries, Ltd. 38,500 TOTAL HEALTH CARE Industrials (12.09%) Construction & Engineering (3.60%) Larsen & Toubro, Ltd. 20,700 446,129 MBL Infrastructures, Ltd. 45,800 146,498 592,627 620,160 23,750 TOTAL FINANCIALS Financials (27.89%) Commercial Banks (19.91%) Axis Bank, Ltd. Bank of Baroda HDFC Bank, Ltd. ICICI Bank, Ltd. IndusInd Bank, Ltd. State Bank of India Thrifts & Mortgage Finance (2.90%) Housing Development Finance Corp., Ltd. 24,900 TOTAL ENERGY Real Estate Management & Development (0.90%) The Phoenix Mills, Ltd. 29,000 179,038 29,000 Personal Products (1.98%) Colgateâ€Palmolive India, Ltd. Tobacco (3.58%) ITC, Ltd. 132,476 1,794,367 330,648 Insurance (1.16%) MAX India, Ltd. 6,700 Household Products (0.83%) Jyothy Laboratories, Ltd. Food Products (2.01%) Britannia Industries, Ltd. Consumer Staples (9.49%) Beverages (1.09%) United Breweries, Ltd. 254,453 3,272,264 Diversified Financial Services (0.81%) Multi Commodity Exchange of India, Ltd. 9,750 22,002 $ Consumer Finance (2.21%) Shriram Transport Finance Co., Ltd. 12,815 184,459 SKS Microfinance, Ltd.(a) 27,200 178,444 362,903 TOTAL CONSUMER DISCRETIONARY Commercial Banks (continued) Yes Bank, Ltd. 169,000 Value (Note 2) Shares Electrical Equipment (4.03%) Amara Raja Batteries, Ltd. Crompton Greaves, Ltd. Finolex Cables, Ltd. Vâ€Guard Industries, Ltd. 231,765 189,173 168,850 72,074 661,862 117,393 163,750 281,143 Machinery (1.71%) Thermax, Ltd. Timken India, Ltd. 38 | October 31, 2015 9,021 18,200 16,800 71,200 44,000 5,257 . ALPS | Kotak India Growth Fund Consolidated Statement of Investments October 31, 2015 Shares Miscellaneous Manufacturing (0.62%) Solar Industries India, Ltd. 2,000 $ Value (Note 2) TOTAL INDUSTRIALS IT Services (12.90%) HCL Technologies, Ltd. Infosys, Ltd. Tata Consultancy Services, Ltd. Tech Mahindra, Ltd. 2,400 20,300 52,750 18,248 29,000 23,663 270,377 915,670 695,709 239,117 2,120,873 2,144,536 TOTAL INFORMATION TECHNOLOGY Materials (13.08%) Auto Parts&Equipment (0.48%) Gulf Oil Lubricants India, Ltd. 10,628 10,100 1,810 44,470 18,000 Chemicals (3.83%) Akzo Nobel India, Ltd. Bayer CropScience, Ltd. Berger Paints India, Ltd. Supreme Industries, Ltd. 79,546 208,430 96,410 150,793 173,097 628,730 228,812 162,464 282,442 77,071 287,696 182,344 220,781 1,441,610 Telecommunication Services (1.51%) Diversified Telecommunication (0.91%) Tata Communications, Ltd. 22,970 Construction Materials (8.77%) ACC, Ltd. 10,860 Century Textiles & Industries, Ltd. 19,200 JK Cement, Ltd. 27,000 Orient Cement, Ltd. 30,974 The Ramco Cements, Ltd. 52,119 Shree Cement, Ltd.(a) 970 Ultratech Cement, Ltd. 5,000 TOTAL COMMON STOCKS (Cost $15,810,828) 7-Day Yield 16,283,580 Value (Note 2) Shares Money Market Fund (0.29%) Dreyfus Cash Advantage Fund, Institutional Class 0.091% 46,969 TOTAL SHORT TERM INVESTMENTS (Cost $46,969) TOTAL INVESTMENTS (99.35%) (Cost $15,857,797) Other Assets In Excess Of Liabilities (0.65%) NET ASSETS (100.00%) 46,969 46,969 $ 16,330,549 107,171 $ 16,437,720 (a) Non-Income Producing Security. Common Abbreviations: Ltd. - Limited. For Fund compliance purposes, the Fund's industry classifications refer to any one or more of the industry sub-classifications used by one or more widely recognized market indexes or ratings group indexes, and/or as defined by Fund management. This definition may not apply for purposes of this report, which may combine industry sub-classifications for reporting ease. Industries are shown as a percent of net assets. See Notes to Financial Statements. 249,119 TOTAL MATERIALS 150,580 98,539 TOTAL TELECOMMUNICATION SERVICES 2,149,886 8,050 $ SHORT TERM INVESTMENTS (0.29%) Information Technology (13.05%) Computers (0.15%) Persistent Systems, Ltd. 1,988,014 Internet (0.60%) Just Dial, Ltd. 102,859 Transportation Infrastructure (2.13%) Gateway Distriparks, Ltd. 49,500 252,476 IL&FS Transportation Networks, Ltd. 67,843 97,047 349,523 Value (Note 2) Shares 39 | October 31, 2015 .
ALPS | Kotak India Growth Fund Consolidated Statement of Assets and Liabilities October 31, 2015 ASSETS Investments, at value Cash Foreign currency, at value (Cost $187,631) Receivable for investments sold Receivable for shares sold Dividends receivable Receivable due from advisor Prepaid expenses and other assets Total Assets $ 16,330,549 5,955 186,532 2,320 28,395 3,331 213 14,026 16,571,321 $ 23,680 572 26,331 8,602 2,000 44,522 27,894 133,601 16,437,720 $ $ 14,075,259 (70,722) 1,961,507 471,676 16,437,720 LIABILITIES Payable for shares redeemed Investment advisory fees payable Administration and transfer agency fees payable Distribution and services fees payable Trustees' fees and expenses payable Professional fees payable Accrued expenses and other liabilities Total Liabilities NET ASSETS NET ASSETS CONSIST OF Paidâ€in capital Accumulated net investment loss Accumulated net realized gain on investments and foreign currency transactions Net unrealized appreciation on investments and translation of assets and liabilities denominated in foreign currencies NET ASSETS INVESTMENTS, AT COST PRICING OF SHARES $ 15,857,797 Class A: Net Asset Value, offering and redemption price per share Net Assets Shares of beneficial interest outstanding (unlimited number of shares, no par value common stock authorized) Maximum offering price per share ((NAV/0.9450), based on maximum sales charge of 5.50% of the offering price) Class C: Net Asset Value, offering and redemption price per share(a) Net Assets Shares of beneficial interest outstanding (unlimited number of shares, no par value common stock authorized) Class I: Net Asset Value, offering and redemption price per share Net Assets Shares of beneficial interest outstanding (unlimited number of shares, no par value common stock authorized) $ $ $ (a) 12.57 5,905,574 469,992 13.30 $ $ 12.23 1,965,461 160,731 $ $ 12.76 8,566,685 671,528 Redemption price per share may be reduced for any applicable contingent deferred sales charge. For a description of a possible sales charge, please see the Fund's Prospectus. See Notes to Financial Statements. 40 | October 31, 2015 . ALPS | Kotak India Growth Fund Consolidated Statement of Operations For the Year Ended October 31, 2015 INVESTMENT INCOME Dividends Total Investment Income $ 169,827 169,827 EXPENSES Investment advisory fees Administrative fees Transfer agency fees Distribution and service fees Class A Class C Professional fees Reports to shareholders and printing fees State registration fees SEC registration fees Insurance fees Custody fees Trustees' fees and expenses Miscellaneous expenses Total Expenses Less fees waived/reimbursed by investment advisor (Note 8) Class A Class C Class I Net Expenses Net Investment Loss Net realized gain on investments Net realized loss on foreign currency transactions Net change in unrealized depreciation on investments Net change in unrealized depreciation on translation of assets and liabilities denominated in foreign currencies See Notes to Financial Statements. 41 | October 31, 2015 25,217 19,425 33,027 5,692 43,361 310 2,562 83,376 4,428 20,951 612,557 NET REALIZED AND UNREALIZED LOSS ON INVESTMENTS NET DECREASE IN NET ASSETS RESULTING FROM OPERATIONS 228,768 143,097 2,343 $ (97,837) (29,402) (150,329) 334,989 (165,162) 2,490,210 (57,755) (2,668,780) (822) (237,147) (402,309) . ALPS | Kotak India Growth Fund Consolidated Statements of Changes in Net Assets For the Year Ended October 31, 2015 For the Fiscal Period Ended October 31, 2014(a) For the Year Ended April 30, 2014 OPERATIONS Net investment income/(loss) Net realized gain/(loss) on investments and foreign currency transactions Net change in unrealized appreciation/(depreciation) on investments and translation of assets and liabilities denominated in foreign currencies Net Increase/(Decrease) in Net Assets Resulting from Operations $ (165,162) $ 2,432,455 (2,669,602) (402,309) 15,803 $ 804,742 2,192,910 3,013,455 (19,677) (99,022) 449,502 330,803 DISTRIBUTIONS Dividends to shareholders from net investment income Class A Class C Class I Dividends to shareholders from net realized gains Class A Class C Class I Net Decrease in Net Assets from Distributions (79,832) (13,011) (89,195) (174,473) (45,295) (266,183) (667,989) – – – – – – – – – (9,601) – – – (9,601) BENEFICIAL INTEREST TRANSACTIONS (NOTE 6) Shares sold Class A Class C Class I Dividends reinvested Class A Class C Class I Shares redeemed, net of redemption fees Class A Class C Class I Net Increase/(Decrease) in Net Assets Derived from Beneficial Interest Transactions Net increase in net assets NET ASSETS Beginning of year End of year * *Including accumulated net investment income/(loss) of: (a) $ $ 3,689,065 1,063,029 4,898,712 225,433 55,484 348,314 (3,230,457) (551,771) (4,977,421) 1,520,388 450,090 15,987,630 16,437,720 (70,722) $ $ 2,894,035 545,448 6,266,320 – – – (3,972,790) (211,571) (577,957) 4,943,485 7,956,940 8,030,690 15,987,630 63,475 Effective May 1, 2014, the Board approved changing the fiscal year-end of the Funds from April 30 to October 31. See Notes to Financial Statements. 42 | October 31, 2015 $ $ 2,368,871 348,482 325,772 – – 8,639 (2,090,462) (419,549) (586,477) (44,724) 276,478 7,754,212 8,030,690 (37,846) . ALPS | Kotak India Growth Fund – Class A Consolidated Financial Highlights Selected data for a share of beneficial interest outstanding throughout the periods indicated: For the Year Ended October 31, 2015 $13.20 For the Year Ended April 30, 2014 $9.47 For the Year Ended April 30, 2013 $8.22 For the Year Ended April 30, 2012 $10.35 For the Period February 14, 2011 (Inception) to April 30, 2011 $10.00 (0.14) 0.06 (0.08) (0.17) (0.38) (0.55) 0.01 3.20 3.21 – – – (0.02) 0.54 0.52 – – – (0.07) 1.32 1.25 – – – (0.08) (2.04) (2.12) – (0.01) (0.01) (0.04) 0.39 0.35 – – – 0.00(d) (0.63) $12.57 0.00(d) 3.21 $13.20 0.00(d) 0.52 $9.99 0.00(d) 1.25 $9.47 0.00(d) (2.13) $8.22 0.00(d) 0.35 $10.35 (0.65)% 32.13% 5.49% 15.21% (20.44)% 3.40% $5,906 (b) Net asset value, beginning of period For the Fiscal Period Ended October 31, 2014(a) $9.99 $5,536 $5,211 $4,681 $2,404 $935 INCOME/(LOSS) FROM INVESTMENT OPERATIONS: Net investment income/(loss)(c) Net realized and unrealized gain/(loss) Total from investment operations DISTRIBUTIONS: From net investment income From net realized gains Total distributions REDEMPTION FEES ADDED TO PAIDâ€IN CAPITAL (NOTE 6) Net increase/(decrease) in net asset value Net asset value, end of year TOTAL RETURN(e) RATIOS/SUPPLEMENTAL DATA: Net assets, end of year (000s) Ratio of expenses to average net assets excluding fee waivers and reimbursements Ratio of expenses to average net assets including fee waivers and reimbursements Ratio of net investment income/(loss) to average net assets (h) Portfolio turnover rate (a) (c) (d) (e) (b) (f) (g) (h) 7.99% 6.51% 12.42% 69.96% (f) 2.00%(f) 1.96%(g) 4.92% (f) 3.51% 1.90%(f)(g) 1.88%(g) 2.00% 2.00% (1.03)% 58% (f) 0.19% 28% (0.27)% 65% (0.82)% 93% (0.89)% 114% (1.82)%(f) 9% Effective May 1, 2014, the Board approved changing the fiscal year-end of the Funds from April 30 to October 31. Per share amounts and ratios to average net assets include income and expenses of the Kotak Mauritius Portfolio (wholly-owned subsidiary). Calculated using the average shares method. Less than $0.005 per share. Total returns are for the period indicated and have not been annualized. Total returns would have been lower had certain expenses not been waived during the period. Returns shown do not reflect the deduction of taxes that a shareholder would pay on Fund distributions or the redemption of Fund shares. Returns shown exclude any applicable sales charges. Annualized. According to the Fund's shareholder services plan with respect to the Fund's Class A shares, any amount of such payment not paid during the Fund's fiscal year for such service activities shall be reimbursed to the Fund as soon as practical after the end of the fiscal year.
Fees were reimbursed to the Fund during the period ended October 31, 2015, for the prior fiscal year in the amount of 0.04% of average net assets of Class A shares, during the period ended October 31, 2014, for the prior fiscal year in the amount of 0.10% (annualized) of average net assets of Class A shares and during the year ended April 30, 2014, for the prior fiscal year in the amount of 0.12% of average net assets of Class A shares. Portfolio turnover rate for periods less than one full year have not been annualized. See Notes to Financial Statements. 43 | October 31, 2015 . ALPS | Kotak India Growth Fund – Class C Consolidated Financial Highlights Selected data for a share of beneficial interest outstanding throughout the periods indicated: For the Year Ended October 31, 2015 $12.88 For the Fiscal Period Ended October 31, 2014(a) $9.77 For the Year Ended April 30, 2014 $9.34 For the Year Ended April 30, 2013 $8.15 For the Year Ended April 30, 2012 $10.32 For the Period February 14, 2011 (Inception) to April 30, 2011 $10.00 (0.21) 0.05 (0.16) (0.11) (0.38) (0.49) (0.03) 3.14 3.11 – – – (0.09) 0.52 0.43 – – – (0.12) 1.31 1.19 – – – (0.13) (2.03) (2.16) – (0.01) (0.01) (0.05) 0.37 0.32 – – – – (0.65) $12.23 0.00(d) 3.11 $12.88 – 0.43 $9.77 – 1.19 $9.34 0.00(d) (2.17) $8.15 – 0.32 $10.32 (1.34)% 31.83% 4.60% 14.60% (20.97)% 3.20% Net assets, end of year (000s) $1,965 Ratio of expenses to average net assets excluding fee waivers and reimbursements 4.11% Ratio of expenses to average net assets including fee waivers and reimbursements 2.60% Ratio of net investment loss to average net (1.67)% assets (g) 58% Portfolio turnover rate $1,497 $875 $924 $435 $466 5.57% (f) 7.26% 8.54% 13.39% 69.64% (f) 2.60%(f) 2.60% 2.60% 2.60% 2.60%(f) (1.00)% 65% (1.42)% 93% (1.49)% 114% (b) Net asset value, beginning of period INCOME/(LOSS) FROM INVESTMENT OPERATIONS: Net investment loss(c) Net realized and unrealized gain/(loss) Total from investment operations DISTRIBUTIONS: From net investment income From net realized gains Total distributions REDEMPTION FEES ADDED TO PAIDâ€IN CAPITAL (NOTE 6) Net increase/(decrease) in net asset value Net asset value, end of year TOTAL RETURN(e) RATIOS/SUPPLEMENTAL DATA: (a) (c) (d) (e) (b) (f) (g) (f) (0.50)% 28% (2.42)%(f) 9% Effective May 1, 2014, the Board approved changing the fiscal year-end of the Funds from April 30 to October 31. Per share amounts and ratios to average net assets include income and expenses of the Kotak Mauritius Portfolio (wholly-owned subsidiary). Calculated using the average shares method. Less than $0.005 per share. Total returns are for the period indicated and have not been annualized. Total returns would have been lower had certain expenses not been waived during the period. Returns shown do not reflect the deduction of taxes that a shareholder would pay on Fund distributions or the redemption of Fund shares. Returns shown exclude any applicable sales charges. Annualized. Portfolio turnover rate for periods less than one full year have not been annualized. See Notes to Financial Statements. 44 | October 31, 2015 .
ALPS | Kotak India Growth Fund – Class I Consolidated Financial Highlights Selected data for a share of beneficial interest outstanding throughout the periods indicated: For the Year Ended October 31, 2015 $13.29 For the Year Ended April 30, 2014 $9.55 For the Year Ended April 30, 2013 $8.25 For the Year Ended April 30, 2012 $10.34 For the Period February 14, 2011 (Inception) to April 30, 2011 $10.00 (0.09) 0.06 (0.03) (0.13) (0.38) (0.51) 0.03 3.22 3.25 – – – 0.00(d) 0.54 0.54 (0.05) – (0.05) (0.04) 1.34 1.30 – – – (0.04) (2.04) (2.08) – (0.01) (0.01) (0.03) 0.37 0.34 – – – 0.01 (0.53) $12.76 0.00(d) 3.25 $13.29 – 0.49 $10.04 0.00(d) 1.30 $9.55 0.00(d) (2.09) $8.25 – 0.34 $10.34 (0.23)% 32.37% 5.70% 15.76% (20.23)% 3.50% $8,567 (b) Net asset value, beginning of period For the Fiscal Period Ended October 31, 2014(a) $10.04 $8,955 $1,945 $2,149 $1,609 $568 INCOME/(LOSS) FROM INVESTMENT OPERATIONS: Net investment income/(loss)(c) Net realized and unrealized gain/(loss) Total from investment operations DISTRIBUTIONS: From net investment income From net realized gains Total distributions REDEMPTION FEES ADDED TO PAIDâ€IN CAPITAL (NOTE 6) Net increase/(decrease) in net asset value Net asset value, end of year TOTAL RETURN(e) RATIOS/SUPPLEMENTAL DATA: Net assets, end of year (000s) Ratio of expenses to average net assets excluding fee waivers and reimbursements Ratio of expenses to average net assets including fee waivers and reimbursements Ratio of net investment income/(loss) to average net assets (h) Portfolio turnover rate (c) (d) (e) (b) (f) (h) (g) 4.49% (f) 6.28% 7.65% 12.05% 96.67% (f) 1.60% (a) 3.10% 1.60%(f) 1.60% 1.60% 1.60% 1.60%(f) (0.67)% 58% (f) 0.50% 28% 0.00%(g) 65% (0.42)% 93% (0.49)% 114% (1.36)%(f) 9% Effective May 1, 2014, the Board approved changing the fiscal year-end of the Funds from April 30 to October 31. Per share amounts and ratios to average net assets include income and expenses of the Kotak Mauritius Portfolio (wholly-owned subsidiary). Calculated using the average shares method. Less than $0.005 per share. Total returns are for the period indicated and have not been annualized. Total returns would have been lower had certain expenses not been waived during the period. Returns shown do not reflect the deduction of taxes that a shareholder would pay on Fund distributions or the redemption of Fund shares. Annualized. Less than 0.005% Portfolio turnover rate for periods less than one full year have not been annualized. See Notes to Financial Statements. 45 | October 31, 2015 . ALPS | Red Rocks Listed Private Equity Fund Management Commentary October 31, 2015 (Unaudited) Overview Conundrum: Volatility, slow growth and asset inflation After a brief hint of volatility in December 2014 and January 2015, the next several months turned out to be quite benign – that is until the end of June, at which time, something changed. And then in August things really changed; China’s central bank deâ€valued the yuan on August 11th taking the world by surprise. From that point through midâ€October it was not much fun to be a portfolio manager. Emerging markets, commodities and currencies were volatile. In some cases extremely volatile. For those of us hoping for a quiet end to summer and a relaxed entry into fall, the last few months have been anything but quiet and relaxed. A slowing China, with some wellâ€known prognosticators suggesting much worse is yet to come, has demanded everyone’s attention of late. China’s sheer size and the fact that it has exhibited strong growth over the last couple of decades, has economists and financial types wondering what to make of all this. Add to that the neverâ€ending guessing game around when the U.S. Federal Reserve (the “Fed”) will raise interest rates. Not in September. Or October. By how much? For how long? And what will that mean for the broader capital markets? All very good questions. And yet no one really knows the answers. All of this uncertainty has led to volatility in the capital markets. Yes, it’s hard to forecast certain input costs. Energy and most commodities garner much of the attention; they’re significantly cheaper than they were a year ago. And exportâ€based businesses are having a difficult time managing their foreign currency exposure. Yet this uncertainty has not filtered down to a change in core consumer demand in the developed world. Hmmm. Turning to private equity, while the aforementioned developments are quite relevant, not much has changed here. Businesses continue to operate. Industries continue to evolve. Management teams continue to strive for growth, albeit muted, both top line (revenue) and bottom line (cash flow). From what we can see, private equity backed businesses have adapted to the slow growth environment and are doing just fine. Private equity fund managers like that. A broader challenge for private equity is that buyout valuations continue to be high by historical measures, and they are trending higher. It is the same phenomena we’ve witnessed for the past few years. That’s good if you’re a seller of a private equity backed business, but not so good if you’re a buyer. And if you are sitting on large amounts of undrawn commitments/cash (“dry powder”), which most private equity firms are, a lower valuation environment is preferred; better to buy low and hopefully sell high. However, that probably doesn’t change anytime soon. Why? Because the world continues to be awash in liquidity; the Fed and other Central Banks being the drivers behind this condition since the Great Financial Crisis began in 2008. And yet liquidity does not equal growth, much to the chagrin of policy makers and governments. It can equal asset inflation or inflation in the form of business valuations; private equity being keenly aware of this. It is a real conundrum. Portfolio Review For the twelve months ended October 31, 2015, the ALPS Red Rocks Listed Private Equity Fund's ("Fund") Class A shares, LPEFX, returned 6.01%, (Class A delivered a net return of 0.25% at MOP), compared with 2.33% and 7.97% for the MSCI World Index and the Red Rocks Global Listed Private Equity Index, respectively . During the period, we added APAX Global Alpha LTD, Ares Management LP, Fifth Street Senior Floating, Graphite Enterprise Trust PLC and Ratos AB (two securities that we have previously owned) and Sofina, while we exited AP Alternative Assets LP, Better Capital PCC LTD, Capital Southwest Corp, Intermediate Capital Group PLC and Melrose Industries PLC. At the end of the period the Fund had 38 holdings in what we believe are some of the top performing private equity funds/firms from around the globe. We believe that finding, researching and analyzing these investments is what Red Rocks Capital does best; it is partly intellectual curiosity and partly competitive. It’s why we come to work excited. And with that, our objective remains a constant: to assemble the best global portfolio of listed private equity companies for the benefit of our shareholders. Net contributors to performance for the period included: • Aurelius SE & CO KGaA (previously known as Aurelius AG) • 3I Group PLC • The Blackstone Group LP Net detractors to performance for the period included: • Hosken Consolidate Investments LTD • Grand Parade Investments LTD • The Carlyle Group Outlook What does all of the volatility, slow growth and asset inflation add up to? How will it affect the private equity business model: raising capital in a fund/vehicle, investing that capital in promising companies, improving the value of those companies, exiting/realizing value, and returning capital to investors? I’m not exactly sure. One thing I am fairly certain of is that when the Fed and the other Central Banks begin to close the liquidity spigot (raise interest rates), it will have a profound effect on the capital markets, private equity included. It will be a big reâ€set for the cost of capital, return expectations and risk. There will be natural winners and losers. Based on prior experience, I believe that private equity will be on the winning side of the ledger once things settle down. Until then, as the saying goes, stay tuned. As always, we appreciate your continued support and interest in Red Rocks and the Listed Private Equity strategy. Adam Goldman Coâ€Portfolio Manager 46 | October 31, 2015 . ALPS | Red Rocks Listed Private Equity Fund Management Commentary October 31, 2015 (Unaudited) The views of the author and information discussed in this commentary are as of the date of publication, are subject to change, and may not reflect the writer's current views. The views expressed are those of the author only, and represent an assessment of market conditions at a specific point in time, are opinions only and should not be relied upon as investment advice regarding a particular investment or markets in general. Such information does not constitute a recommendation to buy or sell specific securities or investment vehicles. It should not be assumed that any investment will be profitable or will equal the performance of the fund(s) or any securities or any sectors mentioned in this letter.
The subject matter contained in this letter has been derived from several sources believed to be reliable and accurate at the time of compilation. Neither ALPS Advisors, Inc., Red Rocks Capital LLC, nor the Fund accepts any liability for losses either direct or consequential caused by the use of this information. Diversification cannot guarantee gain or prevent losses. 47 | October 31, 2015 . ALPS | Red Rocks Listed Private Equity Fund Performance Update October 31, 2015 (Unaudited) Performance of $10,000 Initial Investment (as of October 31, 2015) Comparison of change in value of a $10,000 investment (includes maximum sales charges of 5.50%) $14k MSCI World Index - $13,285 $12k Red Rocks Global Listed Private Equity Index - $10,959 $10k ALPS|Red Rocks Listed Private Equity Fund Class A (NAV) - $10,141 $8k ALPS|Red Rocks Listed Private Equity Fund Class A (MOP) - $9,585 $6k $4k 10/31/15 10/31/14 10/31/13 10/31/12 10/31/11 10/31/10 10/31/09 10/31/08 12/31/07^ $2k The chart above represents historical performance of a hypothetical investment of $10,000 in the Fund since inception. Past performance does not guarantee future results. This chart does not reflect the deduction of taxes that a shareholder would pay on Fund distributions or the redemption of Fund shares. Average Annual Total Returns (as of October 31, 2015) 6 Month 5 Year Since Inception^ Total Expense Ratio What You Pay* 6.01% 15.33% 10.19% 0.18% 0.25% 13.17% 8.96% â€0.54% 2.35% 2.35% â€4.51% 5.14% 14.57% 9.39% â€0.61% â€5.47% 4.14% 14.57% 9.39% â€0.61% 2.85% 2.85% â€4.06% 6.30% 15.74% 10.50% 0.47% 1.95% 1.95% â€4.16% MSCI World Index Red Rocks Global Listed Private 2 Equity Index 3 Year â€9.37% 1 1 Year â€4.10% Class A (NAV) Class A (MOP) Class C (NAV) Class C (CDSC) Class I Class R 5.87% 15.47% 10.15% â€0.05% 2.33% 2.33% â€2.89% 2.33% 12.24% 9.76% 3.69% â€4.70% 7.97% 15.07% 10.11% 1.18% Performance data quoted represents past performance. Past performance does not guarantee future results.
Investment return and principal value of an investment will fluctuate so that an investor’s shares, when sold or redeemed, may be worth more or less than the original cost. Current performance data may be higher or lower than actual data quoted. For the most current month-end performance data, please call 1-866-759-5679. Maximum Offering Price (MOP) for Class A shares includes the Fund’s maximum sales charge of 5.50%. Performance shown at NAV does not include these sales charges and would have been lower had it been taken into account.
If you invest $1 million or more, either as a lump sum or through the Fund’s accumulation or letter of intent programs, you can purchase Class A shares without an initial sales charge (load). A Contingent Deferred Sales Charge (“CDSC”) of 1.00% may apply to Class C shares redeemed within the first 12 months after a purchase, and on Class A shares redeemed within the first 18 months after a purchase in excess of $1 million. The Fund imposes a 2.00% redemption fee on shares held for less than 90 days. Performance less than 1 year is cumulative. 48 | October 31, 2015 .
ALPS | Red Rocks Listed Private Equity Fund Performance Update October 31, 2015 (Unaudited) Performance shown for Class C shares prior to June 30, 2010 reflects the historical performance of the Fund’s Class A shares, calculated using the fees and expenses of Class C shares. 1 MSCI World Index: Morgan Stanley Capital International’s market capitalization weighted index is composed of companies representative of the market structure of 22 developed market countries in North America, Europe and the Asia/Pacific Region. The index is not actively managed and does not reflect any deduction for fees, expenses or taxes. An investor may not invest directly in an index. 2 The Red Rocks Global Listed Private Equity Index includes securities, ADRs and GDRs of 40 to 75 private equity companies, including business development companies, master limited partnerships and other vehicles whose principal business is to invest in, lend capital to or provide services to privately held companies. The Red Rocks Global Listed Private Equity Index is managed by the Fund’s Sub-Advisor.
An investor may not invest directly in an index. ^ Fund inception date of December 31, 2007 for Classes A, I, and R; Fund inception date 6/30/10 for Class C. * What You Pay reflects the Advisor's and Sub-Advisor’s decision to contractually limit expenses through February 28, 2017 and Acquired Fund Fees and Expenses of 0.70%. Please see the current prospectus for additional information. The table does not reflect the deduction of taxes that a shareholder would pay on Fund distributions or the redemption of Fund shares. This Fund is not suitable for all investors and is subject to investment risks, including possible loss of the principal amount invested. Listed Private Equity Companies are subject to various risks depending on their underlying investments, which could include, but are not limited to, additional liquidity risk, industry risk, non-U.S. security risk, currency risk, credit risk, managed portfolio risk and derivatives risk (derivatives risk is the risk that the value of the Listed Private Equity Companies’ derivative investments will fall because of pricing difficulties or lack of correlation with the underlying investment). There are inherent risks in investing in private equity companies, which encompass financial institutions or vehicles whose principal business is to invest in and lend capital to privately held companies.
Generally, little public information exists for private and thinly traded companies, and there is a risk that investors may not be able to make a fully informed investment decision. Listed Private Equity Companies may have relatively concentrated investment portfolios, consisting of a relatively small number of holdings. A consequence of this limited number of investments is that the aggregate returns realized may be adversely impacted by the poor performance of a small number of investments, or even a single investment, particularly if a company experiences the need to write down the value of an investment. Certain of the Fund’s investments may be exposed to liquidity risk due to low trading volume, lack of a market maker or legal restrictions limiting the ability of the Fund to sell particular securities at an advantageous price and/or time. As a result, these securities may be more difficult to value. Foreign investing involves special risks, such as currency fluctuations and political uncertainty.
The Fund invests in derivatives and is subject to the risk that the value of those derivative investments will fall because of pricing difficulties or lack of correlation with the underlying investment. There is no guarantee that the Fund will continue to hold any one particular security or stay invested in any one particular company. The composition of the Fund's top holdings is subject to change. Performance figures are historical and reflect the change in share price, reinvested distributions, changes in net asset value, sales charges and capital gains distributions, if any. Not FDIC Insured – No Bank Guarantee – May Lose Value 49 | October 31, 2015 .
ALPS | Red Rocks Listed Private Equity Fund Performance Update October 31, 2015 (Unaudited) Industry Sector Allocation (as a % of Net Assets) Top Ten Holdings (as a % of Net Assets) † HarbourVest Global Private Equity, Ltd. Aurelius AG Brookfield Asset Management, Inc., Class A The Blackstone Group LP 3i Group PLC Ackermans & van Haaren N.V. Onex Corp. Eurazeo SA SVG Capital PLC Schouw & Co. Top Ten Holdings † 6.31% 5.51% 4.95% 4.57% 4.56% 4.54% 4.17% 3.82% 3.76% 3.51% 45.70% Holdings are subject to change and my not reflect the current or future position of the portfolio. Table presents indicative values only. Financials - 67.99% Diversified - 14.55% Closed End Funds - 12.92% Industrials - 2.70% Cash, Cash Equivalents & Other Net Assets - 1.84% 50 | October 31, 2015 . ALPS | Red Rocks Listed Private Equity Fund Statement of Investments October 31, 2015 Value (Note 2) Shares CLOSEDâ€END FUNDS (12.92%) Apax Global Alpha, Ltd.(a) Graphite Enterprise Trust PLC HBM Healthcare Investments AG, Class A(a) HgCapital Trust PLC Oakley Capital Investments, (a) Ltd. Pantheon International Participations PLC, Ordinary Shares(a) Pantheon International Participations PLC, Redeemable Shares(a) 4,415,779 $ 677,006 8,202,884 6,402,937 139,507 1,043,999 13,041,071 17,220,907 3,990,546 8,858,639 217,971 4,569,933 357,700 6,768,814 65,065,185 TOTAL CLOSEDâ€END FUNDS (Cost $63,921,111) 65,065,185 COMMON STOCKS (85.24%) Diversified (14.55%) Holding Companiesâ€Diversified Operations (14.55%) Ackermans & van Haaren N.V. 150,099 22,860,313 Remgro, Ltd. 417,397 8,362,417 Schouw & Co. 337,708 17,676,224 Sofina SA 69,249 7,786,305 Wendel SA 138,185 16,585,908 73,271,167 TOTAL DIVERSIFIED 73,271,167 Financials (67.99%) Diversified Financial Services (11.93%) Apollo Global Management LLC, Class A 248,971 Ares Management LP 340,917 The Blackstone Group LP 696,330 The Carlyle Group LP 720,629 KKR & Co. LP 788,231 Shares Investment Companies (continued) Hosken Consolidated Investments, Ltd. 784,890 Investor AB, B Shares 433,882 IP Group PLC(a) 1,435,880 mutares AG 241,548 Onex Corp. 346,739 (a) 2,587,474 SVG Capital PLC $ 8,025,286 16,119,078 5,263,834 4,741,287 21,022,842 18,947,058 170,767,133 5,814,161 17,489,577 31,772,045 5,028,881 10,980,266 15,582,095 86,667,025 Private Equity (17.21%) (a) 361,447 Castle Private Equity, Ltd. Electra Private Equity PLC 305,797 HarbourVest Global Private (a) 2,433,266 Equity, Ltd. Ratos AB, B Shares 859,290 Riverstone Energy, Ltd.(a) 868,614 Standard Life European Private Equity Trust PLC, Ordinary Shares 4,859,486 Real Estate (4.95%) Brookfield Asset Management, Inc., Class A 713,024 24,934,449 342,480,172 Industrials (2.70%) Miscellaneous Manufacturers (2.70%) Danaher Corp. 145,799 13,604,505 TOTAL FINANCIALS 13,604,505 TOTAL INDUSTRIALS 429,355,844 4,548,700 5,519,446 23,020,670 13,504,587 13,518,162 60,111,565 Investment Companies (33.90%) 3i Group PLC 2,976,393 Altamir 777,365 Ares Capital Corp. 711,392 Aurelius AG 622,153 Eurazeo SA 273,077 Fifth Street Senior Floating Rate Corp. 428,100 Grand Parade Investments, Ltd. 8,990,517 Value (Note 2) 22,987,946 8,762,004 10,834,500 27,762,837 19,242,532 3,660,255 TOTAL COMMON STOCKS (Cost $389,864,360) 7-Day Yield Value (Note 2) Shares SHORT TERM INVESTMENTS (1.84%) Money Market Fund (1.84%) Morgan Stanley Institutional Liquidity Fund †Prime Portfolio 0.096% 9,262,230 3,397,674 TOTAL SHORT TERM INVESTMENTS (Cost $9,262,230) 51 | October 31, 2015 9,262,230 9,262,230 .
ALPS | Red Rocks Listed Private Equity Fund Statement of Investments October 31, 2015 Value (Note 2) TOTAL INVESTMENTS (100.00%) (Cost $463,047,701) $ 503,683,259 Liabilities In Excess Of Other Assets (0.00%)(b) (14,167) NET ASSETS (100.00%) $ 503,669,092 (a) (b) Non-Income Producing Security. Less than 0.005%. Common Abbreviations: AB - Aktiebolag is the Swedish equivalent of the term corporation. AG - Aktiengesellschaft is a German term that refers to a corporation that is limited by shares, i.e., owned by shareholders. LLC - Limited Liability Company. LP - Limited Partnership. Ltd. - Limited. N.V. - Naamloze Vennootschap is the Dutch term for a public limited liability corporation. PLC - Public Limited Company. SA - Generally designates corporations in various countries, mostly those employing the civil law. For Fund compliance purposes, the Fund's industry classifications refer to any one or more of the industry sub-classifications used by one or more widely recognized market indexes or ratings group indexes, and/or as defined by Fund management. This definition may not apply for purposes of this report, which may combine industry sub-classifications for reporting ease.
Industries are shown as a percent of net assets. See Notes to Financial Statements. 52 | October 31, 2015 . ALPS | Red Rocks Listed Private Equity Fund Statement of Assets and Liabilities October 31, 2015 ASSETS Investments, at value Foreign currency, at value (Cost $13,811) Receivable for investments sold Receivable for shares sold Dividends receivable Prepaid expenses and other assets Total Assets $ 503,683,259 13,811 491,242 450,191 713,039 29,452 505,380,994 $ 191,825 816,702 359,741 80,197 146,874 15,751 14,342 86,470 1,711,902 503,669,092 $ $ LIABILITIES Payable for investments purchased Payable for shares redeemed Investment advisory fees payable Administration and transfer agency fees payable Distribution and services fees payable Professional fees payable Custody fees payable Accrued expenses and other liabilities Total Liabilities NET ASSETS NET ASSETS CONSIST OF Paidâ€in capital Accumulated net investment loss Accumulated net realized gain on investments and foreign currency transactions Net unrealized appreciation on investments and translation of assets and liabilities denominated in foreign currencies NET ASSETS INVESTMENTS, AT COST PRICING OF SHARES $ 463,047,701 Class A: Net Asset Value, offering and redemption price per share Net Assets Shares of beneficial interest outstanding (unlimited number of shares, no par value common stock authorized) Maximum offering price per share ((NAV/0.9450), based on maximum sales charge of 5.50% of the offering price) Class C: (a) Net Asset Value, offering and redemption price per share Net Assets Shares of beneficial interest outstanding (unlimited number of shares, no par value common stock authorized) Class I: Net Asset Value, offering and redemption price per share Net Assets Shares of beneficial interest outstanding (unlimited number of shares, no par value common stock authorized) Class R: Net Asset Value, offering and redemption price per share Net Assets Shares of beneficial interest outstanding (unlimited number of shares, no par value common stock authorized) $ $ $ 6.76 193,560,508 28,650,579 7.15 $ 6.53 $ 19,299,831 2,953,420 $ 6.83 $ 287,740,949 42,118,570 (a) 448,817,078 (10,280,498) 24,527,341 40,605,171 503,669,092 $ $ 5.96 3,067,804 515,105 Redemption price per share may be reduced for any applicable contingent deferred sales charge. For a description of a possible sales charge, please see the Fund's Prospectus. See Notes to Financial Statements. 53 | October 31, 2015 . ALPS | Red Rocks Listed Private Equity Fund Statement of Operations For the Year Ended October 31, 2015 INVESTMENT INCOME Dividends Foreign taxes withheld on dividends Total Investment Income $ 11,783,440 (950,327) 10,833,113 EXPENSES Investment advisory fees Administrative fees Transfer agency fees Distribution and service fees Class A Class C Class R Professional fees Networking fees Class C Class I Class R Reports to shareholders and printing fees State registration fees Insurance fees Custody fees Trustees' fees and expenses Repayment of previously waived fees Class A Class I Miscellaneous expenses Total Expenses Net Investment Income Net realized gain on investments Net realized loss on foreign currency transactions Net realized gain distributions from other investment companies Net change in unrealized depreciation on investments Net change in unrealized depreciation on translation of assets and liabilities denominated in foreign currencies See Notes to Financial Statements. 54 | October 31, 2015 771,456 186,425 8,987 52,132 10,677 244,882 518 98,768 75,537 5,959 87,786 10,901 $ 58,222 14,669 23,082 6,572,621 4,260,492 36,491,629 (51,056) 6,673 (13,166,886) (16,464) 23,263,896 27,524,388 NET REALIZED AND UNREALIZED GAIN ON INVESTMENTS NET INCREASE IN NET ASSETS RESULTING FROM OPERATIONS 4,215,806 399,519 307,295 . ALPS | Red Rocks Listed Private Equity Fund Statements of Changes in Net Assets For the Year Ended October 31, 2015 For the Fiscal Period Ended October 31, 2014(a) For the Year Ended April 30, 2014 OPERATIONS Net investment income Net realized gain on investments and foreign currency transactions Net realized gain distributions from other investment companies Net change in unrealized appreciation/(depreciation) on investments and translation of assets and liabilities denominated in foreign currencies Net Increase/(Decrease) in Net Assets Resulting from Operations $ 4,260,492 $ 36,440,573 6,673 (13,183,350) 27,524,388 1,777,483 $ 2,203,871 9,109,785 30,962,396 – 7,133 (39,532,683) (28,638,282) 36,517,980 69,684,247 DISTRIBUTIONS Dividends to shareholders from net investment income Class A Class C Class I Class R Dividends to shareholders from net realized gains Class A Class C Class I Class R Net Decrease in Net Assets from Distributions (6,787,971) (546,212) (8,199,257) (38,970) (640,746) (55,244) (732,422) (3,531) (17,004,353) – – – – – – – – – (11,258,970) (444,823) (11,570,862) (25,293) – – – – (23,299,948) BENEFICIAL INTEREST TRANSACTIONS (NOTE 6) Shares sold Class A Class C Class I Class R Dividends reinvested Class A Class C Class I Class R Shares redeemed, net of redemption fees Class A Class C Class I Class R Net Increase in Net Assets Derived from Beneficial Interest Transactions Net increase in net assets NET ASSETS Beginning of year End of year * *Including accumulated net investment loss of: (a) 75,334,373 5,854,839 130,086,390 2,675,544 6,770,481 409,526 4,364,013 41,018 (97,968,261) (4,331,209) (101,036,008) (487,437) 21,713,269 32,233,304 471,435,788 $ 503,669,092 $ (10,280,498) 61,140,590 7,348,056 99,388,072 453,224 – – – – (50,641,540) (1,176,895) (36,901,005) (78,846) 79,531,656 50,893,374 420,542,414 $ 471,435,788 $ (13,757,302) Effective May 1, 2014, the Board approved changing the fiscal year-end of the Funds from April 30 to October 31. See Notes to Financial Statements. 55 | October 31, 2015 $ $ 104,537,580 7,052,467 93,622,391 330,734 10,565,914 357,600 4,362,094 23,238 (36,821,447) (554,548) (57,218,383) (52,283) 126,205,357 172,589,656 247,952,758 420,542,414 (21,142,940) . ALPS | Red Rocks Listed Private Equity Fund – Class A Financial Highlights Selected data for a share of beneficial interest outstanding throughout the periods indicated: For the Year Ended October 31, 2015 $6.61 For the Year Ended April 30, 2014 $6.05 For the Year Ended April 30, 2013 $4.67 For the Year Ended April 30, 2012 $6.44 For the Year Ended April 30, 2011 $5.17 0.05 0.34 0.39 (0.22) (0.02) (0.24) 0.02 (0.41) (0.39) – – – 0.03 1.37 1.40 (0.45) – (0.45) 0.08 1.39 1.47 (0.09) – (0.09) 0.07 (1.41) (1.34) (0.43) – (0.43) 0.04 1.61 1.65 (0.38) – (0.38) 0.00(c) 0.15 $6.76 0.00(c) (0.39) $6.61 0.00(c) 0.95 $7.00 0.00(c) 1.38 $6.05 0.00(c) (1.77) $4.67 0.00(c) 1.27 $6.44 6.01% Net asset value, beginning of period For the Fiscal Period Ended October 31, 2014(a) $7.00 (5.57)% 23.54% 31.75% (19.68)% 33.22% $203,996 $205,727 $105,488 $85,807 $124,874 1.59% (f) 1.64% 1.53% INCOME/(LOSS) FROM INVESTMENT OPERATIONS: Net investment income(b) Net realized and unrealized gain/(loss) Total from investment operations DISTRIBUTIONS: From net investment income From net realized gains Total distributions REDEMPTION FEES ADDED TO PAIDâ€IN CAPITAL (NOTE 6) Net increase/(decrease) in net asset value Net asset value, end of year TOTAL RETURN(d) RATIOS/SUPPLEMENTAL DATA: Net assets, end of year (000s) $193,561 Ratio of expenses to average net assets excluding fee waivers and (e) 1.47% reimbursements Ratio of expenses to average net assets including fee waivers and (e) 1.47%(g) reimbursements Ratio of net investment income to average (e) 0.72% net assets Portfolio turnover rate(i) 37% (a) (c) (d) (b) (e) (g) (f) (h) (i) 1.71% 1.70% 1.59%(f)(g) 1.64%(g) 1.51%(h) 1.50% 1.50% 0.71%(f) 11% 0.46% 40% 1.54% 32% 1.34% 72% 0.67% 43% Effective May 1, 2014, the Board approved changing the fiscal year-end of the Funds from April 30 to October 31. Calculated using the average shares method. Less than $0.005 per share. Total returns are for the period indicated and have not been annualized. Total returns would have been lower had certain expenses not been waived during the period. Returns shown do not reflect the deduction of taxes that a shareholder would pay on Fund distributions or the redemption of Fund shares. Returns shown exclude any applicable sales charges. The ratios exclude the impact of expenses of the underlying funds in which the Fund invests as represented in the Statement of Investments. Annualized. According to the Fund's shareholder services plan with respect to the Fund's Class A shares, any amount of such payment not paid during the Fund's fiscal year for such service activities shall be reimbursed to the Fund as soon as practical after the end of the fiscal year.
Fees were reimbursed to the Fund during the period ended October 31, 2015, for the prior fiscal year in the amount of 0.02% of average net assets of Class A shares, during the period ended October 31, 2014, for the prior fiscal year in the amount of 0.06% (annualized) of average net assets of Class A shares and during the year ended April 30, 2014, for the prior fiscal year in the amount of 0.01% of average net assets of Class A shares. Contractual expense limitation changed from 1.50% to 1.65% effective September 1, 2012. Portfolio turnover rate for periods less than one full year have not been annualized. See Notes to Financial Statements. 56 | October 31, 2015 . ALPS | Red Rocks Listed Private Equity Fund – Class C Financial Highlights Selected data for a share of beneficial interest outstanding throughout the periods indicated: For the Year Ended October 31, 2015 $6.43 For the Year Ended April 30, 2014 $5.92 For the Year Ended April 30, 2013 $4.59 For the Year Ended April 30, 2012 $6.37 For the Period July 2, 2010 (Inception) to April 30, 2011 $4.39 0.00(c) 0.32 0.32 (0.20) (0.02) (0.22) (0.00)(c) (0.40) (0.40) – – – (0.00)(c) 1.33 1.33 (0.42) – (0.42) 0.04 1.35 1.39 (0.06) – (0.06) 0.03 (1.39) (1.36) (0.42) – (0.42) (0.01) 2.36 2.35 (0.37) – (0.37) 0.00(c) 0.10 $6.53 0.00(c) (0.40) $6.43 0.00(c) 0.91 $6.83 0.00(c) 1.33 $5.92 0.00(c) (1.78) $4.59 0.00(c) 1.98 $6.37 5.14% (5.86)% 22.97% 30.55% (20.33)% 55.32% $19,300 Net asset value, beginning of period For the Fiscal Period Ended October 31, 2014(a) $6.83 $17,193 $12,200 $4,417 $2,838 $2,566 INCOME/(LOSS) FROM INVESTMENT OPERATIONS: Net investment income/(loss)(b) Net realized and unrealized gain/(loss) Total from investment operations DISTRIBUTIONS: From net investment income From net realized gains Total distributions REDEMPTION FEES ADDED TO PAIDâ€IN CAPITAL (NOTE 6) Net increase/(decrease) in net asset value Net asset value, end of year TOTAL RETURN(d) RATIOS/SUPPLEMENTAL DATA: Net assets, end of year (000s) Ratio of expenses to average net assets excluding fee waivers and reimbursements(e) Ratio of expenses to average net assets including fee waivers and reimbursements(e) Ratio of net investment income/(loss) to (e) average net assets (g) Portfolio turnover rate (c) (d) (b) (e) (g) (h) (f) 2.15% (f) 2.20% 2.25% 2.37% 2.31% (f) 2.12% (a) 2.12% 2.15%(f) 2.20% 2.25% 2.25% 2.25%(f) 0.06% 37% (0.13)%(f) 11% (0.04)% 40% 0.79% 32% 0.59% 72% (0.19)%(f) (h) 43% Effective May 1, 2014, the Board approved changing the fiscal year-end of the Funds from April 30 to October 31. Calculated using the average shares method. Less than $0.005 per share. Total returns are for the period indicated and have not been annualized. Total returns would have been lower had certain expenses not been waived during the period. Returns shown do not reflect the deduction of taxes that a shareholder would pay on Fund distributions or the redemption of Fund shares. Returns shown exclude any applicable sales charges. The ratios exclude the impact of expenses of the underlying funds in which the Fund invests as represented in the Statement of Investments. Annualized. Portfolio turnover rate for periods less than one full year have not been annualized. Portfolio turnover rate is calculated at the Fund Level and represents the year ended April 30, 2011. See Notes to Financial Statements. 57 | October 31, 2015 .
ALPS | Red Rocks Listed Private Equity Fund – Class I Financial Highlights Selected data for a share of beneficial interest outstanding throughout the periods indicated: For the Year Ended October 31, 2015 $6.67 For the Year Ended April 30, 2014 $6.08 For the Year Ended April 30, 2013 $4.69 For the Year Ended April 30, 2012 $6.47 For the Year Ended April 30, 2011 $5.19 0.07 0.34 0.41 (0.23) (0.02) (0.25) 0.03 (0.41) (0.38) – – – 0.06 1.37 1.43 (0.46) – (0.46) 0.12 1.36 1.48 (0.09) – (0.09) 0.08 (1.42) (1.34) (0.44) – (0.44) 0.05 1.62 1.67 (0.39) – (0.39) 0.00(c) 0.16 $6.83 0.00(c) (0.38) $6.67 0.00(c) 0.97 $7.05 0.00(c) 1.39 $6.08 0.00(c) (1.78) $4.69 0.00(c) 1.28 $6.47 6.30% Net asset value, beginning of period For the Fiscal Period Ended October 31, 2014(a) $7.05 (5.39)% 24.02% 31.99% (19.52)% 33.47% $249,375 $202,076 $137,856 $77,750 $66,854 1.25% (f) 1.25% 1.27% 1.41% 1.36% 1.25%(f) 1.25% 1.25% 1.25% 1.25% 0.85%(f) 11% 0.91% 40% 2.27% 32% 1.60% 72% 0.91% 43% INCOME/(LOSS) FROM INVESTMENT OPERATIONS: Net investment income(b) Net realized and unrealized gain/(loss) Total from investment operations DISTRIBUTIONS: From net investment income From net realized gains Total distributions REDEMPTION FEES ADDED TO PAIDâ€IN CAPITAL (NOTE 6) Net increase/(decrease) in net asset value Net asset value, end of year TOTAL RETURN(d) RATIOS/SUPPLEMENTAL DATA: (a) (c) (d) (b) (e) (g) (f) Net assets, end of year (000s) $287,741 Ratio of expenses to average net assets excluding fee waivers and reimbursements(e) 1.16% Ratio of expenses to average net assets including fee waivers and reimbursements(e) 1.16% Ratio of net investment income to average (e) 1.02% net assets (g) 37% Portfolio turnover rate Effective May 1, 2014, the Board approved changing the fiscal year-end of the Funds from April 30 to October 31. Calculated using the average shares method. Less than $0.005 per share. Total returns are for the period indicated and have not been annualized. Total returns would have been lower had certain expenses not been waived during the period. Returns shown do not reflect the deduction of taxes that a shareholder would pay on Fund distributions or the redemption of Fund shares. The ratios exclude the impact of expenses of the underlying funds in which the Fund invests as represented in the Statement of Investments. Annualized. Portfolio turnover rate for periods less than one full year have not been annualized. See Notes to Financial Statements. 58 | October 31, 2015 . ALPS | Red Rocks Listed Private Equity Fund – Class R Financial Highlights Selected data for a share of beneficial interest outstanding throughout the periods indicated: For the Year Ended October 31, 2015 $5.87 For the Year Ended April 30, 2014 $5.41 For the Year Ended April 30, 2013 $4.17 For the Year Ended April 30, 2012 $5.82 For the Year Ended April 30, 2011 $4.73 0.03 0.31 0.34 (0.23) (0.02) (0.25) 0.01 (0.36) (0.35) – – – 0.02 1.22 1.24 (0.44) – (0.44) 0.08 1.24 1.32 (0.08) – (0.08) 0.05 (1.27) (1.22) (0.43) – (0.43) 0.03 1.43 1.46 (0.37) – (0.37) 0.00(c) 0.09 $5.96 0.01 (0.34) $5.87 – 0.80 $6.21 – 1.24 $5.41 – (1.65) $4.17 – 1.09 $5.82 5.87% Net asset value, beginning of period For the Fiscal Period Ended October 31, 2014(a) $6.21 (5.48)% 23.50% 32.05% (19.93)% 32.47% $872 $540 $191 $46 $125 1.63% (f) 1.72% 1.85% 1.89% 1.87% 1.63%(f) 1.72% 1.75% 1.75% 1.75% 0.46%(f) 11% 0.36% 40% 1.80% 32% 1.10% 72% 0.66% 43% INCOME/(LOSS) FROM INVESTMENT OPERATIONS: Net investment income(b) Net realized and unrealized gain/(loss) Total from investment operations DISTRIBUTIONS: From net investment income From net realized gains Total distributions REDEMPTION FEES ADDED TO PAIDâ€IN CAPITAL (NOTE 6) Net increase/(decrease) in net asset value Net asset value, end of year TOTAL RETURN(d) RATIOS/SUPPLEMENTAL DATA: (a) (c) (d) (b) (e) (g) (f) Net assets, end of year (000s) $3,068 Ratio of expenses to average net assets excluding fee waivers and reimbursements(e) 1.60% Ratio of expenses to average net assets including fee waivers and reimbursements(e) 1.60% Ratio of net investment income to average (e) 0.52% net assets (g) 37% Portfolio turnover rate Effective May 1, 2014, the Board approved changing the fiscal year-end of the Funds from April 30 to October 31. Calculated using the average shares method. Less than $0.005 per share. Total returns are for the period indicated and have not been annualized. Total returns would have been lower had certain expenses not been waived during the period. Returns shown do not reflect the deduction of taxes that a shareholder would pay on Fund distributions or the redemption of Fund shares. The ratios exclude the impact of expenses of the underlying funds in which the Fund invests as represented in the Statement of Investments. Annualized. Portfolio turnover rate for periods less than one full year have not been annualized. See Notes to Financial Statements. 59 | October 31, 2015 . ALPS | Sterling ETF Tactical Rotation Fund Management Commentary October 31, 2015 (Unaudited) During the twelve month period ending October 31, 2015 the ALPS ETF Tactical Rotation Fund’s ("Fund") Class I Shares produced a negative return of â€3.30% compared to a 3.04% return for the S&P 500 and a negative â€0.92% return for the Morningstar Global Allocation Index. The Fund rotates between six asset classes using ETFs for exposure. The Fund attempts to avoid asset classes that are experiencing prolonged declining values by using momentum to both allocate and equally weight the top two asset classes on a monthly basis. The rulesâ€based approach includes commodities, U.S. and international equities, U.S. bonds, REITs and cash. At the end of October, the Fund was allocated approximately 50% to U.S. bonds and 50% to cash. Over the period, the Fund paid one dividend: $0.076 per share on December 29, 2014. Across the 12 month period, the Fund owned REITs for six months for an overall exposure of 25%, U.S. bonds for six months or 25% exposure, International equities for five months or 20.83% exposure, cash for five months or 20.84% exposure and U.S. bonds for two months for an overall exposure of 8.33%. The Fund did not allocate to commodities during this period as they were the worst performing asset class. The DB Commodity Index fell â€31.89% through the 12 months ending October 31, 2015. The Fund uses momentum to allocate 50% allocations to the top two asset classes. The theory behind the investment methodology is that, under normal market conditions, a couple of asset classes should be trending higher, while a couple of asset classes are trending lower. The process is designed to invest in the strongest two asset classes that are trending higher over the longâ€term and to avoid the asset classes exhibiting less strength on a relative basis. Cash is utilized as a safety net in the event that everything is dropping in unison. While the investment process works well during normal market cycles, the past year has been anything but normal. Since our Sterling Tactical Rotation Index went live on June 23, 2010, the past year has been the first sideways trading cycle we have encountered. Asset classes have trended higher for very short periods of time and then reversed course lower for short periods of time, and so on, which has caused the Fund to underperform the Morningstar Global Allocation benchmark during the period. We believe this period has been a market anomaly that will soon reverse course as markets begin to behave in a more normal fashion. The Fund uses two distinct risk management tools to seek to dampen downside. Both were employed during this 12â€month period. The first was the utilization of cash as an asset class. Throughout the 3rd quarter of 2015 the Fund’s cash exposure was 66.67%, during which the Fund fell â€2.43% compared to the S&P 500 negative return of â€6.93%. The second is avoiding asset classes in prolonged downâ€trends. As previously mentioned, the Fund avoided the â€31.89% collapse of commodities entirely. The period has been uncharacteristically driven by “will the Fed, won’t the Fed” rhetoric which has also negatively impacted the Fund. We anticipate that once the Fed begins to raise interest rates investors will once again become more focused on economic and corporate growth and less on Federal Reserve rhetoric. Mark W. Eicker Chief Investment Officer Sterling Global Strategies The views of the author and information discussed in this commentary are as of the date of publication, are subject to change, and may not reflect the writer's current views. The views expressed are those of the author only, and represent an assessment of market conditions at a specific point in time, are opinions only and should not be relied upon as investment advice regarding a particular investment or markets in general. Such information does not constitute a recommendation to buy or sell specific securities or investment vehicles. It should not be assumed that any investment will be profitable or will equal the performance of the fund(s) or any securities or any sectors mentioned in this letter.
The subject matter contained in this letter has been derived from several sources believed to be reliable and accurate at the time of compilation. Neither ALPS Advisors, Inc., Sterling Global Strategies, nor the Fund accepts any liability for losses either direct or consequential caused by the use of this information. Diversification cannot guarantee gain or prevent losses. 60 | October 31, 2015 . ALPS | Sterling ETF Tactical Rotation Fund Performance Update October 31, 2015 (Unaudited) Performance of $10,000 Initial Investment (as of October 31, 2015) Comparison of change in value of a $10,000 investment (includes maximum sales charges of 5.50%) $11k $10.5k $9.5k Sterling Tactical Rotation Index - TR - $9,814 Morningstar Global Allocation Index - $9,775 ALPS | Sterling ETF Tactical Rotation Fund Class A (NAV) - $9,593 $9k ALPS | Sterling ETF Tactical Rotation Fund Class A (MOP) - $9,068 10/31/15 4/30/15 10/31/14 6/30/14^ $10k The chart above represents historical performance of a hypothetical investment of $10,000 in the Fund since inception. Past performance does not guarantee future results. This chart does not reflect the deduction of taxes that a shareholder would pay on Fund distributions or the redemption of Fund shares. Average Annual Total Returns (as of October 31, 2015) Class A (NAV) 6 Month â€4.60% 1 Year â€3.78% Since Inception^ â€3.06% Class A (MOP) â€9.84% â€9.07% â€7.06% Class C (NAV) â€4.92% â€4.37% â€3.65% Class C (CDSC) â€5.88% â€5.32% â€3.65% Class I (NAV) Morningstar Global Allocation Index1 â€4.39% â€3.20% â€2.55% â€3.42% â€0.92% â€1.69% Total Expense Ratio What You Pay* 1.85% 1.75% 2.45% 2.35% 1.45% 1.35% 2 Sterling Tactical Rotation Index TR â€3.90% â€2.30% â€1.40% Performance data quoted represents past performance. Past performance does not guarantee future results.
Investment return and principal value of an investment will fluctuate so that an investor's shares, when sold or redeemed, may be worth more or less than the original cost. Current performance data may be higher or lower than actual data quoted. For the most current month-end performance data, please call 1-866-759-5679. Maximum Offering Price (MOP) for Class A shares includes the Fund’s maximum sales charge of 5.50%. Performance shown at NAV does not include these sales charges and would have been lower had it been taken into account.
If you invest $1 million or more, either as a lump sum or through the Fund’s accumulation or letter of intent programs, you can purchase Class A shares without an initial sales charge (load). A Contingent Deferred Sales Charge (“CDSC”) of 1.00% may apply to Class C shares redeemed within the first 12 months after purchase, and on Class A shares redeemed within the first 18 months after purchase in excess of $1 million. The Fund imposes a 2.00% redemption fee on shares held less than 30 days. Performance less than 1 year is cumulative. 61 | October 31, 2015 .
ALPS | Sterling ETF Tactical Rotation Fund Performance Update October 31, 2015 (Unaudited) 1 Morningstar Global Allocation Index: Global allocation portfolios seek to provide both capital appreciation and income by investing across three areas: global equities, global bonds, and cash. The Morningstar Global Allocation Index represents a multi-asset-class portfolio of 60% global equities and 40% global bonds. An investor may not invest directly in an index. 2 The Sterling Tactical Rotation Index - seeks to provide absolute returns during any market cycle or condition by employing an equally weighted strategic rotation model, trading between commodities, REITs, bonds, international and domestic equities. An investor may not invest directly in an index. ^ Fund inception date of June 30, 2014. * What You Pay reflects the Advisor’s decision to contractually limit expenses through February 29, 2016 and estimated Acquired Fund Fees and Expenses of 0.20%.
Please see the prospectus for additional information. The Fund is “non-diversified” and will generally be more volatile than diversified funds. Investments in small and mid-cap companies generally will experience greater price volatility. International and Emerging markets are riskier than more developed markets because they tend to develop unevenly and may never fully develop. Prices of fixed income securities generally increase when interest rates decline and decrease when interest rates increase and may cause losses.
Real estate investments are subject to specific risks, such as risks related to general and local economic conditions and risks related to individual properties. The Fund invests in Exchange Traded Funds (“ETFs”) and the Fund could lose money by investing in an ETF if the prices of the securities owned by the ETF go down. The Fund’s shareholders will indirectly incur the fees and expenses charged by the underlying ETFs held by the Fund, in addition to the expense charged by the Fund. Commodities and futures generally are volatile and involve a high degree of risk. This fund enters into a short sale by selling a security it has borrowed.
If the market price of a security increases after the Fund borrows the security, the Fund will suffer a potentially unlimited loss when it replaces the borrowed security at the higher price. The use of derivatives exposes the Fund to additional risks including increased volatility, lack of liquidity, and possible losses greater than the Fund’s initial investment as well as increased transaction. The table does not reflect the deduction of taxes that a shareholder would pay on Fund distributions or the redemption of Fund shares. This Fund is not suitable for all investors and is subject to investment risks, including possible loss of the principal amount invested. There is no guarantee that the Fund will continue to hold any one particular security or stay invested in any one particular company. The composition of the Fund's top holdings is subject to change.
Performance figures are historical and reflect the change in share price, reinvested distributions, changes in net asset value, sales charges and capital gains distributions, if any. The ALPS | Sterling ETF Tactical Rotation Fund is new and has limited operating history. Not FDIC Insured – No Bank Guarantee – May Lose Value Portfolio Composition (as a % of Net Assets) * REITs - 49.86% Bonds - 49.86% Cash, Cash Equivalents & Other Net Assets - 0.28% * Holdings are subject to change, and may not reflect the current or future position of the portfolio. 62 | October 31, 2015 . ALPS | Sterling ETF Tactical Rotation Fund Statement of Investments October 31, 2015 Value (Note 2) Shares EXCHANGE TRADED FUNDS (99.73%) Vanguard® REIT ETF 217,363 $ 17,365,130 Vanguard® Total Bond Market ETF 212,313 17,365,080 34,730,210 TOTAL EXCHANGE TRADED FUNDS (Cost $34,763,995) 34,730,210 TOTAL INVESTMENTS (99.73%) (Cost $34,763,995) Other Assets In Excess Of Liabilities (0.27%) NET ASSETS (100.00%) $ 34,730,210 94,797 $ 34,825,007 Common Abbreviations: ETF - Exchange Traded Fund. REIT - Real Estate Investment Trust For Fund compliance purposes, the Fund's industry classifications refer to any one or more of the industry sub-classifications used by one or more widely recognized market indexes or ratings group indexes, and/or as defined by Fund management. This definition may not apply for purposes of this report, which may combine industry sub-classifications for reporting ease. Industries are shown as a percent of net assets. See Notes to Financial Statements. 63 | October 31, 2015 . ALPS | Sterling ETF Tactical Rotation Fund Statement of Assets and Liabilities October 31, 2015 ASSETS Investments, at value Receivable for investments sold Receivable for shares sold Dividends and interest receivable Prepaid expenses and other assets Total Assets $ 34,730,210 17,406,794 168,111 11 17,828 52,322,954 $ 17,366,760 27,190 41,240 14,261 9,653 14,858 24 15,669 8,292 17,497,947 34,825,007 $ $ 36,579,355 124,311 (1,844,874) (33,785) 34,825,007 LIABILITIES Payable for investments purchased Payable for shares redeemed Payable due to custodian †overdraft Investment advisory fees payable Administration and transfer agency fees payable Distribution and services fees payable Trustees' fees and expenses payable Professional fees payable Accrued expenses and other liabilities Total Liabilities NET ASSETS NET ASSETS CONSIST OF Paidâ€in capital Accumulated net investment income Accumulated net realized loss on investments Net unrealized depreciation on investments NET ASSETS INVESTMENTS, AT COST PRICING OF SHARES $ 34,763,995 Class A: Net Asset Value, offering and redemption price per share Net Assets Shares of beneficial interest outstanding (unlimited number of shares, no par value common stock authorized) Maximum offering price per share ((NAV/0.9450), based on maximum sales charge of 5.50% of the offering price) Class C: (a) Net Asset Value, offering and redemption price per share Net Assets Shares of beneficial interest outstanding (unlimited number of shares, no par value common stock authorized) Class I: Net Asset Value, offering and redemption price per share Net Assets Shares of beneficial interest outstanding (unlimited number of shares, no par value common stock authorized) $ $ $ $ $ (a) 9.46 2,530,009 267,357 9.53 14,233,597 1,493,094 10.08 $ 9.59 $ 18,061,401 1,883,473 Redemption price per share may be reduced for any applicable contingent deferred sales charge. For a description of a possible sales charge, please see the Fund's Prospectus. See Notes to Financial Statements. 64 | October 31, 2015 . ALPS | Sterling ETF Tactical Rotation Fund Statement of Operations For the Year Ended October 31, 2015 INVESTMENT INCOME Dividends Total Investment Income $ 570,633 570,633 EXPENSES Investment advisory fees Administrative fees Transfer agency fees Distribution and service fees Class A Class C Professional fees Networking fees Class A Class C Class I Reports to shareholders and printing fees State registration fees SEC registration fees Insurance fees Custody fees Trustees' fees and expenses Offering costs Miscellaneous expenses Total Expenses Less fees waived/reimbursed by investment advisor (Note 8) Class A Class C Class I Net Expenses Net Investment Income Net realized loss on investments Net change in unrealized depreciation on investments See Notes to Financial Statements. 65 | October 31, 2015 16 4 8,545 6,297 28,650 2,582 74 5,301 685 47,768 8,434 550,241 $ (78,926) (8,258) (86,740) 376,317 194,316 (1,696,139) (273,084) (1,969,223) (1,774,907) 51,076 14,151 16,346 NET REALIZED AND UNREALIZED LOSS ON INVESTMENTS NET DECREASE IN NET ASSETS RESULTING FROM OPERATIONS 256,993 100,886 2,433 . ALPS | Sterling ETF Tactical Rotation Fund Statements of Changes in Net Assets For the Period July 1, 2014 (Commencement) to October 31, 2014 For the Year Ended October 31, 2015 OPERATIONS Net investment income Net realized loss on investments Net change in unrealized appreciation/(depreciation) on investments Net Increase/(Decrease) in Net Assets Resulting from Operations $ DISTRIBUTIONS Dividends to shareholders from net investment income Class A Class C Class I Total Distributions Net Decrease in Net Assets from Distributions 194,316 (1,696,139) (273,084) (1,774,907) $ (55,630) (4,086) (67,213) (126,929) (126,929) 13,776 (148,734) 239,299 104,341 – – – – – BENEFICIAL INTEREST TRANSACTIONS (NOTE 6) Shares sold Class A Class C Class I Dividends reinvested Class A Class C Class I Shares redeemed, net of redemption fees Class A Class C Class I Net Increase in Net Assets Derived from Beneficial Interest Transactions Net increase in net assets NET ASSETS Beginning of period End of year * *Including accumulated net investment income of: See Notes to Financial Statements. 66 | October 31, 2015 $ $ 16,208,475 2,475,711 14,687,621 50,265 3,473 56,161 (6,305,132) (352,476) (3,228,985) 23,595,113 21,693,277 13,131,730 34,825,007 124,311 $ $ 5,280,333 540,462 7,423,186 – – – (85,902) (8,249) (122,441) 13,027,389 13,131,730 – 13,131,730 21,251 . ALPS | Sterling ETF Tactical Rotation Fund – Class A Financial Highlights Selected data for a share of beneficial interest outstanding throughout the periods indicated: For the Year Ended October 31, 2015 $9.97 0.06 (0.43) (0.37) (0.07) (0.07) 0.00(b) (0.44) $9.53 Net investment income(a) Net realized and unrealized loss Total from investment operations DISTRIBUTIONS: From net investment income Total distributions REDEMPTION FEES ADDED TO PAIDâ€IN CAPITAL (NOTE 6) Net (decrease) in net asset value Net asset value, end of year TOTAL RETURN(c) 0.02 (0.05) (0.03) – – 0.00(b) (0.03) $9.97 (3.78)% Net asset value, beginning of period INCOME FROM INVESTMENT OPERATIONS: For the Period July 1, 2014 (Commencement) to October 31, 2014 $10.00 (0.30)% $14,234 2.16% 1.55% 0.58% 465% $5,262 5.01% (d) (d) 1.55% 0.67% (d) 181% RATIOS/SUPPLEMENTAL DATA: Net assets, end of year (000s) Ratio of expenses to average net assets excluding fee waivers and reimbursements Ratio of expenses to average net assets including fee waivers and reimbursements Ratio of net investment income to average net assets Portfolio turnover rate(e) (a) (c) (b) (d) (e) Calculated using the average shares method. Less than $0.005 per share. Total returns are for the period indicated and have not been annualized. Total returns would have been lower had certain expenses not been waived during the period. Returns shown do not reflect the deduction of taxes that a shareholder would pay on Fund distributions or the redemption of Fund shares. Returns shown exclude any applicable sales charges. Annualized. Portfolio turnover rate for periods less than one full year have not been annualized. See Notes to Financial Statements. 67 | October 31, 2015 .
ALPS | Sterling ETF Tactical Rotation Fund – Class C Financial Highlights Selected data for a share of beneficial interest outstanding throughout the periods indicated: For the Year Ended October 31, 2015 $9.95 (0.00)(b) (0.43) (0.43) (0.06) (0.06) (0.49) $9.46 Net investment income(a) Net realized and unrealized loss Total from investment operations DISTRIBUTIONS: From net investment income Total distributions Net (decrease) in net asset value Net asset value, end of year TOTAL RETURN(c) – (0.05) (0.05) – – (0.05) $9.95 (4.37)% Net asset value, beginning of period INCOME FROM INVESTMENT OPERATIONS: For the Period July 1, 2014 (Commencement) to October 31, 2014 $10.00 (0.50)% $2,530 2.73% 2.15% (0.05%) 465% $530 (d) 9.70% 2.15% (d) 0.12% (d) 181% RATIOS/SUPPLEMENTAL DATA: Net assets, end of year (000s) Ratio of expenses to average net assets excluding fee waivers and reimbursements Ratio of expenses to average net assets including fee waivers and reimbursements Ratio of net investment income/(loss) to average net assets Portfolio turnover rate(e) (a) (c) (b) (d) (e) Calculated using the average shares method. Less than $0.005 per share. Total returns are for the period indicated and have not been annualized. Total returns would have been lower had certain expenses not been waived during the period. Returns shown do not reflect the deduction of taxes that a shareholder would pay on Fund distributions or the redemption of Fund shares. Returns shown exclude any applicable sales charges. Annualized. Portfolio turnover rate for periods less than one full year have not been annualized. See Notes to Financial Statements. 68 | October 31, 2015 .
ALPS | Sterling ETF Tactical Rotation Fund – Class I Financial Highlights Selected data for a share of beneficial interest outstanding throughout the periods indicated: For the Year Ended October 31, 2015 $9.98 0.09 (0.40) (0.31) (0.08) (0.08) 0.00(b) (0.39) $9.59 Net investment income(a) Net realized and unrealized loss Total from investment operations DISTRIBUTIONS: From net investment income Total distributions REDEMPTION FEES ADDED TO PAIDâ€IN CAPITAL (NOTE 6) Net (decrease) in net asset value Net asset value, end of year TOTAL RETURN(c) 0.03 (0.05) (0.02) – – – (0.02) $9.98 (3.20)% Net asset value, beginning of period INCOME FROM INVESTMENT OPERATIONS: For the Period July 1, 2014 (Commencement) to October 31, 2014 $10.00 (0.20)% $18,061 1.83% 1.15% 0.95% 465% $7,340 5.93% (d) (d) 1.15% 0.94% (d) 181% RATIOS/SUPPLEMENTAL DATA: Net assets, end of year (000s) Ratio of expenses to average net assets excluding fee waivers and reimbursements Ratio of expenses to average net assets including fee waivers and reimbursements Ratio of net investment income to average net assets Portfolio turnover rate(e) (a) (c) (b) (d) (e) Calculated using the average shares method. Less than $0.005 per share. Total returns are for the period indicated and have not been annualized. Total returns would have been lower had certain expenses not been waived during the period. Returns shown do not reflect the deduction of taxes that a shareholder would pay on Fund distributions or the redemption of Fund shares. Annualized. Portfolio turnover rate for periods less than one full year have not been annualized. See Notes to Financial Statements. 69 | October 31, 2015 . ALPS | Westport Resources Hedged High Income Fund Management Commentary October 31, 2015 (Unaudited) Portfolio Review – October 2015 The ALPS | Westport Resources Hedged High Income Fund’s (the “Fund”) Class I shares declined 0.89% for the fiscal year ended October 31, 2015, net of fees. The Fund has outperformed the average of the Morningstar Nonâ€Traditional Bond Universe by 0.40% for the year. The Barclays US Aggregate Bond Index advanced 1.95% for the same period in what has been a very volatile period. The 30†day SEC yield for the Fund at month end was 7.27% with an average weighted duration of 1.3 years. The Fund is invested in three subâ€strategies: the Senior Loan Floating Rate Strategy, the Short Duration High Yield Strategy, and the Relative Value Long/Short Debt Strategy. Fund assets are allocated approximately oneâ€third to each subâ€strategy. The Senior Loan Floating Rate Strategy has been the strongest contributor to the Fund’s performance for the past year with consistent positive returns for ten of the last twelve months. Its return of 5.16% exceeds its benchmark, the Credit Suisse Leverage Loan Index, by more than 400 basis points. The Relative Value Long/Short Debt Strategy and the Short Duration High Yield Strategy had negative returns for the period, â€0.68% and â€0.92%, respectively. Calendar year to date, all three strategies are posting positive returns. All individual strategy returns are gross of fees. As noted in the past, the softness in performance has created greater opportunities within different sectors, as Treasury yields remain low and range bound. The ability of our subâ€advisors to exploit different sectors of the credit markets should provide opportunities to add alpha through sector and issue selection. The Fund’s combination of the three active hedged credit strategies should make the navigation a much smoother ride through what has, and continues to be, a volatile market environment. Economic and Fixed Income Review The consensus among the Fund’s subâ€advisors is that even after the recent rally in spreads, the broad corporate credit valuations are reasonable when coupled with their outlook for trending modest domestic economic growth. Investment Grade corporate spreads offer compensation well in excess of fundamental credit risks. They remain constructive on spreads even in the face of a potential Federal Reserve Open Market Committee (the “FOMC”) “liftâ€off.” The solid performance of the labor market and robust private domestic demand, was reflected by the latest upward revision to second quarter GDP that was in large part spurred by private consumption. That said, inflation indicators remain soft and well below target. The Fed, however, appears prepared to see through the disinflationary oneâ€off effects from lower commodity prices and dollar strength. Though the gap within the leveraged finance space has recently narrowed, High Yield bonds remain moderately attractive versus Leveraged Loans. They view the 7.5% allâ€inâ€yield on offer by the U.S. High Yield market as attractive for incomeâ€seeking investors. The loan market continues to be a buyer’s market as new issue supply outweighs investor inflows and secondary market prices remain soft. This technical dynamic allowed investors to drive well†structured deals with attractive yield opportunities in companies with strong business fundamentals. CLO (Collateralized Loan Obligation) new issuance was $7.3 billion in October and retail outflows were $0.7 billion, whereas the loan market grew $10.4 billion to $855 billion of outstanding loans. Defaults decreased 2 basis points in October to 1.33% and they expect loan defaults outside of the energy and metals/mining sectors to remain low for the remainder of 2015. Given the significant M&A forward calendar of $56.8 billion and the moderate projection for CLO issuance, expectations for the market are to remain investor friendly for the remainder of the year. Outlook and Current Positioning Themes: ï‚· ï‚· ï‚· ï‚· GDP growth expected to rebound to around 3% in Q4 2015 and build slowly into next year. U.S consumers are spending with real final sales forecasted to remain above 3%. Low global growth and inflation expectations translate into low global yields. Most indicators of domestic labor market conditions have recovered to preâ€recession levels. Macro and Rates: ï‚· FOMC monetary normalization process expected to start in December. ï‚· Pace of rate hikes will be much slower and lower than prior cycles. ï‚· Modest long duration bias and scaling back on short intermediate swap spreads. Corporate Credit: Net Long Bias ï‚· Valuations are attractive on a long term basis after recovering in October. ï‚· U.S. corporate market spreads offer value relative to global alternatives. ï‚· Market technicals will play a large role in asset pricing. Securitized Credit: Long Bias ï‚· Outlook for U.S. housing is positive. ï‚· Securitized credit sector offers an attractive alternative to higher yielding corporate credit. ï‚· Underlying mortgage loan performance reflects better credit underwriting. Mark R. Tonucci, Coâ€Portfolio Manager Michael E. Portnoy, Coâ€Portfolio Manager The views of the author and information discussed in this commentary are as of the date of publication, are subject to change, and may not reflect the writer's current views. The views expressed are those of the author only, and represent an assessment of market conditions at a specific point in time, are opinions only and should not be relied upon as investment advice regarding a particular investment or markets in general. Such information does not constitute a recommendation to buy or sell specific securities or investment vehicles. It should not be assumed that any investment will be profitable or will equal the performance of the fund(s) or any securities or any sectors mentioned in this letter.
The subject matter contained in this letter has been derived from several sources believed to be reliable and accurate at the time of compilation. Neither ALPS Advisors, Inc., Westport Resources Management, Inc. nor the Fund accepts any liability for losses either direct or consequential caused by the use of this information. Diversification cannot guarantee gain or prevent loss. The Credit Suisse Leverage Loan Index is an index designed to mirror the investable universe of the US-denominated leveraged loan market. 70 | October 31, 2015 . ALPS | Westport Resources Hedged High Income Fund Performance Update October 31, 2015 (Unaudited) Performance of $10,000 Initial Investment (as of October 31, 2015) Comparison of change in value of a $10,000 investment (includes maximum sales charges of 5.50%) $11k Barclays U.S. Aggregate Bond Index - $10,718 $10.5k ALPS | Westport Resources Hedged High Income Fund Class A, (NAV) - $10,079 $10k ALPS | Westport Resources Hedged High Income Fund Class A, (MOP) - $9,526 $9.5k 10/31/15 4/30/15 10/31/14 4/30/14 12/31/13^ $9k The chart above represents historical performance of a hypothetical investment of $10,000 in the Fund since inception. Past performance does not guarantee future results. This chart does not reflect the deduction of taxes that a shareholder would pay on Fund distributions or the redemption of Fund shares. Average Annual Total Returns (as of October 31, 2015) Class A (NAV) Class A (MOP) Class C (NAV) Class C (CDSC) Class I Barclays U.S. Aggregate Bond Index1 6 Month â€1.76% â€7.19% â€2.15% â€3.11% â€1.63% 1 Year â€1.32% â€6.71% â€1.90% â€2.83% â€0.89% Since Inception^ 0.43% â€2.61% â€0.23% â€0.23% 0.80% â€0.10% 1.96% 3.85% Total Expense Ratio What You Pay* 3.64% 2.39% 4.25% 2.99% 3.39% 1.99% Performance data quoted represents past performance.
Past performance does not guarantee future results. Investment return and principal value of an investment will fluctuate so that an investor's shares, when sold or redeemed, may be worth more or less than the original cost. Current performance data may be higher or lower than actual data quoted. For the most current month-end performance data, please call 1-866-759-5679. Maximum Offering Price (MOP) for Class A shares includes the Fund’s maximum sales charge of 5.50%.
Performance shown at NAV does not include these sales charges and would have been lower had it been taken into account. If you invest $1 million or more, either as a lump sum or through the Fund’s accumulation or letter of intent programs, you can purchase Class A shares without an initial sales charge (load). A Contingent Deferred Sales Charge (“CDSC”) of 1.00% may apply to Class C shares redeemed within the first 12 months after a purchase, and on Class A shares redeemed within the first 18 months after a purchase in excess of $1 million. Performance less than 1 year is cumulative. 71 | October 31, 2015 .
ALPS | Westport Resources Hedged High Income Fund Performance Update 1 ^ * October 31, 2015 (Unaudited) The Barclays U.S. Aggregate Bond Index is a broad-based benchmark that measures the investment grade, U.S. dollar-denominated, fixed-rate taxable bond market, including Treasuries, government-related and corporate securities, MBS (agency fixed-rate and hybrid ARM passthroughs), ABS, and CMBS. The index is not actively managed and does not reflect any deductions for fees, expenses or taxes.
An investor may not invest directly in an index. Fund inception date of December 31, 2013. What You Pay reflects the Advisor’s decision to contractually limit expenses through February 29, 2016. Please see the prospectus for additional information. This table does not reflect the deduction of taxes a shareholder would pay on Fund distributions or the redemption of Fund Shares. This Fund is not suitable for all investors and is subject to investment risks including possible loss of the principal invested. There is no guarantee that the Fund will continue to hold any one particular security or stay invested in any one particular company. The composition of the Fund's top holdings is subject to change.
Performance figures are historical and reflect the change in share price, reinvested distributions, changes in net asset value, sales charges and capital gains distributions, if any. Not FDIC Insured – No Bank Guarantee – May Lose Value Derivatives generally are more sensitive to changes in economic or market conditions than other types of investments; this could result in losses that significantly exceed the Fund's original investment. All investments involve risks, including possible loss of principal. The risks associated with higher-yielding, lower-rated securities include higher risk of default and loss of principal. Changes in the financial strength of a bond issuer or in a bond’s credit rating may affect its value.
In addition, interest rate movements will affect the fund’s share price and yield. Credit risk refers to the possibility the bond issuer will not be able to make principal and interest payments. Bond prices generally move in the opposite direction of interest rates.
Thus, as the prices of bonds in the fund adjust to a rise in interest rates, the fund’s share price may decline. These and other risk considerations are discussed in the fund’s prospectus. The principal on mortgage or asset-backed securities normally may be prepaid at any time, which will reduce the yield and market value of those securities.
US obligations are supported by varying degrees of credit but generally are not backed by the full faith and credit of the US government. Investments in non-investment-grade debt securities (“high yield” or “junk” bonds) may be subject to greater market fluctuations and risk of default or loss of income and principal than securities in higher rating categories. Senior-secured and second lien loans and bonds: Assets pledged as security for these loans and bonds would first be made available to senior lenders before other investors’ demands were met when settling a bankruptcy. The Fund is not required to invest with any minimum number of sub-advisors, and does not have minimum or maximum limitations with respect to the allocations of the assets to any sub-advisor or investment option. Diversification cannot guarantee gain or prevent losses. Top Ten Holdings (as a % of Net Assets) † Broadview Networks Holdings, Inc., Sec. Notes TeleCommunication Systems, Inc., Conv. Sr. Unsec. Notes Global Investments Group Finance Ltd., Sr. Unsec. Notes American Gilsonite Co., Second Lien Notes Creditcorp, Sec. Notes Boardriders SA, Sr. Unsec. Notes Nebraska Book Holdings, Inc., Sec. Notes Tempel Steel Co., Sec. Notes Alion Science & Technology Corp., First Lien Term Loan ION Geophysical Corp., Second Lien Notes Top Ten Holdings Portfolio Composition (as a % of Net Assets) 2.09% Corporate Bonds - 44.36% Bank Loans - 28.89% Mortgage Backed Securities - 9.05% Convertible Corporate Bonds - 4.60% Exchange Traded Funds - 1.04% Cash, Cash Equivalents & Other Net Assets - 12.06% 1.97% 1.87% 1.82% 1.67% 1.67% 1.65% 1.64% 1.54% 1.45% 17.37% † Holdings are subject to change, and may not reflect the current or future position of the portfolio. Table presents indicative values only. 72 | October 31, 2015 . ALPS | Westport Resources Hedged High Income Fund Statement of Investments October 31, 2015 Shares 6,100 TOTAL EXCHANGE TRADED FUNDS (Cost $236,028) $ 234,179 Principal Amount 234,179 Value (Note 2) BANK LOANS (28.89%)(b) Communications (4.55%) Quincy Newspapers, Inc., Term B Loan L+4.50% 10/19/2022 (c) $ 40,000 $ RentPath LLC, First Lien Term Loan 6.250% 12/17/2021 38,678 TCHâ€2 Holdings LLC (TravelClick, Inc.), First Lien Initial Term Loan 5.500% 05/06/2021 98,782 Total Communications 39,767 34,616 98,349 1,025,694 Consumer, Cyclical (4.93%) Basic Materials (0.41%) Tensar Corp., First Lien Term Loan 5.750% 07/09/2021 Value (Note 2) Communications (continued) EXCHANGE TRADED FUNDS (1.04%) ProShares UltraShort Russell 2000®(a) Principal Amount Value (Note 2) $ 101,107 93,271 Ancestry.com, Inc., Initial Term Loan 5.000% 08/29/2022 49,500 Answers Corporation, First Lien Term Loan 6.250% 10/01/2021 61,535 Auction.com LLC, Existing Term Loan 6.000% 05/12/2019 53,730 ConvergeOne Holdings Corp., First Lien Initial Term Loan 6.000% 06/17/2020 50,363 CSC Holdings LLC (fka CSC Holdings Inc. (Cablevision)), Term B Loan L+4.00% 10/09/2022 (c) 26,000 Emerging Markets Communications LLC, First Lien Initial Term Loan 6.750% 07/01/2021 34,913 Encompass Digital Media, Inc., Second Lien Tranche B Term Loan 8.750% 06/06/2022 164,000 Extreme Reach, Inc., Second Lien Initial Term Loan 10.500% 01/22/2021 160,000 Global Healthcare Exchange LLC, Initial Term Loan 5.500% 08/15/2022 38,000 iParadigms Holdings LLC, First Lien Initial Term Loan 5.000% 07/30/2021 19,745 MediArena Acquisition BV, (fka AP NMT Acquisition BV), First Lien Dollar Term B Loan 6.750% 08/13/2021 98,010 Miller Heiman, Inc., Term Loan 6.750% 09/30/2019 33,906 NextGen Networks Pty Ltd. (Nextgen Finance LLC), Term B Loan 5.000% 05/31/2021 68,826 Numericableâ€SFR SA, USD Term Loan L+4.00% 01/20/2023 (c) 31,000 49,537 45,638 53,327 50,079 26,132 34,040 161,540 159,200 37,988 19,252 93,600 31,533 Agrofresh, Inc., Term Loan 5.750% 07/31/2021 80,798 Amaya Holdings BV, First Lien Initial Term B Loan 5.000% 08/01/2021 110,882 AMF Bowling Centers, Inc., Term B Loan L+6.25% 09/18/2021 (c) 91,580 BDF Acquisition Corp., Initial Term Loan 5.250% 02/12/2021 123,438 BDF Acquisition Corp., Second Lien Initial Term Loan 9.000% 02/12/2022 23,000 Big Jack Holdings LP, Initial Term Loan 5.750% 07/01/2022 57,000 CDS U.S. Intermediate Holdings, Inc. (Cirque Du Soleil Canada, Inc.), Second Lien Initial Loan 9.250% 07/10/2023 24,000 Deluxe Entertainment Services Group, Inc., Initial Term Loan 6.500% 02/28/2020 93,854 Fullbeauty Brands Holdings Corp., First Lien Initial Term Loan 5.750% 10/14/2022 21,000 GST AutoLeather, Inc., Term B Loan 6.500% 07/10/2020 99,000 PlayPower, Inc., First Lien Initial Term Loan 5.750% 06/23/2021 66,833 Twin River Management Group, Inc. (fka BLB Management Services, Inc.), Closing Date Term Loan 5.250% 07/10/2020 237,798 World Triathlon Corp., Initial Term Loan 5.250% 06/25/2021 98,750 Total Consumer, Cyclical 80,730 108,684 90,779 121,740 21,735 56,145 23,670 87,754 20,055 97,515 66,833 238,578 98,318 1,112,536 Consumer, Nonâ€cyclical (5.50%) 60,395 30,701 AF Borrower LLC (aka Accuvant Finance LLC), First Lien Initial Term Loan 6.250% 01/28/2022 73 | October 31, 2015 73,630 73,492 . ALPS | Westport Resources Hedged High Income Fund Statement of Investments Principal Amount October 31, 2015 Value (Note 2) Consumer, Nonâ€cyclical (continued) Candy Intermediate Holdings, Inc., Initial Term Loan 7.500% 06/18/2018 $ 15,877 $ Central Security Group, Inc., First Lien Initial Term Loan 6.250% 10/06/2020 46,648 Coty, Inc., USD Term B Loan L+3.00% 10/27/2022 (c) 15,667 CPI Buyer LLC, First Lien Initial Term Loan 5.500% 08/16/2021 77,527 DAE Aviation Holdings, Inc., Initial Term Loan 5.250% 07/07/2022 55,000 FHC Health Systems, Initial Term Loan 5.000% 12/23/2021 99,749 Galleria Co., USD Term B Loan L+3.00% 10/21/2022 (c) 31,333 GK Holdings, Inc. (aka Global Knowledge), First Lien Initial Term Loan 6.500% 01/20/2021 18,858 Global Cash Access, Inc., Term B Loan 6.250% 12/18/2020 21,670 Jackson Hewitt, Inc., Initial Term Loan 8.000% 07/30/2020 76,000 Kronos Acquisition Intermediate, Inc. (aka KIK Custom Products, Inc.), Initial Term Loan 6.000% 08/26/2022 11,000 Mister Car Wash Holdings, Inc., Term Loan 5.000% 08/20/2021 41,475 Navex Global, Inc., First Lien Term Loan 5.750% 11/19/2021 3,970 Navex Global, Inc., Second Lien Term Loan 9.750% 11/18/2022 46,000 Prime Security Services Borrower LLC (aka Protection 1 Security Solutions), First Lien Term B Loan 5.000% 07/01/2021 58,000 Prime Security Services Borrower LLC (aka Protection 1 Security Solutions), Second Lien Term B Loan 9.750% 07/01/2022 30,000 Ryan LLC, Tranche B Term Loan 6.750% 08/07/2020 20,738 Sitel Worldwide Corporation, First Lien Term Bâ€1 Loan L+5.50% 09/18/2021 (c) 81,000 Principal Amount Value (Note 2) Consumer, Nonâ€cyclical (continued) 15,718 45,831 15,750 77,042 54,977 98,253 31,417 18,810 21,142 Sun Products Corp. (fka Huish Detergents, Inc.), Tranche B Term Loan 5.500% 03/23/2020 Sundial Group Holdings LLC, Initial Term Loan L+6.25% 10/19/2021 (c)(d) Team Health, Inc., Bridge Term Loan L+5.00% 09/24/2016 (c)(d) USAGM Holdco LLC, First Lien Delayed Draw Term Loan 4.750% 07/28/2022 USAGM Holdco LLC, First Lien Initial Term Loan 4.750% 07/28/2022 Vestcom International, Inc. (fka Vector Investment Holdings, Inc.), Term Loan 5.250% 09/30/2021 Weight Watchers International, Inc., Initial Tranche Bâ€1 Term Loan L+3.00% 04/02/2016 (c) Wyle Services Corp., Term Loan 5.000% 05/23/2021 Total Consumer, Nonâ€cyclical Diversified (1.96%) $ 97,800 $ 97,000 39,000 94,707 95,060 39,000 2,371 2,302 33,629 32,648 115,345 114,769 10,000 33,987 9,838 33,881 1,239,043 74,860 10,918 41,319 3,930 Emerald 2 Ltd., Facility B1 Loan 5.000% 05/14/2021 First Eagle Investment Management LLC, Term Loan L+4.00% 10/30/2022 (c) Koosharem LLC, Term Loan 7.500% 05/15/2020 LBM Holdings LLC, First Lien Initial Term Loan 6.250% 08/20/2022 Total Diversified Energy (0.20%) 100,000 250,000 57,565 42,000 99,750 245,000 56,630 40,661 442,041 45,310 57,761 Expro Financial Services, S.a.r.l., Initial Term Loan 5.750% 09/02/2021 44,550 Preferred Proppants LLC, Term Loan 6.750% 07/27/2020 13,808 Total Energy 36,937 8,106 45,043 Financials (3.34%) 29,588 20,530 AmeriLife Group LLC, First Lien Initial Term Loan 5.750% 07/10/2022 14,963 AmeriLife Group LLC, Second Lien Initial Term Loan 9.750% 01/10/2023 22,000 Aptean, Inc., First Lien Term Loan 5.250% 02/26/2020 98,500 80,190 74 | October 31, 2015 14,925 21,670 96,530 . ALPS | Westport Resources Hedged High Income Fund Statement of Investments Principal Amount October 31, 2015 Value (Note 2) Principal Amount Financials (continued) Industrials (continued) Asurion LLC (fka Asurion Corp.), Bâ€4 Term Loan 5.000% 08/04/2022 $ 32,918 $ Asurion LLC (fka Asurion Corp.), Second Lien Term Loan 8.500% 03/03/2021 85,000 BATS Global Markets, Inc., Incremental Bâ€2 Term Loan 5.750% 01/31/2020 10,989 Confie Seguros Holding II Co., First Lien Term B Loan 5.750% 11/09/2018 11,969 DTZ U.S. Borrower LLC (DTZ AUS Holdco PTY Limited), First Lien 2015â€1 Additional Term Loan 4.250% 11/04/2021 69 Duff & Phelps Corporation, Second Lien Initial Term Loan 9.500% 04/23/2021 29,000 IG Investments Holdings LLC, Extended Tranche B Term Loan 6.000% 10/31/2021 49,617 Liquidnet Holdings, Inc., Term Loan 7.750% 05/22/2019 93,750 LTCG Holdings Corp., Initial Term Loan 6.000% 06/06/2020 70,964 NXT Capital, Inc. (NXT Capital LLC), Facility Term Loan 6.250% 09/04/2018 98,492 RCS Capital Corp., First Lien Term Loan 7.500% 04/29/2019 97,025 Vistra Group Limited, USD Term Loan L+3.75% 07/21/2022 (c) 8,000 Walter Investment Management Corp., Tranche B Term Loan 4.750% 12/18/2020 59,443 Total Financials Jeldâ€Wen, Inc. (Onex BP Finance LP), Term Bâ€1 Loan 5.000% 07/01/2022 $ 17,000 $ Lully Finance S.a.r.l. (Lully Finance LLC), First Lien Initial Bâ€1 Term Loan 5.000% 10/14/2022 14,000 Mirion Technologies (Finance) LLC (Mirion Technologies, Inc.), First Lien Initial Term Loan 5.750% 03/31/2022 28,855 NVLX Acquisition LLC, Second Lien Closing Date Term Loan L+8.75% 06/05/2022 (c) 69,123 Plaze, Inc., Term Loan 5.250% 07/31/2022 98,000 Prolampac Holdings, Inc., First Lien Initial Term Loan 5.000% 08/18/2022 19,000 Quality Home Brands Holdings LLC, First Lien Initial Term Loan 7.750% 12/17/2018 49,125 Quanex Building Products Corp., Initial Term Loan L+5.25% 11/02/2022 (c) 22,000 U.S. Farathane LLC, Initial Term Loan 6.750% 12/23/2021 44,141 XPO Logistics, Inc., Term Loan L+4.50% 11/01/2021 (c) 125,000 Total Industrials Value (Note 2) 31,189 76,925 11,057 11,999 69 28,746 49,656 90,938 65,642 98,739 13,860 28,906 68,777 97,633 18,917 49,288 21,780 44,500 124,063 676,071 Technology (4.90%) 92,477 7,970 54,390 752,922 Industrials (3.00%) ABG Operating LLC, Term Loan 6.250% 06/12/2020 65,175 Builders FirstSource, Inc., Term B Loan 6.000% 07/29/2022 45,000 C.H.I. Overhead Doors, Inc., First Lien Initial Term Loan 4.750% 07/29/2022 31,000 DI Purchaser, Inc., First Lien Initial Term Loan 6.000% 12/15/2021 32,753 Gruden Acquisition, Inc. (aka Quality Distributions), First Lien Term Loan 5.750% 08/18/2022 19,000 17,053 65,256 44,761 30,903 31,770 Alion Science & Technology Corp., First Lien Term Loan 5.500% 08/19/2021 349,125 Computer Sciences Government Services, Inc., Term B Loan L+3.00% 10/06/2022 (c) 59,000 Compuware Corp., First Lien Tranched Bâ€1 Term Loan L+5.25% 12/15/2019 (c) 75,000 Novetta Solutions LLC, First Lien Initial Term Loan 6.000% 10/17/2022 86,000 P2 Lower Acquisition LLC (aka Progressive Solutions), First Lien Initial Term Loan 5.500% 10/22/2020 85,739 QBS Holding Company, Inc., Term Loan 5.750% 08/07/2021 191,535 Regit Eins GmbH (TV Borrower US LLC), First Lien Dollar Term Loan 6.000% 01/08/2021 99,000 18,604 75 | October 31, 2015 347,379 59,221 71,906 85,570 86,008 189,620 98,753 . ALPS | Westport Resources Hedged High Income Fund Statement of Investments October 31, 2015 Principal Amount Value (Note 2) Principal Amount Technology (continued) Basic Materials (continued) STG †Fairway Acquisitions, Inc., First Lien Term Loan 6.250% 06/30/2022 $ 54,697 $ 54,253 Stratus Technologies Bermuda Ltd. (Stratus Technologies, Inc.), Initial Term Loan L+5.00% 04/28/2021 (c) 47,313 46,928 Vencore, Inc. (fka SI Organization, Inc.), First Lien Initial Term Loan 5.750% 11/23/2019 64,924 64,810 1,104,448 Total Technology ArcelorMittal, Sr. Unsec. Notes 6.125% 06/01/2025 $ 30,000 $ Barminco Finance Pty Ltd., Sr. Unsec. Notes, Series AI 9.000% 06/01/2018 40,000 BlueScope Steel Finance Ltd. / BlueScope Steel Finance USA LLC, Sr. Unsec. Notes 7.125% 05/01/2018 (e) 55,000 Eco Services Operations LLC / Eco Finance Corp., Sr. Unsec. Notes 8.500% 11/01/2022 (e) 26,000 Optima Specialty Steel, Inc., First Lien Notes 12.500% 12/15/2016 (e) 165,000 Total Basic Materials Value (Note 2) Utilities (0.10%) Invenergy Thermal Operating I LLC, Term Loan 6.500% 10/19/2022 22,000 21,890 25,940 31,400 54,450 23,270 147,675 692,735 TOTAL BANK LOANS Communications (5.72%) (Cost $6,561,732) 6,512,959 CONVERTIBLE CORPORATE BONDS (4.60%) Communications (3.35%) Alaska Communications Systems Group, Inc., Conv. Sub. Notes 6.250% 05/01/2018 ModusLink Global Solutions, Inc., Conv. Sr. Unsec. Notes 5.250% 03/01/2019 TeleCommunication Systems, Inc., Conv. Sr. Unsec. Notes 7.750% 06/30/2018 Total Communications Consumer, Cyclical (0.30%) 250,000 251,719 75,000 60,422 450,000 443,250 755,391 Iconix Brand Group, Inc., Sr. Sub. Notes 2.500% 06/01/2016 Consumer, Nonâ€cyclical (0.65%) 70,000 67,069 PDL BioPharma, Inc., Conv. Sr. Unsec. Notes 4.000% 02/01/2018 175,000 Financials (0.30%) 146,453 Pinetree Capital Ltd., Conv. Sub. Notes 10.000% 05/31/2016 80,719 67,453 TOTAL CONVERTIBLE CORPORATE BONDS (Cost $1,029,678) 1,036,366 CORPORATE BONDS (44.36%) Blue Coat Holdings, Inc., Sr. Unsec. Notes 8.375% 06/01/2023 (e) Broadview Networks Holdings, Inc., Sec. Notes 10.500% 11/15/2017 CCO Safari II LLC, First Lien Notes 4.908% 07/23/2025 (e) EarthLink Holdings Corp., Sr. Unsec. Notes 8.875% 05/15/2019 Frontier Communications Corp., Sr. Unsec. Notes 10.500% 09/15/2022 (e) 11.000% 09/15/2025 (e) iHeartCommunications, Inc., First Lien Notes 9.000% 12/15/2019 Interactive Network, Inc. / FriendFinder Networks, Inc., First Lien Notes 14.000% 12/20/2018 Postmedia Network, Inc., Second Lien Notes 12.500% 07/15/2018 Sprint Communications, Inc., Sr. Unsec. Notes 7.000% 08/15/2020 Visant Corp., Sr. Unsec. Notes 10.000% 10/01/2017 Windstream Services LLC, Sr. Unsec. Notes 7.750% 10/01/2021 Total Communications Consumer, Cyclical (10.13%) 40,000 500,000 25,000 41,600 471,250 25,511 75,000 77,813 35,000 70,000 36,400 73,543 75,000 63,750 238,363 133,483 40,000 37,800 125,000 100,000 125,000 116,250 102,900 108,399 1,288,699 Basic Materials (3.07%) American Gilsonite Co., Second Lien Notes 11.500% 09/01/2017 (e) 500,000 410,000 Boardriders SA, Sr. Unsec. Notes, Series REGS 8.875% 12/15/2017 (f) 76 | October 31, 2015 390,000 376,542 . ALPS | Westport Resources Hedged High Income Fund Statement of Investments Principal Amount October 31, 2015 Value (Note 2) Consumer, Cyclical (continued) Value (Note 2) Consumer, Nonâ€cyclical (3.48%) Bonâ€Ton Department Stores, Inc., Second Lien Notes 10.625% 07/15/2017 $ 115,000 $ 108,100 Brookfield Residential Properties, Inc., Sr. Unsec. Notes 6.375% 05/15/2025 (e) 65,000 62,725 Caesars Entertainment Operating Co., Inc., Sr. Unsec. Notes 10.750% 02/01/2016 (g) 250,000 71,250 Caesars Entertainment Resort Properties LLC / Caesars Entertainment Resort Properties, First Lien Notes 8.000% 10/01/2020 12,000 11,970 Ferrellgas LP / Ferrellgas Finance Corp., Sr. Unsec. Notes 6.750% 06/15/2023 (e) 50,000 46,375 General Motors Financial Co., Inc., Sr. Unsec. Notes 4.300% 07/13/2025 100,000 102,007 Gibson Brands, Inc., Sec. Notes 8.875% 08/01/2018 (e) 90,000 79,425 Icon Health & Fitness, Inc., First Lien Notes 11.875% 10/15/2016 (e) 238,000 237,702 K Hovnanian Enterprises, Inc., Sr. Unsec. Notes 8.000% 11/01/2019 (e) 55,000 42,625 KB Home, Sr. Unsec. Notes 8.000% 03/15/2020 100,000 109,250 L Brands, Inc., Sr. Unsec. Notes 6.875% 11/01/2035 (e) 45,000 47,081 Mohegan Tribal Gaming Authority, Sr. Unsec. Notes 9.750% 09/01/2021 (e) 95,000 98,325 Nebraska Book Holdings, Inc., Sec. Notes 15.000% 06/30/2016 (e) 374,500 372,628 Toll Brothers Finance Corp., Sr. Unsec. Notes 4.875% 11/15/2025 110,000 110,138 Tops Holding LLC / Tops Markets II Corp., Sec. Notes 8.000% 06/15/2022 (e) 40,000 41,700 Tunicaâ€Biloxi Gaming Authority, Sr. Unsec. Notes 9.000% 11/15/2015 (e)(g) 400,000 231,500 United Airlines 2014â€1 Class B Pass Through Trust, Second Lien Notes, Series B 4.750% 04/11/2022 95,209 95,745 Viking Cruises Ltd., Sr. Unsec. Notes 6.250% 05/15/2025 (e) 40,000 39,500 2,284,588 Total Consumer, Cyclical Principal Amount Avon Products, Inc., Sr. Unsec. Notes 4.200% 07/15/2018 6.500% 03/01/2019 Carolina Beverage Group LLC / Carolina Beverage Group Finance, Inc., Sec. Notes 10.625% 08/01/2018 (e) DJO Finco, Inc. / DJO Finance LLC / DJO Finance Corp., Second Lien Notes 8.125% 06/15/2021 (e) Fresenius US Finance II, Inc., Sr. Unsec. Notes 4.500% 01/15/2023 (e) HealthSouth Corp., Sr. Unsec. Notes 5.750% 09/15/2025 (e) JBS USA LLC / JBS USA Finance, Inc., Sr. Unsec. Notes 5.750% 06/15/2025 (e) Kraft Heinz Food Co., Sr. Unsec. Notes 3.950% 07/15/2025 (e) 5.200% 07/15/2045 (e) Vantage Oncology LLC / Vantage Oncology Finance Co., Sec. Notes 9.500% 06/15/2017 (e) Total Consumer, Nonâ€cyclical Energy (5.01%) $ 45,000 $ 25,000 39,150 22,375 103,000 104,802 100,000 99,500 50,000 45,000 51,313 44,775 30,000 29,175 60,000 35,000 61,668 37,060 325,000 294,125 783,943 Antero Resources Corp., Sr. Unsec. Notes 5.125% 12/01/2022 Blue Racer Midstream LLC / Blue Racer Finance Corp., Sr. Unsec. Notes 6.125% 11/15/2022 (e) Calumet Specialty Products Partners LP / Calumet Finance Corp., Sr. Unsec. Notes 7.750% 04/15/2023 (e) CONSOL Energy, Inc., Sr. Unsec. Notes 5.875% 04/15/2022 Diamond Offshore Drilling, Inc., Sr. Unsec. Notes 4.875% 11/01/2043 EV Energy Partners LP / EV Energy Finance Corp., Sr. Unsec. Notes 8.000% 04/15/2019 ION Geophysical Corp., Second Lien Notes 8.125% 05/15/2018 Kinder Morgan Energy Partners LP, Sr. Unsec. Notes 5.400% 09/01/2044 77 | October 31, 2015 100,000 90,250 30,000 28,200 50,000 47,750 75,000 49,125 50,000 35,476 161,000 112,700 560,000 327,600 100,000 82,513 . ALPS | Westport Resources Hedged High Income Fund Statement of Investments Principal Amount October 31, 2015 Value (Note 2) Principal Amount Energy (continued) Financials (continued) MarkWest Energy Partners LP / MarkWest Energy Finance Corp., Sr. Unsec. Notes 4.875% 06/01/2025 $ 85,000 $ 79,687 Newfield Exploration Co., Sr. Unsec. Notes 5.375% 01/01/2026 75,000 71,625 Petroleum Geoâ€Services ASA, Sr. Unsec. Notes 7.375% 12/15/2018 (e) 63,000 51,424 Pioneer Energy Services Corp., Sr. Unsec. Notes 6.125% 03/15/2022 100,000 58,000 Polarcus Ltd., Sr. Unsec. Notes 8.000% 06/07/2018 (e) 400,000 60,000 Sunoco LP / Sunoco Finance Corp., Sr. Unsec. Notes 6.375% 04/01/2023 (e) 35,000 35,438 1,129,788 Total Energy JPMorgan Chase & Co., Jr. Sub. Notes, Series V 5.000% Perpetual Maturity (b)(h) $ 50,000 $ KKR Group Finance Co. III LLC, Sr. Unsec. Notes 5.125% 06/01/2044 (e) 75,000 Morgan Stanley, Jr. Sub. Notes, Series J 5.550% Perpetual Maturity (b)(h) 45,000 Quicken Loans, Inc., Sr. Unsec. Notes 5.750% 05/01/2025 (e) 25,000 Wells Fargo & Co., Jr. Sub. Notes, Series S 5.900% Perpetual Maturity (b)(h) 100,000 Total Financials Value (Note 2) Aircastle Ltd., Sr. Unsec. Notes 5.500% 02/15/2022 35,000 CNO Financial Group, Inc., Sr. Unsec. Notes 5.250% 05/30/2025 25,000 Communications Sales & Leasing, Inc., First Lien Notes 6.000% 04/15/2023 (e) 27,000 Constellation Enterprises LLC, First Lien Notes 10.625% 02/01/2016 (e) 120,000 Corrections Corporation of America, Sr. Unsec. Notes 5.000% 10/15/2022 10,000 Creditcorp, Sec. Notes 12.000% 07/15/2018 (e) 510,000 Fly Leasing Ltd., Sr. Unsec. Notes 6.375% 10/15/2021 200,000 Global Investments Group Finance Ltd., Sr. Unsec. Notes 11.000% 09/24/2017 (e) 400,000 Goldman Sachs Group, Inc., Jr. Sub. Notes, Series L 5.700% Perpetual Maturity (b)(h) 100,000 Goldman Sachs Group, Inc., Jr. Sub. Notes, Series M 5.375% Perpetual Maturity (b)(h) 70,000 Goldman Sachs Group, Inc., Sr. Unsec. Notes 4.750% 10/21/2045 55,000 Goldman Sachs Group, Inc., Sub. Notes 5.150% 05/22/2045 35,000 37,100 26,656 26,325 88,200 10,175 376,762 206,500 421,000 101,500 69,388 55,990 35,307 74,366 45,000 24,906 102,500 1,751,038 Industrials (7.24%) Financials (7.77%) 49,363 Air Medical Merger Sub Corp., Sr. Unsec. Notes 6.375% 05/15/2023 (e) 75,000 Anixter, Inc., Sr. Unsec. Notes 5.500% 03/01/2023 (e) 20,000 ATS Automation Tooling Systems, Inc., Sr. Unsec. Notes 6.500% 06/15/2023 (e) 35,000 Builders FirstSource, Inc., Sr. Unsec. Notes 10.750% 08/15/2023 (e) 100,000 CTP Transportation Products LLC / CTP Finance, Inc., Sec. Notes 8.250% 12/15/2019 (e) 100,000 Dispensing Dynamics International, Sec. Notes 12.500% 01/01/2018 (e) 115,000 GEO Debt Finance SCA, First Lien Notes, Series REGS 7.500% 08/01/2018 (f) 120,000 Global Ship Lease, Inc., First Lien Notes 10.000% 04/01/2019 (e) 40,000 Kemet Corp., First Lien Notes 10.500% 05/01/2018 145,000 Kratos Defense & Security Solutions, Inc., First Lien Notes 7.000% 05/15/2019 36,000 NCSG Crane & Heavy Haul Services, Inc., Second Lien Notes 9.500% 08/15/2019 (e) 100,000 OPE KAG Finance Sub, Inc., Sr. Unsec. Notes 7.875% 07/31/2023 (e) 150,000 Optimas OE Solutions Holding LLC / Optimas OE Solutions, Inc., Sec. Notes 8.625% 06/01/2021 (e) 85,000 78 | October 31, 2015 68,625 20,700 35,963 103,750 107,000 113,850 126,027 40,200 131,587 27,090 58,500 156,375 81,175 . ALPS | Westport Resources Hedged High Income Fund Statement of Investments October 31, 2015 Principal Amount Value (Note 2) Principal Amount Value (Note 2) Industrials (continued) Real Alloy Holding, Inc., First Lien Notes 10.000% 01/15/2019 (e) Tempel Steel Co., Sec. Notes 12.000% 08/15/2016 (e) Total Industrials Technology (1.94%) $ 186,000 $ 190,650 368,000 370,226 1,631,718 DynCorp International, Inc., Sr. Unsec. Notes 10.375% 07/01/2017 65,000 First Data Corp., Sr. Unsec. Notes 12.625% 01/15/2021 150,000 Hutchinson Technology, Inc., Second Lien Notes 8.500% 01/15/2017 120,000 Interface Security Systems Holdings, Inc. / Interface Security Systems LLC, Second Lien Notes 9.250% 01/15/2018 20,000 MSCI, Inc., Sr. Unsec. Notes 5.250% 11/15/2024 (e) 20,000 Seagate HDD Cayman, Sr. Unsec. Notes 5.750% 12/01/2034 (e) 60,000 Total Technology 51,675 172,312 121,200 20,175 21,100 50,952 437,414 TOTAL CORPORATE BONDS (Cost $11,656,676) 9,999,923 MORTGAGE BACKED SECURITIES (9.05%) American Homes 4 Rent, Series 2014â€SFR1 3.500% 06/17/2016 (b)(e) American Residential Properties Trust, Series 2014â€SFR1 4.127% 09/17/2016 (b)(e) 4.627% 09/17/2016 (b)(e) 150,000 144,073 Fannie Mae Connecticut Avenue Securities, Series 2014â€C04 5.094% 11/25/2024 (b) Fannie Mae Connecticut Avenue Securities, Series 2014â€C02 2.794% 05/25/2024 (b) Fannie Mae Connecticut Avenue Securities, Series 2014â€C03 3.194% 07/25/2024 (b) Invitation Homes Trust, Series 2014†SFR1 3.957% 06/17/2016 (b)(e) JPMBB Commercial Mortgage Securities Trust, Series 2015†C31 4.273% 08/15/2025 (b) Luminent Mortgage Trust, Series 2006â€2 A1A 0.394% 02/25/2046 (b) Wells Fargo Commercial Mortgage Trust, Series 2015â€NXS2 4.394% 07/15/2058 (b) Wells Fargo Commercial Mortgage Trust, Series 2015â€SG1 4.620% 12/15/2047 (b) Wells Fargo Commercial Mortgage Trust, Series 2015â€C27 3.768% 03/15/2025 (e) Wells Fargo Commercial Mortgage Trust, Series 2015â€C29 4.365% 06/15/2048 (b) WFRBS Commercial Mortgage Trust, Series 2014â€LC14 4.586% 02/15/2024 (b)(e) $ 120,000 $ 120,399 50,000 44,677 190,000 171,505 200,000 191,249 100,000 77,880 72,788 50,781 100,000 81,623 53,000 44,892 100,000 80,326 50,000 40,693 125,000 109,809 100,000 100,000 Citigroup Commercial Mortgage Trust, Series 2014â€GC25 3.548% 10/10/2024 (e) 100,000 Colony American Homes, Series 2014â€1A 3.050% 05/17/2017 (b)(e) 125,000 Countrywide Alternative Loan Trust, Series 2006â€6CB 5.750% 05/25/2036 250,850 Fannie Mae Connecticut Avenue Securities, Series 2015â€C02 4.194% 05/25/2025 (b) 85,000 Fannie Mae Connecticut Avenue Securities, Series 2015â€C04 5.744% 04/25/2028 (b) 45,000 155,000 5.894% 04/25/2028 (b) TOTAL MORTGAGE BACKED SECURITIES (Cost $2,084,757) 98,519 97,672 Yield 79,906 119,527 201,528 80,774 45,773 158,234 Principal Amount 2,039,840 Value (Note 2) SHORT TERM INVESTMENTS (0.35%) Government (0.35%) U.S. Treasury Bills Discounted Notes, 06/23/2016(i) U.S. Treasury Bills Discounted Notes, (i) 03/03/2016 0.056% 50,000 49,909 0.061% 30,000 29,990 79,899 79,899 TOTAL SHORT TERM INVESTMENTS (Cost $79,910) 79 | October 31, 2015 . ALPS | Westport Resources Hedged High Income Fund Statement of Investments October 31, 2015 Value (Note 2) TOTAL INVESTMENTS (88.29%) (Cost $21,648,781) Other Assets In Excess Of Liabilities (11.71%) NET ASSETS (100.00%) $ 19,903,166 2,641,020 (j) $ 22,544,186 (a) (b) (c) (d) (e) (f) (g) (h) (i) (j) Non-Income Producing Security. Floating or variable rate security. Interest rate disclosed is that which is in effect at October 31, 2015. All or a portion of this position has not settled as of October 31, 2015. The interest rate shown represents the stated spread over the London Interbank Offered Rate ("LIBOR" or "L") or the applicable LIBOR floor; the Fund will not accrue interest until the settlement date, at which point LIBOR will be established. Fair valued security under the procedures approved by the Fund's Board of Trustees. Security exempt from registration under Rule 144A of the Securities Act of 1933. These securities have been deemed liquid under procedures approved by the Fund's Board of Trustees and may normally be sold to qualified institutional buyers in transactions exempt from registration.
Total market value of Rule 144A securities amounts to $6,408,971, which represents approximately 28.43% of net assets as of October 31, 2015. Securities were purchased pursuant to Regulation S under the Securities Act of 1933, which exempts securities offered and sold outside of the United States from registration. Such securities cannot be sold in the United States without either an effective registration statement filed pursuant to the Securities Act of 1933, or pursuant to an exemption from registration. These securities have been deemed liquid under guidelines approved by the Fund's Board of Trustees. As of October 31, 2015 the aggregate market value of those securities was $502,569, representing 2.23% of net assets. Security is in default and therefore is non-income producing. This security has no contractual maturity date, is not redeemable and contractually pays an indefinite stream of interest. All or a portion of the security is pledged as collateral on futures.
The aggregate market value of the collateralized securities totals $79,899 as of October 31, 2015. See Note 3 in Notes to Financial Statements. Portion of Assets in Excess of Liabilities is held as collateral for futures contracts and credit default swap contracts in the amount of $236,123. See Note 3 in the Notes to Financial Statements. Common Abbreviations: aka - Also known as. ASA - Allmennaksjeselskap is the Norwegian term for public limited company. BV - Besloten Vennootschap is the Dutch term for private limited liability company. Conv.
- Convertible. fka - Formerly known as. GmbH - Gesellschaft mit beschränkter Haftungis the German term for limited liability company. Jr. Sub. - Junior Subordinated. LLC - Limited Liability Company. LP - Limited Partnership. Ltd.
- Limited. PIK - Payment in-kind. Pty. - Proprietary. SA - Generally designates corporations in various countries, mostly those employing the civil law. S.a.r.l. - Societe Anonyme a Responsabilite Limitee is the French term for limited liability company. Sec.
- Secured. Sr. Unsec. - Senior Unsecured. Sub.
- Subordinated. For Fund compliance purposes, the Fund's industry classifications refer to any one or more of the industry sub-classifications used by one or more widely recognized market indexes or ratings group indexes, and/or as defined by Fund management. This definition may not apply for purposes of this report, which may combine industry sub-classifications for reporting ease. Industries are shown as a percent of net assets. 80 | October 31, 2015 .
ALPS | Westport Resources Hedged High Income Fund Statement of Investments October 31, 2015 FUTURES CONTRACTS Position Contracts Expiration Date Long Long 1 6 12/22/15 01/01/16 Description CME Ultra Long Term U.S. Treasury Bond Future U.S. 5 Year Treasury Note Future Description 10 Year USD Deliverable Interest Rate Swap Future 5 Year USD Deliverable Interest Rate Swap Future U.S. 10 Year Treasury Note Future U.S. Long Bond Future Value (Note 2) $ $ Position Contracts Expiration Date Short (9) 12/15/15 $ Short Long Short (45) 7 (1) 12/15/15 12/22/15 12/22/15 $ Unrealized Appreciation 159,750 $ 718,641 878,391 $ Value (Note 2) 1,380 427 1,807 Unrealized Depreciation (931,781) $ (4,594,219) 893,813 (156,438) (4,788,625) $ (12,453) (28,954) (2,323) (1,901) (45,631) CREDIT DEFAULT SWAP CONTRACTS Centrally cleared swap TOTAL Buy Credit Notional Clearing House Reference Obligation Protection Amount Intercontinental CDX North American High Exchange Yield Index Series 25 Buy $ 2,000,000 Rate Paid Termination Upfront Unrealized by Fund Date Payment Depreciation 5.00% 12/20/2020 $ (10,975) $ (52,685) $ (10,975) $ (52,685) OUTSTANDING FORWARD FOREIGN CURRENCY CONTRACTS Foreign Currency EUR Contracted Amount* 450,000 Purchase/Sale Contract Sale Settlement Date 11/05/15 Counterparty State Street Bank & Trust Co. State Street Bank & Trust Co. CAD 115,000 Sale 11/05/15 * The contracted amount is stated in the currency in which the contract is denominated. See Notes to Financial Statements. 81 | October 31, 2015 $ Current Value 494,880 $ Unrealized Appreciation/ (Depreciation) $ 10,439 $ 10,439 87,943 $ $ (879) (879) . ALPS | Westport Resources Hedged High Income Fund Statement of Assets and Liabilities October 31, 2015 ASSETS Investments, at value Cash Foreign currency, at value (Cost $32,423) Unrealized appreciation on forward foreign currency contracts Receivable for investments sold Receivable for shares sold Deposit with broker for credit default swap contracts (Note 3) Interest receivable Prepaid expenses and other assets Total Assets $ 19,903,166 2,669,175 32,652 10,439 589,937 25,000 131,368 356,344 6,225 23,724,306 $ 1,093,179 2,242 10,975 5,747 879 17,236 11,903 4,373 5,188 28,398 1,180,120 22,544,186 LIABILITIES Payable for investments purchased Payable for variation margin on centrally cleared swap contracts Payable for upfront premium on centrally cleared swap contracts Payable due to broker for futures contracts Unrealized depreciation on forward foreign currency contracts Investment advisory fees payable Administration and transfer agency fees payable Distribution and services fees payable Professional fees payable Accrued expenses and other liabilities Total Liabilities NET ASSETS NET ASSETS CONSIST OF Paidâ€in capital Accumulated net investment income Accumulated net realized loss on investments, futures contracts, credit default swap contracts and foreign currency transactions Net unrealized depreciation on investments, futures contracts, credit default swap contracts and translation of assets and liabilities denominated in foreign currencies and forward foreign currency contracts NET ASSETS INVESTMENTS, AT COST $ 24,687,160 43,126 (353,377) (1,832,723) $ 22,544,186 $ 21,648,781 See Notes to Financial Statements. 82 | October 31, 2015 . ALPS | Westport Resources Hedged High Income Fund Statement of Assets and Liabilities October 31, 2015 PRICING OF SHARES Class A: Net Asset Value, offering and redemption price per share Net Assets Shares of beneficial interest outstanding (unlimited number of shares, no par value common stock authorized) Maximum offering price per share ((NAV/0.9450), based on maximum sales charge of 5.50% of the offering price) Class C: Net Asset Value, offering and redemption price per share(a) Net Assets Shares of beneficial interest outstanding (unlimited number of shares, no par value common stock authorized) Class I: Net Asset Value, offering and redemption price per share Net Assets Shares of beneficial interest outstanding (unlimited number of shares, no par value common stock authorized) 9.16 3,090,222 337,244 9.69 $ $ 9.16 719,783 78,580 (a) $ $ $ $ 9.16 $ 18,734,181 2,045,334 Redemption price per share may be reduced for any applicable contingent deferred sales charge. For a description of a possible sales charge, please see the Fund's Prospectus. See Notes to Financial Statements. 83 | October 31, 2015 . ALPS | Westport Resources Hedged High Income Fund Statement of Operations For the Year Ended October 31, 2015 INVESTMENT INCOME Interest and other income Total Investment Income $ 1,765,967 1,765,967 EXPENSES Investment advisory fees Administrative fees Transfer agency fees Distribution and service fees Class A Class C Professional fees Networking fees Class I Reports to shareholders and printing fees State registration fees SEC registration fees Insurance fees Custody fees Trustees' fees and expenses Offering costs Miscellaneous expenses Total Expenses Less fees waived/reimbursed by investment advisor (Note 8) Class A Class C Class I Net Expenses Net Investment Income Net realized loss on investments Net realized loss on futures contracts Net realized gain on credit default swap Net realized gain on foreign currency transactions Net change in unrealized depreciation on investments Net change in unrealized depreciation on futures contracts Net change in unrealized depreciation on credit default swap Net change in unrealized appreciation on translation of assets and liabilities denominated in foreign currencies and forward foreign currency contracts See Notes to Financial Statements. 84 | October 31, 2015 8,130 3,221 38,982 968 334 21,125 660 12,451 37,253 699,635 (34,235) (11,798) (191,137) 462,465 1,303,502 (254,089) (149,102) 6,183 13,860 (1,186,926) (15,041) (42,011) 10,342 11,252 37,663 NET REALIZED AND UNREALIZED LOSS ON INVESTMENTS NET DECREASE IN NET ASSETS RESULTING FROM OPERATIONS 447,261 69,858 135 10,485 (1,616,641) $ (313,139) . ALPS | Westport Resources Hedged High Income Fund Statements of Changes in Net Assets For the Period January 1, 2014 (Commencement) to October 31, 2014 For the Year Ended October 31, 2015 OPERATIONS Net investment income Net realized gain/(loss) on investments, futures contracts and foreign currency transactions Net change in unrealized depreciation on investments, futures contracts and translation of assets and liabilities denominated in foreign currencies and forward foreign currency contracts Net Increase/(Decrease) in Net Assets Resulting from Operations $ 1,303,502 $ 774,512 (383,148) 138,936 (1,233,493) (313,139) (599,230) 314,218 DISTRIBUTIONS Dividends to shareholders from net investment income Class A Class C Class I Dividends to shareholders from net realized gains Class A Class C Class I Net Decrease in Net Assets from Distributions (183,098) (54,950) (1,058,483) (17,220) (5,789) (82,396) (1,401,936) (126,416) (45,997) (661,379) – – – (833,792) BENEFICIAL INTEREST TRANSACTIONS (NOTE 6) Shares sold Class A Class C Class I Dividends reinvested Class A Class C Class I Shares redeemed Class A Class C Class I Net Increase/(Decrease) in Net Assets Derived from Beneficial Interest Transactions Net increase/(decrease) in net assets NET ASSETS Beginning of year End of year * *Including accumulated net investment income of: $ $ See Notes to Financial Statements. 85 | October 31, 2015 604,963 – 6,681,709 175,165 60,739 1,123,436 (1,632,559) (844,906) (6,601,183) (432,636) (2,147,711) 24,691,897 22,544,186 $ 43,126 $ 4,376,893 1,732,540 20,102,463 84,424 33,245 450,245 (176,024) (142,172) (1,250,143) 25,211,471 24,691,897 – 24,691,897 10,674 . ALPS | Westport Resources Hedged High Income Fund – Class A Financial Highlights Selected data for a share of beneficial interest outstanding throughout the periods indicated: For the Year Ended October 31, 2015 $9.86 0.54 (0.67) (0.13) (0.53) (0.04) (0.57) (0.70) $9.16 Net investment income(a) Net realized and unrealized loss Total from investment operations DISTRIBUTIONS: From net investment income From net realized gains Total distributions Net (decrease) in net asset value Net asset value, end of year TOTAL RETURN(b) 0.36 (0.14) 0.22 (0.36) – (0.36) (0.14) $9.86 (1.32)% Net asset value, beginning of period INCOME FROM INVESTMENT OPERATIONS: For the Period January 1, 2014 (Commencement) to October 31, 2014 $10.00 2.13% $3,090 3.35% (c) 2.30% (c)(e) (c) 5.66% 91% $4,190 3.64% (c)(d) 2.39% (c)(d) 4.33% (c)(d) 108% RATIOS/SUPPLEMENTAL DATA: Net assets, end of year (000s) Ratio of expenses to average net assets excluding fee waivers and reimbursements Ratio of expenses to average net assets including fee waivers and reimbursements Ratio of net investment income to average net assets Portfolio turnover rate(f) (a) (b) (c) (d) (e) (f) Calculated using the average shares method. Total returns are for the period indicated and have not been annualized. Total returns would have been lower had certain expenses not been waived during the period. Returns shown do not reflect the deduction of taxes that a shareholder would pay on Fund distributions or the redemption of Fund shares. Returns shown exclude any applicable sales charges. Expense ratios before reductions for startup periods may not be representative of longer term operating periods. Annualized. According to the Fund's shareholder services plan with respect to the Fund's Class A shares, any amount of such payment not paid during the Fund's fiscal year for such service activities shall be reimbursed to the Fund as soon as practical after the end of the fiscal year.
Fees were reimbursed to the Fund during the period ended October 31, 2015, for the prior fiscal year in the amount of 0.09% of average net assets of Class A shares. Portfolio turnover rate for periods less than one full year have not been annualized. See Notes to Financial Statements. 86 | October 31, 2015 . ALPS | Westport Resources Hedged High Income Fund – Class C Financial Highlights Selected data for a share of beneficial interest outstanding throughout the periods indicated: For the Year Ended October 31, 2015 $9.85 0.48 (0.67) (0.19) (0.46) (0.04) (0.50) (0.69) $9.16 Net investment income(a) Net realized and unrealized loss Total from investment operations DISTRIBUTIONS: From net investment income From net realized gains Total distributions Net (decrease) in net asset value Net asset value, end of year TOTAL RETURN(b) 0.31 (0.16) 0.15 (0.30) – (0.30) (0.15) $9.85 (1.90)% Net asset value, beginning of period INCOME FROM INVESTMENT OPERATIONS: For the Period January 1, 2014 (Commencement) to October 31, 2014 $10.00 1.51% RATIOS/SUPPLEMENTAL DATA: Net assets, end of year (000s) Ratio of expenses to average net assets excluding fee waivers and reimbursements Ratio of expenses to average net assets including fee waivers and reimbursements Ratio of net investment income to average net assets Portfolio turnover rate(e) (a) (b) (c) (d) (e) $720 4.04% (c) 2.99% (c) 4.98% (c) 91% $1,587 4.25% (c)(d) 2.99% (c)(d) 3.70% (c)(d) 108% Calculated using the average shares method. Total returns are for the period indicated and have not been annualized. Total returns would have been lower had certain expenses not been waived during the period. Returns shown do not reflect the deduction of taxes that a shareholder would pay on Fund distributions or the redemption of Fund shares. Returns shown exclude any applicable sales charges. Expense ratios before reductions for startup periods may not be representative of longer term operating periods. Annualized. Portfolio turnover rate for periods less than one full year have not been annualized. See Notes to Financial Statements. 87 | October 31, 2015 .
ALPS | Westport Resources Hedged High Income Fund – Class I Financial Highlights Selected data for a share of beneficial interest outstanding throughout the periods indicated: For the Year Ended October 31, 2015 $9.85 0.57 (0.66) (0.09) (0.56) (0.04) (0.60) (0.69) $9.16 Net investment income(a) Net realized and unrealized loss Total from investment operations DISTRIBUTIONS: From net investment income From net realized gains Total distributions Net (decrease) in net asset value Net asset value, end of year TOTAL RETURN(b) 0.38 (0.14) 0.24 (0.39) – (0.39) (0.15) $9.85 (0.89)% Net asset value, beginning of period INCOME FROM INVESTMENT OPERATIONS: For the Period January 1, 2014 (Commencement) to October 31, 2014 $10.00 2.38% RATIOS/SUPPLEMENTAL DATA: Net assets, end of year (000s) Ratio of expenses to average net assets excluding fee waivers and reimbursements Ratio of expenses to average net assets including fee waivers and reimbursements Ratio of net investment income to average net assets Portfolio turnover rate(e) (a) (b) (c) (d) (e) $18,734 3.07% (c) 1.99% (c) 5.98% (c) 91% $18,915 3.39% (c)(d) 1.99% (c)(d) 4.59% (c)(d) 108% Calculated using the average shares method. Total returns are for the period indicated and have not been annualized. Total returns would have been lower had certain expenses not been waived during the period. Returns shown do not reflect the deduction of taxes that a shareholder would pay on Fund distributions or the redemption of Fund shares. Expense ratios before reductions for startup periods may not be representative of longer term operating periods. Annualized. Portfolio turnover rate for periods less than one full year have not been annualized. See Notes to Financial Statements. 88 | October 31, 2015 . ALPS | WMC Research Value Fund Management Commentary October 31, 2015 (Unaudited) Market Commentary The twelve month period ended October 31, 2015 was defined by significant volatility in the global markets, causing flat to modest gains for broad market indices, with the S&P 500® Index returning 5.20% and the Russell 1000® Value Index returning 0.53% during the twelveâ€month period. The period began strong as 2014 closed the year on a relative upswing. Accommodative global monetary policy continued to be a central theme. The Bank of Japan expanded its quantitative easing (QE) policy, the People's Bank of China surprised markets with its first rate cut in two years, and the European Central Bank continued to hint of sovereign QE for early 2015. The US Federal Reserve (Fed) helped to support riskier assets after it stated it can be "patient" with regards to starting its policy normalization process. US equities outperformed nonâ€US equities and emerging market equities underperformed their developed market counterparts. Despite the year beginning on a sour note, with January recording the worst monthly return for US stocks in a year, the first quarter of 2015 ended positive. However, earnings sentiment was fairly negative among many investors, in part due to currency headwinds and some accompanying highâ€profile guidance disappointments. The second quarter of 2015 was defined by strong merger and acquisition activity, a rebound in hiring, and solid housing data. May was the secondâ€best month ever for deals involving US companies with US $234 billion in M&A announcements. News of an economic contraction and comments from US Federal Reserve Chair Janet Yellen that equity valuations were "quite high" were not enough to quell bullish sentiment. As the twelveâ€month period came to a close, the markets were marred with volatility caused by geopolitical and macroeconomic conditions. US equities retreated for the first time in eleven quarters during Q3, as the S&P 500 experienced its first correction, a 10% decline from its recent high, since October 2011. The Fed’s statement appeared to spook some investors as it acknowledged that “recent global economic and financial developments may restrain economic activity somewhat and are likely to put further downward pressure on inflation in the near term.” The period ended with US equities rallying in October as the Fed left interest rates unchanged, though changes to its policy statement were more hawkish than expected. Overall, the US economy remained on solid footing, with a sharp rebound in GDP, a sevenâ€year low in unemployment, and a healthy housing market. Within the Russell 1000 Value Index, six of ten sectors posted positive returns during the period, with the health care and consumer discretionary sectors gaining the most. The energy sector declined the most during the period, followed by the materials sector. Fund Review On a grossâ€ofâ€fee basis, the ALPS | WMC Research Value Fund (the “Fund”) outperformed its benchmark, the Russell 1000 Value Index, for the period. During the period, the Fund achieved positive relative results in seven out of the ten broad market sectors. Overall, stock selection was additive relative to the Russell 1000 Value Index, as decisions in the consumer staples, information technology, and consumer discretionary more than offset weaker stock selection in the health care and industrials sectors. Top contributors to relative performance included Newfield Exploration (energy), Lowe’s (consumer discretionary), and Advance Auto Parts (consumer discretionary). Our position in Newfield Exploration, an oil and gas exploration and production company, delivered strong results driven by higherâ€thanâ€estimated domestic production and higher lifting from its assets in China. Lowe’s, a home improvement retailer, contributed to relative performance based on better home improvement trends, dividend growth around 20% per year, and sharpening execution. We eliminated our position in Lowe’s during the period on strength. Our position in Advance Auto Parts, an automotive aftermarket parts and accessories retailer, was helped by their recent acquisition of General Parts. We believe the acquisition will prove to be a transformative move with much greater profit enhancement over time than the market expects. We maintained positions in both Newfield Exploration and Advance Auto Parts at the end of the period. Detractors from relative performance for the period included Halliburton (energy) and General Electric (industrials). Shares of Halliburton, a global oilfield services company, fell during the period amid the precipitous drop in oil prices We believe Halliburton is in a stronger position to recover than many other oil services names if oil prices rise, and coupled with a strong balance sheet and a good management team, we continue to hold our position. An underweight in General Electric detracted from relative performance. Shares of this diversified multinational conglomerate rose after the firm announced a transformational new plan to sell most of GE Capital and essentially become a pureâ€play industrial company. Not owning strong benchmark constituent Pfizer, a large US pharmaceutical company, also detracted from relative performance during the period. Strategy and Outlook The portfolio takes a predominantly bottomâ€up approach to investing, with valueâ€added primarily from stock selection. As a result, we maintain industry neutrality in relation to the benchmark and do not look to add value through sector rotation. At the security level, however, we do take active positions which reflect our outlook for a specific company. Amid the recent market turbulence, our Global Industry Analysts remain focused on fundamental stock selection and believe now is a good time to add to quality names across many sectors. At the end of the period, the portfolio had several large overweight positions in the financials sector. We remain positive on several US banks due to (1) upside to higher rates but relatively good returns if rates stay low, (2) valuations at low levels relative to returns and (3) late innings of regulation/litigation. One stock we were overweight in is Bank of America, a USâ€based bank and financial services provider. We believe Bank of America has more upside from rising US short rates than some of its peers given its $1.1 trillion deposit base and $2.5 trillion in Merrill Lynch assets under custody. Further, 89 | October 31, 2015 . ALPS | WMC Research Value Fund Management Commentary October 31, 2015 (Unaudited) we believe the market underappreciates the company's ability to improve returns on equity through cost reductions associated with the runâ€off business, more efficient underwriting, and an increase in net interest income in the event of rising short term rates. Within energy, we prefer stocks with leverage to rising oil prices and attractive valuations, and believe the recent selloff in the sector is a good opportunity to add to names with access to high quality assets. We view the current oil price as unsustainable, and believe that selfâ€correcting forces are already on their way to rebalance the oil market. A top overweight here was Pioneer Natural Resources, a USâ€based oil and gas exploration company. We believe the opportunity in Pioneer continues to be driven by the market's fixation on shortâ€term results for what we believe is the best longâ€term asset in the industry. Over the next several years we think Pioneer's wells are likely to get better and cost less than they do today. We believe the consumer discretionary sector has some clear fundamental tailwinds for consumers today, including lower fuel prices and improvement in unemployment, wages, and housing. Our stance is that the market as a whole is underappreciating these impacts on many stocks. A name we liked in the retailing segment was Advance Auto Parts, one of the aforementioned top contributors over the period. Sales and margin trends have stabilized and management has indicated that the company should achieve its operating profit target earlier than expected. We continued to own a sizeable position in the portfolio during the period. Effective February 28, 2015 the Fund's Board approved the transition from the Disciplined US Value strategy to the Research Value strategy. Similar to Disciplined US Value, the Research Value approach seeks to achieve longâ€term total return in excess of the Russell 1000 Value Index by investing primarily in value oriented equity securities of US companies, emphasizing those with aboveâ€average potential for capital appreciation. The Research Value approach employs fundamental, bottomâ€up security analysis. The Research Value portfolio consists of multiple subportfolios, each of which is actively managed by one or more of Wellington Management’s Global Industry Analysts. The allocation of assets to the subportfolios corresponds to the relative weights of the analysts' coverage universes within the index. In addition, individual analysts have developed investment frameworks that have proven most relevant to their particular philosophy, process, and industry. Thus, the portfolio combines a blend of investment disciplines, which we believe diversifies investment style risk. The portfolio is rebalanced regularly to maintain industry weights that are close to the index and to maintain style diversification. Cheryl M. Duckworth, CFA Senior Managing Director and Associate Director, Global Industry Research Mark Mandel, CFA Senior Managing Director and Director, Global Industry Research The views of the author and information discussed in this commentary are as of the date of publication, are subject to change, and may not reflect the writer's current views. The views expressed are those of the author only, and represent an assessment of market conditions at a specific point in time, are opinions only and should not be relied upon as investment advice regarding a particular investment or markets in general. Such information does not constitute a recommendation to buy or sell specific securities or investment vehicles. It should not be assumed that any investment will be profitable or will equal the performance of the fund(s) or any securities or any sectors mentioned in this letter.
The subject matter contained in this letter has been derived from several sources believed to be reliable and accurate at the time of compilation. Neither ALPS Advisors, Inc., Wellington Management Company, LLP, nor the Fund accepts any liability for losses either direct or consequential caused by the use of this information. Diversification cannot guarantee gain or prevent losses. 90 | October 31, 2015 . ALPS | WMC Research Value Fund Performance Update October 31, 2015 (Unaudited) Performance of $10,000 Initial Investment (as of October 31, 2015) Comparison of change in value of a $10,000 investment (includes maximum sales charges of 5.50%) $25k $20k S&P 500® Total Return Index - $21,289 $15k Russell 1000® Value Index - $19,226 ALPS | WMC Research Value Fund Class A (NAV) - $18,581 ALPS | WMC Research Value Fund Class A (MOP) - $17,565 $10k 10/31/15 10/31/14 10/31/13 10/31/12 10/31/11 10/31/10 10/31/09 10/31/08 10/31/07 10/31/06 10/31/05 $5k The chart above represents historical performance of a hypothetical investment of $10,000 in the Fund since inception. Past performance does not guarantee future results. This chart does not reflect the deduction of taxes that a shareholder would pay on Fund distributions or the redemption of Fund shares. Average Annual Total Returns (as of October 31, 2015) 6 Month Class A (NAV) Class A (MOP) Class C (NAV) Class C (CDSC) Class I Russell 1000® 1 Value Index S&P 500® Total Return Index2 1 Year 5 Year 10 Year Since Inception Total Expense Ratio What You Pay* â€1.70% 2.57% 12.98% 6.39% 9.74% â€7.14% â€3.07% 11.70% 5.79% 9.60% 1.48% 1.15% â€2.08% 1.87% 12.14% 5.61% 8.93% â€3.06% 0.96% 12.14% 5.61% 8.93% 2.24% 1.90% â€1.59% 2.86% 13.26% 6.63% 9.99% 1.23% 0.90% â€2.29% 0.53% 13.26% 6.75% – 0.77% 5.20% 14.33% 7.85% – Performance data quoted represents past performance. Past performance does not guarantee future results.
Investment return and principal value of an investment will fluctuate so that an investor’s shares, when sold or redeemed, may be worth more or less than the original cost. Current performance data may be higher or lower than actual data quoted. For the most current month-end performance data, please call 1-866-759-5679. Maximum Offering Price (MOP) for Class A shares includes the Fund’s maximum sales charge of 5.50%. Performance shown at NAV does not include these sales charges and would have been lower had it been taken into account.
If you invest $1 million or more, either as a lump sum or through the Fund’s accumulation or letter of intent programs, you can purchase Class A shares without an initial sales charge (load). A Contingent Deferred Sales Charge (“CDSC”) of 1.00% may apply to Class C shares redeemed within the first 12 months after a purchase, and on Class A shares redeemed within the first 18 months after a purchase in excess of $1 million. Performance less than 1 year is cumulative. 91 | October 31, 2015 . ALPS | WMC Research Value Fund Performance Update October 31, 2015 (Unaudited) Performance shown for Class C shares prior to June 30, 2010 reflects the historical performance of the Fund’s Class A shares, calculated using the fees and expenses of Class C shares. Effective February 28, 2015 the Fund changed its name from the ALPS | WMC Disciplined Value Fund to the ALPS | WMC Research Value Fund. The performance shown for the ALPS | WMC Research Value Fund (the “Fund”) for periods prior to August 29, 2009, reflects the performance of the Activa Mutual Funds Trust – Activa Value Fund (as result of a prior reorganization of Activa Mutual Funds Trust – Activa Value Fund into the Fund). 1 The Russell 1000® Value Index measures the performance of those Russell 1000® companies with lower price-to-book ratios and lower forecasted growth values. The index is not actively managed and does not reflect any deduction for fees, expenses or taxes. An investor may not invest directly in an index. 2 The S&P 500® Index is the Standard & Poor’s composite index of 500 stocks, a widely recognized, unmanaged index of common stock prices. The index is not actively managed and does not reflect any deduction for fees, expenses or taxes.
An investor may not invest directly in an index. * What You Pay reflects the Advisor’s decision to contractually limit expenses through February 28, 2017. Please see the prospectus for additional information. The table does not reflect the deduction of taxes that a shareholder would pay on Fund distributions or the redemption of Fund shares. This Fund is not suitable for all investors and is subject to investment risks, including possible loss of the principal amount invested. There is no guarantee that the Fund will continue to hold any one particular security or stay invested in any one particular company. The composition of the Fund's top holdings is subject to change.
Performance figures are historical and reflect the change in share price, reinvested distributions, changes in net asset value, sales charges and capital gains distributions, if any. Not FDIC Insured – No Bank Guarantee – May Lose Value Top Ten Holdings (as a % of Net Assets) † Industry Sector Allocation (as a % of Net Assets) Wells Fargo & Co. Bank of America Corp. Mondelez International, Inc., Class A Medtronic PLC American International Group, Inc. Newfield Exploration Cisco Systems, Inc. Pioneer Natural Resources Co. Microsoft Corp. The PNC Financial Services Group, Inc. Top Ten Holdings 3.52% 3.50% 2.44% 2.09% 2.05% 2.03% 2.01% 1.93% 1.87% 1.86% 23.30% Financials - 32.05% Health Care - 12.52% Energy - 10.68% Information Technology - 10.13% Industrials - 9.33% Utilities - 7.31% Consumer Discretionary - 6.44% Consumer Staples - 6.41% Materials - 3.43% Cash, Cash Equivalents, & Other Net Assets - 1.70% † Holdings are subject to change, and may not reflect the current or future position of the portfolio. Table presents indicative values only. 92 | October 31, 2015 . ALPS | WMC Research Value Fund Statement of Investments October 31, 2015 Value (Note 2) Shares Energy (continued) Cobalt International Energy, Inc.(a) Continental Resources, Inc.(a) Enbridge, Inc. Ensco PLC, Class A EOG Resources, Inc. Forum Energy Technologies, (a) Inc. Halliburton Co. Hess Corp. (a) Newfield Exploration ONEOK, Inc. Pattersonâ€UTI Energy, Inc. Pioneer Natural Resources Co. (a) Southwestern Energy Co. Tesco Corp. TransCanada Corp. COMMON STOCKS (98.30%) Consumer Discretionary (6.44%) Consumer Services (2.02%) Las Vegas Sands Corp. McDonald's Corp. Norwegian Cruise Line Holdings, (a) Ltd. Royal Caribbean Cruises, Ltd. Media (2.47%) Comcast Corp., Class A DreamWorks Animation SKG, Inc., Class A(a) The Interpublic Group of Companies., Inc. Twentyâ€First Century Fox, Inc., Class A Retailing (1.95%) Advance Auto Parts, Inc. The Priceline Group, Inc.(a) 5,310 $ 7,820 262,898 877,795 9,745 619,977 2,060 202,601 1,963,271 20,270 1,269,307 11,420 231,141 6,770 155,236 24,414 749,266 2,404,950 6,386 1,267,174 437 635,503 1,902,677 Consumer Staples (6.41%) Food & Staples Retailing (0.85%) CVS Health Corp. 8,385 6,270,898 828,270 244,992 618,417 927,240 1,975,379 160,442 283,357 1,883,618 161,957 183,920 410,470 10,399,704 202,890 46,725 4,640 3,404,494 1,135,418 556,104 20,120 63,270 1,816,031 3,425,438 10,337,485 478,720 1,230,792 956,750 138,702 2,804,964 6,247,517 Energy (10.68%) Energy (10.68%) Anadarko Petroleum Corp. Cheniere Energy, Inc.(a) Chevron Corp. Household & Personal Products (2.88%) Avon Products, Inc. 118,789 Colgateâ€Palmolive Co. 18,550 The Estee Lauder Companies., Inc., Class A 11,891 Nu Skin Enterprises, Inc., Class A 3,630 TOTAL CONSUMER STAPLES 18,490 16,113 16,496 49,151 4,730 19,030 13,735 14,670 22,990 12,220 Financials (32.05%) Banks (10.61%) Bank of America Corp. Citizens Financial Group, Inc. M&T Bank Corp. The PNC Financial Services Group, Inc. Wells Fargo & Co. Food Beverage & Tobacco (2.68%) Mondelez International, Inc., Class A 51,414 2,373,270 Post Holdings, Inc.(a) 3,750 241,013 2,614,283 670,089 657,854 86,661 215,857 977,831 $ 87,365 19,400 2,030 12,980 11,390 TOTAL ENERGY TOTAL CONSUMER DISCRETIONARY Value (Note 2) Shares 4,480 2,500 5,702 299,622 123,800 518,198 Diversified Financials (6.29%) American Express Co. Ameriprise Financial, Inc. BlackRock, Inc. Invesco, Ltd. MSCI, Inc. Northern Trust Corp. Raymond James Financial, Inc. Santander Consumer USA (a) Holdings, Inc.
Springleaf Holdings, Inc.(a) UBS Group AG WisdomTree Investments, Inc. Insurance (9.65%) Alleghany Corp.(a) The Allstate Corp. American International Group, Inc. Assured Guaranty, Ltd. 93 | October 31, 2015 16,410 5,543 1,580 12,450 6,634 12,920 5,710 1,202,197 639,440 556,113 412,966 444,478 909,439 314,678 61,110 6,130 5,028 8,110 1,100,591 287,558 100,711 155,955 6,124,126 1,210 6,380 600,487 394,794 31,690 56,240 1,998,372 1,543,226 . ALPS | WMC Research Value Fund Statement of Investments October 31, 2015 Value (Note 2) Shares Insurance (continued) The Hartford Financial Services Group, Inc. Marsh & McLennan Companies, Inc. Principal Financial Group, Inc. Prudential Financial, Inc. XL Group PLC Real Estate (5.50%) American Tower Corp. AvalonBay Communities, Inc. Douglas Emmett, Inc. Essex Property Trust, Inc. Extra Space Storage, Inc. Federal Realty Investment Trust Forest City Enterprises, Inc., (a) Class A InfraREIT, Inc. Public Storage SL Green Realty Corp. 18,413 $ 21,230 14,820 8,434 36,360 851,785 1,183,360 743,371 695,805 1,384,589 9,395,789 3,290 6,090 23,990 1,755 3,750 4,634 336,337 1,064,715 732,894 386,872 297,150 664,933 41,093 5,010 1,280 4,670 908,155 119,639 293,709 553,955 5,358,359 Industrials (9.33%) Capital Goods (6.74%) Danaher Corp. Eaton Corp. PLC General Electric Co. Honeywell International, Inc. Illinois Tool Works, Inc. Lockheed Martin Corp. Owens Corning Pentair PLC Raytheon Co. United Technologies Corp. (a) WESCO International, Inc. 31,215,759 Health Care (12.52%) Health Care Equipment & Services (7.96%) Abbott Laboratories 15,980 Becton Dickinson and Co. 2,288 Boston Scientific Corp.(a) 65,720 (a) 8,710 HCA Holdings, Inc. McKesson Corp. 2,841 Medtronic PLC 27,540 St Jude Medical, Inc. 11,920 Stryker Corp. 6,678 UnitedHealth Group, Inc. 8,200 715,904 326,086 1,201,362 599,161 507,971 2,035,757 760,615 638,550 965,796 7,751,202 Pharmaceuticals, Biotechnology & Life Sciences (4.56%) (a) 2,430 174,766 Alkermes PLC (a) Allergan PLC 3,024 932,813 Alnylam Pharmaceuticals, Inc.(a) 2,790 239,800 Bristolâ€Myers Squibb Co. 17,114 1,128,668 Merck & Co., Inc. 30,382 1,660,680 Mylan N.V.(a) 6,840 301,576 4,438,303 TOTAL HEALTH CARE 12,189,505 10,960 5,100 43,340 3,966 3,560 2,276 12,860 4,260 6,216 10,012 4,560 $ 1,022,678 285,141 1,253,393 409,608 327,306 500,333 585,516 238,219 729,758 985,281 223,121 6,560,354 226,888 73,899 265,978 687,850 48,188 59,133 1,361,936 1,960 305,858 Commercial & Professional Services (1.40%) Equifax, Inc. 2,129 Huron Consulting Group, Inc.(a) 1,530 ManpowerGroup, Inc. 2,898 Nielsen N.V. 14,478 Towers Watson & Co., Class A 390 TransUnion(a) 2,300 TOTAL FINANCIALS Value (Note 2) Shares Transportation (1.19%) FedEx Corp. Genesee & Wyoming, Inc., Class (a) A JetBlue Airways Corp.(a) Kansas City Southern Knight Transportation, Inc. Swift Transportation Co.(a) (a) XPO Logistics, Inc. 247,868 70,546 106,760 252,039 75,712 103,267 1,162,050 3,694 2,840 1,290 9,915 4,844 3,720 9,084,340 TOTAL INDUSTRIALS Information Technology (10.13%) Semiconductors & Semiconductor Equipment (2.10%) Avago Technologies, Ltd. 137 16,869 (a) 4,752 271,197 First Solar, Inc.
Intel Corp. 38,751 1,312,109 Micron Technology, Inc.(a) 9,525 157,734 ON Semiconductor Corp.(a) 4,400 48,400 SunEdison Semiconductor, Ltd.(a) 7,960 85,570 SunPower Corp.(a) 5,840 156,745 2,048,624 Software & Services (4.97%) Accenture PLC, Class A 94 | October 31, 2015 1,244 133,357 . ALPS | WMC Research Value Fund Statement of Investments October 31, 2015 Value (Note 2) Shares Software & Services (continued) Alliance Data Systems Corp.(a) Alphabet, Inc., Class A(a) Alphabet, Inc., Class C(a) Automatic Data Processing, Inc. CACI International, Inc., Class (a) A Genpact, Ltd.(a) Global Payments, Inc. Heartland Payment Systems, Inc. Microsoft Corp. SS&C Technologies Holdings, Inc. Visa, Inc., A Shares 585 1,130 417 2,146 $ 227,656 312,228 185,381 1,790 34,683 132,460 1,825,713 6,140 455,281 1,060 82,235 4,844,576 14,837 76,986 1,958,050 926,595 2,976,468 9,869,668 3,460 6,100 5,530 4,220 5,600 4,425 7,223 7,780 237,010 182,573 198,748 299,831 153,216 234,702 373,212 332,128 2,580 839 6,100 1,980 5,150 1,960 710 2,633 239,708 130,171 206,119 83,754 110,983 117,522 189,449 254,295 3,343,421 8,150 7,280 355,992 417,581 Materials (3.43%) Materials (3.43%) Ball Corp. Boise Cascade Co.(a) Cabot Corp. Celanese Corp., Series A CRH PLC, Sponsored ADR Crown Holdings, Inc.(a) The Dow Chemical Co. International Paper Co. LyondellBasell Industries N.V., Class A Martin Marietta Materials, Inc. The Mosaic Co. Nucor Corp. (a) Owensâ€Illinois, Inc. Reliance Steel & Aluminum Co. The Sherwinâ€Williams Co. Vulcan Materials Co. TOTAL MATERIALS Utilities (7.31%) Utilities (7.31%) Ameren Corp. American Water Works Co., Inc. 656,085 399,791 566,757 478,713 379,712 261,433 194,635 1,357,884 466,556 342,319 2,646 29,400 980 109,253 1,078,098 49,970 $ 7,114,779 95,735,591 TOTAL INFORMATION TECHNOLOGY 9,185 4,900 7,930 7,910 13,600 7,990 10,320 13,227 8,737 5,390 TOTAL UTILITIES Technology Hardware & Equipment (3.06%) (a) 230 Arista Networks, Inc. Arrow Electronics, Inc.(a) 1,400 Cisco Systems, Inc. 67,870 QUALCOMM, Inc. 15,594 Utilities (continued) Dominion Resources, Inc. DTE Energy Co. Duke Energy Corp. Edison International Exelon Corp. ITC Holdings Corp. MDU Resources Group, Inc. NextEra Energy, Inc. PG&E Corp. Pinnacle West Capital Corp. Public Service Enterprise Group, Inc. UGI Corp. UIL Holdings Corp. 173,926 833,251 296,408 186,680 2,346 12,600 1,359 Value (Note 2) Shares TOTAL COMMON STOCKS (Cost $88,936,619) 7-Day Yield Value (Note 2) Shares SHORT TERM INVESTMENTS (1.69%) Money Market Fund (1.69%) Morgan Stanley Institutional Liquidity Fund †Prime Portfolio 0.082% 1,643,620 TOTAL SHORT TERM INVESTMENTS (Cost $1,643,620) TOTAL INVESTMENTS (99.99%) (Cost $90,580,239) Other Assets In Excess Of Liabilities (0.01%) NET ASSETS (100.00%) 1,643,620 1,643,620 $ 97,379,211 13,587 $ 97,392,798 (b) (a) (b) Non-Income Producing Security. Includes cash which is being held as collateral for futures contracts in the amount of $46,000. Common Abbreviations: ADR - American Depositary Receipt. AG - Aktiengesellschaft is a German term that refers to a corporation that is limited by shares, i.e., owned by shareholders. Ltd. - Limited. 95 | October 31, 2015 .
ALPS | WMC Research Value Fund Statement of Investments October 31, 2015 N.V. - Naamloze Vennootschap is the Dutch term for a public limited liability corporation. PLC - Public Limited Company. REIT - Real Estate Investment Trust. For Fund compliance purposes, the Fund's industry classifications refer to any one or more of the industry sub-classifications used by one or more widely recognized market indexes or ratings group indexes, and/or as defined by Fund management. This definition may not apply for purposes of this report, which may combine industry sub-classifications for reporting ease. Industries are shown as a percent of net assets. See Notes to Financial Statements. FUTURES CONTRACTS Description S&P 500 Emini Future Position Long Expiration Date 12/21/15 Contracts 10 96 | October 31, 2015 $ $ Value Unrealized (Note 2) Appreciation 1,036,850 $ 55,456 1,036,850 $ 55,456 .
ALPS | WMC Research Value Fund Statement of Assets and Liabilities October 31, 2015 ASSETS Investments, at value Receivable for investments sold Receivable for shares sold Deposit with broker for futures contracts (Note 3) Dividends receivable Prepaid expenses and other assets Total Assets $ 97,379,211 596,713 57,000 46,000 64,559 21,384 98,164,867 $ 617,419 4,650 30,100 62,947 20,268 12,278 13 13,868 10,526 772,069 97,392,798 $ $ 65,051,658 25,486,712 6,854,428 97,392,798 LIABILITIES Payable for investments purchased Payable for variation margin on futures contracts Payable for shares redeemed Investment advisory fees payable Administration and transfer agency fees payable Distribution and services fees payable Trustees' fees and expenses payable Professional fees payable Accrued expenses and other liabilities Total Liabilities NET ASSETS NET ASSETS CONSIST OF Paidâ€in capital Accumulated net realized gain on investments and futures contracts Net unrealized appreciation on investments, futures contracts NET ASSETS INVESTMENTS, AT COST PRICING OF SHARES $ 90,580,239 Class A: Net Asset Value, offering and redemption price per share Net Assets Shares of beneficial interest outstanding (unlimited number of shares, no par value common stock authorized) Maximum offering price per share ((NAV/0.9450), based on maximum sales charge of 5.50% of the offering price) Class C: Net Asset Value, offering and redemption price per share(a) Net Assets Shares of beneficial interest outstanding (unlimited number of shares, no par value common stock authorized) Class I: Net Asset Value, offering and redemption price per share Net Assets Shares of beneficial interest outstanding (unlimited number of shares, no par value common stock authorized) $ $ $ $ $ (a) 11.32 870,034 76,869 11.57 55,608,171 4,804,911 12.24 $ 11.75 $ 40,914,593 3,483,172 Redemption price per share may be reduced for any applicable contingent deferred sales charge. For a description of a possible sales charge, please see the Fund's Prospectus. See Notes to Financial Statements. 97 | October 31, 2015 . ALPS | WMC Research Value Fund Statement of Operations For the Year Ended October 31, 2015 INVESTMENT INCOME Dividends Foreign taxes withheld on dividends Total Investment Income $ 1,982,623 (5,384) 1,977,239 EXPENSES Investment advisory fees Administrative fees Transfer agency fees Distribution and service fees Class A Class C Professional fees Reports to shareholders and printing fees State registration fees SEC registration fees Insurance fees Custody fees Trustees' fees and expenses Miscellaneous expenses Total Expenses Less fees waived/reimbursed by investment advisor (Note 8) Class A Class C Class I Net Expenses Net Investment Income Net realized gain on investments Net realized gain on futures contracts Net realized gain distributions from other investment companies Net change in unrealized depreciation on investments Net change in unrealized appreciation on futures contracts See Notes to Financial Statements. 98 | October 31, 2015 145,892 11,456 23,475 10,421 48,377 169 1,230 14,738 2,308 12,807 1,425,901 NET REALIZED AND UNREALIZED GAIN ON INVESTMENTS NET INCREASE IN NET ASSETS RESULTING FROM OPERATIONS 972,834 160,111 22,083 $ (51,771) (1,084) (38,056) 1,334,990 642,249 28,988,753 103,218 15,732 (26,973,905) 55,456 2,189,254 2,831,503 . ALPS | WMC Research Value Fund Statements of Changes in Net Assets For the Fiscal Period Ended October 31, 2014(b) For the Year Ended October 31, 2015(a) For the Year Ended April 30, 2014 OPERATIONS Net investment income Net realized gain on investments, futures contracts Net realized gain distributions from other investment companies Net change in unrealized appreciation/(depreciation) on investments, futures contracts Net Increase in Net Assets Resulting from Operations $ 642,249 $ 29,091,971 15,732 310,060 $ 5,958,826 – (26,918,449) 2,831,503 (874,500) 5,394,386 612,825 6,559,877 13,515 12,117,145 19,303,362 DISTRIBUTIONS Dividends to shareholders from net investment income Class A Class C Class I Dividends to shareholders from net realized gains Class A Class C Class I Net Decrease in Net Assets from Distributions (280,500) (1,366) (222,337) (5,704,627) (35,924) (4,142,646) (10,387,400) – – – – – – – (528,474) (670) (470,800) (642,398) (1,397) (488,619) (2,132,358) BENEFICIAL INTEREST TRANSACTIONS (NOTE 6) Shares sold Class A Class C Class I Dividends reinvested Class A Class C Class I Shares redeemed Class A Class C Class I Net Increase/(Decrease) in Net Assets Derived from Beneficial Interest Transactions Net increase/(decrease) in net assets NET ASSETS Beginning of year End of year * *Including accumulated net investment income/(loss) of: (a) (b) $ $ 1,824,143 1,632,083 3,318,615 5,488,048 19,609 4,362,161 (6,874,850) (1,003,097) (7,204,797) 1,561,915 (5,993,982) 103,386,780 97,392,798 (0) 154,740 114,228 1,715,713 – – – (2,625,164) – (5,297,693) (5,938,176) (543,790) 103,930,570 $ 103,386,780 $ 214,377 $ $ 2,472,682 28,068 5,245,365 1,120,556 2,067 958,847 (4,195,516) (16,613) (8,515,750) (2,900,294) 14,270,710 89,659,860 103,930,570 (138,735) Effective February 28, 2015 the Fund changed its name from the ALPS | WMC Disciplined Value Fund to the ALPS | WMC Research Value Fund. Effective May 1, 2014, the Board approved changing the fiscal year-end of the Funds from April 30 to October 31. See Notes to Financial Statements. 99 | October 31, 2015 . ALPS | WMC Research Value Fund – Class A Financial Highlights Selected data for a share of beneficial interest outstanding throughout the periods indicated: For the Year Ended October 31, 2015(a) $12.54 For the Year Ended April 30, 2014 $10.01 For the Year Ended April 30, 2013(c) $8.42 For the Year Ended April 30, 2012 $8.64 For the Year Ended April 30, 2011(d) $7.43 0.06 0.23 0.29 (0.06) (1.20) (1.26) (0.97) $11.57 0.03 0.59 0.62 – – – 0.62 $12.54 0.06 2.09 2.15 (0.11) (0.13) (0.24) 1.91 $11.92 0.08 1.61 1.69 (0.10) – (0.10) 1.59 $10.01 0.06 (0.23) (0.17) (0.05) – (0.05) (0.22) $8.42 0.06 1.22 1.28 (0.07) – (0.07) 1.21 $8.64 2.57% Net asset value, beginning of period For the Fiscal Period Ended October 31, 2014(b) $11.92 5.20% 21.70% 20.17% (1.81)% 17.34% $59,628 $59,069 $50,142 $44,989 $48,899 INCOME/(LOSS) FROM INVESTMENT OPERATIONS: Net investment income(e) Net realized and unrealized gain/(loss) Total from investment operations DISTRIBUTIONS: From net investment income From net realized gains Total distributions Net increase/(decrease) in net asset value Net asset value, end of year TOTAL RETURN(f) RATIOS/SUPPLEMENTAL DATA: Net assets, end of year (000s) $55,608 Ratio of expenses to average net assets excluding fee waivers and 1.49% reimbursements Ratio of expenses to average net assets including fee waivers and reimbursements 1.40% Ratio of net investment income to average net assets 0.53% (h) 114% Portfolio turnover rate (a) (b) (d) (c) (e) (f) (g) (h) 1.48% (g) 1.51% 1.58% 1.71% 1.40%(g) 1.47% 1.40% 1.40% 1.40% 1.40% 0.48%(g) 13% 0.52% 19% 0.95% 34% 0.83% 46% 0.77% 44% Effective February 28, 2015 the Fund changed its name from the ALPS | WMC Disciplined Value Fund to the ALPS | WMC Research Value Fund. Effective May 1, 2014, the Board approved changing the fiscal year-end of the Funds from April 30 to October 31. Prior to August 31, 2012, the ALPS | WMC Disciplined Value Fund was known as the ALPS | WMC Value Intersection Fund. Prior to August 31, 2010, the ALPS | WMC Value Intersection Fund was known as the Activa Value Fund (as a result of the reorganization of Activa Mutual Funds Trust - Activa Value Fund into the fund). Calculated using the average shares method. Total returns are for the period indicated and have not been annualized. Total returns would have been lower had certain expenses not been waived during the period. Returns shown do not reflect the deduction of taxes that a shareholder would pay on Fund distributions or the redemption of Fund shares. Returns shown exclude any applicable sales charges. Annualized. Portfolio turnover rate for periods less than one full year have not been annualized. See Notes to Financial Statements. 100 | October 31, 2015 .
ALPS | WMC Research Value Fund – Class C Financial Highlights Selected data for a share of beneficial interest outstanding throughout the periods indicated: For the Year Ended October 31, 2015(a) $12.36 For the Year Ended April 30, 2014 $9.93 For the Year Ended April 30, 2013(c) $8.39 For the Year Ended April 30, 2012 $8.62 For the Period July 2, 2010 (Inception) to April 30, 2011(d) $6.40 (0.03) 0.24 0.21 (0.05) (1.20) (1.25) (1.04) $11.32 (0.02) 0.58 0.56 – – – 0.56 $12.36 (0.02) 2.08 2.06 (0.06) (0.13) (0.19) 1.87 $11.80 0.02 1.57 1.59 (0.05) – (0.05) 1.54 $9.93 (0.01) (0.20) (0.21) (0.02) – (0.02) (0.23) $8.39 (0.01) 2.27 2.26 (0.04) – (0.04) 2.22 $8.62 1.87% 4.75% 20.97% 19.07% (2.45)% 35.44% $870 Net asset value, beginning of period For the Fiscal Period Ended October 31, 2014(b) $11.80 $257 $133 $100 $79 $14 INCOME/(LOSS) FROM INVESTMENT OPERATIONS: Net investment income/(loss)(e) Net realized and unrealized gain/(loss) Total from investment operations DISTRIBUTIONS: From net investment income From net realized gains Total distributions Net increase/(decrease) in net asset value Net asset value, end of year TOTAL RETURN(f) RATIOS/SUPPLEMENTAL DATA: Net assets, end of year (000s) Ratio of expenses to average net assets excluding fee waivers and reimbursements Ratio of expenses to average net assets including fee waivers and reimbursements Ratio of net investment income/(loss) to average net assets (h) Portfolio turnover rate 2.24% (a) (b) (d) (c) (e) (f) (g) (i) (h) 2.22% 2.26% 2.38% 2.49% (g) 2.15% 2.24% (g) 2.15%(g) 2.15% 2.15% 2.15% 2.15%(g) (0.23)% 19% 0.19% 34% (0.16)% 46% (0.22)% 114% (0.30)%(g) 13% (0.09)%(g) 44%(i) Effective February 28, 2015 the Fund changed its name from the ALPS | WMC Disciplined Value Fund to the ALPS | WMC Research Value Fund. Effective May 1, 2014, the Board approved changing the fiscal year-end of the Funds from April 30 to October 31. Prior to August 31, 2012, the ALPS | WMC Disciplined Value Fund was known as the ALPS | WMC Value Intersection Fund. Prior to August 31, 2010, the ALPS | WMC Value Intersection Fund was known as the Activa Value Fund (as a result of the reorganization of Activa Mutual Funds Trust - Activa Value Fund into the fund). Calculated using the average shares method. Total returns are for the period indicated and have not been annualized. Total returns would have been lower had certain expenses not been waived during the period. Returns shown do not reflect the deduction of taxes that a shareholder would pay on Fund distributions or the redemption of Fund shares. Returns shown exclude any applicable sales charges. Annualized. Portfolio turnover rate for periods less than one full year have not been annualized. Portfolio turnover rate is calculated at the Fund Level and represents the year ended April 30, 2011. See Notes to Financial Statements. 101 | October 31, 2015 .
ALPS | WMC Research Value Fund – Class I Financial Highlights Selected data for a share of beneficial interest outstanding throughout the periods indicated: For the Year Ended October 31, 2015(a) $12.69 For the Year Ended April 30, 2014 $10.10 For the Year Ended April 30, 2013(c) $8.49 For the Year Ended April 30, 2012 $8.71 For the Year Ended April 30, 2011(d) $7.48 0.09 0.23 0.32 (0.06) (1.20) (1.26) (0.94) $11.75 0.05 0.59 0.64 – – – 0.64 $12.69 0.09 2.12 2.21 (0.13) (0.13) (0.26) 1.95 $12.05 0.11 1.61 1.72 (0.11) – (0.11) 1.61 $10.10 0.09 (0.24) (0.15) (0.07) – (0.07) (0.22) $8.49 0.07 1.24 1.31 (0.08) – (0.08) 1.23 $8.71 2.86% Net asset value, beginning of period For the Fiscal Period Ended October 31, 2014(b) $12.05 5.31% 22.11% 20.43% (1.62)% 17.67% $43,502 $44,729 $39,417 $34,636 $29,251 INCOME/(LOSS) FROM INVESTMENT OPERATIONS: Net investment income(e) Net realized and unrealized gain/(loss) Total from investment operations DISTRIBUTIONS: From net investment income From net realized gains Total distributions Net increase/(decrease) in net asset value Net asset value, end of year TOTAL RETURN(f) RATIOS/SUPPLEMENTAL DATA: Net assets, end of year (000s) $40,915 Ratio of expenses to average net assets excluding fee waivers and 1.24% reimbursements Ratio of expenses to average net assets including fee waivers and reimbursements 1.15% Ratio of net investment income to average net assets 0.78% (h) 114% Portfolio turnover rate (a) (b) (d) (c) (e) (f) (g) (h) 1.23% (g) 1.26% 1.33% 1.46% 1.15%(g) 1.22% 1.15% 1.15% 1.15% 1.15% 0.74%(g) 13% 0.77% 19% 1.20% 34% 1.08% 46% 0.95% 44% Effective February 28, 2015 the Fund changed its name from the ALPS | WMC Disciplined Value Fund to the ALPS | WMC Research Value Fund. Effective May 1, 2014, the Board approved changing the fiscal year-end of the Funds from April 30 to October 31. Prior to August 31, 2012, the ALPS | WMC Disciplined Value Fund was known as the ALPS | WMC Value Intersection Fund. Prior to August 31, 2010, the ALPS | WMC Value Intersection Fund was known as the Activa Value Fund (as a result of the reorganization of Activa Mutual Funds Trust - Activa Value Fund into the fund). Calculated using the average shares method. Total returns are for the period indicated and have not been annualized. Total returns would have been lower had certain expenses not been waived during the period. Returns shown do not reflect the deduction of taxes that a shareholder would pay on Fund distributions or the redemption of Fund shares. Annualized. Portfolio turnover rate for periods less than one full year have not been annualized. See Notes to Financial Statements. 102 | October 31, 2015 . Clough China Fund Management Commentary October 31, 2015 (Unaudited) The Clough China Fund’s (the “Fund”) Class A NAV fell â€3.49% for the fiscal year ended on October 31, 2015, while the MSCI China Index fell â€0.70%. Market Review This was a volatile year for Chinese stocks. Markets soared about 30% in the first half until April 2015 before losing more than 25% in the second half between May and the end of October. The initial rally was liquidity driven as investors began to discount lower interest rates after the first interest rate cut in November 2014 when the central bank (PBOC) relaxed its policy stance from “neutral” to active easing. The rally accelerated with the launch of the Hong Kong†Shanghai Connect system which opened both domestic and Hong Kong equity markets to biâ€directional, cross border investment. That attracted mainland Chinese investors to Hong Kong listed stocks which were much less expensive than Chinese stocks listed in Shanghai and Shenzhen. Investor enthusiasm eventually drove stocks to excessive valuations, particularly on the mainland bourses where the strong rally was at least partially driven by a steep rise in margin borrowing. Leveraged stock purchases reached unsustainable levels, leading market authorities to intervene to curb speculation. Curbs on margin lending contributed to a market reversal and the subsequent correction was almost as violent as the prior rally. Further interest rate cuts and commercial banks’ reserve requirements cuts by the Central Bank did not interrupt the fall until the margin leverage was cleared. This was only made possible by supportive policy measures being adopted by the PBOC, The China Securities Regulatory Commission and the Ministry of Finance. Together, these “Three Musketeers” created stock purchase vehicles and the major brokerage firms joined their efforts to calm down panicked individual investors in July. Just as markets looked to have reached a bottom and had started to stabilize, the PBOC surprised everybody on August 11th by announcing an 1.8% depreciation of the Chinese currency reference rate against the US dollar. This unexpected and unexplained decision spread questions and investor sentiment turned sharply lower once again. Share prices continued to dive until the beginning of September. From the top at the end of April to the trough on September 4th, the MSCI China index fell 35%. Meanwhile, international investors remained skeptical about the macroeconomic scenario as China’s growth continued to weaken gradually and monthly indicators of fixed asset investments, industrial production and global trade did not show any sign of improvement. Gross Domestic Product (GDP) growth has slowed from 7.4% last year to 6.9% for the first nine months 2015. Industrial production growth has decelerated from 7.9% last December to 5.7% in September. Fixed asset investments, up 15.7% last year have risen just 10.3% through the first nine months of 2015. Chinese exports are under pressure due to softer international demand and imports are now declining due partly to lower energy and commodity prices, whereas they were up 2 – 3% in 2014. Deflationary pressures persist given weak growth both domestically and abroad and excessive industrial capacity. Indeed, the producer price index (PPI) has been in negative territory for more than 30 months, hurting corporate profits and margins. However, as negative as they are, this data tells only part of the story. They do not mean that everything is going down in China and they certainly don’t signal a hard landing. These developments reflect the changing nature of China’s economic structure and landscape with a shift in the growth drivers far away from industrial engines towards consumption and services. The services sector reached 49.5% of GDP in the first half of 2015, up from 47.4% a year ago (and 44.3% in 2011) and it expanded by 8.4% in real term in the third quarter – versus a 6% increase for manufacturing. Household income continues to gain share in national income. Retail sales, that gained 10.7% over the first 2 months of this year are still up 10.6% over 10 months and accelerated to 11% growth in October, helped by a reacceleration in auto sales. While the manufacturing PMI (purchasing managers’ index) has declined below 50 since last August – signaling a contraction of the manufacturing sector – the nonâ€manufacturing PMI is still healthy above 53. Money supply (M2) remains reasonably strong, picking up 13.5% in October, from 12.2% last December. The widening gap between the different components of the economy is reflected in their diverging earnings trends. The market is a twoâ€tier market. From an industry perspective, the securities, insurance, airlines, media, and environmental services sectors are reporting faster earnings growth than the steel, building materials, oil and gas and coal sectors, whose earnings are actually falling. In the first eight months of this year, total profits of industrial enterprises fell 1.9% yearâ€overâ€year. However, the picture was very much contrasted between two camps. While profits in coal mining plunged 64.9% and ferrous metal smelting company earnings fell 51.6%, profits jumped 13.2% in the pharmaceutical equipment, 29.3% in water treatment, 13.9% in telecoms, and 12% in electrical equipment sectors1. Portfolio Composition Over the last twelve months, the best contributors to the Fund’s return were Tencent, CRRC and Man Wah. Tencent is the largest weighting in the MSCI China Index and has been the largest holding in the Fund for a number of years now. It is a privately owned group, founded in 1998 and listed in Hong Kong since 2004. Tencent is a leading provider of premium messaging services, Internet value added services and online games. It is highly profitable, with a return on equity (ROE) above 30% and a 30% net profit margin. Its balance sheet is very strong with a net cash position. Recently reported third quarter earnings showed revenue up 34%, boosted by mobile games and advertising (up 102% yearâ€overâ€year) and earnings per share surged 31% higher. Their instant messenger service, known as “QQ”, has the largest online community base with more than 800 million active users. Tencent is expanding into mobile payments and its powerful ecosystem continues to expand via cooperation with strategic partners. CRRC is China’s only rolling stock manufacturer, formed from the merger of two previously competing companies, CSR and CNR in June 2015. It manufactures railway equipment, locomotives, high speed trains and freight wagons. The share price surged in 103 | October 31, 2015 . Clough China Fund Management Commentary October 31, 2015 (Unaudited) December 2014 and again in April 2015 when details and terms of the merger were announced, on high expectations of cost savings synergy to be realized after the merger. The stock is no longer in the portfolio as its valuation appeared to have discounted more of the earnings upside potential. Established in 1992, Man Wah is the leading motion recliner sofa manufacturer in China where its brand Cheers holds a 29.2% market share, while it is number three in the USA with a 10.2% market share. It is also a privatelyâ€owned company operating four production facilities in mainland China. It’s most recent results – for the first half of their fiscal year 2016 – show revenue up 15.1% and core profits grew 21%. Man Wah's financial position is very healthy with net cash on the balance sheet, 22% ROE and a 17% net profit margin. On the other hand, the major detractors on the Fund’s performance were Sinotrans, China Fiber Optic System and CNOOC. Sinotrans is one of the largest logistic service providers in China, covering multiple segments of the supply chain; freight forwarding, logistics, storage and other related businesses. Its 63% subsidiary Sinoair holds a very profitable 50/50 joint venture with DHL. Sinotrans has transformed itself over the years to become a more dynamic group than in the past, for instance by disposing of their lossâ€making marine segment. It is a Stateâ€owned group. The share price was pressured several times this year by disappointing earnings releases. The Fund had trimmed the size of the holding, but is maintaining a position as this group is a target of the reform policy on Stateâ€owned enterprises, which should improve its fundamental quality and earnings outlook. We expect better days for Sinotrans if a successful restructuring is achieved. As China’s largest offshore oil explorer and producer, CNOOC suffered from falling oil prices. The stock was sold out at the end of August and is no longer in the portfolio. The same observation applies to China Fiber Optic, a manufacturer of fiber optic patch cords for telecom operators that was sold out at the end of July. Outlook We expect China to continue to transform and to transition from the old “workshop of the world” model towards a more consumption†driven economy. It is worth highlighting that Chinese consumers are also among the major actors of these changes. Consumption patterns in China are changing faster than ever; becoming a very dynamic area where new products and new segments are enjoying very strong growth. One of the best examples of this is the spectacular rise of eâ€commerce. Over 361 million internet users (56% of the total) 2 shopped online in 2014 . Eâ€commerce continued to boom this year as online sales of goods and services jumped 35% in the first ten months of 2015. Online sales of physical goods now account for around 10% of total retail sales – higher than the 6.8% proportion recorded in the United States. Another example is the takeoff experienced in leisure and entertainment spending. China's movie box office garnered a 48% increase in revenue over the last 12 months3. China is expected to become the world’s largest movie market by 2017, overtaking the 4 massive US market in box office revenues . The deep changes in Chinese consumers’ lifestyle are entrenched in the fast urbanization of the country. These developments create new investment opportunities not only in ecommerce and entertainment but also in sportswear, travel (airline passenger traffic increased 15% on the first nine months of 2015), insurance, healthcare and environmental services. Of course, mobile communications plays a key role in efficiently opening many of these markets. Online gaming, messaging services, online to offline (O2O) transactions are being driven by the rapid build out and deployment of 4G mobile data networks. The number of 4G mobile subscribers is rising very rapidly, with more than 20 million new highâ€speed data subscribers added every month. 4G penetration has now reached 302.4 million people, or 23.3% of the total number of mobile 5 subscribers through October 2015. There is a “New China” emerging with rapid growth, while the “Old China” of heavy industry, construction, and traditional retail networks slow down or even decline in relevance, as it was highlighted in the profitability divergences above in the first part of this report. Beijing has released its first communications of the recently approved 13th Five Year Plan which covers the years 2016 to 2020. The policy initiative from Beijing shows a target of at least 6.5% economic growth over the next five years in order to achieve the goal of “moderately prosperous society” with growth dividends to be shared by all citizens. This growth strategy is squarely focused on helping to improve the quality of life of China's citizens which, of course, will help to boost household consumption. The government also placed a high priority on green and ecoâ€friendly growth and on education, the establishment of a more equitable healthcare and social security systems and finally announced that it is abandoning the oneâ€child policy introduced 36 years ago to allow all couples to have two children6. The relaxation of the oneâ€child policy intends to address and hopefully turn around China’s demographic challenge. It may not have as strong an impact as hoped. For instance, a partial relaxation of this policy in November 2013 had actually very modest results with only 5% of qualified couples following the new rule and having a second child by the end of 2014. So if we applied the same 5% to the current number of couples who can have a second child, it implies the number of new births could reach 3 million per year, or a 17.7% increase from the 16.9mn 7 new babies born in 2014 . This may not look huge and the policy will not have a material impact on China’s labor force profile before two decades. However, assuming an average Rmb 30,000 annual spending to raise a child, this leads to some additional private consumption anyway. If the government later decides to provide financial support and better social security assistance to families, it will help the new policy to be much more efficient. Two movements converge at the same time to push in the new direction: bottom up, the society is changing fast; top down, the policy is backing the changes and goes along with them. There is no turnaround. People are no longer workers first – they are consumers first. China has fortunately built massive infrastructure in the last thirty years. The people are moving from builders of infrastructure 104 | October 31, 2015 . Clough China Fund Management Commentary October 31, 2015 (Unaudited) to users of the roads, high speed rail, buses and airports. This, again, creates new investment opportunities. As China transforms, so do Chinese equity markets and market indices. MSCI recently announced the inclusion of fourteen New Yorkâ€listed Chinese ADRs effective on November 30. This is merely recognizing the rising importance taken by these eâ€commerce and internet sectors in the real economy. Technologyâ€related stocks will account for 24% of your China Fund benchmark vs. 14% last month. On the other hand, the weighting of all financials will fall from 42 to 37%. Also note the weightings of New Economy and private sector companies will rise again next May since their inclusion takes place in two steps. In turn, the influence and importance of Stateâ€owned enterprises (SOEs) and Old Economy stocks will continue to wane. When investors stop focusing and obsessing on the surface of the slowdown of China’s GDP growth in volume and start looking a bit more in depth at the changes in the nature of GDP growth, we believe that they will find reasons for optimism in the new growth engines and investment themes. Our view is that China’s fundamentals are not as dangerous as the volatility of markets. That is where Beijing's economic reform agenda must continue to focus. A successful rebalancing requires the growth of financial markets which will be the key driver of funding the private sector led growth model. This is staunchly different than the bankâ€fund SOE led growth model of the past. The recommendation of the IMF to include the Chinese currency in Special Drawing Rights (SDR) likely at the end of November 2015 will encourage the Chinese government to continue to reform the financial system, which includes initiatives to establish a sustainable and healthy stock market. While some fret over the value of the Chinese Yuan exchange rate in the near term, China's growth prospects combined with Beijing's continued reform agenda is like to surprise on the upside and a stronger Yuan could emerge over the intermediate to longâ€term. Francoise Vappereau, Coâ€Portfolio Manager Eric Brock, Coâ€Portfolio Manager Sources: 1 BBG and Citics Secs : Mining dragged down the growth. 26 Sept 2015. 2 CICC China Consumer Sector. 6 Nov 2015, p.6. 3 Bernstein: Strategy Blast, Nov 13, 2015. 4 Nomura, Sept 7, 2015: China Movie. 5 Ministry of Industry and Information Technology. 6 Barclays: China, Fifth Plenum emphasizes social spending and green growth; two-child policy adopted. Oct 30, 2015 + Nomura Economics. Oct 29, 2015. 7 Morgan Stanley: China: How many Babies? Oct 30, 2015. Investments in international and emerging markets securities include exposure to risks such as currency fluctuations, foreign taxes and regulations, and the potential for illiquid markets and political instability. The views of the author and information discussed in this commentary are as of the date of publication, are subject to change, and may not reflect the writer's current views.
The views expressed are those of the author only, and represent an assessment of market conditions at a specific point in time, are opinions only and should not be relied upon as investment advice regarding a particular investment or markets in general. Such information does not constitute a recommendation to buy or sell specific securities or investment vehicles. It should not be assumed that any investment will be profitable or will equal the performance of the fund(s) or any securities or any sectors mentioned in this letter.
The subject matter contained in this letter has been derived from several sources believed to be reliable and accurate at the time of compilation. Neither ALPS, Advisors, Inc., Clough Capital Partners, LP, nor the Fund accepts any liability for losses either direct or consequential caused by the use of this information. 105 | October 31, 2015 . Clough China Fund Performance Update October 31, 2015 (Unaudited) Performance of $10,000 Initial Investment (as of October 31, 2015) Comparison of change in value of a $10,000 investment (includes maximum sales charges of 5.50%) $40k $35k Clough China Fund Class A (NAV) - $29,379 Clough China Fund Class A (MOP) - $27,769 MSCI China Index - $27,493 $30k $25k $20k $15k $10k 10/31/15 10/31/14 10/31/13 10/31/12 10/31/11 10/31/10 10/31/09 10/31/08 10/31/07 10/31/06 12/30/05^ $5k The chart above represents historical performance of a hypothetical investment of $10,000 in the Fund since inception. Past performance does not guarantee future results. This chart does not reflect the deduction of taxes that a shareholder would pay on Fund distributions or the redemption of Fund shares. Average Annual Total Returns (as of October 31, 2015) 6 Month 1 Year 3 Year 5 Year Since Inception^ Total Expense Ratio What You Pay* Class A (NAV) â€20.89% â€3.49% 7.01% 2.22% 11.58% Class A (MOP) â€25.24% â€8.80% 5.00% 1.07% 10.94% 2.06% 1.95% Class C (NAV) â€21.19% â€4.25% 6.21% 1.45% 10.75% Class C (CDSC) â€21.97% â€5.16% 6.21% 1.45% 10.75% 2.87% 2.70% Class I 1 â€20.57% â€2.99% 7.43% 2.55% 12.06% MSCI China Index2 â€23.38% â€0.70% 4.91% 0.98% 10.83% 1.82% 1.70% Performance data quoted represents past performance. Past performance does not guarantee future results.
Investment return and principal value of an investment will fluctuate so that an investor’s shares, when sold or redeemed, may be worth more or less than the original cost. Current performance data may be higher or lower than actual data quoted. For the most current month-end performance data, please call 1-866-759-5679. Maximum Offering Price (MOP) for Class A shares includes the Fund’s maximum sales charge of 5.50%. Performance shown at NAV does not include these sales charges and would have been lower had it been taken into account.
If you invest $1 million or more, either as a lump sum or through the Fund’s accumulation or letter of intent programs, you can purchase Class A shares without an initial sales charge (load). A Contingent Deferred Sales Charge (“CDSC”) of 1.00% may apply to Class C shares redeemed within the first 12 months after a purchase, and on Class A shares redeemed within the first 18 months after a purchase in excess of $1 million. The Fund imposes a 2.00% redemption fee on shares held for less than 30 days. Performance less than 1 year is cumulative. The performance shown for the Clough China Fund for periods prior to January 15, 2010, reflects the performance of the Old Mutual China Fund, a series of Old Mutual Funds I (as a result of a prior reorganization of the Old Mutual China Fund into the Clough China Fund). 1 Prior to close of business on January 15, 2010, Class I was known as Institutional Class of the Old Mutual China Fund. 106 | October 31, 2015 .
Clough China Fund Performance Update October 31, 2015 (Unaudited) 2 The Morgan Stanley Capital International (“MSCI”) China Index is constructed according to the MSCI Global Investable Market Index (GIMI) family. The MSCI China Index is part of the MSCI Emerging Markets Index. The index is not actively managed and does not reflect any deduction for fees, expenses or taxes. An investor may not invest directly in an index. ^ Fund Inception date of December 30, 2005. * What You Pay reflects the Advisor’s decision to contractually limit expenses through February 29, 2016.
Please see the prospectus for additional information. The table does not reflect the deduction of taxes that a shareholder would pay on Fund distributions or the redemption of Fund shares. This Fund is not suitable for all investors and is subject to investment risks, including possible loss of the principal amount invested. There is no guarantee that the Fund will continue to hold any one particular security or stay invested in any one particular company. The composition of the Fund's top holdings is subject to change. Performance figures are historical and reflect the change in share price, reinvested distributions, changes in net asset value, sales charges and capital gains distributions, if any. Not FDIC Insured – No Bank Guarantee – May Lose Value Investing in China, Hong Kong and Taiwan involves risk and considerations not present when investing in more established securities markets.
The Fund may be more susceptible to the economic, market, political and local risks of these regions than a fund that is more geographically diversified. Top Ten Holdings (as a % of Net Assets) † Industry Sector Allocation (as a % of Net Assets) China Mobile, Ltd. Tencent Holdings, Ltd. China Construction Bank Corp., Class H Ping An Insurance Group Co. of China, Ltd., Class H Industrial & Commercial Bank of China, Ltd., Class H Bank of China, Ltd., Class H Byd Co., Ltd., Class H Sinopharm Group Co., Ltd., Class H China Petroleum & Chemical Corp., Class H Pacific Textile Holdings, Ltd. Top Ten Holdings Financials - 28.29% Consumer, Cyclical - 19.13% Communications - 14.48% Technology - 12.12% Industrials - 8.84% Consumer, Non-cyclical - 4.97% Energy - 3.79% Utilities - 0.87% Consumer Discretionary - 0.72% Cash, Cash Equivalents & Other Net Assets - 6.79% 10.14% 10.14% 7.12% 5.26% 4.92% 4.51% 2.47% 2.42% 2.36% 2.34% 51.68% † Holdings are subject to change, and may not reflect the current or future position of the portfolio. Table presents indicative values only. Excludes cash & cash equivalents. 107 | October 31, 2015 .
Clough China Fund Statement of Investments October 31, 2015 Value (Note 2) Shares COMMON STOCKS (89.42%) Communications (14.48%) Internet (1.19%) Alibaba Group Holding, Ltd., Sponsored ADR(a) Telecommunications (13.29%) China Mobile, Ltd. 621,000 China Telecom Corp., Ltd., Class H 1,758,000 China Unicom Hong Kong, Ltd. 644,000 ZTE Corp., Class H 255,800 871,832 7,445,725 917,012 784,835 615,990 9,763,562 TOTAL COMMUNICATIONS 10,635,394 TOTAL CONSUMER DISCRETIONARY 750,000 12,418,964 461,500 520,240 Consumer, Nonâ€Cyclical (4.17%) Biotechnology (0.71%) 3SBio, Inc.(a)(b) Food (0.40%) China Mengniu Dairy Co., Ltd. 80,000 China Modern Dairy Holdings, Ltd. 462,000 531,433 531,433 722,412 Auto Manufacturers (4.50%) BAIC Motor Corp., Ltd., Class (b) H Brilliance China Automotive Holdings, Ltd. Byd Co., Ltd., Class H(a) Great Wall Motor Co., Ltd., Class H Retail (4.52%) Baoxin Auto Group, Ltd. Giordano International, Ltd. (a) Li Ning Co., Ltd. 21,500 138,970 293,930 232,166 Pharmaceuticals (2.42%) Sinopharm Group Co., Ltd., Class H 154,960 236,467 432,000 1,780,322 3,063,125 TOTAL CONSUMER, NONâ€CYCLICAL Household Products & Wares (0.32%) Biostime International Holdings, Ltd. 106,500 Apparel (1.83%) Best Pacific International Holdings, Ltd. 370,000 158,014 Shenzhou International Group 170,000 837,755 Holdings, Ltd. Texhong Textile Group, Ltd. 470,500 348,966 1,344,735 439,500 387,406 214,000 292,000 296,742 1,815,571 660,500 802,087 3,301,806 701,500 1,412,000 1,642,500 Energy (3.79%) Oil & Gas (3.79%) China Petroleum & Chemical Corp., Class H PetroChina Co., Ltd., Class H 2,400,120 1,730,112 1,344,000 1,052,223 2,782,335 TOTAL ENERGY 2,782,335 Auto Parts & Equipment (0.68%) Fuyao Glass Industry Group Co., Ltd., Class H(a)(b) 232,800 Healthcare Products (0.32%) Hengan International Group Co., Ltd. Consumer, Cyclical (16.91%) Airlines (0.98%) Air China, Ltd., Class H 377,000 1,054,593 1,202,000 1,715,855 476,000 463,234 3,233,682 TOTAL CONSUMER, CYCLICAL Consumer Discretionary (0.72%) Specialty Retail (0.72%) China ZhengTong Auto Services 1,187,500 Holdings, Ltd. Textiles (4.40%) Anta Sports Products, Ltd. Pacific Textile Holdings, Ltd. Texwinca Holdings, Ltd. 1,239,112 $ 1,415,526 3,318,644 Retail (continued) Man Wah Holdings, Ltd. 10,400 $ Value (Note 2) Shares 497,685 289,631 757,690 855,797 Financials (28.29%) Banks (17.97%) Bank of China, Ltd., Class H 7,030,437 China Construction Bank Corp., Class H 7,216,080 China Merchants Bank Co., Ltd., Class H 396,000 108 | October 31, 2015 3,315,283 5,229,897 1,033,923 . Clough China Fund Statement of Investments October 31, 2015 Value (Note 2) Shares Banks (continued) Industrial & Commercial Bank of China, Ltd., Class H 5,698,967 $ 3,614,888 13,193,991 Real Estate (2.90%) China Overseas Land & Investment, Ltd. China Resources Land, Ltd. 332,000 1,072,316 408,000 1,060,224 2,132,540 Industrials (8.07%) Building Materials (1.17%) Anhui Conch Cement Co., Ltd., Class H 281,500 20,777,931 1,009,222 Engineering & Construction (3.28%) China Communications Construction Co., Ltd., 559,000 771,525 Class H China Railway Construction Corp., Ltd., Class H 1,097,000 1,639,780 2,411,305 287,305 Electrical Components & Equipment (1.38%) Xinjiang Goldwind Science & Technology Co., Ltd. 537,400 858,941 Construction & Engineering (0.39%) China Railway Group, Ltd., Class H 305,000 Transportation Infrastructure (1.85%) Cosco International Holdings, Ltd. 1,382,000 795,257 Sinotrans, Ltd., Class H 1,037,000 563,100 1,358,357 5,925,130 784,000 Technology (12.12%) Computers (1.40%) PAX Global Technology, Ltd. 7,443,620 431,181 8,900,007 Utilities (0.87%) Electric (0.87%) China Power International Development, Ltd. 1,011,000 635,345 TOTAL TECHNOLOGY 635,345 65,669,664 TOTAL COMMON STOCKS (Cost $56,988,470) PARTICIPATION NOTES (3.79%) Consumer, Cyclical (2.22%) Auto Manufacturers (2.22%) Chongqing Changan Automobile Co., Ltd., Class A (Loan Participation Notes issued by Morgan Stanley Asia Products), expiring (a)(b) 02/04/16 234,700 571,750 Zhengzhou Yutong Bus Co., Ltd., Class A (Loan Participation Notes issued by Morgan Stanley Asia Products), (a)(b) 305,635 1,060,470 expiring 10/27/17 1,632,220 1,632,220 70,600 TOTAL CONSUMER, CYCLICAL 587,262 587,262 Consumer, Nonâ€Cyclical (0.80%) Pharmaceuticals (0.80%) Jiangsu Hengrui Medicine Co., Ltd., Class A (Loan Participation Notes issued by Morgan Stanley Asia Products), expiring (a)(b) 03/16/17 TOTAL CONSUMER, NONâ€CYCLICAL Internet Software & Services (0.59%) Baidu, Inc., Sponsored ADR(a) 2,300 1,025,206 TOTAL INDUSTRIALS 394,900 $ TOTAL UTILITIES TOTAL FINANCIALS Internet (10.13%) Tencent Holdings, Ltd. Insurance (7.42%) China Life Insurance Co., Ltd., Class H 440,000 1,586,677 Ping An Insurance Group Co. of China, Ltd., Class H 688,500 3,864,723 5,451,400 Value (Note 2) Shares 109 | October 31, 2015 . Clough China Fund Statement of Investments October 31, 2015 Shares Industrials (0.77%) Engineering & Construction (0.77%) Shanghai International Airport Co., Ltd., Class A (Loan Participation Notes issued by Morgan Stanley Asia Products), expiring 11/18/15(a)(b) 118,665 $ Value (Note 2) 567,639 TOTAL INDUSTRIALS 567,639 Common Abbreviations: ADR - American Depositary Receipt. Ltd. - Limited. For Fund compliance purposes, the Fund's industry classifications refer to any one or more of the industry sub-classifications used by one or more widely recognized market indexes or ratings group indexes, and/or as defined by Fund management. This definition may not apply for purposes of this report, which may combine industry sub-classifications for reporting ease. Industries are shown as a percent of net assets. See Notes to Financial Statements. TOTAL PARTICIPATION NOTES (Cost $2,086,714) 7-Day Yield 2,787,121 Value (Note 2) Shares SHORT TERM INVESTMENTS (0.23%) Money Market Fund (0.23%) Morgan Stanley Institutional Liquidity Funds †Prime Portfolio 0.096% 170,634 TOTAL SHORT TERM INVESTMENTS (Cost $170,634) TOTAL INVESTMENTS (93.44%) (Cost $59,245,818) Other Assets In Excess Of Liabilities (6.56%) NET ASSETS (100.00%) 170,634 170,634 $ 68,627,419 4,816,068 $ 73,443,487 (a) (b) Non-Income Producing Security. Security exempt from registration under Rule 144A of the Securities Act of 1933.
This security may be resold in transactions exempt from registration, normally to qualified institutional buyers. As of October 31, 2015, the aggregate market value of those securities was $4,192,452, representing 5.71% of net assets. 110 | October 31, 2015 . Clough China Fund Statement of Assets and Liabilities October 31, 2015 ASSETS Investments, at value Foreign currency, at value (Cost $4,053,719) Receivable for investments sold Receivable for shares sold Dividends receivable Prepaid expenses and other assets Total Assets $ 68,627,419 4,053,438 4,365,047 45,565 5,450 15,666 77,112,585 $ 3,489,203 24,104 69,536 15,874 14,193 26,737 29,451 3,669,098 73,443,487 $ $ 66,982,750 1,041,894 (3,962,411) 9,381,254 73,443,487 LIABILITIES Payable for investments purchased Payable for shares redeemed Investment advisory fees payable Administration and transfer agency fees payable Distribution and services fees payable Professional fees payable Accrued expenses and other liabilities Total Liabilities NET ASSETS NET ASSETS CONSIST OF Paidâ€in capital Accumulated net investment income Accumulated net realized loss on investments and foreign currency transactions Net unrealized appreciation on investments and translation of assets and liabilities denominated in foreign currencies NET ASSETS INVESTMENTS, AT COST PRICING OF SHARES $ 59,245,818 Class A: Net Asset Value, offering and redemption price per share Net Assets Shares of beneficial interest outstanding (unlimited number of shares, no par value common stock authorized) Maximum offering price per share ((NAV/0.9450), based on maximum sales charge of 5.50% of the offering price) Class C: (a) Net Asset Value, offering and redemption price per share Net Assets Shares of beneficial interest outstanding (unlimited number of shares, no par value common stock authorized) Class I: Net Asset Value, offering and redemption price per share Net Assets Shares of beneficial interest outstanding (unlimited number of shares, no par value common stock authorized) $ $ $ $ 20.72 $ 10,395,052 501,691 (a) 21.74 25,276,032 1,162,817 23.01 $ 22.28 $ 37,772,403 1,695,228 Redemption price per share may be reduced for any applicable contingent deferred sales charge. For a description of a possible sales charge, please see the Fund's Prospectus. See Notes to Financial Statements. 111 | October 31, 2015 . Clough China Fund Statement of Operations For the Year Ended October 31, 2015 INVESTMENT INCOME Dividends Foreign taxes withheld on dividends Total Investment Income $ 2,460,152 (182,064) 2,278,088 EXPENSES Investment advisory fees Administrative fees Transfer agency fees Distribution and service fees Class A Class C Professional fees Networking fees Class A Class C Class I Reports to shareholders and printing fees State registration fees Insurance fees Custody fees Trustees' fees and expenses Miscellaneous expenses Total Expenses Less fees waived/reimbursed by investment advisor (Note 8) Class A Class C Class I Net Expenses Net Investment Income Net realized loss on investments Net realized loss on foreign currency transactions Net change in unrealized depreciation on investments Net change in unrealized depreciation on translation of assets and liabilities denominated in foreign currencies See Notes to Financial Statements. 112 | October 31, 2015 8,953 8,443 30,077 14,899 41,307 984 48,940 2,068 13,617 1,759,906 $ (10,535) (9,198) (30,012) 1,710,161 567,927 (1,783,943) (2,052) (5,134,658) (3,357) (6,924,010) (6,356,083) 77,090 120,646 37,960 NET REALIZED AND UNREALIZED LOSS ON INVESTMENTS NET DECREASE IN NET ASSETS RESULTING FROM OPERATIONS 1,201,044 149,602 4,276 . Clough China Fund Statements of Changes in Net Assets For the Year Ended October 31, 2015 For the Fiscal Period Ended October 31, 2014(a) For the Year Ended April 30, 2014 OPERATIONS Net investment income Net realized gain/(loss) on investments and foreign currency transactions Net change in unrealized appreciation/(depreciation) on investments and translation of assets and liabilities denominated in foreign currencies Net Increase/(Decrease) in Net Assets Resulting from Operations $ 567,927 $ (1,785,995) 1,526,148 $ 2,049,534 (5,138,015) (6,356,083) 6,054,295 9,629,977 500,278 2,061,432 (5,382,680) (2,820,970) DISTRIBUTIONS Dividends to shareholders from net investment income Class A Class C Class I Dividends to shareholders from net realized gains Class A Class C Class I Net Decrease in Net Assets from Distributions (646,687) (212,498) (889,808) (599,361) (236,066) (777,420) (3,361,840) – – – – – – – (300,642) (39,515) (359,841) – – – (699,998) BENEFICIAL INTEREST TRANSACTIONS (NOTE 6) Shares sold Class A Class C Class I Dividends reinvested Class A Class C Class I Shares redeemed, net of redemption fees Class A Class C Class I Net Increase/(Decrease) in Net Assets Derived from Beneficial Interest Transactions Net increase/(decrease) in net assets NET ASSETS Beginning of year End of year * *Including accumulated net investment income of: (a) 9,834,811 4,114,019 39,761,433 858,834 247,634 1,031,976 (13,529,955) (4,280,998) (36,894,860) 1,142,894 (8,575,029) 82,018,516 $ 73,443,487 $ 1,041,894 $ $ 3,360,623 896,076 8,345,000 – – – (7,865,957) (1,541,832) (6,269,825) (3,075,915) 6,554,062 75,464,454 82,018,516 1,699,179 Effective May 1, 2014, the Board approved changing the fiscal year-end of the Funds from April 30 to October 31. See Notes to Financial Statements. 113 | October 31, 2015 13,818,283 4,109,696 17,778,504 401,410 21,934 167,997 (14,337,423) (4,986,624) (8,919,474) 8,054,303 4,533,335 70,931,119 $ 75,464,454 $ 173,708 . Clough China Fund – Class A Financial Highlights Selected data for a share of beneficial interest outstanding throughout the periods indicated: For the Year Ended October 31, 2015 $23.50 For the Year Ended April 30, 2014 $21.45 For the Year Ended April 30, 2013 $18.43 For the Year Ended April 30, 2012 $21.02 For the Year Ended April 30, 2011 $18.21 0.12 (0.92) (0.80) (0.50) (0.46) (0.96) 0.45 2.33 2.78 – – – 0.12 (0.69) (0.57) (0.17) – (0.17) 0.15 2.90 3.05 (0.03) – (0.03) 0.02 (2.61) (2.59) – – – (0.04) 2.94 2.90 (0.09) – (0.09) 0.00(c) (1.76) $21.74 0.00(c) 2.78 $23.50 0.01 (0.73) $20.72 0.00(c) 3.02 $21.45 0.00(c) (2.59) $18.43 0.00(b)(c) 2.81 $21.02 (3.49)% 13.42% (2.69)% 16.54% (12.32)% 16.00% $25,276 Net asset value, beginning of period For the Fiscal Period Ended October 31, 2014(a) $20.72 $30,526 $31,164 $32,709 $30,542 $44,616 INCOME/(LOSS) FROM INVESTMENT OPERATIONS: Net investment income/(loss)(b) Net realized and unrealized gain/(loss) Total from investment operations DISTRIBUTIONS: From net investment income From net realized gains Total distributions REDEMPTION FEES ADDED TO PAIDâ€IN CAPITAL (NOTE 6) Net increase/(decrease) in net asset value Net asset value, end of year TOTAL RETURN(d) RATIOS/SUPPLEMENTAL DATA: Net assets, end of year (000s) Ratio of expenses to average net assets excluding fee waivers and reimbursements Ratio of expenses to average net assets including fee waivers and reimbursements Ratio of net investment income/(loss) to average net assets Portfolio turnover rate(g) (c) (d) (b) (e) (g) (f) 2.06% (e) 2.06% 2.14% 2.08% 1.95% (a) 1.98% (e) 1.95% 1.95% 1.95% 1.95% 1.89%(f) 0.50% 193% (e) 3.96% 76% 0.55% 232% 0.78% 221% 0.13% 174% (0.22)% 170% 2.07% Effective May 1, 2014, the Board approved changing the fiscal year-end of the Funds from April 30 to October 31. Calculated using the average shares method. Less than $0.005 per share. Total returns are for the period indicated and have not been annualized. Total returns would have been lower had certain expenses not been waived during the period. Returns shown do not reflect the deduction of taxes that a shareholder would pay on Fund distributions or the redemption of Fund shares. Returns shown exclude any applicable sales charges. Annualized. Contractual expense limitation changed from 1.85% to 1.95% effective January 1, 2011. Portfolio turnover rate for periods less than one full year have not been annualized. See Notes to Financial Statements. 114 | October 31, 2015 .
Clough China Fund – Class C Financial Highlights Selected data for a share of beneficial interest outstanding throughout the periods indicated: For the Year Ended October 31, 2015 $22.53 For the Year Ended April 30, 2014 $20.71 For the Year Ended April 30, 2013 $17.90 For the Year Ended April 30, 2012 $20.58 For the Year Ended April 30, 2011 $17.89 (0.04) (0.89) (0.93) (0.42) (0.46) (0.88) 0.33 2.26 2.59 – – – (0.02) (0.68) (0.70) (0.07) – (0.07) 0.01 2.80 2.81 – – – (0.11) (2.57) (2.68) – – – (0.21) 2.90 2.69 (c) (0.00) – (0.00)(c) 0.00(c) (1.81) $20.72 0.00(c) 2.59 $22.53 0.00(c) (0.77) $19.94 0.00(c) 2.81 $20.71 0.00(c) (2.68) $17.90 0.00(c) 2.69 $20.58 (4.25)% 12.99% (3.43)% 15.70% (13.02)% 15.13% $10,395 Net asset value, beginning of period For the Fiscal Period Ended October 31, 2014(a) $19.94 $11,575 $10,866 $12,251 $11,674 $16,848 INCOME/(LOSS) FROM INVESTMENT OPERATIONS: Net investment income/(loss)(b) Net realized and unrealized gain/(loss) Total from investment operations DISTRIBUTIONS: From net investment income From net realized gains Total distributions REDEMPTION FEES ADDED TO PAIDâ€IN CAPITAL (NOTE 6) Net increase/(decrease) in net asset value Net asset value, end of year TOTAL RETURN(d) RATIOS/SUPPLEMENTAL DATA: Net assets, end of year (000s) Ratio of expenses to average net assets excluding fee waivers and reimbursements Ratio of expenses to average net assets including fee waivers and reimbursements Ratio of net investment income/(loss) to average net assets (f) Portfolio turnover rate 2.78% (a) (c) (d) (b) (e) (f) 2.86% 2.94% 2.88% 2.86% 2.70% 2.87% (e) 2.70%(e) 2.70% 2.70% 2.70% 2.70% (0.18)% 193% (e) 3.08% 76% (0.09)% 232% 0.07% 221% (0.62)% 174% (1.10)% 170% Effective May 1, 2014, the Board approved changing the fiscal year-end of the Funds from April 30 to October 31. Calculated using the average shares method. Less than $0.005 and ($0.005) per share. Total returns are for the period indicated and have not been annualized. Total returns would have been lower had certain expenses not been waived during the period. Returns shown do not reflect the deduction of taxes that a shareholder would pay on Fund distributions or the redemption of Fund shares. Returns shown exclude any applicable sales charges. Annualized. Portfolio turnover rate for periods less than one full year have not been annualized. See Notes to Financial Statements. 115 | October 31, 2015 .
Clough China Fund – Class I Financial Highlights Selected data for a share of beneficial interest outstanding throughout the periods indicated: For the Year Ended October 31, 2015 $23.97 For the Year Ended April 30, 2014 $21.82 For the Year Ended April 30, 2013 $18.71 For the Year Ended April 30, 2012 $21.30 For the Year Ended April 30, 2011 $18.41 0.23 (1.00) (0.77) (0.53) (0.46) (0.99) 0.45 2.41 2.86 – – – 0.19 (0.69) (0.50) (0.21) – (0.21) 0.13 3.02 3.15 (0.06) – (0.06) 0.06 (2.65) (2.59) – – – (0.01) 3.03 3.02 (0.13) – (0.13) 0.07 (1.69) $22.28 0.00(c) 2.86 $23.97 0.00(c) (0.71) $21.11 0.02 3.11 $21.82 0.00(c) (2.59) $18.71 0.00(c) 2.89 $21.30 (2.99)% 13.55% (2.41)% 16.95% (12.16)% 16.45% $37,772 Net asset value, beginning of period For the Fiscal Period Ended October 31, 2014(a) $21.11 $39,917 $33,435 $25,972 $28,868 $41,054 INCOME/(LOSS) FROM INVESTMENT OPERATIONS: Net investment income/(loss)(b) Net realized and unrealized gain/(loss) Total from investment operations DISTRIBUTIONS: From net investment income From net realized gains Total distributions REDEMPTION FEES ADDED TO PAIDâ€IN CAPITAL (NOTE 6) Net increase/(decrease) in net asset value Net asset value, end of year TOTAL RETURN(d) RATIOS/SUPPLEMENTAL DATA: Net assets, end of year (000s) Ratio of expenses to average net assets excluding fee waivers and reimbursements Ratio of expenses to average net assets including fee waivers and reimbursements Ratio of net investment income/(loss) to average net assets (g) Portfolio turnover rate (c) (d) (b) (e) (g) (f) 1.82% (e) 1.81% 1.94% 1.85% 1.70% (a) 1.77% 1.70%(e) 1.70% 1.70% 1.70% 1.53%(f) 0.95% 193% (e) 3.89% 76% 0.83% 232% 0.69% 221% 0.33% 174% (0.03)% 170% 1.85% Effective May 1, 2014, the Board approved changing the fiscal year-end of the Funds from April 30 to October 31. Calculated using the average shares method. Less than $0.005 per share. Total returns are for the period indicated and have not been annualized. Total returns would have been lower had certain expenses not been waived during the period. Returns shown do not reflect the deduction of taxes that a shareholder would pay on Fund distributions or the redemption of Fund shares. Annualized. Contractual expense limitation changed from 1.40% to 1.70% effective January 1, 2011. Portfolio turnover rate for periods less than one full year have not been annualized. See Notes to Financial Statements. 116 | October 31, 2015 . RiverFront Global Allocation Series Management Commentary October 31, 2015 (Unaudited) Year in Review for RiverFront Funds: The past twelve months ended October 31, 2015 have proved volatile for our strategy positioning. At the end of 2014, we saw oil prices plunge, high yield spreads widen, and Treasury yields fall to lows of the year while Europe continued to struggle with deflation pressures. As we transitioned into 2015, the first several months became the first act of a currency story as the European Central Bank (ECB) began its Quantitative Easing (QE) policy, the Federal Reserve (Fed) stated its intent to raise interest rates, and the Bank of Japan (BOJ) slowed the rate of yen depreciation. The ECB's announcement of a €60 billion per month purchase program of covered bonds, sovereign debt, and asset backed securities caused the euro to depreciate relative to the dollar. The US economy showed signs of strength, with a falling unemployment rate and the Fed removing "patient" from its commentary; the resulting expectation of higher interest rates caused further dollar strength. RiverFront responded to the ECB’s announcement by making a currencyâ€hedged investment in Europe; this move enabled our US investors to experience the return of the local European market without experiencing the effect of the depreciating euro in dollar terms. Additionally, we continued to hold hedged investments in Japan. Following the unsettling August/September decline in stocks around the world, the recovery in October was rewarding for those who held their nerve. However, even with October’s rebound, uncertainty continues to loom. The fact remains that investor confidence is shaken, and skepticism remains high. China, interest rates in the US, oil prices, and earnings (both in the US and abroad) all continue to dominate headlines and raise valid questions about growth as we move into 2016. As we look back over the past several months, there have been plenty of reasons for uncertainty. The announcement that the Chinese government had devalued the yuan prompted another round of fears of a global slowdown. Further concerns mounted after the Federal Open Market Committee failed to raise interest rates for the first time in 9 years. The market went into riskâ€off mode in both instances, and the yen and euro rallied versus the dollar over the quarter. These developments negatively impacted our fund performance for a period because we had a proâ€dollar investment thesis, whereby we invested in Europe and Japan on a currencyâ€hedged basis. Additionally, the riskâ€off sentiment in the market helped investors that had invested in longer duration Treasuries. However, our funds have avoided making long duration investments due to our anticipation of the Fed starting liftoff in 2015, and thus our funds did not participate in the Treasury rally. Going into the fourth quarter of calendar 2015, we no longer believe that the Fed will initiate a rate increase prior to yearâ€end. However, we believe that Europe and Japan will continue to benefit from Quantitative Easing, which in turn should cause their currencies to depreciate. Given our thesis for the remainder of the year, we will monitor U.S. economic data closely to determine whether adjustments need to be made to the current strategy positioning. The portfolios will continue to be overweight developed international at the expense of domestic U.S. equities. Additionally, we believe the slowdown in China will continue to have a profound effect on emerging markets, as these economies struggle with slowing demand for commodities, depreciating currencies, and repaying dollarâ€denominated debt. We believe that when the Fed raises rates in the US, emerging markets economies will experience even greater capital outflows. Hence, we will continue to avoid owning emerging markets in the funds because we do not foresee a catalyst to create growth in this asset class in the near term. Performance Discussion for the Balanced Funds (RiverFront Conservative Income Builder Fund, RiverFront Moderate Growth & Income Fund): In discussing the performance of the RiverFront funds, it is important to keep in mind their global allocation mandate. All of the RiverFront offerings have exposure to multiâ€cap, global equities; our balanced funds have the addition of fixed income. The table below illustrates the disparity of returns across the major indices during the most recent quarter, which resulted in varying degrees of relative performance when compared to the traditional single index, mutual fund benchmark. Twelve months ended 10/31/2015 Returns** Benchmark Indexes* S&P 500 Total Return S&P 1000 Total Return MSCI EAFE (Net) MSCI Emerging Markets (Net) MSCI All Country World Index (Net) Barclays US Aggregate Barclays US Treasury Index Barclays US Short Treasury Index (1â€3M) 5.20% 3.26% â€0.07% â€14.53% â€0.03% 1.96% 2.39% 0.01% Data as of 10/31/2015 * ** For index definitions see footnotes at the end of the Management Commentary and below the performance data on the following pages. For a complete presentation of RiverFront Mutual Fund and relevant benchmark performance, please refer to the Performance Update on the following pages. The RiverFront balanced funds underperformed their benchmarks over the trailing twelve month period, largely due to the fact that these funds were overweight developed international equity relative to US equity. Additionally, these funds were underweight fixed income, given our preference for equity over fixed income. Contributors: ï‚· Despite the allocation drag from being overweight in developed international, positive selection helped keep the category positive with positions in both Europe and Japan that hedged out the respective currencies. 117 | October 31, 2015 . RiverFront Global Allocation Series Management Commentary ï‚· ï‚· October 31, 2015 (Unaudited) Core US equity contributed positively as a result of both allocation and selection. Positive sectors included exposure to real estate investment trusts (REITs), food and drug retailing within consumer staples, and large pharmaceuticals within healthcare. Detractors: ï‚· ï‚· ï‚· ï‚· The underweight to traditional fixed income in favor of high yield impacted the portfolio negatively. Although our bias towards securities that hedge currency exposure helped keep developed international positive as a category, there were several country selections that had a negative impact on performance including Spain, Norway, and Germany. Within US equity, Master Limited Partnerships (MLPs) had a negative impact. Energy was one of the worst performing sectors over the period. We were neutral energy which impacted negatively from an allocation standpoint; however, there was also negative selection due to our exposure to the oil services sector. Performance Discussion for Growth Funds (RiverFront Global Growth Fund, RiverFront Dynamic Equity Income Fund, RiverFront Global Allocation Fund): The RiverFront growth funds outperformed their benchmarks over the trailing twelve month period, largely due to the positions that hedged currencies that are discussed above. The following points detail more specific contributors and detractors: Contributors: ï‚· ï‚· ï‚· ï‚· ï‚· ï‚· ï‚· The views of the author and information discussed in this commentary are as of the date of publication, are subject to change, and may not reflect the writer's current views. The views expressed are those of the author only, and represent an assessment of market conditions at a specific point in time, are opinions only and should not be relied upon as investment advice regarding a particular investment or markets in general. Such information does not constitute a recommendation to buy or sell specific securities or investment vehicles. It should not be assumed that any investment will be profitable or will equal the performance of the fund(s) or any securities or any sectors mentioned in this letter.
The subject matter contained in this letter has been derived from several sources believed to be reliable and accurate at the time of compilation. Neither ALPS Advisors, Inc., RiverFront Investment Group, LLC, nor the Funds accepts any liability for losses either direct or consequential caused by the use of this information. The S&P 1000® Index combines the S&P MidCap 400® and the S&P SmallCap 600® to form an investable benchmark for the mid- to small-cap segment of the U.S. equity market. The MSCI EAFE Index is recognized as the pre-eminent benchmark in the United States to measure international equity performance. It comprises the MSCI country indices that represent developed markets outside of North America: Europe, Australasia and the Far East. The MSCI Emerging Markets Index is a free float-adjusted market capitalization index that is designed to measure equity market performance in the global emerging markets. Selection within developed international markets outweighed the negative allocation impact – specifically the allocations to Europe and Japan (both on a currency hedged basis). Allocation to micro†and small†cap contributed positively. Within US equity, underweights to oil sensitive sectors such as energy and materials contributed positively. The Barclays U.S. Treasury Index includes public obligations of the U.S.
Treasury, excluding Treasury bills and certain special issues, such as state and local government series bonds (SLGs) and U.S. Treasury TIPS. The Barclays U.S. Short Treasury Index is composed of bonds of investment grade with a maturity between one and three years. An investor may not invest directly in an index. Detractors: ï‚· Past performance is no guarantee of future results. Dividends are not guaranteed and are subject to change or elimination.
Investments in international and emerging markets securities include exposure to risks such as currency fluctuations, foreign taxes and regulations, and the potential for illiquid markets and political instability. Diversification cannot guarantee gain or prevent losses. The overall underweight to US equity had a slightly negative allocation impact. Within US equity, Master Limited Partnerships (MLPs) impacted negatively. Our underweight to tech, specifically large cap tech names, negatively impacted returns. We also had negative impact from the underweight to consumer discretionary and negative selection impact within specialty retail. Within developed international, several country selections impacted performance negatively, including Spain, Norway, and Germany. 118 | October 31, 2015 . RiverFront Conservative Income Builder Fund Performance Update October 31, 2015 (Unaudited) Performance of $10,000 Initial Investment (as of October 31, 2015) Comparison of change in value of a $10,000 investment (includes maximum sales charges of 5.50%) $12k $11k 30% S&P 500®/ 70% Barclays U.S. Aggregate Bond - $11,949 RiverFront Conservative Income Builder Fund Class A (NAV) - $11,399 $10k RiverFront Conservative Income Builder Fund Class A (MOP) - $10,774 Barclays U.S. Aggregate Bond Index - $10,538 10/31/15 10/31/14 10/31/13 8/31/12^ $9k The chart above represents historical performance of a hypothetical investment of $10,000 in the Fund since inception. Past performance does not guarantee future results. This chart does not reflect the deduction of taxes that a shareholder would pay on Fund distributions or the redemption of Fund shares. Average Annual Total Returns (as of October 31, 2015) Class A (NAV) Class A (MOP) Class C (NAV) Class C (CDSC) Class I Barclays U.S. Aggregate 1 Bond Index 30% S&P 500® and 70% Barclays U.S. 1,2 Aggregate Bond 6 Month â€1.66% â€7.05% â€1.97% â€2.95% â€1.48% 1 Year 0.40% â€5.11% â€0.39% â€1.35% 0.60% 3 Years 4.29% 2.36% 3.52% 3.52% 4.53% Since Inception^ 4.22% 2.38% 3.46% 3.46% 4.48% â€0.10% 1.96% 1.65% 1.67% 0.29% 3.13% 5.95% 5.78% Total Expense Ratio What You Pay* 2.71% 1.47% 3.46% 2.22% 2.44% 1.22% Performance data quoted represents past performance. Past performance does not guarantee future results.
Investment return and principal value of an investment will fluctuate so that an investor's shares, when sold or redeemed, may be worth more or less than the original cost. Current performance data may be higher or lower than actual data quoted. For the most current month-end performance data, please call 1-866-759-5679. Maximum Offering Price (MOP) for Class A shares includes the Fund’s maximum sales charge of 5.50%.
Performance shown at NAV does not include these sales charges and would have been lower had it been taken into account. If you invest $1 million or more, either as a lump sum or through the Fund’s accumulation or letter of intent programs, you can purchase Class A shares without an initial sales charge (load). A Contingent Deferred Sales Charge (“CDSC”) of 1.00% may apply to Class C shares redeemed within the first 12 months after a purchase, and on Class A shares redeemed within the first 18 months after a purchase in excess of $1 million. Performance less than 1 year is cumulative. 119 | October 31, 2015 .
RiverFront Conservative Income Builder Fund Performance Update October 31, 2015 (Unaudited) 1 The Barclays U.S. Aggregate Bond Index is a broad-based benchmark that measures the investment grade, U.S. dollar-denominated, fixed-rate taxable bond market, including Treasuries, government-related and corporate securities, MBS (agency fixed-rate and hybrid ARM passthroughs), ABS, and CMBS. The index is not actively managed and does not reflect any deductions for fees, expenses or taxes.
An investor may not invest directly in an index. 2 The S&P 500® Index is the Standard & Poor's composite index of 500 stocks, a widely recognized, unmanaged index of common stock prices. ^ Fund inception date of August 31, 2012. * What You Pay reflects the Advisor's and Sub-Advisor's decision to contractually limit expenses through February 29, 2016 and Acquired Fund Fees and Expenses of 0.32%. Please see the prospectus for additional information. The table does not reflect the deduction of taxes that a shareholder would pay on Fund distributions or the redemption of Fund shares. This Fund is not suitable for all investors and is subject to investment risks, including possible loss of the principal amount invested. There is no guarantee that the Fund will continue to hold any one particular security or stay invested in any one particular company. The composition of the Fund's top holdings is subject to change.
Performance figures are historical and reflect the change in share price, reinvested distributions, changes in net asset value, sales charges and capital gains distributions, if any. Not FDIC Insured – No Bank Guarantee – May Lose Value Top Ten Holdings (as a % of Net Assets) † † RiverFront Strategic Income Fund Guggenheim BulletShares 2018 Corporate Bond ETF Guggenheim BulletShares 2017 Corporate Bond ETF Guggenheim BulletShares 2016 Corporate Bond ETF WisdomTree® Europe Hedged Equity Fund WisdomTree® LargeCap Dividend Fund iShares® MSCI Japan ETF iShares® Core S&P 500® ETF iShares® Barclays 1â€3 Year Credit Bond ETF PIMCO Enhanced Short Maturity Active ETF Top Ten Holdings Portfolio Composition (as a % of Net Assets) 9.82% Fixed Income - 54.88% 8.50% International Developed Equities - 20.88% Domestic Core Equities - 17.51% 8.49% Domestic MLPs - 0.03% 8.47% 6.23% 5.11% 4.95% 4.74% Domestic Small-Cap Equities - 0.02% Other - 0.02% Cash, Cash Equivalents & Other Net Assets - 6.66% 4.32% 3.39% 64.02% Holdings are subject to change, and may not reflect the current or future position of the portfolio. Table presents indicative values only. Excludes cash & cash equivalents. 120 | October 31, 2015 .
RiverFront Dynamic Equity Income Fund Performance Update October 31, 2015 (Unaudited) Performance of $10,000 Initial Investment (as of October 31, 2015) Comparison of change in value of a $10,000 investment (includes maximum sales charges of 5.50%) $17k $16k MSCI ACWI - $15,491 $15k RiverFront Dynamic Equity Income Fund Class A (NAV) - $14,649 70% MSCI ACWI/30% Barclays U.S. Aggregate Bond - $14,458 RiverFront Dynamic Equity Income Fund Class A (MOP) - $13,846 $14k $13k $12k $11k $10k 10/31/15 10/31/14 10/31/13 10/31/12 10/31/11 8/2/10^ $9k The chart above represents historical performance of a hypothetical investment of $10,000 in the Fund since inception. Past performance does not guarantee future results. This chart does not reflect the deduction of taxes that a shareholder would pay on Fund distributions or the redemption of Fund shares. Average Annual Total Returns (as of October 31, 2015) Class A (NAV) Class A (MOP) Class C (NAV) Class C (CDSC) Class I 1 MSCI All Country World Index 70% MSCI ACWI and 30% Barclays U.S. Aggregate Bond1,2 6 Month â€4.03% â€9.30% â€4.41% â€5.36% â€3.91% â€4.77% 1 Year 1.64% â€3.94% 0.86% â€0.10% 1.83% â€0.03% 3 Years 8.18% 6.18% 7.36% 7.36% 8.45% 9.92% 5 Years 6.64% 5.44% 5.84% 5.84% 6.91% 7.68% Since Inception^ 7.55% 6.40% 6.74% 6.74% 7.81% 8.70% â€3.26% 0.77% 7.51% 6.48% 7.28% Total Expense Ratio What You Pay* 1.78% 1.54% 2.54% 2.29% 1.54% 1.29% Performance data quoted represents past performance.
Past performance does not guarantee future results. Investment return and principal value of an investment will fluctuate so that an investor's shares, when sold or redeemed, may be worth more or less than the original cost. Current performance data may be higher or lower than actual data quoted.
For the most current month-end performance data, please call 1-866-759-5679. Maximum Offering Price (MOP) for Class A shares includes the Fund’s maximum sales charge of 5.50%. Performance shown at NAV does not include these sales charges and would have been lower had it been taken into account. If you invest $1 million or more, either as a lump sum or through the Fund’s accumulation or letter of intent programs, you can purchase Class A shares without an initial sales charge (load).
A Contingent Deferred Sales Charge (“CDSC”) of 1.00% may apply to Class C shares redeemed within the first 12 months after a purchase, and on Class A shares redeemed within the first 18 months after a purchase in excess of $1 million. Performance less than 1 year is cumulative. 121 | October 31, 2015 . RiverFront Dynamic Equity Income Fund Performance Update October 31, 2015 (Unaudited) 1 The MSCI ACWI (All Country World Index) is a free float-adjusted market capitalization weighted index that is designed to measure the equity market performance of developed and emerging markets. The MSCI ACWI consists of 45 country indices comprising 24 developed and 21 emerging market country indices. The index includes reinvestment of dividends, net of foreign withholding taxes. The index is not actively managed and does not reflect any deductions for fees, expenses or taxes.
An investor may not invest directly in an index. 2 The Barclays U.S. Aggregate Bond Index is a broad-based benchmark that measures the investment grade, U.S. dollar-denominated, fixed-rate taxable bond market, including Treasuries, government-related and corporate securities, MBS (agency fixed-rate and hybrid ARM passthroughs), ABS, and CMBS.
The index is not actively managed and does not reflect any deductions for fees, expenses or taxes. An investor may not invest directly in an index. ^ Fund inception date of August 2, 2010. * What You Pay reflects the Advisor's and Sub-Advisor's decision to contractually limit expenses through February 29, 2016 and Acquired Fund Fees and Expenses of 0.39%. Please see the prospectus for additional information. The table does not reflect the deduction of taxes that a shareholder would pay on Fund distributions or the redemption of Fund shares. This Fund is not suitable for all investors and is subject to investment risks, including possible loss of the principal amount invested. There is no guarantee that the Fund will continue to hold any one particular security or stay invested in any one particular company.
The composition of the Fund's top holdings is subject to change. Performance figures are historical and reflect the change in share price, reinvested distributions, changes in net asset value, sales charges and capital gains distributions, if any. Not FDIC Insured – No Bank Guarantee – May Lose Value Top Ten Holdings (as a % of Net Assets) † Portfolio Composition (as a % of Net Assets) † WisdomTree® Europe Hedged Equity Fund iShares® MSCI Japan ETF RiverFront Strategic Income Fund PowerShares® S&P 500® High Dividend Portfolio iShares® Currency Hedged MSCI Germany ETF WisdomTree® Japan Hedged Equity Fund SPDR® Barclays Short Term High Yield Bond ETF SPDR® Morgan Stanley Technology ETF Market Vectors® Oil Service ETF PowerShares® KBW Bank Portfolio Top Ten Holdings International Developed Equities - 49.44% 19.47% 7.94% 6.87% Domestic Core Equities - 36.24% Fixed Income - 10.90% Domestic Small-Cap Equities - 0.46% 6.52% Other - 0.04% Domestic MLPs - 0.02% 6.16% Cash, Cash Equivalents & Other Net Assets - 2.90% 4.24% 4.17% 3.66% 3.66% 3.34% 66.03% Holdings are subject to change, and may not reflect the current or future position of the portfolio. Table presents indicative values only.
Excludes cash & cash equivalents. 122 | October 31, 2015 . RiverFront Global Allocation Fund Performance Update October 31, 2015 (Unaudited) Performance of $10,000 Initial Investment (as of October 31, 2015) Comparison of change in value of a $10,000 investment (includes maximum sales charges of 5.50%) $17k $16k MSCI ACWI - $15,491 80% MSCI ACWI/20% Barclays U.S. Aggregate Bond - $14,811 RiverFront Global Allocation Fund Class A (NAV) - $14,109 RiverFront Global Allocation Fund Class A (MOP) - $13,335 $15k $14k $13k $12k $11k $10k $9k 10/31/15 10/31/14 10/31/13 10/31/12 10/31/11 8/2/10^ $8k The chart above represents historical performance of a hypothetical investment of $10,000 in the Fund since inception. Past performance does not guarantee future results. This chart does not reflect the deduction of taxes that a shareholder would pay on Fund distributions or the redemption of Fund shares. Average Annual Total Returns (as of October 31, 2015) Class A (NAV) Class A (MOP) Class C (NAV) Class C (CDSC) Class I MSCI All Country 1 World Index 80% MSCI ACWI and 20% Barclays U.S. Aggregate Bond1,2 6 Month â€4.91% â€10.16% â€5.30% â€6.24% â€4.77% 1 Year 1.23% â€4.31% 0.46% â€0.46% 1.49% 3 Years 8.39% 6.36% 7.59% 7.59% 8.66% 5 Years 5.95% 4.74% 5.14% 5.14% 6.18% Since Inception^ 6.78% 5.64% 5.99% 5.99% 7.02% â€4.77% â€0.03% 9.92% 7.68% 8.70% â€3.75% 0.52% 8.32% 6.90% 7.77% Total Expense Ratio What You Pay* 1.89% 1.54% 2.64% 2.29% 1.65% 1.29% Performance data quoted represents past performance.
Past performance does not guarantee future results. Investment return and principal value of an investment will fluctuate so that an investor's shares, when sold or redeemed, may be worth more or less than the original cost. Current performance data may be higher or lower than actual data quoted.
For the most current month-end performance data, please call 1-866-759-5679. Maximum Offering Price (MOP) for Class A shares includes the Fund’s maximum sales charge of 5.50%. Performance shown at NAV does not include these sales charges and would have been lower had it been taken into account. If you invest $1 million or more, either as a lump sum or through the Fund’s accumulation or letter of intent programs, you can purchase Class A shares without an initial sales charge (load).
A Contingent Deferred Sales Charge (“CDSC”) of 1.00% may apply to Class C shares redeemed within the first 12 months after a purchase, and on Class A shares redeemed within the first 18 months after a purchase in excess of $1 million. Performance less than 1 year is cumulative. 123 | October 31, 2015 . RiverFront Global Allocation Fund Performance Update October 31, 2015 (Unaudited) 1 The MSCI ACWI (All Country World Index) is a free float-adjusted market capitalization weighted index that is designed to measure the equity market performance of developed and emerging markets. The MSCI ACWI consists of 45 country indices comprising 24 developed and 21 emerging market country indices. The index includes reinvestment of dividends, net of foreign withholding taxes. The index is not actively managed and does not reflect any deductions for fees, expenses or taxes.
An investor may not invest directly in an index. 2 The Barclays U.S. Aggregate Bond Index is a broad-based benchmark that measures the investment grade, U.S. dollar-denominated, fixed-rate taxable bond market, including Treasuries, government-related and corporate securities, MBS (agency fixed-rate and hybrid ARM passthroughs), ABS, and CMBS.
The index is not actively managed and does not reflect any deductions for fees, expenses or taxes. An investor may not invest directly in an index. ^ Fund inception date of August 2, 2010. * What You Pay reflects the Advisor's and Sub-Advisor’s decision to contractually limit expenses through February 29, 2016 and Acquired Fund Fees and Expenses of 0.39%. Please see the prospectus for additional information. The table does not reflect the deduction of taxes that a shareholder would pay on Fund distributions or the redemption of Fund shares. This Fund is not suitable for all investors and is subject to investment risks, including possible loss of the principal amount invested. There is no guarantee that the Fund will continue to hold any one particular security or stay invested in any one particular company.
The composition of the Fund's top holdings is subject to change. Performance figures are historical and reflect the change in share price, reinvested distributions, changes in net asset value, sales charges and capital gains distributions, if any. Not FDIC Insured – No Bank Guarantee – May Lose Value Top Ten Holdings (as a % of Net Assets) † Portfolio Composition (as a % of Net Assets) † WisdomTree® Europe Hedged Equity Fund iShares® MSCI Japan ETF iShares® Currency Hedged MSCI Germany ETF SPDR® Morgan Stanley Technology ETF WisdomTree® Japan Hedged Equity Fund Deutsche Xâ€trackers MSCI EAFE Hedged Equity ETF Vanguard® FTSE Developed Markets ETF Market Vectors® Oil Service ETF iShares® U.S. Consumer Goods ETF Vanguard® FTSE Europe ETF Top Ten Holdings International Developed Equities - 58.48% Domestic Core Equities - 32.89% 20.87% 8.57% Fixed Income - 2.06% Domestic Small-Cap Equities - 0.47% 6.56% 5.34% International Emerging Market Equities - 0.14% Other - 0.06% 4.74% Domestic MLPs - 0.02% Cash, Cash Equivalents & Other Net Assets - 5.88% 3.64% 3.54% 3.43% 3.18% 2.89% 62.76% Holdings are subject to change, and may not reflect the current or future position of the portfolio. Table presents indicative values only.
Excludes cash & cash equivalents. 124 | October 31, 2015 . RiverFront Global Growth Fund Performance Update October 31, 2015 (Unaudited) Performance of $10,000 Initial Investment (as of October 31, 2015) Comparison of change in value of a $10,000 investment (includes maximum sales charges of 5.50%) $22k S&P 500® Total Return Index - $20,269 $20k $18k $16k MSCI ACWI - $15,026 RiverFront Global Growth Fund Class A (NAV) - $14,220 RiverFront Global Growth Fund Class A (MOP) - $13,434 $14k $12k $10k 10/31/15 10/31/14 10/31/13 10/31/12 9/27/10 10/31/11 $8k The chart above represents historical performance of a hypothetical investment of $10,000 in the Fund since inception. Past performance does not guarantee future results. This chart does not reflect the deduction of taxes that a shareholder would pay on Fund distributions or the redemption of Fund shares. Average Annual Total Returns (as of October 31, 2015) Class A (NAV) Class A (MOP) Class C (NAV) Class C (CDSC) Class I 1 Class L Investor Class MSCI All Country World Index2 S&P 500® Total Return Index3 6 Month â€5.42% â€10.63% â€5.79% â€6.73% â€5.33% 1 Year 1.34% â€4.24% 0.59% â€0.31% 1.51% 3 Years 9.38% 7.35% 8.56% 8.56% 9.62% 5 Years 6.50% 5.29% 5.73% 5.73% 6.78% Since Inception^ 10.12% 10.12% 9.31% 9.31% 10.39% â€5.34% â€5.45% â€4.77% 0.77% 1.59% 1.28% â€0.03% 5.20% 9.66% 9.36% 9.92% 16.20% 6.78% 6.52% 7.68% 14.33% 10.39% 10.10% 11.85% 14.45% Total Expense Ratio What You Pay* 1.78% 1.55% 2.53% 2.30% 1.76% 1.30% 1.42% 1.78% 1.30% 1.55% Performance data quoted represents past performance. Past performance does not guarantee future results.
Investment return and principal value of an investment will fluctuate so that an investor's shares, when sold or redeemed, may be worth more or less than the original cost. Current performance data may be higher or lower than actual data quoted. For the most current month-end performance data, please call 1-866-759-5679. Maximum Offering Price (MOP) for Class A shares includes the Fund’s maximum sales charge of 5.50%.
Performance shown at NAV does not include these sales charges and would have been lower had it been taken into account. If you invest $1 million or more, either as a lump sum or through the Fund’s accumulation or letter of intent programs, you can purchase Class A shares without an initial sales charge (load). A Contingent Deferred Sales Charge (“CDSC”) of 1.00% may apply to Class C shares redeemed within the first 12 months after a purchase, and on Class A shares redeemed within the first 18 months after a purchase in excess of $1 million. Performance less than 1 year is cumulative. 125 | October 31, 2015 .
RiverFront Global Growth Fund Performance Update October 31, 2015 (Unaudited) 1 Prior to close of business on September 24, 2010, Class L was known as Institutional Class of the Baird Funds, Inc. - RiverFront Long-Term Growth Fund. 2 The MSCI ACWI (All Country World Index) is a free float-adjusted market capitalization weighted index that is designed to measure the equity market performance of developed and emerging markets. The MSCI ACWI consists of 45 country indices comprising 24 developed and 21 emerging market country indices. The index includes reinvestment of dividends, net of foreign withholding taxes.
The index is not actively managed and does not reflect any deductions for fees, expenses or taxes. An investor may not invest directly in an index. 3 S&P 500® Total Return Index is the Standard & Poor's composite index of 500 stocks, a widely recognized, unmanaged index of common stock prices. The index is not actively managed and does not reflect any deduction for fees, expenses or taxes.Cash, Cash Equivalents invest directly in An investor may not & Other Net Assets an index. ^ Fund inception date of October 28, 2008. Other * What You Pay reflects the Advisor's and Sub-Advisor's decision to contractually limit expenses through February 29, 2016 and Acquired Fund Fees and Expenses of 0.40%.
Please see the prospectus for additional information. International Emerging Market Equities The Class A, C, I and L shares performance shown for periods prior to September 27, 2010 reflects the performance of the Baird Funds, Domestic Small-Cap Equities Inc. – RiverFront Long-Term Growth Fund’s Institutional Class shares (as result of the reorganization of the Baird Funds, Inc. – RiverFront Long-Term Growth Fund into the Fund). Domestic Core Equities The Investor Class performance shown for periods prior to September 27, 2010 reflects the performance of the Baird Funds, Inc.
– RiverFront Long-Term Growth Fund’s Investor Class shares (as result of the reorganization of the Baird Funds, Inc. – RiverFront Long-Term Growth Fund International Developed Equities into the Fund). The table does not reflect the deduction of taxes that a shareholder would pay on Fund distributions or the redemption of Fund shares. This Fund is not suitable for all investors and is subject to investment risks, including possible loss of the principal amount invested. There is no guarantee that the Fund will continue to hold any one particular security or stay invested in any one particular company. The composition of the Fund's top holdings is subject to change.
Performance figures are historical and reflect the change in share price, reinvested distributions, changes in net asset value, sales charges and capital gains distributions, if any. Not FDIC Insured – No Bank Guarantee – May Lose Value Top Ten Holdings (as a % of Net Assets) † Portfolio Composition (as a % of Net Assets) WisdomTree® Europe Hedged Equity Fund iShares® MSCI Japan ETF iShares® Currency Hedged MSCI Germany ETF Deutsche Xâ€trackers MSCI EAFE Hedged Equity ETF WisdomTree® Japan Hedged Equity Fund SPDR® Morgan Stanley Technology ETF Market Vectors® Oil Service ETF Vanguard® FTSE Developed Markets ETF Vanguard® FTSE Europe ETF PowerShares® KBW Bank Portfolio Top Ten Holdings † International Developed Equities - 64.09% 22.10% 9.80% Domestic Core Equities - 31.92% Domestic Small-Cap Equities - 0.54% 6.62% International Emerging Market Equities - 0.16% 6.10% Other - 0.08% Cash, Cash Equivalents & Other Net Assets - 3.21% 5.38% 5.36% 3.89% 3.83% 2.95% 2.76% 68.79% Holdings are subject to change, and may not reflect the current or future position of the portfolio. Table presents indicative values only. Excludes cash & cash equivalents. 126 | October 31, 2015 .
RiverFront Moderate Growth & Income Fund Performance Update October 31, 2015 (Unaudited) Performance of $10,000 Initial Investment (as of October 31, 2015) Comparison of change in value of a $10,000 investment (includes maximum sales charges of 5.50%) $22k S&P 500® Total Return Index - $20,638 $20k $18k $16k 50% S&P 500®/50% Barclays U.S. Aggregate Bond - $15,821 $14k RiverFront Moderate Growth & Income Fund Class A (NAV) - $13,777 RiverFront Moderate Growth & Income Fund Class A (MOP) - $13,022 $12k $10k 10/31/15 10/31/14 10/31/13 10/31/12 10/31/11 8/2/10^ $8k The chart above represents historical performance of a hypothetical investment of $10,000 in the Fund since inception. Past performance does not guarantee future results. This chart does not reflect the deduction of taxes that a shareholder would pay on Fund distributions or the redemption of Fund shares. Average Annual Total Returns (as of October 31, 2015) Class A (NAV) Class A (MOP) Class C (NAV) Class C (CDSC) Class I S&P 500® Total 1 Return Index 50% S&P 500® and 50% Barclays U.S. Aggregate Bond1,2 6 Month â€2.27% â€7.67% â€2.72% â€3.69% â€2.30% 1 Year 1.33% â€4.26% 0.52% â€0.42% 1.50% 3 Years 6.83% 4.83% 6.00% 6.00% 7.04% 5 Years 5.85% 4.66% 5.03% 5.03% 6.09% Since Inception^ 6.30% 5.16% 5.50% 5.50% 6.55% Total Expense Ratio What You Pay* 1.66% 1.50% 2.42% 2.25% 1.42% 1.25% 0.77% 5.20% 16.20% 14.33% 14.81% 0.48% 3.82% 8.86% 8.76% 9.14% Performance data quoted represents past performance.
Past performance does not guarantee future results. Investment return and principal value of an investment will fluctuate so that an investor's shares, when sold or redeemed, may be worth more or less than the original cost. Current performance data may be higher or lower than actual data quoted.
For the most current month-end performance data, please call 1-866-759-5679. Maximum Offering Price (MOP) for Class A shares includes the Fund’s maximum sales charge of 5.50%. Performance shown at NAV does not include these sales charges and would have been lower had it been taken into account. If you invest $1 million or more, either as a lump sum or through the Fund’s accumulation or letter of intent programs, you can purchase Class A shares without an initial sales charge (load).
A Contingent Deferred Sales Charge (“CDSC”) of 1.00% may apply to Class C shares redeemed within the first 12 months after a purchase, and on Class A shares redeemed within the first 18 months after a purchase in excess of $1 million. Performance less than 1 year is cumulative. 127 | October 31, 2015 . RiverFront Moderate Growth & Income Fund Performance Update October 31, 2015 (Unaudited) 1 S&P 500® Total Return Index is the Standard & Poor's composite index of 500 stocks, a widely recognized, unmanaged index of common stock prices. The index is not actively managed and does not reflect any deduction for fees, expenses or taxes. An investor may not invest directly in an index. 2 The Barclays U.S. Aggregate Bond Index is a broad-based benchmark that measures the investment grade, U.S.
dollar-denominated, fixed-rate taxable bond market, including Treasuries, government-related and corporate securities, MBS (agency fixed-rate and hybrid ARM passthroughs), ABS, and CMBS. The index is not actively managed and does not reflect any deductions for fees, expenses or taxes. An investor may not invest directly in an index. ^ Fund inception date of August 2, 2010. * What You Pay reflects the Advisor's and Sub-Advisor’s decision to contractually limit expenses through February 29, 2016 and Acquired Fund Fees and Expenses of 0.35%.
Please see the prospectus for additional information. The table does not reflect the deduction of taxes that a shareholder would pay on Fund distributions or the redemption of Fund shares. This Fund is not suitable for all investors and is subject to investment risks, including possible loss of the principal amount invested. There is no guarantee that the Fund will continue to hold any one particular security or stay invested in any one particular company. The composition of the Fund's top holdings is subject to change. Performance figures are historical and reflect the change in share price, reinvested distributions, changes in net asset value, sales charges and capital gains distributions, if any. Not FDIC Insured – No Bank Guarantee – May Lose Value Top Ten Holdings (as a % of Net Assets) † Portfolio Composition (as a % of Net Assets) † WisdomTree® Europe Hedged Equity Fund RiverFront Strategic Income Fund iShares® MSCI Japan ETF PowerShares® Europe Currency Hedged Low Volatility Portfolio PIMCO Enhanced Short Maturity Active ETF Market Vectors® Oil Service ETF SPDR® Morgan Stanley Technology ETF iShares® Core S&P 500® ETF PIMCO 0â€5 Year High Yield Corporate Bond Index ETF Consumer Staples Select Sector SPDR® Fund Top Ten Holdings 11.86% 9.79% 6.09% Fixed Income - 35.23% Domestic Core Equities - 31.08% International Developed Equities - 30.63% Domestic Small-Cap Equities - 0.42% 3.63% Domestic MLPs - 0.02% Other - 0.02% 3.63% 3.58% 3.48% 3.40% Cash, Cash Equivalents & Other Net Assets - 2.60% 3.16% 3.12% 51.74% Holdings are subject to change, and may not reflect the current or future position of the portfolio.
Table presents indicative values only. Excludes cash & cash equivalents. 128 | October 31, 2015 . RiverFront Conservative Income Builder Fund Statement of Investments October 31, 2015 Value (Note 2) Shares Equity (continued) WisdomTree® Japan Hedged Equity Fund 5,458 $ 290,857 WisdomTree® Japan SmallCap Dividend Fund 1,633 91,546 WisdomTree® LargeCap Dividend Fund 8,318 603,720 4,743,902 EXCHANGE TRADED FUNDS (97.37%) Debt (57.23%) Guggenheim BulletShares 2016 Corporate Bond ETF 45,121 Guggenheim BulletShares 2017 44,118 Corporate Bond ETF Guggenheim BulletShares 2018 Corporate Bond ETF 47,381 iShares® 0â€5 Year High Yield Corporate Bond ETF 5,930 iShares® 1â€3 Year Treasury Bond ETF 3,384 iShares® Barclays 1â€3 Year Credit Bond ETF 4,854 PIMCO 0â€5 Year High Yield 3,629 Corporate Bond Index ETF PIMCO Enhanced Short Maturity Active ETF 3,967 (a) RiverFront Strategic Income Fund 47,086 SPDR® Barclays Short Term Corporate Bond ETF 12,466 SPDR® Barclays Short Term High Yield Bond ETF 14,223 Equity (40.14%) Consumer Staples Select Sector 2,415 SPDR® Fund Deutsche Xâ€trackers MSCI EAFE Hedged Equity ETF 11,566 iShares® Core S&P 500® ETF 2,681 iShares® Currency Hedged MSCI Germany ETF 8,936 iShares® Currency Hedged MSCI (b) 7,567 Italy ETF iShares® MSCI Japan ETF 47,472 iShares® U.S. Consumer Goods ETF 1,514 Market Vectors® Oil Service ETF 3,113 PowerShares® Aerospace & Defense Portfolio 2,360 PowerShares® Europe Currency Hedged Low Volatility Portfolio 6,800 PowerShares® KBW Bank Portfolio 3,910 PowerShares® S&P 500® Exâ€Rate Sensitive Low Volatility 4,762 Portfolio PowerShares® S&P 500® High Dividend Portfolio 3,454 SPDR® Morgan Stanley Technology ETF 2,309 WisdomTree® Europe Hedged Equity Fund 12,122 $ 1,000,784 1,003,243 1,004,477 276,694 287,065 510,932 351,686 400,191 1,160,199 381,085 388,288 6,764,644 120,460 322,460 560,463 Value (Note 2) Shares TOTAL EXCHANGE TRADED FUNDS (Cost $11,417,697) 11,508,546 7-Day Value Yield Shares (Note 2) SHORT TERM INVESTMENTS (6.80%) Money Market Fund (6.80%) Morgan Stanley Institutional Liquidity Fund †Prime Portfolio 0.097% 804,170 TOTAL SHORT TERM INVESTMENTS (Cost $804,170) TOTAL INVESTMENTS (104.17%) (Cost $12,221,867) Liabilities In Excess Of Other Assets (â€4.17%) NET ASSETS (100.00%) 804,170 804,170 $ 12,312,716 (492,624) $ 11,820,092 225,009 182,092 584,855 165,798 95,164 84,370 171,428 146,430 120,957 114,846 126,672 (a) (b) Affiliated Company. See Note 7 in Notes to Financial Statements. Non-Income Producing Security. Common Abbreviations: EAFE - Europe, Australia, and Far East. ETF - Exchange Traded Fund. KBW- Keefe, Bruyette, & Woods. MSCI - Morgan Stanley Capital International. PIMCO - Pacific Investment Management Company. S&P - Standard and Poor's. SPDR - Standard and Poor's Depositary Receipt. For Fund compliance purposes, the Fund's industry classifications refer to any one or more of the industry sub-classifications used by one or more widely recognized market indexes or ratings group indexes, and/or as defined by Fund management. This definition may not apply for purposes of this report, which may combine industry sub-classifications for reporting ease.
Industries are shown as a percent of net assets. See Notes to Financial Statements. 736,775 129 | October 31, 2015 . RiverFront Dynamic Equity Income Fund Statement of Investments October 31, 2015 Value (Note 2) Shares COMMON STOCKS (4.68%) Consumer, Cyclical (0.78%) Retail (0.78%) Costco Wholesale Corp. 3,796 TOTAL CONSUMER, CYCLICAL Consumer, Nonâ€Cyclical (2.31%) Beverages (0.50%) PepsiCo, Inc. 3,742 Pharmaceuticals (1.81%) Bristolâ€Myers Squibb Co. 11,907 Pfizer, Inc. 18,223 TOTAL CONSUMER, NONâ€CYCLICAL Industrial (1.10%) Machinery, Construction & Mining (0.50%) Caterpillar, Inc. 5,365 Miscellaneous Manufacturers (0.60%) 3M Co. 2,944 TOTAL INDUSTRIAL Technology (0.49%) Software (0.49%) Paychex, Inc. 7,418 TOTAL TECHNOLOGY TOTAL COMMON STOCKS (Cost $3,373,821) $ 600,224 600,224 382,395 785,266 616,302 1,401,568 1,783,963 391,592 462,826 854,418 382,620 382,620 3,621,225 EXCHANGE TRADED FUNDS (92.51%) Debt (11.05%) RiverFront Strategic Income (a) 215,714 5,315,193 Fund SPDR® Barclays Short Term High Yield Bond ETF 118,235 3,227,815 8,543,008 Equity (81.46%) Consumer Staples Select Sector SPDR® Fund 49,964 2,492,204 Deutsche Xâ€trackers MSCI EAFE Hedged Equity ETF 80,974 2,257,555 Global X FTSE Nordic Region ETF 14,623 325,069 iShares® Core S&P 500® ETF 10,764 2,250,214 Value (Note 2) Shares Equity (continued) iShares® Currency Hedged MSCI Germany ETF iShares® Currency Hedged MSCI Italy ETF(b) iShares® MSCI Japan ETF iShares® MSCI United Kingdom ETF iShares® U.S. Home Construction ETF Market Vectors® Oil Service ETF PowerShares® Aerospace & Defense Portfolio PowerShares® Europe Currency Hedged Low Volatility Portfolio PowerShares® KBW Bank Portfolio PowerShares® S&P 500® Ex†Rate Sensitive Low Volatility Portfolio PowerShares® S&P 500® High Dividend Portfolio SPDR® Morgan Stanley Technology ETF Vanguard® FTSE Europe ETF Vanguard® Information Technology ETF Vanguard® Telecommunication Services ETF WisdomTree® Europe Hedged Equity Fund WisdomTree® Japan Hedged Equity Fund WisdomTree® Japan SmallCap Dividend Fund WisdomTree® LargeCap Dividend Fund TOTAL EXCHANGE TRADED FUNDS (Cost $69,870,044) 130 | October 31, 2015 188,991 $ 4,758,793 48,243 497,997 1,160,920 6,135,323 53,784 939,606 28,614 92,605 778,015 2,830,935 22,076 789,217 68,209 1,719,549 69,039 2,585,511 58,994 1,498,477 151,724 5,044,823 51,617 42,681 2,831,709 2,222,826 3,716 410,469 16,020 1,372,433 247,643 15,051,742 61,495 3,277,069 13,408 751,653 20,584 1,493,987 62,978,099 71,521,107 . RiverFront Dynamic Equity Income Fund Statement of Investments October 31, 2015 7-Day Yield Value (Note 2) Shares SHORT TERM INVESTMENTS (2.51%) Money Market Fund (2.51%) Morgan Stanley Institutional Liquidity Fund †Prime Portfolio 0.097% 1,939,710 $ TOTAL SHORT TERM INVESTMENTS (Cost $1,939,710) TOTAL INVESTMENTS (99.70%) (Cost $75,183,575) Other Assets In Excess Of Liabilities (0.30%) NET ASSETS (100.00%) 1,939,710 1,939,710 $ 77,082,042 233,478 $ 77,315,520 Common Abbreviations: EAFE - Europe, Australia, and Far East. ETF - Exchange Traded Fund. FTSE - Financial Times and the London Stock Exchange. KBW- Keefe, Bruyette, & Woods. MSCI - Morgan Stanley Capital International. S&P - Standard and Poor's. SPDR - Standard and Poor's Depositary Receipt. For Fund compliance purposes, the Fund's industry classifications refer to any one or more of the industry sub-classifications used by one or more widely recognized market indexes or ratings group indexes, and/or as defined by Fund management. This definition may not apply for purposes of this report, which may combine industry sub-classifications for reporting ease. Industries are shown as a percent of net assets. See Notes to Financial Statements. (a) (b) Affiliated Company. See Note 7 in Notes to Financial Statements. Non-Income Producing Security. 131 | October 31, 2015 .
RiverFront Global Allocation Fund Statement of Investments October 31, 2015 Value (Note 2) Shares COMMON STOCKS (4.67%) Consumer, Cyclical (0.79%) Retail (0.79%) Costco Wholesale Corp. 2,214 TOTAL CONSUMER, CYCLICAL Consumer, Nonâ€Cyclical (2.27%) Beverages (0.50%) PepsiCo, Inc. 2,160 Pharmaceuticals (1.77%) Bristolâ€Myers Squibb Co. 6,520 Pfizer, Inc. 10,520 TOTAL CONSUMER, NONâ€CYCLICAL Industrial (1.11%) Machinery, Construction & Mining (0.51%) Caterpillar, Inc. 3,092 Miscellaneous Manufacturers (0.60%) 3M Co. 1,685 TOTAL INDUSTRIAL Technology (0.50%) Software (0.50%) Paychex, Inc. 4,255 TOTAL TECHNOLOGY TOTAL COMMON STOCKS (Cost $1,941,181) $ 350,077 350,077 220,730 429,994 355,787 785,781 1,006,511 225,685 264,899 490,584 219,473 219,473 2,066,645 EXCHANGE TRADED FUNDS (92.95%) Debt (2.19%) RiverFront Strategic Income (a) 39,386 Fund Equity (90.76%) Deutsche Xâ€trackers MSCI EAFE Hedged Equity ETF 57,838 Financial Select Sector SPDR® Fund 43,321 First Trust NYSE Arca Biotechnology Index Fund 5,088 Global X FTSE Nordic Region ETF 8,511 iShares® Core S&P 500® ETF 5,485 iShares® Currency Hedged MSCI Germany ETF 115,372 970,471 1,612,523 TOTAL EXCHANGE TRADED FUNDS (Cost $39,830,443) 530,780 189,200 1,146,639 Equity (continued) iShares® Currency Hedged MSCI Italy ETF(b) 27,659 $ 665,586 iShares® MSCI EAFE ETF 9,210 562,823 iShares® MSCI Japan ETF 308,144 3,796,334 iShares® MSCI Switzerland Capped ETF 13,475 428,101 iShares® MSCI United Kingdom 71,223 1,244,266 ETF iShares® U.S. Consumer Goods ETF 12,860 1,408,299 iShares® U.S. Home Construction ETF 33,893 921,551 Market Vectors® Oil Service ETF 49,671 1,518,442 PowerShares® Aerospace & Defense Portfolio 11,200 400,400 PowerShares® Europe Currency Hedged Low Volatility 46,738 1,178,265 Portfolio PowerShares® KBW Bank Portfolio 24,750 926,887 PowerShares® S&P 500® Ex†Rate Sensitive Low Volatility Portfolio 34,121 866,690 SPDR® Morgan Stanley Technology ETF 43,102 2,364,576 Vanguard® FTSE Developed 41,156 1,565,574 Markets ETF 24,548 1,278,460 Vanguard® FTSE Europe ETF Vanguard® Telecommunication Services ETF 7,483 641,069 WisdomTree® Europe Hedged Equity Fund 152,080 9,243,422 WisdomTree® Japan Hedged Equity Fund 39,422 2,100,798 WisdomTree® Japan SmallCap Dividend Fund 7,711 432,279 WisdomTree® LargeCap Dividend Fund 16,789 1,218,546 40,189,747 1,043,170 Value (Note 2) Shares 2,905,067 132 | October 31, 2015 41,160,218 . RiverFront Global Allocation Fund Statement of Investments October 31, 2015 7-Day Yield Value (Note 2) Shares SHORT TERM INVESTMENTS (5.48%) Money Market Fund (5.48%) Morgan Stanley Institutional Liquidity Fund †Prime Portfolio 0.097% 2,428,247 $ TOTAL SHORT TERM INVESTMENTS (Cost $2,428,247) TOTAL INVESTMENTS (103.10%) (Cost $44,199,871) Liabilities In Excess Of Other Assets (â€3.10%) NET ASSETS (100.00%) 2,428,247 2,428,247 $ 45,655,110 (1,371,141) $ 44,283,969 Common Abbreviations: EAFE - Europe, Australia, and Far East. ETF - Exchange Traded Fund. FTSE - Financial Times and the London Stock Exchange. KBW- Keefe, Bruyette, & Woods. MSCI - Morgan Stanley Capital International. NYSE - New York Stock Exchange S&P - Standard and Poor's. SPDR - Standard and Poor's Depositary Receipt. For Fund compliance purposes, the Fund's industry classifications refer to any one or more of the industry sub-classifications used by one or more widely recognized market indexes or ratings group indexes, and/or as defined by Fund management. This definition may not apply for purposes of this report, which may combine industry sub-classifications for reporting ease. Industries are shown as a percent of net assets. See Notes to Financial Statements. (a) (b) Affiliated Company. See Note 7 in Notes to Financial Statements. Non-Income Producing Security. 133 | October 31, 2015 .
RiverFront Global Growth Fund Statement of Investments October 31, 2015 Value (Note 2) Shares COMMON STOCKS (4.81%) Consumer, Cyclical (0.80%) Retail (0.80%) Costco Wholesale Corp. 4,085 TOTAL CONSUMER, CYCLICAL Consumer, Nonâ€Cyclical (2.40%) Beverages (0.50%) PepsiCo, Inc. 3,948 Pharmaceuticals (1.90%) Bristolâ€Myers Squibb Co. 13,245 Pfizer, Inc. 19,440 TOTAL CONSUMER, NONâ€CYCLICAL Industrial (1.11%) Machinery, Construction & Mining (0.51%) Caterpillar, Inc. 5,661 Miscellaneous Manufacturers (0.60%) 3M Co. 3,089 TOTAL INDUSTRIAL Technology (0.50%) Software (0.50%) Paychex, Inc. 7,781 TOTAL TECHNOLOGY TOTAL COMMON STOCKS (Cost $3,600,785) $ 645,920 645,920 403,446 873,508 657,461 1,530,969 1,934,415 413,196 485,622 898,818 401,344 401,344 3,880,497 EXCHANGE TRADED FUNDS (92.61%) Equity (92.61%) Consumer Staples Select Sector SPDR® Fund 11,833 Deutsche Xâ€trackers MSCI EAFE Hedged Equity ETF 176,432 Financial Select Sector SPDR® Fund 62,736 First Trust NYSE Arca Biotechnology Index Fund 10,635 Global X FTSE Nordic Region ETF 15,827 iShares® Core S&P 500® ETF 5,841 iShares® Currency Hedged MSCI 212,207 Germany ETF iShares® Currency Hedged MSCI (a) 51,066 Italy ETF 590,230 Value (Note 2) Shares Equity (continued) iShares® MSCI Japan ETF iShares® MSCI Pacific ex Japan ETF iShares® MSCI United Kingdom ETF iShares® U.S. Consumer Goods ETF iShares® U.S. Home Construction ETF Market Vectors® Oil Service ETF PowerShares® Aerospace & Defense Portfolio PowerShares® Europe Currency Hedged Low Volatility Portfolio PowerShares® KBW Bank Portfolio PowerShares® S&P 500® Ex†Rate Sensitive Low Volatility Portfolio SPDR® Morgan Stanley Technology ETF Vanguard® FTSE Developed Markets ETF Vanguard® FTSE Europe ETF Vanguard® Information Technology ETF Vanguard® Telecommunication Services ETF WisdomTree® Europe Hedged Equity Fund WisdomTree® Japan Hedged Equity Fund WisdomTree® Japan SmallCap Dividend Fund TOTAL EXCHANGE TRADED FUNDS (Cost $70,831,203) 4,918,924 1,510,683 1,109,443 351,834 1,221,061 5,343,372 1,228,852 134 | October 31, 2015 641,759 $ 7,906,471 16,868 659,033 102,410 1,789,103 13,993 1,532,373 66,416 102,627 1,805,851 3,137,307 27,747 991,955 79,280 1,998,649 59,362 2,223,107 63,678 1,617,453 78,872 4,326,918 81,212 45,688 3,089,305 2,379,431 6,387 705,508 15,350 1,315,035 293,310 17,827,382 81,492 4,342,709 13,951 782,093 74,704,082 74,704,082 . RiverFront Global Growth Fund Statement of Investments October 31, 2015 7-Day Yield Value (Note 2) Shares SHORT TERM INVESTMENTS (2.84%) Money Market Fund (2.84%) Morgan Stanley Institutional Liquidity Fund †Prime Portfolio 0.097% 2,288,635 $ TOTAL SHORT TERM INVESTMENTS (Cost $2,288,635) TOTAL INVESTMENTS (100.26%) (Cost $76,720,623) Liabilities In Excess Of Other Assets (â€0.26%) NET ASSETS (100.00%) 2,288,635 2,288,635 $ 80,873,214 (212,330) $ 80,660,884 Common Abbreviations: EAFE - Europe, Australia, and Far East. ETF - Exchange Traded Fund. FTSE - Financial Times and the London Stock Exchange. KBW- Keefe, Bruyette, & Woods. MSCI - Morgan Stanley Capital International. NYSE - New York Stock Exchange. S&P - Standard and Poor's. SPDR - Standard and Poor's Depositary Receipt. For Fund compliance purposes, the Fund's industry classifications refer to any one or more of the industry sub-classifications used by one or more widely recognized market indexes or ratings group indexes, and/or as defined by Fund management. This definition may not apply for purposes of this report, which may combine industry sub-classifications for reporting ease. Industries are shown as a percent of net assets. See Notes to Financial Statements. (a) Non-Income Producing Security. 135 | October 31, 2015 .
RiverFront Moderate Growth & Income Fund Statement of Investments October 31, 2015 Value (Note 2) Shares Shares COMMON STOCKS (4.56%) Consumer, Cyclical (0.77%) Retail (0.77%) Costco Wholesale Corp. 6,893 TOTAL CONSUMER, CYCLICAL Consumer, Nonâ€Cyclical (2.18%) Beverages (0.50%) PepsiCo, Inc. 6,904 Pharmaceuticals (1.68%) Bristolâ€Myers Squibb Co. 21,053 Pfizer, Inc. 29,420 TOTAL CONSUMER, NONâ€CYCLICAL Industrial (1.11%) Machinery, Construction & Mining (0.51%) Caterpillar, Inc. 9,899 Miscellaneous Manufacturers (0.60%) 3M Co. 5,427 TOTAL INDUSTRIAL Technology (0.50%) Software (0.50%) Paychex, Inc. 13,672 TOTAL TECHNOLOGY TOTAL COMMON STOCKS (Cost $5,987,068) $ 1,089,921 1,089,921 705,520 1,388,445 994,984 2,383,429 3,088,949 722,528 853,179 1,575,707 705,202 705,202 6,459,779 EXCHANGE TRADED FUNDS (92.83%) Debt (35.15%) Guggenheim BulletShares 2016 Corporate Bond ETF 165,990 Guggenheim BulletShares 2017 Corporate Bond ETF 162,267 Guggenheim BulletShares 2018 Corporate Bond ETF 174,054 iShares® 0â€5 Year High Yield Corporate Bond ETF 76,041 iShares® 1â€3 Year Treasury Bond ETF 48,562 iShares® Barclays 1â€3 Year 10,832 Credit Bond ETF PIMCO 0â€5 Year High Yield Corporate Bond Index ETF 46,181 3,681,658 3,689,952 3,689,945 3,548,073 Debt (continued) PIMCO Enhanced Short Maturity Active ETF RiverFront Strategic Income Fund(a) SPDR® Barclays Short Term Corporate Bond ETF SPDR® Barclays Short Term High Yield Bond ETF Equity (57.68%) Consumer Staples Select Sector SPDR® Fund Deutsche Xâ€trackers MSCI EAFE Hedged Equity ETF iShares® Core S&P 500® ETF iShares® Currency Hedged MSCI Germany ETF iShares® Currency Hedged MSCI Italy ETF(b) iShares® MSCI Japan ETF iShares® U.S. Home Construction ETF Market Vectors® Oil Service ETF PowerShares® Aerospace & Defense Portfolio PowerShares® Europe Currency Hedged Low Volatility Portfolio PowerShares® KBW Bank Portfolio PowerShares® S&P 500® Ex†Rate Sensitive Low Volatility Portfolio PowerShares® S&P 500® High Dividend Portfolio SPDR® Morgan Stanley Technology ETF Vanguard® Telecommunication Services ETF WisdomTree® Europe Hedged Equity Fund WisdomTree® Japan Hedged Equity Fund WisdomTree® Japan SmallCap Dividend Fund 4,119,514 1,140,176 4,475,401 136 | October 31, 2015 Value (Note 2) 50,887 $ 5,133,481 562,358 13,856,501 78,678 2,405,186 146,509 3,999,696 49,739,583 88,626 4,420,665 123,129 22,988 3,432,837 4,805,641 106,845 2,690,357 88,989 699,557 2,141,431 8,618,542 42,893 165,641 1,166,261 5,063,645 33,013 1,180,215 203,650 5,134,017 105,140 3,937,493 98,210 2,494,583 112,629 3,744,914 89,784 4,925,550 27,607 2,365,092 276,109 16,781,905 73,610 3,922,677 18,717 1,049,275 . RiverFront Moderate Growth & Income Fund Statement of Investments October 31, 2015 Value (Note 2) Shares Equity (continued) WisdomTree® LargeCap Dividend Fund 51,773 $ 3,757,684 81,632,784 TOTAL EXCHANGE TRADED FUNDS (Cost $128,809,380) 131,372,367 7-Day Value Yield Shares (Note 2) SHORT TERM INVESTMENTS (2.81%) Money Market Fund (2.81%) Morgan Stanley Institutional Liquidity Fund †Prime Portfolio 0.097% 3,970,144 TOTAL SHORT TERM INVESTMENTS (Cost $3,970,144) TOTAL INVESTMENTS (100.20%) (Cost $138,766,592) Liabilities In Excess Of Other Assets (â€0.20%) NET ASSETS (100.00%) Common Abbreviations: EAFE - Europe, Australia, and Far East. ETF - Exchange Traded Fund. KBW- Keefe, Bruyette, & Woods. MSCI - Morgan Stanley Capital International. PIMCO - Pacific Investment Management Company. S&P - Standard and Poor's. SPDR - Standard and Poor's Depositary Receipt. For Fund compliance purposes, the Fund's industry classifications refer to any one or more of the industry sub-classifications used by one or more widely recognized market indexes or ratings group indexes, and/or as defined by Fund management. This definition may not apply for purposes of this report, which may combine industry sub-classifications for reporting ease. Industries are shown as a percent of net assets. 3,970,144 See Notes to Financial Statements.
3,970,144 $ 141,802,290 (279,056) $ 141,523,234 (a) (b) Affiliated Company. See Note 7 in Notes to Financial Statements. Non-Income Producing Security. 137 | October 31, 2015 . RiverFront Global Allocation Series Statements of Assets and Liabilities October 31, 2015 RiverFront Conservative Income Builder Fund ASSETS Investments, at value Investments in affiliates, at value Receivable for shares sold Dividends and interest receivable Prepaid expenses and other assets Total Assets RiverFront Dynamic Equity Income Fund RiverFront Global Allocation Fund $ 11,152,517 $ 71,766,849 $ 44,684,639 1,160,199 5,315,193 970,471 – 288,823 122,618 59 10,409 5,570 25,705 27,741 25,608 12,338,480 77,409,015 45,808,906 RiverFront Moderate Growth & Income Fund RiverFront Global Growth Fund $ 80,873,214 $ 127,945,789 – 13,856,501 45,577 79,679 11,448 19,005 39,650 36,206 80,969,889 141,937,180 LIABILITIES Payable for investments purchased Payable for shares redeemed Investment advisory fees payable Administration and transfer agency fees payable Distribution and services fees payable Professional fees payable Custody fees payable Printing fees payable Accrued expenses and other liabilities Total Liabilities NET ASSETS NET ASSETS CONSIST OF Paidâ€in capital Accumulated net investment income Accumulated net realized gain/(loss) on investments Net unrealized appreciation in value on investments NET ASSETS INVESTMENTS, AT COST INVESTMENTS IN AFFILIATES, AT COST 503,873 – 364 1,946 6,701 3,503 781 358 862 518,388 $ 11,820,092 $ – 50 40,444 8,813 32,512 4,007 1,096 3,693 2,880 93,495 77,315,520 $ 1,462,516 11,788 20,040 5,553 15,881 3,744 930 2,158 2,327 1,524,937 44,283,969 – 235,524 35,367 9,571 15,995 4,049 995 4,153 3,351 309,005 $ 80,660,884 $ – 235,169 82,949 15,214 63,728 4,605 1,419 6,652 4,210 413,946 141,523,234 $ 11,741,051 $ 73,728,146 $ 42,468,604 $ 75,330,241 $ 135,145,049 7,336 92,674 200,285 463,691 206,858 (19,144) 1,596,233 159,841 714,361 3,135,629 90,849 1,898,467 1,455,239 4,152,591 3,035,698 $ 11,820,092 $ 77,315,520 $ 44,283,969 $ 80,660,884 $ 141,523,234 $ 11,049,593 $ 69,776,840 $ 43,218,055 $ 76,720,623 $ 124,648,429 $ 1,172,274 $ 5,406,735 $ 981,816 $ – $ 14,118,163 See Notes to Financial Statements. 138 | October 31, 2015 . RiverFront Global Allocation Series Statements of Assets and Liabilities (continued) RiverFront Conservative Income Builder Fund October 31, 2015 RiverFront Dynamic Equity Income Fund RiverFront Global Allocation Fund RiverFront Moderate Growth & Income Fund RiverFront Global Growth Fund PRICING OF SHARES Class A: Net Asset Value, offering and redemption price per share Net Assets Shares of beneficial interest outstanding (unlimited number of shares, no par value common stock authorized) Maximum offering price per share ((NAV/0.9450), based on maximum sales charge of 5.50% of the offering price) Class C: Net Asset Value, offering and redemption price per share(a) Net Assets Shares of beneficial interest outstanding (unlimited number of shares, no par value common stock authorized) Class I: Net Asset Value, offering and redemption price per share Net Assets Shares of beneficial interest outstanding (unlimited number of shares, no par value common stock authorized) Class L: Net Asset Value, offering and redemption price per share Net Assets Shares of beneficial interest outstanding (unlimited number of shares, no par value common stock authorized) Investor Class: Net Asset Value, offering and redemption price per share Net Assets Shares of beneficial interest outstanding (unlimited number of shares, no par value common stock authorized) $ $ $ $ $ (a) 99,265 11.07 $ 1,565,429 $ $ 693,306 13.37 $ 12.91 $ 10.37 $ 12.44 $ 11.98 8,610,383 $ 34,766,471 $ 17,089,385 830,464 2,795,628 1,312,776 2,126,560 14.76 $ 12.15 13.67 $ 11.39 $ $ 12,907,768 $ 70,770,665 1,426,451 944,172 6,212,065 10.30 $ 12.56 $ 11.99 $ 14.03 $ 11.47 2,171,225 $ 22,780,107 $ 18,738,956 $ 16,411,902 $ 46,350,137 210,881 1,813,902 N/A N/A N/A N/A N/A N/A N/A 1,169,862 N/A N/A $ N/A $ 13.87 6,924,249 N/A N/A 1,863,673 N/A N/A 4,039,603 N/A $ 14.01 N/A $ 26,108,513 N/A N/A 1,562,833 12.20 $ 13.95 $ 11.48 8,455,628 $ 18,308,452 $ 24,402,432 10.46 $ 12.63 $ 1,038,484 $ 19,768,942 $ N/A N/A N/A N/A N/A 499,084 N/A Redemption price per share may be reduced for any applicable contingent deferred sales charge. For a description of a possible sales charge, please see the Fund's Prospectus. See Notes to Financial Statements. 139 | October 31, 2015 . RiverFront Global Allocation Series Statements of Operations For the Year Ended October 31, 2015 RiverFront Conservative Income Builder Fund INVESTMENT INCOME Dividends Dividends from affiliated securities Total Investment Income $ (10,923) (47,971) (20,408) – – 134,508 108,661 (49,727) 337,579 42,328 3,731 21,782 158,029 – 18,409 6,944 42,208 437 5,083 880 11,933 649,343 617,344 75,739 5,826 (24,491) (44,563) (43,041) – – 537,248 575,330 (79,726) (40,534) (29,002) (36,381) (60,547) (17,309) 894,807 1,290,107 109,174 2,184,914 $ – 2,184,914 3,812,380 495,767 4,308,147 669,233 82,236 5,201 1,196,494 145,269 8,804 67,008 685,345 – 23,676 20,549 48,019 1,642 8,387 3,096 20,710 2,228,999 (39,744) (102,129) (67,897) – – 2,019,229 2,288,918 2,496,740 45,519 326,033 – 19,945 12,447 45,023 844 5,858 1,602 14,278 1,170,458 (36,445) (65,254) (43,549) – – 1,025,210 1,229,120 1,166,295 (7,360) (30,319) (33,482) – (38,996) 42,226 506,364 277,874 640,999 678,016 (58,335) (2,136,654) (750,472) (1,412,507) (4,017,171) (73,196) (585,806) (881,411) 734,806 $ (10,476) $ 627,773 $ 1,407,507 NET REALIZED AND UNREALIZED LOSS ON INVESTMENTS NET INCREASE/(DECREASE) IN NET ASSETS RESULTING FROM OPERATIONS 2,997 52,835 – 17,007 1,634 41,255 109 4,154 195 8,062 213,810 $ 74,304 10,247 1,011 1,061,571 51,007 1,112,578 RiverFront Moderate Growth & Income Fund RiverFront Global Growth Fund 2,072,430 $ 181,900 2,254,330 Investment advisory fees Administrative fees Transfer agency fees Distribution and service fees Class A Class C Investor Class Professional fees Reports to shareholders and printing fees State registration fees Insurance fees Custody fees Trustees' fees and expenses Miscellaneous expenses Total Expenses Less fees waived/reimbursed by investment advisor (Note 8) Class A Class C Class I Class L Investor Class Net Expenses Net Investment Income Net realized gain/(loss) on investments Net realized loss on investments †affiliated securities Net realized gain distributions from other investment companies Net change in unrealized depreciation on investments RiverFront Global Allocation Fund 210,970 $ 32,199 243,169 EXPENSES RiverFront Dynamic Equity Income Fund $ 35,465 $ (494,314) See Notes to Financial Statements. 140 | October 31, 2015 43,481 123,978 18,749 25,222 15,433 66,938 893 6,397 1,730 19,089 1,078,580 (662,334) . RiverFront Conservative Income Builder Fund Statements of Changes in Net Assets For the Fiscal Period Ended October 31, 2014(a) For the Year Ended October 31, 2015 For the Year Ended April 30, 2014 OPERATIONS Net investment income Net realized gain/(loss) on investments Net realized loss on investments †affiliated securities Net realized gain distributions from other investment companies Net change in unrealized appreciation/(depreciation) on investments Net Increase in Net Assets Resulting from Operations $ 108,661 $ (49,727) (7,360) 42,226 (58,335) 35,465 29,975 $ 110,437 (42) – (67,675) 72,695 44,780 173,828 (270) 1,636 107,775 327,749 DISTRIBUTIONS Dividends to shareholders from net investment income Class A Class C Class I Dividends to shareholders from net realized gains Class A Class C Class I Net Decrease in Net Assets from Distributions (18,043) (50,246) (34,644) (33,682) (128,451) (53,269) (318,335) (7,517) (14,233) (13,957) – – – (35,707) (7,713) (26,587) (11,868) (16,067) (47,172) (27,911) (137,318) BENEFICIAL INTEREST TRANSACTIONS (NOTE 6) Shares sold Class A Class C Class I Dividends reinvested Class A Class C Class I Shares redeemed Class A Class C Class I Net Increase in Net Assets Derived from Beneficial Interest Transactions Net increase in net assets NET ASSETS Beginning of year End of year * *Including accumulated net investment income of: (a) $ $ 724,894 5,025,196 1,756,806 23,644 152,720 77,128 (750,894) (1,445,157) (2,401,248) 3,163,089 2,880,219 8,939,873 11,820,092 $ 7,336 $ 224,208 546,840 1,216,347 2,524,709 1,817,467 1,927,846 3,697 8,715 12,819 68,221 13,270 39,779 (244,851) (92,120) (336,045) (825,324) (392,394) (1,387,092) 2,314,518 2,811,574 2,351,506 3,002,005 6,588,367 3,586,362 8,939,873 $ 6,588,367 1,621 $ 7,353 Effective May 1, 2014, the Board approved changing the fiscal year-end of the Funds from April 30 to October 31. See Notes to Financial Statements. 141 | October 31, 2015 . RiverFront Dynamic Equity Income Fund Statements of Changes in Net Assets For the Fiscal Period Ended October 31, 2014(a) For the Year Ended October 31, 2015 For the Year Ended April 30, 2014 OPERATIONS Net investment income Net realized gain on investments Net realized loss on investments †affiliated securities Net realized gain distributions from other investment companies Net change in unrealized appreciation/(depreciation) on investments Net Increase in Net Assets Resulting from Operations $ 1,229,120 $ 1,166,295 (30,319) 506,364 (2,136,654) 734,806 354,835 $ 495,747 (2,968) – 59,792 907,406 501,040 2,992,680 – 14,904 1,272,714 4,781,338 DISTRIBUTIONS Dividends to shareholders from net investment income Class A Class C Class I Dividends to shareholders from net realized gains Class A Class C Class I Net Decrease in Net Assets from Distributions (311,063) (447,108) (392,630) (621,663) (1,102,933) (746,196) (3,621,593) (111,022) (86,202) (158,721) – – – (355,945) (135,855) (134,304) (236,905) (365,030) (742,929) (549,797) (2,164,820) 3,938,297 7,076,964 3,502,112 102,697 79,328 138,648 (2,263,648) (3,022,626) (1,075,996) 8,475,776 9,027,237 59,414,303 68,441,540 $ 14,068 $ 7,646,945 10,756,383 9,923,982 464,335 824,340 679,588 (1,433,618) (3,025,374) (3,656,006) 22,180,575 24,797,093 34,617,210 59,414,303 15,178 BENEFICIAL INTEREST TRANSACTIONS (NOTE 6) Shares sold Class A Class C Class I Dividends reinvested Class A Class C Class I Shares redeemed Class A Class C Class I Net Increase in Net Assets Derived from Beneficial Interest Transactions Net increase in net assets NET ASSETS Beginning of year End of year * *Including accumulated net investment income of: (a) 6,311,410 11,151,002 8,108,354 877,483 1,445,580 1,008,028 (3,907,536) (6,667,665) (6,565,889) 11,760,767 8,873,980 68,441,540 $ 77,315,520 $ 92,674 $ $ Effective May 1, 2014, the Board approved changing the fiscal year-end of the Funds from April 30 to October 31. See Notes to Financial Statements. 142 | October 31, 2015 . RiverFront Global Allocation Fund Statements of Changes in Net Assets For the Fiscal Period Ended October 31, 2014(a) For the Year Ended October 31, 2015 For the Year Ended April 30, 2014 OPERATIONS Net investment income Net realized gain/(loss) on investments Net realized loss on investments †affiliated securities Net realized gain distributions from other investment companies Net change in unrealized appreciation/(depreciation) on investments Net Increase/(Decrease) in Net Assets Resulting from Operations $ 575,330 $ (79,726) (33,482) 277,874 (750,472) (10,476) 166,583 $ 1,047,052 (14,540) – (814,242) 384,853 170,637 2,148,570 – 9,169 958,395 3,286,771 DISTRIBUTIONS Dividends to shareholders from net investment income Class A Class C Class I Dividends to shareholders from net realized gains Class A Class C Class I Net Decrease in Net Assets from Distributions (135,563) (171,705) (234,337) (560,595) (1,028,926) (892,615) (3,023,741) (60,721) (29,814) (77,225) (225,948) (315,722) (241,798) (951,228) 704,281 1,706,825 3,218,570 – – – (1,557,221) (1,700,105) (975,931) 1,396,419 1,781,272 34,243,504 36,024,776 $ 166,583 $ 1,828,903 5,733,154 4,414,127 278,213 333,197 312,410 (1,969,635) (2,060,625) (1,566,346) 7,303,398 9,638,941 24,604,563 34,243,504 – – – – – – – – BENEFICIAL INTEREST TRANSACTIONS (NOTE 6) Shares sold Class A Class C Class I Dividends reinvested Class A Class C Class I Shares redeemed Class A Class C Class I Net Increase in Net Assets Derived from Beneficial Interest Transactions Net increase in net assets NET ASSETS Beginning of year End of year * *Including accumulated net investment income of: (a) $ $ 2,396,224 5,539,210 9,024,905 673,030 1,146,839 1,105,082 (2,319,283) (3,108,530) (3,164,067) 11,293,410 8,259,193 36,024,776 44,283,969 $ 200,285 $ Effective May 1, 2014, the Board approved changing the fiscal year-end of the Funds from April 30 to October 31. See Notes to Financial Statements. 143 | October 31, 2015 . RiverFront Global Growth Fund Statements of Changes in Net Assets For the Fiscal Period Ended October 31, 2014(a) For the Year Ended October 31, 2015 For the Year Ended April 30, 2014 OPERATIONS Net investment income Net realized gain on investments Net realized gain distributions from other investment companies Net change in unrealized appreciation/(depreciation) on investments Net Increase in Net Assets Resulting from Operations $ 1,290,107 $ 422,375 $ 109,174 3,579,076 640,999 – (1,412,507) (3,270,391) 627,773 731,060 549,575 6,157,817 24,369 1,314,672 8,046,433 DISTRIBUTIONS Dividends to shareholders from net investment income Class A Class C Class I Class L Investor Class Dividends to shareholders from net realized gains Class A Class C Class I Class L Investor Class Net Decrease in Net Assets from Distributions (284,353) (141,119) (243,129) (453,248) (133,236) (1,555,258) (1,077,170) (1,217,027) (2,207,236) (716,298) (8,028,074) – – – – – – – – – – – (87,390) (28,977) (101,824) (216,395) (65,366) (1,086,883) (878,168) (1,050,842) (2,201,623) (797,894) (6,515,362) 4,307,345 1,088,318 2,214,171 1,420,447 66,568 – – – – – (4,115,225) (1,282,840) (852,301) (2,447,309) (760,465) (361,291) 369,769 73,248,621 73,618,390 $ 424,637 $ 10,986,353 5,045,220 4,759,222 3,180,517 270,199 1,095,779 892,977 1,130,451 2,347,791 782,525 (4,352,368) (1,765,523) (2,075,170) (4,553,986) (2,130,007) 15,613,980 17,145,051 56,103,570 73,248,621 2,262 BENEFICIAL INTEREST TRANSACTIONS (NOTE 6) Shares sold Class A Class C Class I Class L Investor Class Dividends reinvested Class A Class C Class I Class L Investor Class Shares redeemed Class A Class C Class I Class L Investor Class Net Increase/(Decrease) in Net Assets Derived from Beneficial Interest Transactions Net increase in net assets NET ASSETS Beginning of year End of year * *Including accumulated net investment income of: (a) $ $ 6,592,837 4,246,346 7,804,363 5,499,526 265,259 1,781,624 1,189,292 1,360,312 2,618,006 762,580 (5,222,204) (2,728,617) (4,622,386) (3,969,239) (1,134,904) 14,442,795 7,042,494 73,618,390 80,660,884 $ 463,691 $ Effective May 1, 2014, the Board approved changing the fiscal year-end of the Funds from April 30 to October 31. See Notes to Financial Statements. 144 | October 31, 2015 . RiverFront Moderate Growth & Income Fund Statements of Changes in Net Assets For the Fiscal Period Ended October 31, 2014(a) For the Year Ended October 31, 2015 For the Year Ended April 30, 2014 OPERATIONS Net investment income Net realized gain on investments Net realized loss on investments †affiliated securities Net realized gain distributions from other investment companies Net change in unrealized appreciation/(depreciation) on investments Net Increase in Net Assets Resulting from Operations $ 2,288,918 $ 849,869 $ 1,294,023 2,496,740 3,635,670 7,624,458 (38,996) – – 678,016 – 33,187 (4,017,171) (1,889,311) 1,671,672 1,407,507 2,596,228 10,623,340 DISTRIBUTIONS Dividends to shareholders from net investment income Class A Class C Class I Dividends to shareholders from net realized gains Class A Class C Class I Net Decrease in Net Assets from Distributions (416,464) (361,379) (539,349) (1,461,687) (2,693,789) (1,636,155) (7,108,823) 4,319,229 4,201,326 17,073,579 7,712,589 14,370,768 6,525,980 1,734,135 187,752 3,832,260 220,912 2,896,869 325,977 (7,673,351) (8,283,862) (12,583,566) (5,318,273) (10,528,810) (3,079,334) 13,441,113 2,493,067 5,398,727 4,228,331 136,124,507 131,896,176 $ 141,523,234 $ 136,124,507 $ 206,858 $ 49,688 $ $ 11,020,034 18,772,301 16,516,197 1,531,756 2,692,375 2,004,990 (11,453,882) (12,685,999) (7,559,841) 20,837,931 24,352,448 107,543,728 131,896,176 60,631 (463,745) (831,484) (836,519) (1,452,046) (3,504,594) (2,361,505) (9,449,893) (220,828) (267,118) (373,018) – – – (860,964) BENEFICIAL INTEREST TRANSACTIONS (NOTE 6) Shares sold Class A Class C Class I Dividends reinvested Class A Class C Class I Shares redeemed Class A Class C Class I Net Increase in Net Assets Derived from Beneficial Interest Transactions Net increase in net assets NET ASSETS Beginning of year End of year * *Including accumulated net investment income of: (a) Effective May 1, 2014, the Board approved changing the fiscal year-end of the Funds from April 30 to October 31. See Notes to Financial Statements. 145 | October 31, 2015 . RiverFront Conservative Income Builder Fund – Class A Financial Highlights Selected data for a share of beneficial interest outstanding throughout the periods indicated: For the Year Ended October 31, 2015 $10.86 DISTRIBUTIONS: From net investment income From net realized gains Total distributions Net increase/(decrease) in net asset value Net asset value, end of year TOTAL RETURN(c) 0.07 0.04 0.11 (0.08) – (0.08) 0.03 $10.86 0.13 0.53 0.66 (0.12) (0.19) (0.31) 0.35 $10.83 0.09 0.48 0.57 (0.09) – (0.09) 0.48 $10.48 0.40% Net investment income(b) Net realized and unrealized gain/(loss) Total from investment operations For the Year Ended April 30, 2014 $10.48 0.18 (0.14) 0.04 (0.15) (0.29) (0.44) (0.40) $10.46 Net asset value, beginning of period INCOME FROM INVESTMENT OPERATIONS: For the Fiscal Period Ended October 31, 2014(a) $10.83 For the Period September 4, 2012 (Commencement) to April 30, 2013 $10.00 0.98% 6.35% 5.72% $1,038 $1,089 $1,101 $607 RATIOS/SUPPLEMENTAL DATA: (a) (c) (b) (d) (f) (e) Net assets, end of year (000s) Ratio of expenses to average net assets excluding fee waivers and reimbursements Ratio of expenses to average net assets including fee waivers and reimbursements Ratio of net investment income to average net assets Portfolio turnover rate(f) 2.06% 2.39% (d) 2.94% 5.65% (d)(e) 1.15% 1.74% 186% 1.15% (d) 1.22% (d) 34% 1.15% 1.27% 125% 1.15% (d)(e) 1.37% (d)(e) 73% Effective May 1, 2014, the Board approved changing the fiscal year-end of the Funds from April 30 to October 31. Calculated using the average shares method. Total returns are for the period indicated and have not been annualized. Total returns would have been lower had certain expenses not been waived during the period. Returns shown do not reflect the deduction of taxes that a shareholder would pay on Fund distributions or the redemption of Fund shares. Returns shown exclude any applicable sales charges. Annualized. Expense ratios before reductions for startup periods may not be representative of longer term operating periods. Portfolio turnover rate for periods less than one full year have not been annualized. See Notes to Financial Statements. 146 | October 31, 2015 .
RiverFront Conservative Income Builder Fund – Class C Financial Highlights Selected data for a share of beneficial interest outstanding throughout the periods indicated: For the Year Ended October 31, 2015 $10.81 DISTRIBUTIONS: From net investment income From net realized gains Total distributions Net increase/(decrease) in net asset value Net asset value, end of year TOTAL RETURN(c) 0.03 0.04 0.07 (0.03) – (0.03) 0.04 $10.81 0.06 0.51 0.57 (0.12) (0.19) (0.31) 0.26 $10.77 0.06 0.47 0.53 (0.02) – (0.02) 0.51 $10.51 (0.39)% Net investment income(b) Net realized and unrealized gain/(loss) Total from investment operations For the Year Ended April 30, 2014 $10.51 0.09 (0.13) (0.04) (0.11) (0.29) (0.40) (0.44) $10.37 Net asset value, beginning of period INCOME FROM INVESTMENT OPERATIONS: For the Fiscal Period Ended October 31, 2014(a) $10.77 For the Period September 4, 2012 (Commencement) to April 30, 2013 $10.00 0.68% 5.49% 5.29% $8,610 $5,021 $4,106 $2,264 RATIOS/SUPPLEMENTAL DATA: (a) (c) (b) (d) (f) (e) Net assets, end of year (000s) Ratio of expenses to average net assets excluding fee waivers and reimbursements Ratio of expenses to average net assets including fee waivers and reimbursements Ratio of net investment income to average net assets Portfolio turnover rate(f) 2.81% 3.14% (d) 3.73% 6.53% (d)(e) 1.90% 0.88% 186% 1.90% (d) 0.47% (d) 34% 1.90% 0.53% 125% 1.90% (d)(e) 0.90% (d)(e) 73% Effective May 1, 2014, the Board approved changing the fiscal year-end of the Funds from April 30 to October 31. Calculated using the average shares method. Total returns are for the period indicated and have not been annualized. Total returns would have been lower had certain expenses not been waived during the period. Returns shown do not reflect the deduction of taxes that a shareholder would pay on Fund distributions or the redemption of Fund shares. Returns shown exclude any applicable sales charges. Annualized. Expense ratios before reductions for startup periods may not be representative of longer term operating periods. Portfolio turnover rate for periods less than one full year have not been annualized. See Notes to Financial Statements. 147 | October 31, 2015 .
RiverFront Conservative Income Builder Fund – Class I Financial Highlights Selected data for a share of beneficial interest outstanding throughout the periods indicated: For the Year Ended October 31, 2015 $10.70 DISTRIBUTIONS: From net investment income From net realized gains Total distributions Net increase/(decrease) in net asset value Net asset value, end of year TOTAL RETURN(c) 0.07 0.06 0.13 (0.09) – (0.09) 0.04 $10.70 0.15 0.51 0.66 (0.10) (0.19) (0.29) 0.37 $10.66 0.12 0.46 0.58 (0.29) – (0.29) 0.29 $10.29 0.60% Net investment income(b) Net realized and unrealized gain/(loss) Total from investment operations For the Year Ended April 30, 2014 $10.29 0.19 (0.13) 0.06 (0.17) (0.29) (0.46) (0.40) $10.30 Net asset value, beginning of period INCOME FROM INVESTMENT OPERATIONS: For the Fiscal Period Ended October 31, 2014(a) $10.66 For the Period September 4, 2012 (Commencement) to April 30, 2013 $10.00 1.19% 6.53% 5.95% $2,171 $2,830 $1,381 $715 RATIOS/SUPPLEMENTAL DATA: (a) (c) (b) (d) (f) (e) Net assets, end of year (000s) Ratio of expenses to average net assets excluding fee waivers and reimbursements Ratio of expenses to average net assets including fee waivers and reimbursements Ratio of net investment income to average net assets Portfolio turnover rate(f) 1.80% 2.12% (d) 2.66% 7.74% (d)(e) 0.90% 1.84% 186% 0.90% (d) 1.34% (d) 34% 0.90% 1.49% 125% 0.90% (d)(e) 1.84% (d)(e) 73% Effective May 1, 2014, the Board approved changing the fiscal year-end of the Funds from April 30 to October 31. Calculated using the average shares method. Total returns are for the period indicated and have not been annualized. Total returns would have been lower had certain expenses not been waived during the period. Returns shown do not reflect the deduction of taxes that a shareholder would pay on Fund distributions or the redemption of Fund shares. Annualized. Expense ratios before reductions for startup periods may not be representative of longer term operating periods. Portfolio turnover rate for periods less than one full year have not been annualized. See Notes to Financial Statements. 148 | October 31, 2015 . RiverFront Dynamic Equity Income Fund – Class A Financial Highlights Selected data for a share of beneficial interest outstanding throughout the periods indicated: For the Year Ended October 31, 2015 $13.10 For the Year Ended April 30, 2014 $12.24 For the Year Ended April 30, 2013 $11.24 For the Year Ended April 30, 2012(b) $11.73 For the Period August 2, 2010 (Inception) to April 30, 2011 $10.00 0.25 (0.04) 0.21 (0.22) (0.46) – (0.68) (0.47) $12.63 0.09 0.13 0.22 (0.09) – – (0.09) 0.13 $13.10 0.17 1.17 1.34 (0.17) (0.44) – (0.61) 0.73 $12.97 0.25 0.99 1.24 (0.24) – – (0.24) 1.00 $12.24 0.16 (0.49) (0.33) (0.15) – (0.01) (0.16) (0.49) $11.24 0.12 1.67 1.79 (0.06) (d) (0.00) (0.00)(d) (0.06) 1.73 $11.73 1.64% Net asset value, beginning of period For the Fiscal Period Ended October 31, 2014(a) $12.97 1.66% 11.15% 11.22% (2.80)% 17.99% $17,275 $15,374 $8,087 $7,114 $5,723 INCOME/(LOSS) FROM INVESTMENT OPERATIONS: Net investment income(c) Net realized and unrealized gain/(loss) Total from investment operations DISTRIBUTIONS: From net investment income From net realized gains Tax return of capital Total distributions Net increase/(decrease) in net asset value Net asset value, end of year TOTAL RETURN(e) RATIOS/SUPPLEMENTAL DATA: (a) (c) (d) (e) (b) (f) (h) (g) Net assets, end of year (000s) $19,769 Ratio of expenses to average net assets excluding fee waivers and reimbursements 1.35% Ratio of expenses to average net assets including fee waivers and reimbursements 1.15% Ratio of net investment income to average net assets 1.98% (h) 75% Portfolio turnover rate 1.39% (f) 1.15%(f) 1.42% 1.15% 1.33%(f) 45% 1.38% 99% 1.73% 2.17% (f) 1.20%(g) 1.30% 1.30%(f) 2.17% 136% 1.50% 133% 1.48%(f) 66% 1.58% Effective May 1, 2014, the Board approved changing the fiscal year-end of the Funds from April 30 to October 31. Prior to January 1, 2012, the RiverFront Dynamic Equity Income Fund was known as the RiverFront Long-Term Growth & Income Fund. Calculated using the average shares method. Less than ($0.005) per share. Total returns are for the period indicated and have not been annualized. Total returns would have been lower had certain expenses not been waived during the period. Returns shown do not reflect the deduction of taxes that a shareholder would pay on Fund distributions or the redemption of Fund shares. Returns shown exclude any applicable sales charges. Annualized. Contractual expense limitation change from 1.30% to 1.15% effective September 1, 2012. Portfolio turnover rate for periods less than one full year have not been annualized. See Notes to Financial Statements. 149 | October 31, 2015 .
RiverFront Dynamic Equity Income Fund – Class C Financial Highlights Selected data for a share of beneficial interest outstanding throughout the periods indicated: For the Year Ended October 31, 2015 $12.97 For the Year Ended April 30, 2014 $12.13 For the Year Ended April 30, 2013 $11.14 For the Year Ended April 30, 2012(b) $11.67 For the Period August 2, 2010 (Inception) to April 30, 2011 $10.00 0.15 (0.04) 0.11 (0.18) (0.46) – (0.64) (0.53) $12.44 0.04 0.13 0.17 (0.04) – – (0.04) 0.13 $12.97 0.08 1.15 1.23 (0.08) (0.44) – (0.52) 0.71 $12.84 0.16 0.98 1.14 (0.15) – – (0.15) 0.99 $12.13 0.09 (0.51) (0.42) (0.10) – (0.01) (0.11) (0.53) $11.14 0.05 1.67 1.72 (0.05) (d) (0.00) (0.00)(d) (0.05) 1.67 $11.67 0.86% Net asset value, beginning of period For the Fiscal Period Ended October 31, 2014(a) $12.84 1.30% 10.34% 10.41% (3.60)% 17.32% $30,170 $25,787 $16,070 $13,729 $9,223 INCOME/(LOSS) FROM INVESTMENT OPERATIONS: Net investment income(c) Net realized and unrealized gain/(loss) Total from investment operations DISTRIBUTIONS: From net investment income From net realized gains Tax return of capital Total distributions Net increase/(decrease) in net asset value Net asset value, end of year TOTAL RETURN(e) RATIOS/SUPPLEMENTAL DATA: (a) (c) (d) (e) (b) (f) (h) (g) Net assets, end of year (000s) $34,766 Ratio of expenses to average net assets excluding fee waivers and reimbursements 2.10% Ratio of expenses to average net assets including fee waivers and reimbursements 1.90% Ratio of net investment income to average net assets 1.18% (h) 75% Portfolio turnover rate 2.15% (f) 1.90%(f) 2.18% 1.90% 0.60%(f) 45% 0.61% 99% 2.49% 3.10% (f) 1.95%(g) 2.05% 2.05%(f) 1.44% 136% 0.84% 133% 0.65%(f) 66% 2.33% Effective May 1, 2014, the Board approved changing the fiscal year-end of the Funds from April 30 to October 31. Prior to January 1, 2012, the RiverFront Dynamic Equity Income Fund was known as the RiverFront Long-Term Growth & Income Fund. Calculated using the average shares method. Less than ($0.005) per share. Total returns are for the period indicated and have not been annualized. Total returns would have been lower had certain expenses not been waived during the period. Returns shown do not reflect the deduction of taxes that a shareholder would pay on Fund distributions or the redemption of Fund shares. Returns shown exclude any applicable sales charges. Annualized. Contractual expense limitation change from 2.05% to 1.90% effective September 1, 2012. Portfolio turnover rate for periods less than one full year have not been annualized. See Notes to Financial Statements. 150 | October 31, 2015 .
RiverFront Dynamic Equity Income Fund – Class I Financial Highlights Selected data for a share of beneficial interest outstanding throughout the periods indicated: For the Year Ended October 31, 2015 $13.02 For the Year Ended April 30, 2014 $12.16 For the Year Ended April 30, 2013 $11.17 For the Year Ended April 30, 2012(b) $11.64 For the Period August 2, 2010 (Inception) to April 30, 2011 $10.00 0.28 (0.05) 0.23 (0.23) (0.46) – (0.69) (0.46) $12.56 0.10 0.14 0.24 (0.10) – – (0.10) 0.14 $13.02 0.20 1.16 1.36 (0.20) (0.44) – (0.64) 0.72 $12.88 0.27 0.99 1.26 (0.27) – – (0.27) 0.99 $12.16 0.20 (0.50) (0.30) (0.16) – (0.01) (0.17) (0.47) $11.17 0.12 1.68 1.80 (0.15) (d) (0.00) (0.01) (0.16) 1.64 $11.64 1.83% Net asset value, beginning of period For the Fiscal Period Ended October 31, 2014(a) $12.88 1.88% 11.40% 11.47% (2.58)% 18.21% $20,997 $18,254 $10,460 $6,897 $3,301 INCOME/(LOSS) FROM INVESTMENT OPERATIONS: Net investment income(c) Net realized and unrealized gain/(loss) Total from investment operations DISTRIBUTIONS: From net investment income From net realized gains Tax return of capital Total distributions Net increase/(decrease) in net asset value Net asset value, end of year TOTAL RETURN(e) RATIOS/SUPPLEMENTAL DATA: (a) (c) (d) (e) (b) (f) (h) (g) Net assets, end of year (000s) $22,780 Ratio of expenses to average net assets excluding fee waivers and reimbursements 1.10% Ratio of expenses to average net assets including fee waivers and reimbursements 0.90% Ratio of net investment income to average net assets 2.21% (h) 75% Portfolio turnover rate 1.15% (f) 0.90%(f) 1.17% 0.90% 1.57%(f) 45% 1.61% 99% 1.49% 2.44% (f) 0.95%(g) 1.05% 1.05%(f) 2.36% 136% 1.88% 133% 1.49%(f) 66% 1.33% Effective May 1, 2014, the Board approved changing the fiscal year-end of the Funds from April 30 to October 31. Prior to January 1, 2012, the RiverFront Dynamic Equity Income Fund was known as the RiverFront Long-Term Growth & Income Fund. Calculated using the average shares method. Less than ($0.005) per share. Total returns are for the period indicated and have not been annualized. Total returns would have been lower had certain expenses not been waived during the period. Returns shown do not reflect the deduction of taxes that a shareholder would pay on Fund distributions or the redemption of Fund shares. Annualized. Contractual expense limitation change from 1.05% to 0.90% effective September 1, 2012. Portfolio turnover rate for periods less than one full year have not been annualized. See Notes to Financial Statements. 151 | October 31, 2015 . RiverFront Global Allocation Fund – Class A Financial Highlights Selected data for a share of beneficial interest outstanding throughout the periods indicated: For the Year Ended October 31, 2015 $13.14 For the Fiscal Period Ended October 31, 2014(a) $12.97 For the Year Ended April 30, 2014 $11.93 For the Year Ended April 30, 2013 $10.86 For the Year Ended April 30, 2012(b) $11.66 For the Period August 2, 2010 (Inception) to April 30, 2011 $10.00 0.22 (0.06) 0.16 (0.21) (0.89) (1.10) (0.94) $12.20 0.08 0.09 0.17 – – – 0.17 $13.14 0.10 1.36 1.46 (0.09) (0.33) (0.42) 1.04 $12.97 0.15 1.08 1.23 (0.16) – (0.16) 1.07 $11.93 0.12 (0.84) (0.72) (0.07) (0.01) (0.08) (0.80) $10.86 0.10 1.61 1.71 (0.05) – (0.05) 1.66 $11.66 1.23% 1.31% 12.32% 11.47% (6.18)% 17.12% Net assets, end of year (000s) $8,456 Ratio of expenses to average net assets excluding fee waivers and reimbursements 1.43% Ratio of expenses to average net assets including fee waivers and reimbursements 1.15% Ratio of net investment income to average net assets 1.71% Portfolio turnover rate(g) 71% $8,372 $9,098 $8,244 $5,791 $4,686 Net asset value, beginning of period INCOME/(LOSS) FROM INVESTMENT OPERATIONS: Net investment income(c) Net realized and unrealized gain/(loss) Total from investment operations DISTRIBUTIONS: From net investment income From net realized gains Total distributions Net increase/(decrease) in net asset value Net asset value, end of year TOTAL RETURN(d) RATIOS/SUPPLEMENTAL DATA: (a) (c) (d) (b) (e) (g) (f) (e) 1.50% 1.15%(e) 1.51% 1.15% 1.21%(e) 47% 0.83% 95% 1.80% 3.00% (e) 1.19%(f) 1.30% 1.30%(e) 1.32% 113% 1.10% 163% 1.16%(e) 77% 1.68% Effective May 1, 2014, the Board approved changing the fiscal year-end of the Funds from April 30 to October 31. Prior to January 1, 2012, the RiverFront Global Allocation Fund was known as the RiverFront Moderate Growth Fund. Calculated using the average shares method. Total returns are for the period indicated and have not been annualized. Total returns would have been lower had certain expenses not been waived during the period. Returns shown do not reflect the deduction of taxes that a shareholder would pay on Fund distributions or the redemption of Fund shares. Returns shown exclude any applicable sales charges. Annualized. Contractual expense limitation change from 1.30% to 1.15% effective September 1, 2012. Portfolio turnover rate for periods less than one full year have not been annualized. See Notes to Financial Statements. 152 | October 31, 2015 .
RiverFront Global Allocation Fund – Class C Financial Highlights Selected data for a share of beneficial interest outstanding throughout the periods indicated: For the Year Ended October 31, 2015 $12.95 For the Year Ended April 30, 2014 $11.84 For the Year Ended April 30, 2013 $10.81 For the Year Ended April 30, 2012(b) $11.64 For the Period August 2, 2010 (Inception) to April 30, 2011 $10.00 0.12 (0.06) 0.06 (0.14) (0.89) (1.03) (0.97) $11.98 0.03 0.09 0.12 – – – 0.12 $12.95 0.01 1.34 1.35 (0.03) (0.33) (0.36) 0.99 $12.83 0.07 1.07 1.14 (0.11) – (0.11) 1.03 $11.84 0.02 (0.82) (0.80) (0.02) (0.01) (0.03) (0.83) $10.81 0.00(d) 1.65 1.65 (0.01) – (0.01) 1.64 $11.64 0.46% Net asset value, beginning of period For the Fiscal Period Ended October 31, 2014(a) $12.83 0.94% 11.48% 10.59% (6.86)% 16.52% $14,758 $14,624 $9,686 $9,891 $8,926 INCOME/(LOSS) FROM INVESTMENT OPERATIONS: Net investment income(c) Net realized and unrealized gain/(loss) Total from investment operations DISTRIBUTIONS: From net investment income From net realized gains Total distributions Net increase/(decrease) in net asset value Net asset value, end of year TOTAL RETURN(e) RATIOS/SUPPLEMENTAL DATA: (a) (c) (d) (e) (b) (f) (h) (g) Net assets, end of year (000s) $17,089 Ratio of expenses to average net assets excluding fee waivers and reimbursements 2.18% Ratio of expenses to average net assets including fee waivers and reimbursements 1.90% Ratio of net investment income to average net assets 0.94% Portfolio turnover rate(h) 71% (f) 2.25% 1.90%(f) 2.26% 1.90% 0.40%(f) 47% 0.05% 95% 2.58% 3.21% (f) 1.95%(g) 2.05% 2.05%(f) 0.66% 113% 0.17% 163% 0.04%(f) 77% 2.44% Effective May 1, 2014, the Board approved changing the fiscal year-end of the Funds from April 30 to October 31. Prior to January 1, 2012, the RiverFront Global Allocation Fund was known as the RiverFront Moderate Growth Fund. Calculated using the average shares method. Less than $0.005 per share. Total returns are for the period indicated and have not been annualized. Total returns would have been lower had certain expenses not been waived during the period. Returns shown do not reflect the deduction of taxes that a shareholder would pay on Fund distributions or the redemption of Fund shares. Returns shown exclude any applicable sales charges. Annualized. Contractual expense limitation change from 2.05% to 1.90% effective September 1, 2012. Portfolio turnover rate for periods less than one full year have not been annualized. See Notes to Financial Statements. 153 | October 31, 2015 .
RiverFront Global Allocation Fund – Class I Financial Highlights Selected data for a share of beneficial interest outstanding throughout the periods indicated: For the Year Ended October 31, 2015 $12.92 For the Year Ended April 30, 2014 $11.72 For the Year Ended April 30, 2013 $10.66 For the Year Ended April 30, 2012(b) $11.42 For the Period August 2, 2010 (Inception) to April 30, 2011 $10.00 0.22 (0.04) 0.18 (0.22) (0.89) (1.11) (0.93) $11.99 0.09 0.08 0.17 – – – 0.17 $12.92 0.13 1.34 1.47 (0.11) (0.33) (0.44) 1.03 $12.75 0.17 1.07 1.24 (0.18) – (0.18) 1.06 $11.72 0.13 (0.80) (0.67) (0.08) (0.01) (0.09) (0.76) $10.66 0.08 1.62 1.70 (0.28) – (0.28) 1.42 $11.42 1.49% Net asset value, beginning of period For the Fiscal Period Ended October 31, 2014(a) $12.75 1.33% 12.61% 11.73% (5.86)% 17.20% $12,895 $10,521 $6,675 $3,496 $1,905 INCOME/(LOSS) FROM INVESTMENT OPERATIONS: Net investment income(c) Net realized and unrealized gain/(loss) Total from investment operations DISTRIBUTIONS: From net investment income From net realized gains Total distributions Net increase/(decrease) in net asset value Net asset value, end of year TOTAL RETURN(d) RATIOS/SUPPLEMENTAL DATA: (a) (c) (d) (b) (e) (g) (f) Net assets, end of year (000s) $18,739 Ratio of expenses to average net assets excluding fee waivers and reimbursements 1.18% Ratio of expenses to average net assets including fee waivers and reimbursements 0.90% Ratio of net investment income to average net assets 1.83% Portfolio turnover rate(g) 71% (e) 1.26% 0.90%(e) 1.26% 0.90% 1.41%(e) 47% 1.07% 95% 1.55% 4.68% (e) 0.94%(f) 1.05% 1.05%(e) 1.52% 113% 1.28% 163% 0.98%(e) 77% 1.43% Effective May 1, 2014, the Board approved changing the fiscal year-end of the Funds from April 30 to October 31. Prior to January 1, 2012, the RiverFront Global Allocation Fund was known as the RiverFront Moderate Growth Fund. Calculated using the average shares method. Total returns are for the period indicated and have not been annualized. Total returns would have been lower had certain expenses not been waived during the period. Returns shown do not reflect the deduction of taxes that a shareholder would pay on Fund distributions or the redemption of Fund shares. Annualized. Contractual expense limitation change from 1.05% to 0.90% effective September 1, 2012. Portfolio turnover rate for periods less than one full year have not been annualized. See Notes to Financial Statements. 154 | October 31, 2015 . RiverFront Global Growth Fund – Class A Financial Highlights Selected data for a share of beneficial interest outstanding throughout the periods indicated: For the Year Ended October 31, 2015 $15.44 For the Year Ended April 30, 2014 $14.89 For the Year Ended April 30, 2013 $13.37 For the Year Ended April 30, 2012(b) $15.65 For the Fiscal Period Ended April 30, 2011(c) $14.66 0.24 (0.04) 0.20 (0.25) (1.44) (1.69) (1.49) $13.95 0.08 0.10 0.18 – – – 0.18 $15.44 0.12 1.88 2.00 (0.12) (1.51) (1.63) 0.37 $15.26 0.17 1.57 1.74 (0.22) – (0.22) 1.52 $14.89 0.14 (1.41) (1.27) (0.14) (0.87) (1.01) (2.28) $13.37 0.00(e) 0.99 0.99 – – – 0.99 $15.65 1.34% Net asset value, beginning of period For the Fiscal Period Ended October 31, 2014(a) $15.26 1.18% 13.66% 13.14% (7.51)% 6.75% $16,694 $16,440 $8,525 $5,241 $12,307 INCOME/(LOSS) FROM INVESTMENT OPERATIONS: Net investment income(d) Net realized and unrealized gain/(loss) Total from investment operations DISTRIBUTIONS: From net investment income From net realized gains Total distributions Net increase/(decrease) in net asset value Net asset value, end of year TOTAL RETURN(f) RATIOS/SUPPLEMENTAL DATA: (a) (c) (d) (e) (f) (b) (g) (i) (h) Net assets, end of year (000s) $18,308 Ratio of expenses to average net assets excluding fee waivers and 1.38% reimbursements Ratio of expenses to average net assets including fee waivers and reimbursements(h) 1.15% Ratio of net investment income to average net assets 1.67% (i) 71% Portfolio turnover rate 1.38% (g) 1.49% 1.52% 1.58% (g) 1.15%(g) 1.40% 1.15% 0.98% 0.92% 0.81%(g) 1.08%(g) 48% 0.76% 85% 1.23% 113% 0.99% 119% 0.06%(g) 34% Effective May 1, 2014, the Board approved changing the fiscal year-end of the Funds from April 30 to October 31. Prior to January 1, 2012, the RiverFront Global Growth Fund was known as the RiverFront Long-Term Growth Fund. Effective March 8, 2011, the Board approved changing the fiscal year-end of the Fund from December 31 to April 30. Calculated using the average shares method. Less than $0.005 per share. Total returns are for the period indicated and have not been annualized. Total returns would have been lower had certain expenses not been waived during the period. Returns shown do not reflect the deduction of taxes that a shareholder would pay on Fund distributions or the redemption of Fund shares. Returns shown exclude any applicable sales charges. Annualized. Prior to January 1, 2013, all acquired fund fees were reimbursed. Portfolio turnover rate for periods less than one full year have not been annualized. See Notes to Financial Statements. 155 | October 31, 2015 .
RiverFront Global Growth Fund – Class C Financial Highlights Selected data for a share of beneficial interest outstanding throughout the periods indicated: For the Year Ended October 31, 2015 $15.19 For the Year Ended April 30, 2014 $14.76 For the Year Ended April 30, 2013 $13.29 For the Year Ended April 30, 2012(b) $15.60 For the Fiscal Period Ended April 30, 2011(c) $14.63 0.13 (0.04) 0.09 (0.17) (1.44) (1.61) (1.52) $13.67 0.03 0.09 0.12 – – – 0.12 $15.19 0.01 1.86 1.87 (0.05) (1.51) (1.56) 0.31 $15.07 0.08 1.54 1.62 (0.15) – (0.15) 1.47 $14.76 0.05 (1.42) (1.37) (0.07) (0.87) (0.94) (2.31) $13.29 (0.04) 1.01 0.97 – – – 0.97 $15.60 0.59% 0.80% 12.84% 12.31% (8.22)% 6.63% $12,908 Net asset value, beginning of period For the Fiscal Period Ended October 31, 2014(a) $15.07 $11,420 $11,511 $7,182 $6,808 $6,156 INCOME/(LOSS) FROM INVESTMENT OPERATIONS: Net investment income/(loss)(d) Net realized and unrealized gain/(loss) Total from investment operations DISTRIBUTIONS: From net investment income From net realized gains Total distributions Net increase/(decrease) in net asset value Net asset value, end of year TOTAL RETURN(e) RATIOS/SUPPLEMENTAL DATA: Net assets, end of year (000s) Ratio of expenses to average net assets excluding fee waivers and reimbursements Ratio of expenses to average net assets including fee waivers and reimbursements(g) Ratio of net investment income/(loss) to average net assets (h) Portfolio turnover rate (c) (d) (e) (b) (f) (h) (g) 2.13% (f) 2.15% 2.25% 2.29% 2.33% (f) 1.90% (a) 2.13% 1.90%(f) 1.90% 1.73% 1.67% 1.55%(f) 0.88% 71% 0.38%(f) 48% 0.07% 85% 0.57% 113% 0.34% 119% (0.72)%(f) 34% Effective May 1, 2014, the Board approved changing the fiscal year-end of the Funds from April 30 to October 31. Prior to January 1, 2012, the RiverFront Global Growth Fund was known as the RiverFront Long-Term Growth Fund. Effective March 8, 2011, the Board approved changing the fiscal year-end of the Fund from December 31 to April 30. Calculated using the average shares method. Total returns are for the period indicated and have not been annualized. Total returns would have been lower had certain expenses not been waived during the period. Returns shown do not reflect the deduction of taxes that a shareholder would pay on Fund distributions or the redemption of Fund shares. Returns shown exclude any applicable sales charges. Annualized. Prior to January 1, 2013, all acquired fund fees were reimbursed. Portfolio turnover rate for periods less than one full year have not been annualized. See Notes to Financial Statements. 156 | October 31, 2015 .
RiverFront Global Growth Fund – Class I Financial Highlights Selected data for a share of beneficial interest outstanding throughout the periods indicated: For the Year Ended October 31, 2015 $15.52 For the Year Ended April 30, 2014 $14.92 For the Year Ended April 30, 2013 $13.40 For the Year Ended April 30, 2012(b) $15.67 For the Fiscal Period Ended April 30, 2011(c) $14.65 0.26 (0.03) 0.23 (0.28) (1.44) (1.72) (1.49) $14.03 0.10 0.10 0.20 – – – 0.20 $15.52 0.17 1.89 2.06 (0.15) (1.51) (1.66) 0.40 $15.32 0.20 1.57 1.77 (0.25) – (0.25) 1.52 $14.92 0.19 (1.51) (1.32) (0.16) (0.79) (0.95) (2.27) $13.40 0.01 1.01 1.02 – – – 1.02 $15.67 1.51% Net asset value, beginning of period For the Fiscal Period Ended October 31, 2014(a) $15.32 1.31% 14.01% 13.36% (7.31)% 7.04% $13,343 $11,845 $7,769 $6,022 $4,508 INCOME/(LOSS) FROM INVESTMENT OPERATIONS: Net investment income(d) Net realized and unrealized gain/(loss) Total from investment operations DISTRIBUTIONS: From net investment income From net realized gains Total distributions Net increase/(decrease) in net asset value Net asset value, end of year TOTAL RETURN(e) RATIOS/SUPPLEMENTAL DATA: (a) (c) (d) (e) (b) (f) (h) (g) Net assets, end of year (000s) $16,412 Ratio of expenses to average net assets excluding fee waivers and 1.29% reimbursements Ratio of expenses to average net assets including fee waivers and reimbursements(g) 0.90% Ratio of net investment income to average net assets 1.77% (h) 71% Portfolio turnover rate 1.36% (f) 1.25% 1.30% 1.30% (f) 0.90%(f) 1.16% 0.90% 0.73% 0.67% 0.61%(f) 1.32%(f) 48% 1.13% 85% 1.45% 113% 1.44% 119% 0.23%(f) 34% Effective May 1, 2014, the Board approved changing the fiscal year-end of the Funds from April 30 to October 31. Prior to January 1, 2012, the RiverFront Global Growth Fund was known as the RiverFront Long-Term Growth Fund. Effective March 8, 2011, the Board approved changing the fiscal year-end of the Fund from December 31 to April 30. Calculated using the average shares method. Total returns are for the period indicated and have not been annualized. Total returns would have been lower had certain expenses not been waived during the period. Returns shown do not reflect the deduction of taxes that a shareholder would pay on Fund distributions or the redemption of Fund shares. Annualized. Prior to January 1, 2013, all acquired fund fees were reimbursed. Portfolio turnover rate for periods less than one full year have not been annualized. See Notes to Financial Statements. 157 | October 31, 2015 . RiverFront Global Growth Fund – Class L Financial Highlights Selected data for a share of beneficial interest outstanding throughout the periods indicated: For the Year Ended October 31, 2015 $15.49 For the Year Ended April 30, 2014 $14.90 For the Year Ended April 30, 2013 $13.37 For the Year Ended April 30, 2012(b) $15.65 For the Fiscal Period Ended April 30, 2011(c) $14.63 0.27 (0.03) 0.24 (0.28) (1.44) (1.72) (1.48) $14.01 0.11 0.09 0.20 – – – 0.20 $15.49 0.17 1.88 2.05 (0.15) (1.51) (1.66) 0.39 $15.29 0.22 1.56 1.78 (0.25) – (0.25) 1.53 $14.90 0.17 (1.41) (1.24) (0.14) (0.87) (1.04) (2.28) $13.37 0.01 1.01 1.02 – – – 1.02 $15.65 1.59% Net asset value, beginning of period For the Fiscal Period Ended October 31, 2014(a) $15.29 1.31% 13.98% 13.43% (7.31)% 6.97% $24,400 $25,092 $23,454 $24,765 $42,977 INCOME/(LOSS) FROM INVESTMENT OPERATIONS: Net investment income(d) Net realized and unrealized gain/(loss) Total from investment operations DISTRIBUTIONS: From net investment income From net realized gains Total distributions Net increase/(decrease) in net asset value Net asset value, end of year TOTAL RETURN(e) RATIOS/SUPPLEMENTAL DATA: (a) (c) (d) (e) (b) (f) (h) (g) Net assets, end of year (000s) $26,109 Ratio of expenses to average net assets excluding fee waivers and 1.04% reimbursements Ratio of expenses to average net assets including fee waivers and reimbursements (includes acquired fund fee reimbursements)(g) 0.90% Ratio of expenses to average net assets including fee waivers and reimbursements (excludes acquired fund fee reimbursements) 0.90% Ratio of net investment income to average net assets 1.86% Portfolio turnover rate(h) 71% 1.02% (f) 1.08% 1.28% (f) 0.90% 0.73% 0.67% 0.64%(f) (f) 0.90% 1.25% 0.90%(f) 1.15% 0.90% 0.90% 0.90% 0.90%(f) (f) 1.37% 48% 1.11% 85% 1.59% 113% 1.26% 119% 0.19%(f) 34% Effective May 1, 2014, the Board approved changing the fiscal year-end of the Funds from April 30 to October 31. Prior to January 1, 2012, the RiverFront Global Growth Fund was known as the RiverFront Long-Term Growth Fund. Effective March 8, 2011, the Board approved changing the fiscal year-end of the Fund from December 31 to April 30. Calculated using the average shares method. Total returns are for the period indicated and have not been annualized. Total returns would have been lower had certain expenses not been waived during the period. Returns shown do not reflect the deduction of taxes that a shareholder would pay on Fund distributions or the redemption of Fund shares. Annualized. Prior to January 1, 2013, all acquired fund fees were reimbursed. Portfolio turnover rate for periods less than one full year have not been annualized. See Notes to Financial Statements. 158 | October 31, 2015 . RiverFront Global Growth Fund – Investor Class Financial Highlights Selected data for a share of beneficial interest outstanding throughout the periods indicated: For the Year Ended October 31, 2015 $15.37 For the Year Ended April 30, 2014 $14.82 For the Year Ended April 30, 2013 $13.32 For the Year Ended April 30, 2012(b) $15.59 For the Fiscal Period Ended April 30, 2011(c) $14.59 0.26 (0.07) 0.19 (0.25) (1.44) (1.69) (1.50) $13.87 0.09 0.09 0.18 – – – 0.18 $15.37 0.13 1.87 2.00 (0.12) (1.51) (1.63) 0.37 $15.19 0.18 1.54 1.72 (0.22) – (0.22) 1.50 $14.82 0.13 (1.39) (1.26) (0.14) (0.87) (1.01) (2.27) $13.32 0.00(e) 1.00 1.00 – – – 1.00 $15.59 1.28% 1.18% 13.73% 13.07% (7.47)% 6.79% $6,924 Net asset value, beginning of period For the Fiscal Period Ended October 31, 2014(a) $15.19 $7,762 $8,361 $9,174 $10,133 $21,270 INCOME/(LOSS) FROM INVESTMENT OPERATIONS: Net investment income(d) Net realized and unrealized gain/(loss) Total from investment operations DISTRIBUTIONS: From net investment income From net realized gains Total distributions Net increase/(decrease) in net asset value Net asset value, end of year TOTAL RETURN(f) RATIOS/SUPPLEMENTAL DATA: Net assets, end of year (000s) Ratio of expenses to average net assets excluding fee waivers and reimbursements Ratio of expenses to average net assets including fee waivers and reimbursements (includes acquired fund fee reimbursements)(h) Ratio of expenses to average net assets including fee waivers and reimbursements (excludes acquired fund fee reimbursements) Ratio of net investment income/(loss) to average net assets Portfolio turnover rate(i) (c) (d) (e) (f) (b) (g) (i) (h) 1.41% 1.50% 1.93% 1.53% (g) 1.15%(g) 1.15% 0.98% 0.92% 0.89%(g) 1.15% 1.38% (g) 1.15% (a) 1.38% (g) 1.15% 1.15% 1.15% 1.15% 1.15%(g) 1.78% 71% (g) 1.14% 48% 0.85% 85% 1.36% 113% 0.97% 119% (0.08)%(g) 34% Effective May 1, 2014, the Board approved changing the fiscal year-end of the Funds from April 30 to October 31. Prior to January 1, 2012, the RiverFront Global Growth Fund was known as the RiverFront Long-Term Growth Fund. Effective March 8, 2011, the Board approved changing the fiscal year-end of the Fund from December 31 to April 30. Calculated using the average shares method. Less than $0.005 per share. Total returns are for the period indicated and have not been annualized. Total returns would have been lower had certain expenses not been waived during the period. Returns shown do not reflect the deduction of taxes that a shareholder would pay on Fund distributions or the redemption of Fund shares. Annualized. Prior to January 1, 2013, all acquired fund fees were reimbursed. Portfolio turnover rate for periods less than one full year have not been annualized. See Notes to Financial Statements. 159 | October 31, 2015 . RiverFront Moderate Growth & Income Fund – Class A Financial Highlights Selected data for a share of beneficial interest outstanding throughout the periods indicated: For the Year Ended October 31, 2015 $12.15 For the Year Ended April 30, 2014 $11.66 For the Year Ended April 30, 2013 $10.96 For the Year Ended April 30, 2012 $11.08 For the Period August 2, 2010 (Inception) to April 30, 2011 $10.00 0.23 (0.06) 0.17 (0.20) (0.64) – (0.84) (0.67) $11.48 0.09 0.16 0.25 (0.09) – – (0.09) 0.16 $12.15 0.16 0.89 1.05 (0.16) (0.56) – (0.72) 0.33 $11.99 0.24 0.69 0.93 (0.23) – – (0.23) 0.70 $11.66 0.17 (0.12) 0.05 (0.17) – (0.00)(c) (0.17) (0.12) $10.96 0.15 1.01 1.16 (0.08) (c) (0.00) – (0.08) 1.08 $11.08 1.33% Net asset value, beginning of period For the Fiscal Period Ended October 31, 2014(a) $11.99 2.12% 9.16% 8.59% 0.55% 11.70% $27,598 $31,033 $29,066 $20,754 $12,148 INCOME/(LOSS) FROM INVESTMENT OPERATIONS: Net investment income(b) Net realized and unrealized gain/(loss) Total from investment operations DISTRIBUTIONS: From net investment income From net realized gains Tax return of capital Total distributions Net increase/(decrease) in net asset value Net asset value, end of year TOTAL RETURN(d) RATIOS/SUPPLEMENTAL DATA: (a) (c) (d) (b) (e) (g) (f) Net assets, end of year (000s) $24,402 Ratio of expenses to average net assets excluding fee waivers and reimbursements 1.30% Ratio of expenses to average net assets including fee waivers and reimbursements 1.15% Ratio of net investment income to average net assets 1.97% (g) 110% Portfolio turnover rate 1.31% (e) 1.15%(e) 1.32% 1.15% 1.54%(e) 42% 1.35% 98% 1.50% 1.64% (e) 1.19%(f) 1.30% 1.30%(e) 2.17% 108% 1.65% 128% 1.89%(e) 69% 1.40% Effective May 1, 2014, the Board approved changing the fiscal year-end of the Funds from April 30 to October 31. Calculated using the average shares method. Less than ($0.005) per share. Total returns are for the period indicated and have not been annualized. Total returns would have been lower had certain expenses not been waived during the period. Returns shown do not reflect the deduction of taxes that a shareholder would pay on Fund distributions or the redemption of Fund shares. Returns shown exclude any applicable sales charges. Annualized. Contractual expense limitation change from 1.30% to 1.15% effective September 1, 2012. Portfolio turnover rate for periods less than one full year have not been annualized. See Notes to Financial Statements. 160 | October 31, 2015 .
RiverFront Moderate Growth & Income Fund – Class C Financial Highlights Selected data for a share of beneficial interest outstanding throughout the periods indicated: For the Year Ended October 31, 2015 $12.10 For the Year Ended April 30, 2014 $11.62 For the Year Ended April 30, 2013 $10.92 For the Year Ended April 30, 2012 $11.06 For the Period August 2, 2010 (Inception) to April 30, 2011 $10.00 0.13 (0.06) 0.07 (0.14) (0.64) – (0.78) (0.71) $11.39 0.05 0.16 0.21 (0.05) – – (0.05) 0.16 $12.10 0.07 0.89 0.96 (0.08) (0.56) – (0.64) 0.32 $11.94 0.16 0.68 0.84 (0.14) – – (0.14) 0.70 $11.62 0.09 (0.13) (0.04) (0.10) – (0.00)(c) (0.10) (0.14) $10.92 0.10 1.02 1.12 (0.06) (c) (0.00) – (0.06) 1.06 $11.06 0.52% Net asset value, beginning of period For the Fiscal Period Ended October 31, 2014(a) $11.94 1.75% 8.33% 7.83% (0.37)% 11.24% $66,445 $63,031 $52,579 $39,015 $24,061 INCOME/(LOSS) FROM INVESTMENT OPERATIONS: Net investment income(b) Net realized and unrealized gain/(loss) Total from investment operations DISTRIBUTIONS: From net investment income From net realized gains Tax return of capital Total distributions Net increase/(decrease) in net asset value Net asset value, end of year TOTAL RETURN(d) RATIOS/SUPPLEMENTAL DATA: (a) (c) (d) (b) (e) (g) (f) Net assets, end of year (000s) $70,771 Ratio of expenses to average net assets excluding fee waivers and reimbursements 2.05% Ratio of expenses to average net assets including fee waivers and reimbursements 1.90% Ratio of net investment income to average net assets 1.14% (g) 110% Portfolio turnover rate 2.07% (e) 1.90%(e) 2.07% 1.90% 0.77%(e) 42% 0.59% 98% 2.25% 2.54% (e) 1.95%(f) 2.05% 2.05%(e) 1.43% 108% 0.88% 128% 1.22%(e) 69% 2.15% Effective May 1, 2014, the Board approved changing the fiscal year-end of the Funds from April 30 to October 31. Calculated using the average shares method. Less than ($0.005) per share. Total returns are for the period indicated and have not been annualized. Total returns would have been lower had certain expenses not been waived during the period. Returns shown do not reflect the deduction of taxes that a shareholder would pay on Fund distributions or the redemption of Fund shares. Returns shown exclude any applicable sales charges. Annualized. Contractual expense limitation change from 2.05% to 1.90% effective September 1, 2012. Portfolio turnover rate for periods less than one full year have not been annualized. See Notes to Financial Statements. 161 | October 31, 2015 .
RiverFront Moderate Growth & Income Fund – Class I Financial Highlights Selected data for a share of beneficial interest outstanding throughout the periods indicated: For the Year Ended October 31, 2015 $12.14 For the Year Ended April 30, 2014 $11.65 For the Year Ended April 30, 2013 $10.94 For the Year Ended April 30, 2012 $11.07 For the Period August 2, 2010 (Inception) to April 30, 2011 $10.00 0.25 (0.06) 0.19 (0.22) (0.64) – (0.86) (0.67) $11.47 0.11 0.16 0.27 (0.11) – – (0.11) 0.16 $12.14 0.19 0.89 1.08 (0.19) (0.56) – (0.75) 0.33 $11.98 0.26 0.70 0.96 (0.25) – – (0.25) 0.71 $11.65 0.20 (0.13) 0.07 (0.19) – (0.01) (0.20) (0.13) $10.94 0.17 1.01 1.18 (0.11) (c) (0.00) – (0.11) 1.07 $11.07 1.50% Net asset value, beginning of period For the Fiscal Period Ended October 31, 2014(a) $11.98 2.25% 9.43% 8.94% 0.71% 11.92% $42,081 $37,832 $25,898 $12,880 $7,535 INCOME/(LOSS) FROM INVESTMENT OPERATIONS: Net investment income(b) Net realized and unrealized gain/(loss) Total from investment operations DISTRIBUTIONS: From net investment income From net realized gains Tax return of capital Total distributions Net increase/(decrease) in net asset value Net asset value, end of year TOTAL RETURN(d) RATIOS/SUPPLEMENTAL DATA: (a) (c) (d) (b) (e) (g) (f) Net assets, end of year (000s) $46,350 Ratio of expenses to average net assets excluding fee waivers and reimbursements 1.05% Ratio of expenses to average net assets including fee waivers and reimbursements 0.90% Ratio of net investment income to average net assets 2.16% (g) 110% Portfolio turnover rate 1.07% (e) 0.90%(e) 1.07% 0.90% 1.77%(e) 42% 1.59% 98% 1.26% 1.55% (e) 0.94%(f) 1.05% 1.05%(e) 2.39% 108% 1.91% 128% 2.16%(e) 69% 1.15% Effective May 1, 2014, the Board approved changing the fiscal year-end of the Funds from April 30 to October 31. Calculated using the average shares method. Less than ($0.005) per share. Total returns are for the period indicated and have not been annualized. Total returns would have been lower had certain expenses not been waived during the period. Returns shown do not reflect the deduction of taxes that a shareholder would pay on Fund distributions or the redemption of Fund shares. Annualized. Contractual expense limitation change from 1.05% to 0.90% effective September 1, 2012. Portfolio turnover rate for periods less than one full year have not been annualized. See Notes to Financial Statements. 162 | October 31, 2015 . Notes to Financial Statements October 31, 2015 1. ORGANIZATION Financial Investors Trust (the “Trust”), a Delaware statutory trust, is an openâ€end management investment company registered under the Investment Company Act of 1940, as amended (“1940 Act”). As of October 31, 2015, the Trust had 34 registered funds. This annual report includes the financial statements and financial highlights of the following 13 funds: ALPS | Alerian MLP Infrastructure Index Fund, ALPS | CoreCommodity Management CompleteCommodities® Strategy Fund, ALPS | Kotak India Growth Fund, ALPS | Red Rocks Listed Private Equity Fund, ALPS | Sterling ETF Tactical Rotation Fund, ALPS | Westport Resources Hedged High Income Fund, ALPS | WMC Research Value Fund (formerly the ALPS|WMC Disciplined Value Fund), Clough China Fund, RiverFront Conservative Income Builder Fund, RiverFront Dynamic Equity Income Fund, RiverFront Global Allocation Fund, RiverFront Global Growth Fund and RiverFront Moderate Growth & Income Fund (each, a “Fund” and collectively, the “Funds”). ALPS | Alerian MLP Infrastructure Index Fund seeks investment results that correspond (before fees and expenses) generally to the price and yield performance of its underlying index, the Alerian MLP Infrastructure Index. The ALPS | CoreCommodity Management CompleteCommodities® Strategy Fund seeks to maximize real returns consistent with prudent investment management. ALPS | Kotak India Growth Fund’s investment goal is longâ€term capital appreciation. ALPS | Red Rocks Listed Private Equity Fund seeks to maximize total return, which consists of appreciation on its investments and a variable income stream. ALPS | Sterling ETF Tactical Rotation Fund seeks investment results that correspond (before fees and expenses) generally to the performance of the Sterling Tactical Rotation Index. ALPS | Westport Resources Hedged High Income Fund seeks to provide high current income. The Fund’s secondary investment objective is to seek capital preservation, with the potential for capital appreciation. ALPS | WMC Research Value Fund seeks longâ€term capital appreciation: dividend income may be a factor in portfolio selection but is secondary to the Fund’s principal objective. The Clough China Fund seeks to provide investors with longâ€term capital appreciation. The RiverFront Conservative Income Builder Fund seeks to provide current income and potential for that income to grow over time. The RiverFront Dynamic Equity Income Fund seeks to achieve longâ€term growth and income through a combination of capital appreciation and rising dividend payments that exceeds the average yield on global stocks generally. The RiverFront Global Allocation Fund seeks to provide high total investment return through a fully managed investment policy utilizing United States and foreign equity securities, debt and money market securities, the combination of which will be varied from time to time both with respect to types of securities and markets in response to changing market and economic trends. Total investment return means the combination of capital appreciation and investment income. The RiverFront Global Growth Fund seeks to achieve longâ€term capital appreciation through a fully managed investment policy utilizing United States and foreign equity securities, debt and money market securities, the combination of which will be varied from time to time both with respect to types of securities and markets in response to changing market and economic trends. The RiverFront Moderate Growth & Income Fund has two primary investment objectives: (1) seeks to provide a level of current income that exceeds the average yield on U.S. stocks in general and (2) to provide a growing stream of income over the years. The Funds secondary objective is to provide growth of capital. The classes of each Fund differ principally in the applicable distribution and shareholder service fees. Shareholders of each class also bear certain expenses that pertain to that particular class. All shareholders bear the common expenses of the Fund and earn income and realized gains/losses from the Fund pro rata based on the average daily net assets of each class, without distinction between share classes. Dividends to shareholders are determined separately for each class based on income and expenses allocable to each class. Realized gain distributions to shareholders are allocated to each class pro rata based on the shares outstanding of each class on the date of distribution. Differences in per share dividend rates generally result from differences in separate class expenses, including distribution and shareholder service fees, if applicable. Basis of Consolidation for the ALPS | CoreCommodity Management CompleteCommodities® Strategy Fund CoreCommodity Management Cayman Commodity Fund Ltd. (the “Subsidiary”), a Cayman Islands exempted company, was incorporated on April 23, 2010 and is a wholly owned subsidiary of the ALPS | CoreCommodity Management CompleteCommodities® Strategy Fund (the “CoreCommodity Fund”). The Subsidiary acts as an investment vehicle for the CoreCommodity Fund in order to effect certain commodityâ€related investments on behalf of the CoreCommodity Fund. CoreCommodity Fund is the sole shareholder of the Subsidiary pursuant to a subscription agreement dated as of June 14, 2010, and it is intended that the CoreCommodity Fund will remain the sole shareholder and will continue to wholly own and control the Subsidiary. Under the Articles of Association of the Subsidiary, shares issued by the Subsidiary confer upon a shareholder the right to vote at general meetings of the Subsidiary and certain rights in connection with any windingâ€up or repayment of capital, as well as the right to participate in the profits or assets of the Subsidiary. The CoreCommodity Fund may invest up to 25% of its total assets in shares of the Subsidiary. As a wholly owned subsidiary of the CoreCommodity Fund, the financial statements of the Subsidiary are included in the consolidated financial statements and financial highlights of the CoreCommodity Fund. All investments held by the Subsidiary are disclosed in the accounts of the CoreCommodity Fund. As of October 31, 2015, net assets of the CoreCommodity Fund were $400,809,447, of which $72,529,520 or 18.10%, represented the CoreCommodity Fund’s ownership of all issued shares and voting rights of the Subsidiary. Basis of Consolidation for the ALPS | Kotak India Growth Fund ALPS | Kotak India Growth Fund, (the “Kotak Fund”) invests in the equity securities of Indian companies through its wholly owned, collective investment vehicle, the India Premier Equity Portfolio (the “Portfolio”). The Portfolio is registered with and regulated by the Mauritius Financial Services Commission. The Portfolio was formed for the purpose of facilitating the Kotak Fund’s purchase of securities of a wide selection of Indian 163 | October 31, 2015 . Notes to Financial Statements October 31, 2015 companies, consistent with the Kotak Fund’s investment strategies. The Portfolio is a private company limited by shares incorporated under the Mauritius Companies Act 2001. As a wholly owned subsidiary of the Kotak Fund, financial statements of the Portfolio are included in the consolidated financial statements and financial highlights of the Kotak Fund. All investments held by the Portfolio are disclosed in the accounts of the Kotak Fund. The Portfolio established residency in Mauritius allowing the Kotak Fund to receive the beneficial tax treatment under the Treaty between India and Mauritius. If the benefits of the Treaty are denied or if the Portfolio is held to have a permanent establishment in India, gains derived by the Portfolio due to the sale of securities, may be subject to taxation in India. India’s Finance Act of 2012 had introduced legislation on General Anti†Avoidance Rules (“GAAR”) into the Act which contains treaty override provisions. The GAAR may be used by the Indian tax authorities to declare any arrangement whose main purpose or one of the main purposes is to obtain a tax benefit, as an “impermissible avoidance arrangement.” Originally, GAAR was to be effective from April 1, 2012; however, subsequent to the 2013 amendments introduced to the Finance Act, GAAR had been deferred until April 1, 2015. In the 2015 budget presentation, the Finance Minister (India) announced that the implementation of GAAR will be delayed by two years. 2. SIGNIFICANT ACCOUNTING POLICIES The following is a summary of significant accounting policies consistently followed by each Fund in the preparation of its financial statements. Each Fund is considered an investment company for financial reporting purposes, and the following policies are in conformity with accounting principles generally accepted in the United States of America for investment companies (“U.S. GAAP”).The preparation of financial statements in conformity with U.S. GAAP requires management to make certain estimates and assumptions that affect the reported amounts of assets and liabilities and disclosures of contingent assets and liabilities at the date of the financial statements and the reported amounts of revenue and expenses during the period. Actual results could differ from those estimates. The following is a summary of significant accounting policies consistently followed by the Funds and subsidiaries, as applicable, in preparation of their financial statements. Investment Valuation: The Funds generally value their securities based on market prices determined at the close of regular trading on the New York Stock Exchange (“NYSE”), normally 4:00 p.m. Eastern Time, on each day the NYSE is open for trading. For equity securities and mutual funds that are traded on an exchange, the market price is usually the closing sale or official closing price on that exchange. The market price for debt obligations is generally the price supplied by an independent thirdâ€party pricing service approved by the Board, which may use a matrix, formula or other objective method that takes into consideration quotations from dealers, market transactions in comparable investments, market indices and yield curves. If vendors are unable to supply a price, or if the price supplied is deemed to be unreliable, the market price may be determined using quotations received from one or more brokersâ€dealers that make a market in the security. Shortâ€term debt obligations that will mature in 60 days or less are valued at amortized cost; unless it is determined that using this method would not reflect an investment’s fair value. Investments in nonâ€exchange traded funds are fair valued at their respective net asset values. Futures contracts that are listed or traded on a national securities exchange, commodities exchange, contract market or comparable over the counter market, and that are freely transferable, are valued at their closing settlement price on the exchange on which they are primarily traded or based upon the current settlement price for a like instrument acquired on the day on which the instrument is being valued. A settlement price may not be used if the market makes a limit move with respect to a particular commodity. Overâ€theâ€counter swap contracts for which market quotations are readily available are valued based on quotes received from independent pricing services or one or more dealers that make markets in such securities. Equity securities that are primarily traded on foreign securities exchanges are valued at the closing values of such securities on their respective foreign exchanges, except when an event occurs subsequent to the close of the foreign exchange and the close of the NYSE that was likely to have changed such value. In such an event, the fair value of those securities are determined in good faith through consideration of other factors in accordance with procedures established by and under the general supervision of the Board. The Funds will use a fair valuation model provided by an independent pricing service, which is intended to reflect fair value when a security’s value or a meaningful portion of the Fund’s portfolio is believed to have been materially affected by an valuation event that has occurred between the close of the exchange or market on which the security is traded and the close of the regular trading day on the NYSE. Forward currency exchange contracts have a fair value determined by the prevailing foreign currency exchange daily rates and current foreign currency exchange forward rates. The foreign currency exchange forward rates are calculated using an automated system that estimates rates on the basis of the current day foreign currency exchange rates and forward foreign currency exchange rates supplied by a pricing service. Foreign exchange rates and forward foreign currency exchange rates may generally be obtained at the close of the NYSE, normally 4:00 p.m. Eastern Time. When such prices or quotations are not available, or when the Fund’s adviser or subâ€adviser, as applicable, believes that they are unreliable, securities may be priced using fair value procedures approved by the Board. 164 | October 31, 2015 . Notes to Financial Statements October 31, 2015 Fair Value Measurements: The Funds disclose the classification of their fair value measurements following a threeâ€tier hierarchy based on the inputs used to measure fair value. Inputs refer broadly to the assumptions that market participants would use in pricing the asset or liability, including assumptions about risk. Inputs may be observable or unobservable. Observable inputs reflect the assumptions market participants would use in pricing the asset or liability that are developed based on market data obtained from sources independent of the reporting entity. Unobservable inputs reflect the reporting entity’s own assumptions about the assumptions market participants would use in pricing the asset or liability that are developed based on the best information available. Various inputs are used in determining the value of each Fund’s investments as of the end of the reporting period. When inputs used fall into different levels of the fair value hierarchy, the level in the hierarchy within which the fair value measurement falls is determined based on the lowest level input that is significant to the fair value measurement in its entirety. The designated input levels are not necessarily an indication of the risk or liquidity associated with these investments. These inputs are categorized in the following hierarchy under applicable financial accounting standards: Level 1 – Unadjusted quoted prices in active markets for identical investments, unrestricted assets or liabilities that a Fund has the ability to access at the measurement date; Level 2 – Quoted prices which are not active, quoted prices for similar assets or liabilities in active markets or inputs other than quoted prices that are observable (either directly or indirectly) for substantially the full term of the asset or liability; and Level 3 – Significant unobservable prices or inputs (including the Fund’s own assumptions in determining the fair value of investments) where there is little or no market activity for the asset or liability at the measurement date. The following is a summary of each Fund’s investments/financial instruments in the fair value hierarchy as of October 31, 2015: Level 1 - Unadjusted Level 2 - Other Significant Level 3 - Significant Investments in Securities at Value Quoted Prices Observable Inputs Unobservable Inputs Total ALPS | Alerian MLP Infrastructure Index Fund Master Limited Partnerships(a) $ 26,696,934 $ – $ – $ 26,696,934 Total $ 26,696,934 $ – $ – $ 26,696,934 Level 1 - Unadjusted Level 2 - Other Significant Level 3 - Significant Investments in Securities at Value Quoted Prices Observable Inputs Unobservable Inputs Total ALPS | CoreCommodity Management CompleteCommodities® Strategy Fund Common Stocks(a) $ 140,152,427 $ – $ – $ 140,152,427 2,019,861 – – 2,019,861 Master Limited Partnerships(a) Government Bonds – 245,509,270 – 245,509,270 Purchased Options 7,250 – – 7,250 Short Term Investments 4,793,239 – – 4,793,239 Total $ 146,972,777 $ 245,509,270 $ – $ 392,482,047 Other Financial Instruments Assets Futures Contracts $ 804,065 $ – $ – $ 804,065 Total Return Swap Contracts – 3,728,584 – 3,728,584 Liabilities Written Options (2,468,252) – – (2,468,252) Futures Contracts (1,034,894) – – (1,034,894) Total Return Swap Contracts – (341,788) – (341,788) Total $ (2,699,081) $ 3,386,796 $ – $ 687,715 165 | October 31, 2015 . Notes to Financial Statements October 31, 2015 Investments in Securities at Value ALPS | Kotak India Growth Fund Common Stocks Consumer Discretionary Consumer Staples Energy Financials Health Care Industrials Information Technology Materials Telecommunication Services Short Term Investments Total Level 1 - Unadjusted Quoted Prices $ $ Level 2 - Other Significant Observable Inputs – $ – – – – 117,393 – 208,430 – 46,969 372,792 $ 1,794,367 1,559,720 620,160 4,584,484 1,193,294 1,870,621 2,144,536 1,941,456 249,119 – 15,957,757 Level 3 - Significant Unobservable Inputs $ $ – – – – – – – – – – – Total $ $ 1,794,367 1,559,720 620,160 4,584,484 1,193,294 1,988,014 2,144,536 2,149,886 249,119 46,969 16,330,549 Level 1 - Unadjusted Investments in Securities at Value Quoted Prices ALPS | Red Rocks Listed Private Equity Fund Closedâ€End Funds $ 65,065,185 Common Stocks(a) 429,355,844 Short Term Investments 9,262,230 Total $ 503,683,259 Level 1 - Unadjusted Investments in Securities at Value Quoted Prices ALPS | Sterling ETF Tactical Rotation Fund Exchange Traded Funds $ 34,730,210 Total $ 34,730,210 Level 1 - Unadjusted Investments in Securities at Value Quoted Prices ALPS | Westport Resources Hedged High Income Fund Exchange Traded Funds $ 234,179 (a) – Bank Loans Convertible Corporate Bonds(a) – Corporate Bonds(a) – Mortgage Backed Securities – Short Term Investments – Total $ 234,179 Other Financial Instruments Assets Futures Contracts $ 1,807 Forward Foreign Currency Contracts – Liabilities Futures Contracts (45,631) – Credit Default Swap Contracts Forward Foreign Currency Contracts – Total $ (43,824) Level 2 - Other Significant Observable Inputs $ $ – – – – Level 2 - Other Significant Observable Inputs $ $ Level 2 - Other Significant Observable Inputs $ $ $ $ – 6,512,959 1,036,366 9,999,923 2,039,840 79,899 19,668,987 166 | October 31, 2015 $ $ $ $ – $ – $ $ – – – – – – – 65,065,185 429,355,844 9,262,230 503,683,259 Total Level 3 - Significant Unobservable Inputs – $ 10,439 – (52,685) (879) (43,125) – – – – Total Level 3 - Significant Unobservable Inputs – $ – $ $ $ Level 3 - Significant Unobservable Inputs 34,730,210 34,730,210 Total $ $ 234,179 6,512,959 1,036,366 9,999,923 2,039,840 79,899 19,903,166 – $ – 1,807 10,439 – – – – $ (45,631) (52,685) (879) (86,949) . Notes to Financial Statements October 31, 2015 Investments in Securities at Value ALPS | WMC Research Value Fund Common Stocks(a) Short Term Investments Total Other Financial Instruments Assets Futures Contracts Total Level 1 - Unadjusted Quoted Prices Level 2 - Other Significant Observable Inputs Level 3 - Significant Unobservable Inputs Total $ $ 95,735,591 $ 1,643,620 97,379,211 $ – $ – – $ – $ – – $ 95,735,591 1,643,620 97,379,211 $ $ 55,456 $ 55,456 $ – $ – $ – $ – $ 55,456 55,456 Investments in Securities at Value Clough China Fund Common Stocks Communications Consumer Discretionary Consumer, Cyclical Consumer, Nonâ€Cyclical Energy Financials Industrials Technology Utilities Participation Notes(a) Short Term Investments Total Level 1 - Unadjusted Quoted Prices $ $ Level 2 - Other Significant Observable Inputs 871,832 $ – 158,014 236,467 – – – 431,181 – – 170,634 1,868,128 $ 9,763,562 531,433 12,260,950 2,826,658 2,782,335 20,777,931 5,925,130 8,468,826 635,345 2,787,121 – 66,759,291 Level 3 - Significant Unobservable Inputs $ $ – – – – – – – – – – – – Total $ $ 10,635,394 531,433 12,418,964 3,063,125 2,782,335 20,777,931 5,925,130 8,900,007 635,345 2,787,121 170,634 68,627,419 Level 1 - Unadjusted Investments in Securities at Value Quoted Prices RiverFront Conservative Income Builder Fund Exchange Traded Funds(a) $ 11,508,546 Short Term Investments 804,170 Total $ 12,312,716 Level 1 - Unadjusted Investments in Securities at Value Quoted Prices RiverFront Dynamic Equity Income Fund Common Stocks(a) $ 3,621,225 (a) 71,521,107 Exchange Traded Funds Short Term Investments 1,939,710 Total $ 77,082,042 Level 1 - Unadjusted Investments in Securities at Value Quoted Prices RiverFront Global Allocation Fund Common Stocks(a) $ 2,066,645 Exchange Traded Funds(a) 41,160,218 Short Term Investments 2,428,247 Total $ 45,655,110 Level 2 - Other Significant Observable Inputs $ $ – $ – – $ Level 2 - Other Significant Observable Inputs $ $ – – – – Level 2 - Other Significant Observable Inputs $ $ 167 | October 31, 2015 Level 3 - Significant Unobservable Inputs – – – – Total – $ – – $ Level 3 - Significant Unobservable Inputs $ $ – – – – Total $ $ Level 3 - Significant Unobservable Inputs $ $ – – – – 11,508,546 804,170 12,312,716 3,621,225 71,521,107 1,939,710 77,082,042 Total $ $ 2,066,645 41,160,218 2,428,247 45,655,110 . Notes to Financial Statements October 31, 2015 Investments in Securities at Value RiverFront Global Growth Fund Common Stocks(a) (a) Exchange Traded Funds Short Term Investments Total Level 1 - Unadjusted Quoted Prices $ $ Level 2 - Other Significant Observable Inputs 3,880,497 $ 74,704,082 2,288,635 80,873,214 $ – – – – Level 3 - Significant Unobservable Inputs $ $ – – – – Total $ $ 3,880,497 74,704,082 2,288,635 80,873,214 Level 1 - Unadjusted Level 2 - Other Significant Level 3 - Significant Investments in Securities at Value Quoted Prices Observable Inputs Unobservable Inputs Total RiverFront Moderate Growth & Income Fund Common Stocks(a) $ 6,459,779 $ – $ – $ 6,459,779 (a) 131,372,367 – – 131,372,367 Exchange Traded Funds Short Term Investments 3,970,144 – – 3,970,144 Total $ 141,802,290 $ – $ – $ 141,802,290 (a) For detailed descriptions of country, sector and/or industry, see the accompanying Statement of Investments or Consolidated Statement of Investments. The Funds recognize transfers between levels as of the end of the period. For the Fiscal Year Ended October 31, 2015, the Funds did not have any transfers between Level 1 and Level 2 securities, except the ALPS | Kotak India Growth Fund and the Clough China Fund. The ALPS | Kotak India Growth Fund and Clough China Fund utilize a fair value evaluation service with respect to international securities with an earlier market closing than the Funds’ net asset value computation cutoff. When events trigger the use of the fair value evaluation service on a reporting period date, it results in certain securities transferring from a Level 1 to a Level 2 classification. The transfer amounts disclosed in the tables below represent the value of the securities as of October 31, 2015 transferred in/(out) of Level 1 and Level 2 during the reporting period that were also held at October 31, 2014. The ALPS | Kotak India Growth Fund had the following transfers between Levels 1 and 2 at October 31, 2015: Level 1 - Quoted and Unadjusted Prices Level 2 - Other Significant Observable Inputs Transfers In Transfers (Out) Transfers In Transfers (Out) Common Stocks $ – $ (1,178,648) $ 1,178,648 $ – Total $ – $ (1,178,648) $ 1,178,648 $ – The Clough China Fund had the following transfers between Levels 1 and 2 at October 31, 2015: Level 1 - Quoted and Unadjusted Prices Level 2 - Other Significant Observable Inputs Transfers In Transfers (Out) Transfers In Transfers (Out) Common Stocks $ – $ (1,715,855) $ 1,715,855 $ – Total $ – $ (1,715,855) $ 1,715,855 $ – 168 | October 31, 2015 . Notes to Financial Statements October 31, 2015 The changes of the fair value of investments for which the Funds have used Level 3 inputs to determine the fair value are as follows: Net change in unrealized appreciation/ (depreciation) included in the Statements of Operations attributable to Level 3 investments held at Transfer Transfer Balance as out of of October October 31, into Level 3 Level 3 31, 2015 2015 Change in Unrealized Balance as Accrued Sales Investments of November discount/ Return of Realized Appreciation/ 1, 2014 in Securities premium Capital Gain/(Loss) (Depreciation) Purchases Proceeds Westport Resources Hedged High Income Fund Corporate Bonds $ 262,500 $ 13,424 $ – $ (44,093) $ 33,732 $ – $ (265,563) $ – $ – $ – $ – Total $ 262,500 $ 13,424 $ – $ (44,093) $ 33,732 $ – $ (265,653) $ – $ – $ – $ – Due to the short term nature of the payable due to custodian †overdraft, face value approximates fair value at October 31, 2015. This fair value is based on Level 2 inputs under the threeâ€tier fair valuation hierarchy described above. Offering Costs: The ALPS | Sterling ETF Tactical Rotation Fund and ALPS | Westport Resources Hedged High Income Fund incurred offering costs during their Fiscal Periods Ended October 31, 2014. These offering costs, including fees for printing initial prospectuses, legal, and registration fees, were amortized over the first twelve months from the inception date of each Fund. Amounts amortized through October 31, 2015 are shown on each Fund’s Statement of Operations. Fund and Class Expenses: Some expenses of the Trust can be directly attributed to a Fund or a specific share class of a Fund. Expenses which cannot be directly attributed are apportioned among all Funds in the Trust based on average net assets of each share class within a Fund. Federal Income Taxes: The Funds, except for ALPS | Alerian MLP Infrastructure Index Fund, comply with the requirements under Subchapter M of the Internal Revenue Code of 1986, as amended (the “Code”) applicable to regulated investment companies and intend to distribute substantially all of their net taxable income and net capital gains, if any, each year. Those Funds are not subject to income taxes to the extent such distributions are made. The ALPS | Alerian MLP Infrastructure Index Fund is taxed as a regular corporation (or soâ€called subchapter “C” corporation) for federal income tax purposes, and will be subject to tax on its taxable income at rates applicable to corporations. Currently, the maximum marginal regular federal income tax rate for a corporation is 35 percent, but the Fund expects to pay federal income tax at a rate of 34 percent. The ALPS | Alerian MLP Infrastructure Index Fund may be subject to a 20 percent federal alternative minimum tax on its federal alternative taxable income to the extent that its alternative minimum tax exceeds its regular federal income tax. This differs from most investment companies, which elect to be treated as “regulated investment companies” under the Code in order to avoid paying entity level income taxes. Under current law, the ALPS | Alerian MLP Infrastructure Index Fund is not eligible to elect treatment as a regulated investment company due to its investments, primarily in Master Limited Partnerships (“MLPs”) invested in energy assets. As a result, the ALPS | Alerian MLP Infrastructure Index Fund will be obligated to pay applicable federal and state corporate income taxes on its taxable income as opposed to most other investment companies which are not so obligated. As discussed below, the ALPS | Alerian MLP Infrastructure Index Fund expects that a portion of the distributions it receives from MLPs may be treated as a taxâ€deferred return of capital, thus reducing the Fund’s current tax liability. However, the amount of taxes currently paid by the ALPS | Alerian MLP Infrastructure Index Fund will vary depending on the amount of income and gains derived from investments and/or sales of MLP interests and such taxes will reduce the return from an investment in the Fund. See further disclosure regarding MLPs below. As of and during the Fiscal Year Ended October 31, 2015, the Funds, except the ALPS | Alerian MLP Infrastructure Index Fund, did not have a liability for any unrecognized tax benefits. The Funds file U.S. federal, state, and local tax returns as required. The Funds’ tax returns are subject to examination by the relevant tax authorities until expiration of the applicable statute of limitations which is generally three years after the filing of the tax return, but may extend to four years in certain jurisdictions. Tax returns for open years have incorporated no uncertain tax positions that require a provision for income taxes. 169 | October 31, 2015 . Notes to Financial Statements October 31, 2015 Distributions to Shareholders: Each Fund, except the ALPS | Alerian MLP Infrastructure Index Fund, ALPS | Westport Resources Hedged High Income Fund, RiverFront Conservative Income Builder Fund, RiverFront Dynamic Equity Income Fund, and RiverFront Moderate Growth & Income Fund normally pays dividends and distributes capital gains, if any, on an annual basis. The ALPS | Alerian MLP Infrastructure Index Fund, RiverFront Conservative Income Builder Fund, RiverFront Dynamic Equity Income Fund, and RiverFront Moderate Growth & Income Fund normally pay dividends, if any, on a quarterly basis and distribute capital gains annually. The ALPS | Westport Hedged High Income Fund normally pays dividends, if any, on a monthly basis and distributes capital gains annually. Income dividend distributions are derived from interest and other income each Fund receives from its investments, including distributions of shortâ€term capital gains. Capital gain distributions are derived from gains realized when the Fund sells a security it has owned for more than a year. Each Fund may make additional distributions and dividends at other times if its portfolio manager or managers believe doing so may be necessary for the Fund to avoid or reduce taxes. Distributions received from the ALPS | Alerian MLP Infrastructure Index Fund’s investments in MLPs generally are comprised of income and return of capital. The Fund records investment income and return of capital based on estimates made at the time such distributions are received. Such estimates are based on historical information available from each MLP and other industry sources. These estimates may subsequently be revised based on information received from MLPs after their tax reporting periods are concluded. Return of capital distributions are not taxable income to the shareholder, but reduce the investor’s tax basis in the investor’s Fund shares. Such a reduction in tax basis will result in larger taxable gains and/or lower tax losses on a subsequent sale of Fund shares. Shareholders who periodically receive the payment of dividends or other distributions consisting of a return of capital may be under the impression that they are receiving net profits from the Fund when, in fact, they are not. Shareholders should not assume that the source of the distributions is from the net profits of the Fund. Commodityâ€Linked Notes: The ALPS | CoreCommodity Management CompleteCommodities® Strategy Fund may invest in commodityâ€linked notes which are derivative instruments that have characteristics of a debt security and of a commodityâ€linked derivative. A commodityâ€linked note typically provides for interest payments and a principal payment at maturity linked to the price movement of the underlying commodity, commodity index or commodity futures or option contract. Commodityâ€linked notes may be principal protected, partially protected, or offer no principal protection. The value of these notes will rise and fall in response to changes in the underlying commodity or related index or investment. These notes are often leveraged, increasing the volatility of each note’s value relative to the change in the underlying linked index. Commodity indexâ€linked investments may be more volatile and less liquid than the underlying index and their value may be affected by the performance of the commodities as well as other factors, including liquidity, quality, maturity and other economic variables. Commodityâ€linked notes are typically issued by a bank or other financial institution and are sometimes referred to as structured notes because the terms of the notes may be structured by the issuer and the purchaser of the notes to accommodate the specific investment requirements of the purchaser. Investment Transactions and Investment Income: Investment transactions are accounted for on the date the investments are purchased or sold (trade date basis). Net realized gains and losses from investment transactions are reported on an identified cost basis. Interest income, which includes accretion of discounts and amortization of premiums, is accrued and recorded as earned. The character of distributions received from investments in limited partnerships is estimated based off the best available information at period end. Dividend income is recognized on the exâ€dividend date or for certain foreign securities, as soon as information is available to each Fund. Foreign Securities: Each Fund may directly purchase securities of foreign issuers. Investing in securities of foreign issuers involves special risks not typically associated with investing in securities of U.S. issuers. The risks include possible reevaluation of currencies, the inability to repatriate foreign currency, less complete financial information about companies and possible future adverse political and economic developments. Moreover, securities of many foreign issuers and their markets may be less liquid and their prices more volatile than those of securities of comparable U.S. issuers. Foreign Currency Translation: The books and records of the Funds are maintained in U.S. dollars. Investment valuations and other assets and liabilities initially expressed in foreign currencies are converted each business day into U.S. dollars based upon current exchange rates. The portion of realized and unrealized gains or losses on investments due to fluctuations in foreign currency exchange rates is not separately disclosed and is included in realized and unrealized gains or losses on investments, when applicable. Foreign Currency Spot Contracts: The Funds may enter into foreign currency spot contracts to facilitate transactions in foreign securities or to convert foreign currency receipts into U.S. dollars. A foreign currency spot contract is an agreement between two parties to buy and sell currencies at the current market rate, for settlement generally within two business days. The U.S. dollar value of the contracts is determined using current currency exchange rates supplied by a pricing service. The contract is markedâ€toâ€market daily for settlements beyond one day and any change in market value is recorded as an unrealized gain or loss. When the contract is closed, the Fund records a realized gain or loss equal to the difference between the value on the open and close date. Losses may arise from changes in the value of the foreign currency, or if the counterparties do not perform under the contract’s terms. The maximum potential loss from such contracts is the aggregate face value in U.S. dollars at the time the contract was opened. 170 | October 31, 2015 . Notes to Financial Statements October 31, 2015 Real Estate Investment Trusts (“REITs”): The Funds may invest a portion of their assets in REITs and are subject to certain risks associated with direct investment in REITs. REITs may be affected by changes in the value of their underlying properties and by defaults by borrowers or tenants. REITs depend generally on their ability to generate cash flow to make distributions to shareowners, and certain REITs have selfâ€liquidation provisions by which mortgages held may be paid in full and distributions of capital returns may be made at any time. In addition, the performance of a REIT may be affected by its failure to qualify for taxâ€free passâ€through of income under the Internal Revenue Code of 1986, as amended (the “Code”), or its failure to maintain exemption from registration under the 1940 Act. Treasury Inflation Protectedâ€Securities: The Funds may invest in treasury inflation protected securities (“TIPS”), including structured bonds in which the principal amount is adjusted daily to keep pace with inflation, as measured by the U.S. Consumer Pricing Index for Urban Consumers. The adjustments to principal due to inflation/deflation are reflected as increases/decreases to interest income with a corresponding adjustment to cost. Such adjustments may have a significant impact on a Fund’s distributions and may result in a return of capital to shareholders. The repayment of the original bond principal upon maturity is guaranteed by the full faith and credit of the U.S. Government. Loan Participations and Assignments: Certain Funds may invest in loan participations and assignments. The Fund considers loan participations and assignments to be investments in debt securities. Loan participations typically will result in the Fund having a contractual relationship only with the lender, not with the borrower. The Fund will have the right to receive payments of principal, interest and any fees to which it is entitled only from the lender selling the participation and only upon receipt by the lender of the payments from the borrower. Under a loan participation, the Fund generally will have no right to enforce compliance by the borrower with the terms of the loan agreement relating to the loan, nor any rights of setâ€off against the borrower, and the Fund may not benefit directly from any collateral supporting the loan in which it has purchased the participation. As a result, the Fund will assume the credit risk of both the borrower and the lender that is selling the participation. In the event of the insolvency of the lender selling a participation, the Fund may be treated as a general creditor of the lender and may not benefit from any setâ€off between the lender and the borrower. When the Fund purchases assignments of loans from lenders, the Fund will acquire direct rights against the borrower on the loan, except that under certain circumstances such rights may be more limited than those held by the assigning lender. Master Limited Partnerships: MLPs are publicly traded partnerships engaged in the transportation, storage and processing of minerals and natural resources. By confining their operations to these specific activities, their interests, or units, are able to trade on public securities exchanges exactly like the shares of a corporation, without entity level taxation. To qualify as a MLP and to not be taxed as a corporation, a partnership must receive at least 90% of its income from qualifying sources as set forth in Section 7704(d) of the Code. These qualifying sources include natural resource based activities such as the processing, transportation and storage of mineral or natural resources. MLPs generally have two classes of owners, the general partner and limited partners. The general partner of an MLP is typically owned by a major energy company, an investment fund, the direct management of the MLP, or is an entity owned by one or more of such parties. The general partner may be structured as a private or publicly traded corporation or other entity. The general partner typically controls the operations and management of the MLP through an up to 2% equity interest in the MLP plus, in many cases, ownership of common units and subordinated units. Limited partners typically own the remainder of the partnership, through ownership of common units, and have a limited role in the partnership’s operations and management. MLPs are typically structured such that common units and general partner interests have first priority to receive quarterly cash distributions up to an established minimum amount (“minimum quarterly distributions” or “MQD”). Common and general partner interests also accrue arrearages in distributions to the extent the MQD is not paid. Once common and general partner interests have been paid, subordinated units receive distributions of up to the MQD; however, subordinated units do not accrue arrearages. Distributable cash in excess of the MQD is paid to both common and subordinated units and is distributed to both common and subordinated units generally on a pro rata basis. The general partner is also eligible to receive incentive distributions if the general partner operates the business in a manner which results in distributions paid per common unit surpassing specified target levels. As the general partner increases cash distributions to the limited partners, the general partner receives an increasingly higher percentage of the incremental cash distributions. 3. DERIVATIVE INSTRUMENTS As a part of their investment strategy, the ALPS | CoreCommodity Management CompleteCommodities® Strategy Fund, ALPS | Kotak India Growth Fund and ALPS | Westport Resources Hedged High Income Fund are permitted to enter in various types of derivatives contracts. The other funds including ALPS | Alerian MLP Infrastructure Index Fund, ALPS | Red Rocks Listed Private Equity Fund, ALPS|Sterling ETF Tactical Rotation Fund, ALPS | WMC Research Value Fund, Clough China Fund, RiverFront Conservative Income Builder Fund, RiverFront Dynamic Equity Income Fund, RiverFront Global Allocation Fund, RiverFront Global Growth Fund and RiverFront Moderate Growth & Income Fund may invest to a lesser extent in derivatives contracts. In doing so, the Funds will employ strategies in differing combinations to permit them to increase, decrease, or change the level or types of exposure to market factors. Central to those strategies are features inherent in derivatives that make them more attractive for this purpose than equity or debt securities; they require little or no initial cash investment, they can focus exposure on only certain selected risk factors, and they may not require the ultimate receipt or delivery of the underlying security (or securities) to the contract. This may allow the Funds to pursue their objectives more quickly and efficiently than if they were to make direct purchases or sales of securities capable of affecting a similar response to market factors. 171 | October 31, 2015 . Notes to Financial Statements October 31, 2015 Cash collateral that has been pledged to cover derivative obligations of the Funds and cash collateral received from the counterparty, if any, is reported separately on the Statements of Assets and Liabilities as cash pledged as collateral and cash received as collateral, respectively. Nonâ€cash collateral pledged by the Funds, if any, is noted in the Statements of Investments. Risk of Investing in Derivatives: The Funds’ use of derivatives can result in losses due to unanticipated changes in the market risk factors and the overall market. In instances where the Funds are using derivatives to decrease, or hedge, exposures to market risk factors for securities held by the Funds, there are also risks that those derivatives may not perform as expected resulting in losses for the combined or hedged positions. Derivatives may have little or no initial cash investment relative to their market value exposure and therefore can produce significant gains or losses in excess of their cost. This use of embedded leverage allows the Fund to increase its market value exposure relative to its net assets and can substantially increase the volatility of the Funds’ performance. Additional associated risks from investing in derivatives also exist and potentially could have significant effects on the valuation of the derivative and the Funds. Typically, the associated risks are not the risks that the Funds are attempting to increase or decrease exposure to, per their investment objectives, but are the additional risks from investing in derivatives. Examples of these associated risks are liquidity risk, which is the risk that the Funds will not be able to sell or close out the derivative in a timely manner, and counterparty credit risk, which is the risk that the counterparty will not fulfill its obligation to the Funds. In addition, use of derivatives may increase or decrease exposure to the following risk factors: Equity Risk: Equity risk relates to the change in value of equity securities as they relate to increases or decreases in the general market. Associated risks can be different for each type of derivative and are discussed by each derivative type in the notes that follow. Commodity Risk: Exposure to the commodities markets may subject the Funds to greater volatility than investments in traditional securities. Prices of various commodities may also be affected by factors, such as drought, floods, weather, livestock disease, embargoes, tariffs and other regulatory developments, which are unpredictable. The prices of commodities can also fluctuate widely due to supply and demand disruptions in major producing or consuming regions. Foreign Currency Risk: Currency trading involves significant risks, including market risk, interest rate risk, country risk, counterparty credit risk and short sale risk. Market risk results from the price movement of foreign currency values in response to shifting market supply and demand. Interest rate risk arises whenever a country changes its stated interest rate target associated with its currency. Country risk arises because virtually every country has interfered with international transactions in its currency. Interest Rate Risk: Interest rate risk is the risk that fixed income securities will decline in value because of changes in interest rates. As nominal interest rates rise, the value of fixed income securities held by the Funds are likely to decrease. Securities with longer durations tend to be more sensitive to changes in interest rates, and are usually more volatile than securities. Swap Contracts: Each Fund may enter into swap transactions for hedging purposes or to seek to increase total return. At the present time, the CoreCommodity Fund primarily enters into swap transactions for the purpose of increasing total return and the ALPS Westport Hedged High Income Fund for hedging purposes. Swap agreements may be executed in a multilateral or other trade facility program, such as a registered exchange (“centrally cleared swaps”) or may be privately negotiated in the overâ€the counter market. The duration of a swap agreement typically ranges from a few weeks to more than one year. In a centrally cleared swap, immediately following execution of the swap agreement, the swap agreement is novated to a central counterparty (the “CCP”) and the Fund’s counterparty on the swap agreement becomes the CCP. Risks may arise as a result of the failure of the counterparty to the swap contract to comply with the terms of the swap contract. The loss incurred by the failure of a counterparty is generally limited to the net payment to be received by the Funds and/or the termination value at the end of the contract. Therefore, the Funds consider the creditworthiness of each counterparty to a contract in evaluating potential credit risk. Although centrally cleared swaps typically present less counterparty risk than nonâ€centrally cleared swaps, a Fund that has entered into centrally cleared swaps is subject to the risk of the failure of the CCP. Additionally, risks may arise from unanticipated movements in interest rates or in the value of the underlying reference asset or index. Entering into these agreements involves, to varying degrees, market risk, liquidity risk and elements of credit, legal and documentation risk that are not directly reflected in the amounts recognized in the Statements of Assets and Liabilities. The Funds may pay or receive cash as collateral on these contracts which may be recorded as an asset and/or liability. The Funds must set aside liquid assets, or engage in other appropriate measures, to cover its obligations under these contracts. Swaps are marked to market daily using either pricing vendor quotations, counterparty prices or model prices and the change in value, if any, is recorded as an unrealized gain or loss. 172 | October 31, 2015 . Notes to Financial Statements October 31, 2015 Upfront payments made and/or received by the Funds are recorded as an asset and/or liability and realized gains or losses are recognized ratably over the contract’s term/event, with the exception of forward starting interest rate swaps, whose realized gains or losses are recognized ratably from the effective start date. Periodic payments received or made on swap contracts are recorded as realized gains or losses. Gains or losses are realized upon termination of a swap contract and are recorded on the Statement of Operations. Total return swaps are agreements in which there is an exchange of cash flows whereby one party commits to make payments based on the total return (coupons plus capital gains/losses) of an underlying instrument in exchange for fixed or floating rate interest payments. To the extent the total return of the instrument or index underlying the transaction exceeds or falls short of the offsetting interest rate obligation, the Fund will receive a payment from or make a payment to the counterparty. Credit default swaps ("CDS") are typically twoâ€party financial contracts that transfer credit exposure between the two parties. Under a typical CDS, one party (the "seller") receives preâ€determined periodic payments from the other party (the "buyer"). The seller agrees to make compensating specific payments to the buyer if a negative credit event occurs, such as the bankruptcy or default by the issuer of the underlying debt instrument. Swap agreements held at October 31, 2015 are disclosed after the Statement of Investments. The average notional amount of the swap positions held in the ALPS | CoreCommodity Management CompleteCommodities® Strategy Fund and the ALPS | Westport Resources Hedged High Income Fund for the Fiscal Year Ended October 31, 2015 was $506,124 and $(1,409,583), respectively. Futures: Each Fund may invest in futures contracts in accordance with their investment objectives. Each Fund does so for a variety of reasons including for cash management, hedging or nonâ€hedging purposes in an attempt to achieve the Fund’s investment objective. A futures contract provides for the future sale by one party and purchase by another party of a specified quantity of the security or other financial instrument at a specified price and time. A futures contract on an index is an agreement pursuant to which two parties agree to take or make delivery of an amount of cash equal to the difference between the value of the index at the close of the last trading day of the contract and the price at which the index contract was originally written. Futures transactions may result in losses in excess of the amount invested in the futures contract. There can be no guarantee that there will be a correlation between price movements in the hedging vehicle and in the portfolio securities being hedged. An incorrect correlation could result in a loss on both the hedged securities in a Fund and the hedging vehicle so that the portfolio return might have been greater had hedging not been attempted. There can be no assurance that a liquid market will exist at a time when a Fund seeks to close out a futures contract or a futures option position. Lack of a liquid market for any reason may prevent a Fund from liquidating an unfavorable position, and the Fund would remain obligated to meet margin requirements until the position is closed. In addition, a Fund could be exposed to risk if the counterparties to the contracts are unable to meet the terms of their contracts. With exchange traded futures, there is minimal counterparty credit risk to the Funds since futures are exchange traded and the exchange’s clearinghouse, as counterparty to all exchange traded futures, guarantees the futures against default. When a purchase or sale of a futures contract is made by a Fund, the Fund is required to deposit with its custodian (or broker, if legally permitted) a specified amount of liquid assets (“initial margin”). The margin required for a futures contract is set by the exchange on which the contract is traded and may be modified during the term of the contract. The initial margin is in the nature of a performance bond or good faith deposit on the futures contract that is returned to a Fund upon termination of the contract, assuming all contractual obligations have been satisfied. Each day a Fund may pay or receive cash, called “variation margin,” equal to the daily change in value of the futures contract. Such payments or receipts are recorded for financial statement purposes as unrealized gains or losses by a Fund. Variation margin does not represent a borrowing or loan by a Fund but is instead a settlement between a Fund and the broker of the amount one would owe the other if the futures contract expired. When the contract is closed, a Fund records a realized gain or loss equal to the difference between the value of the contract at the time it was opened and the value at the time it was closed. The average number of futures contracts held in the ALPS | CoreCommodity Management CompleteCommodities® Strategy Fund, the ALPS | Westport Resources Hedged High Income Fund and the ALPS | WMC Research Value Fund for the Fiscal Year Ended October 31, 2015 was 246 contracts, 38 contacts and 4 contracts, respectively. Forward Foreign Currency Contracts: The ALPS | Westport Resources Hedged High Income Fund (the “Fund”) invests in foreign currency exchange contracts to reduce the risks of fluctuating exchange rates and to generate returns uncorrelated to the other strategies employed. A forward foreign currency exchange contract involves an obligation to purchase or sell a specific currency at a future date, which may be a fixed number of days from the date of the contract agreed upon by the parties, at a price set at the time of the contract. By entering into a forward foreign currency exchange contract, the Fund “locks in” the exchange rate between the currency it will deliver and the currency it will receive for the duration of the contract. As a result, the Fund reduces its exposure to changes in the value of the currency it will deliver and increases its exposure to changes in the value of the currency it will exchange into. The Fund may enter into these contracts for the purpose of hedging against foreign exchange risk arising from the Fund’s investment or anticipated investment in securities denominated in foreign currencies. The Fund also may enter into these contracts for purposes of increasing exposure to a foreign currency or to shift exposure to foreign currency fluctuations from one country to another. The Fund may use one currency (or a basket of currencies) to hedge against adverse changes in the value of another currency (or a basket of currencies) when exchange rates 173 | October 31, 2015 . Notes to Financial Statements October 31, 2015 between the two currencies are positively correlated. The unrealized appreciation/(depreciation) is reported in the Statement of Assets and Liabilities as receivable or payable and in the Statement of Operations within the change in unrealized appreciation/(depreciation). At contract close, the difference between the original cost of the contract and the value at the close date is recorded as a realized gain/(loss) in the Statement of Operations. As of October 31, 2015, the Fund held forward foreign currency contracts with net unrealized appreciation of $9,560. For the fiscal year the average exposure for the Fund was $(4,336). Option Contracts: Each Fund may enter into options transactions for hedging purposes and for nonâ€hedging purposes such as seeking to enhance return. Each Fund may write covered put and call options on any stocks or stock indices, currencies traded on domestic and foreign securities exchanges, or futures contracts on stock indices, interest rates and currencies traded on domestic and, to the extent permitted by the CFTC, foreign exchanges. A written call option on an asset by a Fund obligates the Fund to sell the specified asset to the holder (purchaser) at a stated price (the exercise price) if the option is exercised before a specified date (the expiration date). A written put option on an asset by a Fund obligates the Fund to buy the specified asset from the purchaser at the exercise price if the option is exercised before the expiration date. Premiums received when writing options are recorded as liabilities and are subsequently adjusted to the current value of the options written. Premiums received from writing options that expire are treated as realized gains. Premiums received from writing options, which are either exercised or closed, are offset against the proceeds received or amount paid on the transaction to determine realized gains or losses which are recorded on the Statement of Operations. The Funds had the following transactions in written covered call/put options during the Fiscal Year Ended October 31, 2015: Number of Contracts Premiums Received ALPS | CoreCommodity Management CompleteCommodities® Strategy Fund Options Outstanding, at the beginning of the period (536) $ 1,186,481 Options written (1,765) 3,157,224 Options closed 1023 (2,861,660) Options exercised 8 (9,999) Options expired 295 (329,997) Options Outstanding, at October 31, 2015 (975) $ 1,142,049 174 | October 31, 2015 . Notes to Financial Statements October 31, 2015 Derivatives Instruments: The following tables disclose the amounts related to each Fund’s use of derivative instruments. The effect of derivatives instruments on the Statement of Assets and Liabilities as of October 31, 2015: Risk Exposure Asset Location Fair Value Liability Location Fair Value ALPS | CoreCommodity Management CompleteCommodities® Strategy Fund(a) Equity Contracts (Purchased Options) Investments, at value 7,250 N/A N/A $ $ Equity Contracts (Written Options) N/A N/A Written options, at value 2,468,252 Unrealized depreciation Commodity Contracts Unrealized appreciation on (b) 804,065 on futures contracts (b) 1,034,894 (Futures Contracts) futures contracts Unrealized depreciation Commodity Contracts Unrealized appreciation on on total return swap (Total Return Swap Contracts) total return swap contracts 3,728,584 contracts 341,788 Total $ 4,539,899 $ 3,844,934 ALPS | Westport Resources Hedged High Income Fund Unrealized depreciation Interest Rate Contracts Unrealized appreciation on (c) $ 1,807 on futures contracts (c) $ (45,631) (Futures Contracts) futures contracts Unrealized depreciation Interest Rate Contracts on centrally cleared (Credit Default Swap Contracts) N/A N/A swap contracts (d) (52,685) Unrealized appreciation on Unrealized depreciation Foreign Exchange Rate Contracts forward foreign currency on forward foreign (Forward Foreign Currency Contracts) 10,439 (879) contracts currency contracts Total $ 12,246 $ (99,195) ALPS | WMC Research Value Fund Equity Contracts Unrealized depreciation (Futures Contracts) N/A $ – on futures contracts (c) $ 55,456 Total – 55,456 $ $ (a) The ALPS | CoreCommodity Management CompleteCommodities® Strategy Fund consolidates the statements of assets and liabilities. (b) Represents cumulative appreciation (depreciation) of futures contracts as reported in the Consolidated Statement of Investments. Only the current day's net variation margin is reported within the Consolidated Statement of Assets and Liabilities. (c) Represents cumulative appreciation (depreciation) of futures contracts as reported in the Statement of Investments. Only the current day's net variation margin is reported within the Statement of Assets and Liabilities. (d) Represents cumulative appreciation (depreciation) of credit default swap contracts as reported in the Statement of Investments. Only the current day's net variation margin is reported within the Statement of Assets and Liabilities. 175 | October 31, 2015 .
Notes to Financial Statements October 31, 2015 The effect of derivatives instruments on the Statement of Operations for the Fiscal Year Ended October 31, 2015: Realized Gain/(Loss) Change in Unrealized on Derivatives Appreciation/(Depreciation) on Derivatives Recognized in Recognized Risk Exposure Statement of Operations Location in Income Income ALPS | CoreCommodity Management CompleteCommodities® Strategy Fund(a) Equity Contracts Net realized loss on investments/Net change in (Purchased Options) unrealized appreciation on investments (1,219,808) $ (956,683) $ Equity Contracts Net realized gain on written options/Net change (Written Options) in unrealized (depreciation) on written 1,666,342 (1,573,724) options Commodity and Equity Contracts Net realized loss on futures contracts/Net (Futures Contracts) change in unrealized appreciation on futures contracts (2,057,904) 926,594 Commodity Contracts Net realized loss on total return swap (Total Return Swap Contracts) contracts/Net change in unrealized appreciation on total return swap contracts (88,888,724) 9,468,760 Total $ (90,500,094) $ 7,864,947 ALPS | Westport Resources Hedged High Income Fund Interest Rate Contracts Net realized loss on futures contracts/Net (Futures Contracts) change in unrealized depreciation on futures contracts (149,102) $ (15,041) $ Interest Rate Contracts Net realized gain on credit default swap (Credit Default Swap Contracts) contracts/Net change in unrealized depreciation on credit default swap 6,183 (42,011) contracts Foreign Exchange Rate Contracts Net realized gain on foreign currency (Forward Foreign Currency transactions/Net change in unrealized Contracts) depreciation on translation of assets and liabilities denominated in foreign currencies 9,560 and forward foreign currency contracts 16,934 Total $ (125,985) $ (47,492) ALPS | WMC Research Value Fund Equity Contracts Net realized loss on futures contracts/Net (Futures Contracts) change in unrealized depreciation on futures contracts 103,218 $ 55,456 $ Total 103,218 $ 55,456 $ (a) The ALPS | CoreCommodity Management CompleteCommodities® Strategy Fund consolidates the statements of operations. 176 | October 31, 2015 . Notes to Financial Statements October 31, 2015 Certain derivative contracts are executed under either standardized netting agreements or, for exchangeâ€traded derivatives, the relevant contracts for a particular exchange which contain enforceable netting provisions. A derivative netting arrangement creates an enforceable right of setâ€off that becomes effective, and affects the realization of settlement on individual assets, liabilities and collateral amounts, only following a specified event of default or early termination. Default events may include the failure to make payments or deliver securities timely, material adverse changes in financial condition or insolvency, the breach of minimum regulatory capital requirements, or loss of license, charter or other legal authorization necessary to perform under the contract. The following table presents financial instruments that are subject to enforceable netting arrangements or other similar agreements as of October 31, 2015: Offsetting of Derivatives Asset October 31, 2015 Gross Amounts Net Amounts Offset in the Statement of Presented in the Statement of Assets Assets and Gross Amounts of Financial Liabilities Description Recognized Assets and Liabilities Instruments(a) ALPS | CoreCommodity Management CompleteCommodities® Strategy Fund Total Return Swap Contracts $ 3,728,584 $ – $ 3,728,584 $ (341,788) Total $ 3,728,584 $ – $ 3,728,584 $ (341,788) Offsetting of Derivatives Liability October 31, 2015 Gross Amounts Net Amounts Offset in the Statement of Gross Amounts of Presented in the Statement of Assets Assets and Recognized Financial Liabilities Liabilities Description and Liabilities Instruments(a) ALPS | CoreCommodity Management CompleteCommodities® Strategy Fund Total Return Swap Contracts $ 341,788 $ – $ 341,788 $ (341,788) Total $ 341,788 $ – $ 341,788 $ (341,788) (a) Cash Collateral Received(a) $ $ Net Amount – $ – $ 3,386,796 3,386,796 Gross Amounts Not Offset in the Statement of Financial Position Offset in the Statement of Financial Position Gross Amounts Not Cash Collateral Pledged(a) $ $ Net Amount – $ – $ – – These amounts are limited to the derivative asset/liability balance and, accordingly, do not include excess collateral received/pledged. 4. TAX BASIS INFORMATION Tax Basis of Distributions to Shareholders: The character of distributions made during the year from net investment income or net realized gains may differ from its ultimate characterization for federal income tax purposes. Also, due to the timing of dividend distributions, the fiscal year in which amounts are distributed may differ from the fiscal year in which the income or realized gain were recorded by a Fund. The amounts and characteristics of tax basis distributions and composition of distributable earnings/(accumulated losses) are finalized at fiscal yearâ€end. 177 | October 31, 2015 . Notes to Financial Statements October 31, 2015 The tax character of distributions paid by the Funds for the Fiscal Year Ended October 31, 2015 were as follows: Fund Ordinary Income Long-Term Capital Gain ALPS | Alerian MLP Infrastructure Index Fund $ 8,391 $ – ALPS | CoreCommodity Management CompleteCommodities® Strategy Fund – 1,912,471 ALPS | Kotak India Growth Fund 422,790 245,199 ALPS | Red Rocks Listed Private Equity Fund 15,572,410 1,431,943 ALPS | Sterling ETF Tactical Rotation Fund – 126,929 ALPS | Westport Resources Hedged High Income Fund – 1,387,817 ALPS | WMC Research Value Fund 2,088,939 8,298,461 Clough China Fund 1,612,835 1,749,005 RiverFront Conservative Income Builder Fund 95,413 222,922 RiverFront Dynamic Equity Income Fund 1,736,888 1,884,705 RiverFront Global Allocation Fund 2,042,515 981,226 RiverFront Global Growth Fund 5,687,960 2,340,114 RiverFront Moderate Growth & Income Fund 4,753,671 4,696,222 $ Return of Capital 2,346,444 – – – – 14,119 – – – – – – – The tax character of distributions paid by the Funds for the Fiscal Periods Ended October 31, 2014 were as follows: Fund Ordinary Income Long-Term Capital Gain Return of Capital ALPS | Alerian MLP Infrastructure Index Fund $ 94,908 $ – $ 828,416 ALPS | Westport Resources Hedged High Income Fund 833,792 – – RiverFront Conservative Income Builder Fund – – 35,707 RiverFront Dynamic Equity Income Fund – – 355,945 RiverFront Moderate Growth & Income Fund 860,964 – – Components of Distributable Earnings on a Tax Basis: At October 31, 2015, permanent differences in book and tax accounting were reclassified. These differences had no effect on net assets and were primarily attributed to differences in the treatment of commodity related exchangeâ€traded funds, the differing tax treatment of foreign currency, investments in partnerships, Passive Foreign Investment Companies (“PFICs”) and certain other investments. For the year ended October 31, 2015, the following reclassifications, which had no impact on results of operations or net assets, were recorded to reflect tax character: Accumulated Net Accumulated Net Realized Fund Paid-in Capital Investment Income/(Loss) Gain/(Loss) on Investments ALPS | CoreCommodity Management CompleteCommodities® Strategy Fund $ (96,036,033) $ 1,735,772 $ 94,300,261 ALPS | Kotak India Growth Fund – 213,003 (213,003) ALPS | Red Rocks Listed Private Equity Fund (100) 14,788,722 (14,788,622) ALPS | Sterling ETF Tactical Rotation Fund 35,673 (1) (35,672) ALPS | Westport Resources Hedged High Income Fund 25,481 1,089 (26,570) ALPS | WMC Research Value Fund – (352,423) 352,423 Clough China Fund – 523,781 (523,781) RiverFront Conservative Income Builder Fund – (13) 13 RiverFront Dynamic Equity Income Fund – 287 (287) RiverFront Global Allocation Fund – (23) 23 RiverFront Global Growth Fund – 4,032 (4,032) 178 | October 31, 2015 . Notes to Financial Statements October 31, 2015 Included in the amounts reclassified was a net operating loss offset to Paidâ€in Capital as follows: Fund Amount ALPS | CoreCommodity Management CompleteCommodities® Strategy Fund $ 724,239 As of October 31, 2015, the components of distributable earnings on a tax basis were as follows: Accumulated net Other cumulative Net unrealized Undistributed net realized gain/(loss) effect of timing appreciation/(depreciation) Total investment income on investments differences on investments ALPS | CoreCommodity Management CompleteCommodities® Strategy Fund $ – $ (26,174,543) $ (1,597,295) $ (32,259,627) $ (60,031,465) ALPS | Kotak India Growth Fund 431,005 1,657,266 – 274,190 2,362,461 ALPS | Red Rocks Listed Private Equity Fund 17,032,280 20,597,219 (945,622) 18,168,137 54,852,014 ALPS | Sterling ETF Tactical Rotation Fund 124,311 (1,844,820) – (33,839) (1,754,348) ALPS | Westport Resources Hedged High Income Fund – (387,189) 86,951 (1,842,736) (2,142,974) ALPS | WMC Research Value Fund – 25,731,923 (55,456) 6,664,673 32,341,140 Clough China Fund 1,041,894 (1,879,455) – 7,298,298 6,460,737 RiverFront Conservative Income Builder Fund 30,131 – 41,574 79,041 7,336 92,674 1,629,180 – 1,865,520 3,587,374 RiverFront Dynamic Equity Income Fund RiverFront Global Allocation Fund 200,285 163,694 – 1,451,386 1,815,365 RiverFront Global Growth Fund 463,691 736,972 – 4,129,980 5,330,643 RiverFront Moderate Growth & Income Fund 386,905 2,955,582 – 3,035,698 6,378,185 Capital Losses: As of October 31, 2015 the following Funds had capital loss carryforwards which may reduce the Funds’ taxable income arising from future net realized gains on investments, if any, to the extent permitted by the Code and thus may reduce the amount of the distributions to shareholders which would otherwise be necessary to relieve the Funds of any liability for federal tax. Under the recently enacted Regulated Investment Company Modernization Act of 2010, capital losses incurred by each fund in tax years beginning after December 22, 2010 will not be subject to expiration. In addition, such losses must be utilized prior to the losses incurred in the years preceding enactment. Capital loss carryovers utilized during the Fiscal Year Ended October 31, 2015, were: Fund Amount ALPS | Red Rocks Listed Private Equity Fund $ 238,740 Postâ€Enactment Capital Losses*: Capital losses deferred to next tax year were as follows: Fund Short-Term Long-Term ALPS | CoreCommodity Management CompleteCommodities® Strategy Fund $ 15,065,672 $ 11,108,871 ALPS | Sterling ETF Tactical Rotation Fund – 1,844,820 ALPS | Westport Resources Hedged High Income Fund 195,569 191,620 Clough China Fund – 1,879,455 * Post-Enactment Capital Losses arise in fiscal years beginning after December 22, 2010, and exclude any election for late year capital loss (during the period November 1st to December 31st) deferred for the current fiscal year. As a result of the enactment of the Regulated Investment Company Act of 2010, pre-enactment capital loss carryforwards may be more likely to expire unused. Additionally, post-enactment capital losses that are carried forward will retain their character as either short-term or long-term losses rather than being considered all short-term as under previous law. 179 | October 31, 2015 . Notes to Financial Statements October 31, 2015 ALPS | CoreCommodity Management CompleteCommodities® Strategy Fund elected to defer to the period ending October 30, 2016, late year ordinary losses in the amount of $1,479,156. Unrealized Appreciation and Depreciation on Investments: As of October 31, 2015, the costs of investments for federal income tax purposes and accumulated net unrealized appreciation/(depreciation) on investments were as follows: Gross Cost of Net Appreciation Investments for Appreciation Gross Depreciation of Foreign Income Tax (excess of value (excess of tax cost Currency and Net Unrealized over value) over tax cost) Purposes Derivatives Appreciation/(Depreciation) Fund ALPS | Alerian MLP Infrastructure Index Fund $ 11,060 $ (6,368,130) $ ALPS | CoreCommodity Management CompleteCommodities® Strategy Fund 7,331,351 (41,414,781) ALPS | Kotak India Growth Fund 1,705,497 (1,430,230) ALPS | Red Rocks Listed Private Equity Fund 43,772,950 (25,574,426) ALPS | Sterling ETF Tactical Rotation Fund – (33,839) ALPS | Westport Resources Hedged High 190,564 (1,946,192) Income Fund ALPS | WMC Research Value Fund 10,970,611 (4,361,394) Clough China Fund 9,421,116 (2,122,471) RiverFront Conservative Income Builder Fund 169,726 (128,152) RiverFront Dynamic Equity Income Fund 3,242,813 (1,377,293) RiverFront Global Allocation Fund 2,186,787 (735,401) RiverFront Global Growth Fund 5,333,055 (1,203,075) RiverFront Moderate Growth & Income Fund 4,801,817 (1,766,119) – $ 1,823,803 (1,076) (30,387) – (32,259,627) 274,190 18,168,137 (33,839) (87,108) 55,456 (347) (1,842,736) 6,664,673 7,298,298 – – – – – (6,357,070) 41,574 1,865,520 1,451,386 4,129,980 3,035,698 $ 33,054,004 426,565,477 16,055,283 485,484,735 34,764,049 21,658,794 90,769,994 61,328,774 12,271,142 75,216,522 44,203,724 76,743,234 138,766,592 Deferred Tax Asset/Liability for ALPS | Alerian MLP Infrastructure Index Fund Since the ALPS | Alerian MLP Infrastructure Index Fund (the “Fund” for purposes of this section) will be subject to taxation on its taxable income, the NAV of Fund shares will also be reduced by the accrual of any deferred tax liabilities. The Index however is calculated without any adjustments for taxes. As a result, the Fund’s after tax performance could differ significantly from the Index even if the pretax performance of the Fund and the performance of the Index are closely correlated. Cash distributions from MLPs to the ALPS | Alerian MLP Infrastructure Index Fund that exceed such Fund’s allocable share of such MLP’s net taxable income are considered a taxâ€deferred return of capital that will reduce the Fund’s adjusted tax basis in the equity securities of the MLP. These reductions in such Fund’s adjusted tax basis in the MLP equity securities will increase the amount of gain (or decrease the amount of loss) recognized by the Fund on a subsequent sale of the securities. The Fund will accrue deferred income taxes for any future tax liability associated with (i) that portion of MLP distributions considered to be a taxâ€deferred return of capital as well as (ii) capital appreciation of its investments. Upon the sale of an MLP security, the Fund may be liable for previously deferred taxes. The Fund will rely to some extent on information provided by the MLPs, which is not necessarily timely, to estimate deferred tax liability for purposes of financial statement reporting and determining the NAV. From time to time, ALPS Advisors, Inc. will modify the estimates or assumptions related to the Fund’s deferred tax liability as new information becomes available. The Fund will generally compute deferred income taxes based on the marginal regular federal income tax rate applicable to corporations and an assumed rate attributable to state taxes. The Fund’s income tax expense/(benefit) consists of the following: October 31, 2015 Current Deferred Total Federal $ $ (3,631,518) $ (3,637,172) (5,654) State 510 (213,335) (212,825) Valuation Allowance – 2,724,889 2,724,889 Total tax expense $ (1,119,964) $ (1,125,108) (5,144) $ 180 | October 31, 2015 . Notes to Financial Statements October 31, 2015 October 31, 2014 Federal State Total tax expense $ $ Current 6,396 262 6,658 $ $ Deferred 421,789 19,945 441,734 $ $ Total 428,185 20,207 448,392 Deferred income taxes reflect the net tax effect of temporary differences between the carrying amounts of assets and liabilities for financial reporting and tax purposes. Components of the Fund’s deferred tax assets and liabilities are as follows: As of October 31, 2015 Nonâ€current Deferred tax assets: Net unrealized loss on investment securities $ 2,288,555 Net Operating Loss Carryforward 435,186 Other 1,147 Less Valuation Allowance (2,724,888) Net Deferred tax asset $ – As of October 31, 2014 Nonâ€current Deferred tax liabilities: Net unrealized gain on investment securities $ (1,121,336) Other 1,370 Net Deferred tax liability $ (1,119,966) The net operating loss carryforward is available to offset future taxable income. The net operating loss can be carried forward for 20 years and, accordingly, would begin to expire as of October 31, 2035. The Fund has net operating loss carryforwards for federal income tax purposes as follows: Year-Ended Amount Expiration 10/31/2015 $1,208,851 10/31/2035 The Fund reviews the recoverability of its deferred tax assets based upon the weight of available evidence. When assessing the recoverability of its deferred tax assets, significant weight was given to the effects of potential future realized and unrealized gains on investments and the period over which these deferred tax assets can be realized. Any capital losses that may be generated by the Fund are eligible to be carried back up to three years and can be carried forward for five years to offset capital gains recognized by the fund in those years. Net operating losses that may be generated by the Fund are eligible to be carried back up to two years and can be carried forward for 20 years to offset income generated by the Fund in those years. Currently, the Fund intends to waive its carry back period for any net operating loss generated for the year ended October 31, 2015. To the extent the Fund has a deferred tax asset, consideration is given to whether or not a valuation allowance, which would offset the value of some or all of the deferred tax asset balance, is required. A valuation allowance is required if based on the evaluation criterion provided by Accounting Standards Codification (“ASC”) 740, Income Taxes (ASC 740) it is more likely than not that some portion, or all, of the deferred tax asset will not be realized. The factors considered in assessing the Fund’s valuation allowance include: the nature, frequency and severity of current and cumulative losses, the duration of the statutory carryforward periods and the associated risks that operating and capital loss carryforwards may expire unutilized. From time to time, as new information becomes available, the Fund will modify its estimates or assumptions regarding the deferred tax liability or asset. As of the balance sheet date, Fund Management has assessed that it is not more likely than not that a portion of the deferred tax assets will be realized through future taxable income of the appropriate character. Accordingly, a valuation allowance has been established for that portion of the Fund’s deferred tax assets. The Fund will continue to assess the need for a valuation allowance in the future. Significant increases in the fair value of its portfolio of investments or other factors may change the Fund’s assessment of the recoverability of these assets and may result in the removal of the valuation allowance against all or a portion of the Fund’s gross deferred tax assets. 181 | October 31, 2015 . Notes to Financial Statements October 31, 2015 Total income tax benefit (current and deferred) differs from the amount computed by applying the federal statutory income tax rate of 34% to net investment and realized and unrealized gain/(losses) on investment before taxes as follows: For the Year Ended October 31, 2015 Income tax expense at statutory rate $ (3,631,596) State income taxes (net of federal benefit) (213,624) Permanent differences, net (4,388) Change in estimated state referral rate 285 Other (674) Valuation Allowance 2,724,888 Net income tax expense/(benefit) $ (1,125,109) For the Fiscal Period Ended October 31, 2014 Income tax expense at statutory rate $ 431,788 State income taxes (net of federal benefit) 24,966 Change in estimated state referral rate (5,005) Other (3,357) Net income tax expense/(benefit) $ 448,392 The following is a tabular reconciliation of the total amounts of unrecognized tax benefits: October 31, 2015 Unrecognized tax benefit †Beginning $ – Gross increases †tax positions in prior period – Gross decreases †tax positions in prior period – Gross increases †tax positions in current period – Settlement – Lapse of statute of limitations – Net income tax expense $ – October 31, 2014 Unrecognized tax benefit †Beginning $ – Gross increases †tax positions in prior period – Gross decreases †tax positions in prior period – Gross increases †tax positions in current period – Settlement – Lapse of statute of limitations – Net income tax expense – $ The Fund recognizes interest accrued related to unrecognized tax benefits and penalties as income tax expense. The Fund had no accrued penalties or interest for the Fiscal Year Ended October 31, 2015. The Fund recognizes the tax benefits of uncertain tax positions only where the position is “more likely than not” to be sustained assuming examination by tax authorities. Management has analyzed the Fund’s tax positions, and has concluded that no liability for unrecognized tax benefits should be recorded related to uncertain tax positions taken on U.S. tax returns and state tax returns filed since inception of the fund. No U.S. federal or state income tax returns are currently under examination. Due to the nature of the Fund’s investments, the Fund may be required to file income tax returns in several states. The Fund is not aware of any tax positions for which it is reasonably possible that the total amounts of unrecognized tax benefits will change materially in the next 12 months. 182 | October 31, 2015 . Notes to Financial Statements October 31, 2015 5. SECURITIES TRANSACTIONS Purchases and sales of securities, excluding shortâ€term securities and U.S. Government Obligations during the Fiscal Year Ended October 31, 2015 were as follows: Proceeds from Sales of Fund Purchases of Securities Securities ALPS | Alerian MLP Infrastructure Index Fund $ 29,315,988 $ 15,177,835 ALPS | CoreCommodity Management CompleteCommodities® Strategy Fund(a) 148,152,892 122,993,502 ALPS | Kotak India Growth Fund(b) 11,516,335 10,267,459 ALPS | Red Rocks Listed Private Equity Fund 189,945,677 181,664,686 ALPS | Sterling ETF Tactical Rotation Fund 147,057,748 123,285,846 ALPS | Westport Resources Hedged High Income Fund 18,143,515 20,347,517 114,981,842 123,026,768 ALPS | WMC Research Value Fund Clough China Fund 157,962,270 157,184,149 RiverFront Conservative Income Builder Fund 18,931,891 15,803,880 RiverFront Dynamic Equity Income Fund 61,736,089 52,180,237 RiverFront Global Allocation Fund 36,107,303 27,345,706 RiverFront Global Growth Fund 60,097,665 53,819,814 RiverFront Moderate Growth & Income Fund 154,258,601 150,026,561 Purchases and sales of U.S. Government Obligations during the Fiscal Year Ended October 31, 2015 were as follows: Proceeds from Sales of Fund Purchases of Securities Securities ALPS | CoreCommodity Management CompleteCommodities® Strategy Fund $ 106,275,664 $ 72,269,360 ALPS | Westport Resources Hedged High Income Fund 9,575 9,971 (a) Purchases and sales for ALPS | CoreCommodity Management CompleteCommodities® Strategy Fund are consolidated and include the balances of CoreCommodity Management Cayman Commodity Fund, Ltd. (wholly owned subsidiary). (b) Purchases and sales for ALPS | Kotak India Growth Fund are consolidated and include the balances of Kotak Mauritius Portfolio (wholly owned subsidiary). 6. BENEFICIAL INTEREST TRANSACTIONS Shares redeemed within 90 days of purchase for ALPS | Red Rocks Listed Private Equity Fund and 30 days of purchase for ALPS | CoreCommodity Management CompleteCommodities® Strategy Fund, ALPS | Kotak India Growth Fund, and Clough China Fund, may incur a 2% shortâ€term redemption fee deducted from the redemption amount. In addition, shares redeemed within 30 days of purchase for the ALPS | Sterling ETF Tactical Rotation Fund may incur a 1% shortâ€term redemption fee. The ALPS | Alerian MLP Infrastructure Index Fund, ALPS | Westport Resources Hedged High Income Fund, ALPS | WMC Research Value Fund, RiverFront Conservative Income Builder Fund, RiverFront Dynamic Equity Income Fund, RiverFront Global Allocation Fund, RiverFront Global Growth Fund, and RiverFront Moderate Growth & Income Fund shares do not incur redemption fees. 183 | October 31, 2015 . Notes to Financial Statements October 31, 2015 For the Fiscal Year Ended October 31, 2015, the amounts listed below were retained by the Funds. These amounts are reflected in “Shares redeemed” in the Statements of Changes in Net Assets. Redemption Fee Retained For the Fiscal For the Year Ended Periods Ended For the Year Ended Fund October 31, 2015 October 31, 2014 April 30, 2014 ALPS | CoreCommodity Management CompleteCommodities® Strategy Fund †Class A $ 8,433 $ 2,815 $ 28,999 ALPS | CoreCommodity Management CompleteCommodities® Strategy Fund †Class C 106 19 55 ALPS | CoreCommodity Management CompleteCommodities® Strategy Fund †Class I 77,754 5,450 15,328 ALPS | Kotak India Growth Fund †Class A 684 346 1,100 ALPS | Kotak India Growth Fund †Class C – 142 – ALPS | Kotak India Growth Fund †Class I 10,529 402 – ALPS | Red Rocks Listed Private Equity Fund †Class A 28,724 23,046 15,705 ALPS | Red Rocks Listed Private Equity Fund †Class C 5,076 1,464 472 ALPS | Red Rocks Listed Private Equity Fund †Class I 54,952 37,095 46,273 ALPS | Red Rocks Listed Private Equity Fund †Class R 60 1,022 – 98 – ALPS | Sterling ETF Tactical Rotation Fund †Class A 401 ALPS | Sterling ETF Tactical Rotation Fund †Class I 348 – – Clough China Fund †Class A 2,852 1,558 9,336 Clough China Fund †Class C 56 12 145 Clough China Fund †Class I 138,993 905 7,776 Transactions in shares of capital stock were as follows: ALPS | Alerian MLP Infrastructure Index Fund For the For the For the Fiscal Year Ended Year Ended Period Ended April 30, 2014 October 31, 2015 October 31, 2014(a) Class A Shares sold 1,259,572 288,018 840,863 Dividends reinvested 123,898 37,693 22,014 Shares redeemed (427,258) (119,831) (214,096) Net increase in shares outstanding 956,212 205,880 648,781 Class C Shares sold 818,801 301,736 307,622 Dividends reinvested 80,720 15,834 5,355 Shares redeemed (402,241) (21,671) (56,783) Net increase in shares outstanding 497,280 295,899 256,194 Class I Shares sold 735,624 448,719 149,751 Dividends reinvested 48,740 19,256 10,785 Shares redeemed (786,515) (15,903) (229,611) Net increase/(decrease) in shares outstanding (2,151) 452,072 (69,075) 184 | October 31, 2015 . Notes to Financial Statements October 31, 2015 Class A Shares sold Dividends reinvested Shares redeemed Net increase/(decrease) in shares outstanding Class C Shares sold Dividends reinvested Shares redeemed Net increase/(decrease) in shares outstanding Class I Shares sold Dividends reinvested Shares redeemed Net increase in shares outstanding Class A Shares sold Dividends reinvested Shares redeemed Net increase/(decrease) in shares outstanding Class C Shares sold Dividends reinvested Shares redeemed Net increase/(decrease) in shares outstanding Class I Shares sold Dividends reinvested Shares redeemed Net increase/(decrease) in shares outstanding ALPS | CoreCommodity Management CompleteCommodities® Strategy Fund For the For the For the Fiscal Year Ended Year Ended Period Ended April 30, 2014 October 31, 2015 October 31, 2014(a) 2,262,826 2,009,784 7,651,538 – – – (2,238,826) (8,184,764) (7,315,182) 336,356 24,000 (6,174,980) 518,739 325,208 566,736 – – – (659,903) (297,385) (1,145,365) (141,164) (578,629) 27,823 38,810,785 21,543,668 22,908,918 209,271 – – (29,430,269) (4,926,582) (16,450,540) 9,589,787 16,617,086 6,458,378 ALPS | Kotak India Growth Fund For the For the For the Fiscal Year Ended Year Ended Period Ended April 30, 2014 October 31, 2015 October 31, 2014(a) 275,925 237,553 276,089 – – 17,640 (242,799) (339,968) (248,518) (102,415) 50,766 27,571 81,887 46,251 41,102 – – 4,439 (41,866) (19,484) (50,514) (9,412) 44,460 26,767 356,462 526,457 36,244 – 26,939 964 (385,524) (46,610) (68,589) (2,123) 479,847 (31,381) 185 | October 31, 2015 . Notes to Financial Statements October 31, 2015 Class A Shares sold Dividends reinvested Shares redeemed Net increase/(decrease) in shares outstanding Class C Shares sold Dividends reinvested Shares redeemed Net increase in shares outstanding Class I Shares sold Dividends reinvested Shares redeemed Net increase in shares outstanding Class R Shares sold Dividends reinvested Shares redeemed Net increase in shares outstanding ALPS | Red Rocks Listed Private Equity Fund For the For the For the Fiscal Year Ended Year Ended Period Ended October 31, 2015 October 31, 2014(a) April 30, 2014 10,981,499 8,719,848 15,978,340 1,033,219 – 1,603,325 (14,218,098) (7,255,050) (5,633,930) (2,203,380) 1,464,798 11,947,735 870,902 1,066,330 1,074,269 – 64,156 55,528 (655,615) (179,224) (88,700) 279,443 887,106 1,041,097 18,816,997 14,082,200 14,171,110 659,785 – 657,933 (14,723,024) (5,365,813) (8,859,864) 4,753,758 8,716,387 5,969,179 439,998 75,154 56,083 – 7,077 3,972 (80,417) (13,616) (8,484) 366,658 61,538 51,570 Class A Shares sold Dividends reinvested Shares redeemed Net increase in shares outstanding Class C Shares sold Dividends reinvested Shares redeemed Net increase in shares outstanding Class I Shares sold Dividends reinvested Shares redeemed Net increase in shares outstanding 186 | October 31, 2015 ALPS | Sterling ETF Tactical Rotation Fund For the Period For the July 1, 2014 Year Ended (Commencement) to October 31, 2015 October 31, 2014 1,594,176 536,342 – 4,852 (633,557) (8,719) 965,471 527,623 248,835 54,102 336 – (35,100) (816) 214,071 53,286 1,466,642 747,556 – 5,410 (323,715) (816) 1,148,337 735,136 . Notes to Financial Statements October 31, 2015 Class A Shares sold Dividends reinvested Shares redeemed Net increase/(decrease) in shares outstanding Class C Shares sold Dividends reinvested Shares redeemed Net increase/(decrease) in shares outstanding Class I Shares sold Dividends reinvested Shares redeemed Net increase in shares outstanding Class A Shares sold Dividends reinvested Shares redeemed Net increase/(decrease) in shares outstanding Class C Shares sold Dividends reinvested Shares redeemed Net increase in shares outstanding Class I Shares sold Dividends reinvested Shares redeemed Net increase/(decrease) in shares outstanding ALPS | Westport Resources Hedged High Income Fund For the Period For the January 1, 2014 Year Ended (Commencement) to October 31, 2015 October 31, 2014 64,145 434,199 18,525 8,382 (170,579) (17,428) (87,909) 425,153 – 171,830 6,413 3,301 (88,926) (14,038) (82,513) 161,093 1,999,490 703,861 119,016 44,725 (697,239) (124,519) 1,919,696 125,638 ALPS | WMC Research Value Fund For the For the For the Fiscal Year Ended Year Ended Period Ended April 30, 2014 October 31, 2015 October 31, 2014(a) 155,776 222,748 12,637 485,238 – 100,951 (590,531) (212,255) (381,282) (199,618) (57,583) 50,483 142,521 9,584 2,541 1,762 – 187 (88,229) – (1,585) 56,054 9,584 1,143 278,507 139,366 475,904 380,975 – 85,611 (605,101) (423,706) (751,779) (284,340) (190,264) 54,381 187 | October 31, 2015 . Notes to Financial Statements October 31, 2015 Class A Shares sold Dividends reinvested Shares redeemed Net decrease in shares outstanding Class C Shares sold Dividends reinvested Shares redeemed Net decrease in shares outstanding Class I Shares sold Dividends reinvested Shares redeemed Net increase in shares outstanding Class A Shares sold Dividends reinvested Shares redeemed Net increase/(decrease) in shares outstanding Class C Shares sold Dividends reinvested Shares redeemed Net increase in shares outstanding Class I Shares sold Dividends reinvested Shares redeemed Net increase/(decrease) in shares outstanding For the Year Ended October 31, 2015 388,837 38,495 (563,454) (136,122) 170,382 11,566 (194,090) (12,142) 1,506,104 45,342 (1,521,537) 29,909 Clough China Fund For the Fiscal Period Ended October 31, 2014(a) 146,054 – (351,151) (205,097) 40,370 – (71,486) (31,116) 356,849 – (275,489) 81,360 For the Year Ended April 30, 2014 620,113 17,364 (658,438) (20,961) 192,333 983 (239,921) (46,605) 791,750 7,137 (404,998) 393,889 RiverFront Conservative Income Builder Fund For the For the For the Fiscal Year Ended Year Ended Period Ended October 31, 2015 October 31, 2014(a) April 30, 2014 68,088 20,788 51,708 2,235 339 827 (71,287) (22,586) (8,730) (1,459) (964) 43,805 487,979 113,010 237,894 14,535 1,180 6,490 (136,754) (30,896) (78,476) 365,760 165,908 83,294 168,227 170,292 188,828 7,413 1,236 3,830 (229,291) (36,589) (132,582) (53,651) 134,939 60,076 188 | October 31, 2015 . Notes to Financial Statements October 31, 2015 Class A Shares sold Dividends reinvested Shares redeemed Net increase in shares outstanding Class C Shares sold Dividends reinvested Shares redeemed Net increase in shares outstanding Class I Shares sold Dividends reinvested Shares redeemed Net increase in shares outstanding Class A Shares sold Dividends reinvested Shares redeemed Net increase/(decrease) in shares outstanding Class C Shares sold Dividends reinvested Shares redeemed Net increase in shares outstanding Class I Shares sold Dividends reinvested Shares redeemed Net increase in shares outstanding RiverFront Dynamic Equity Income Fund For the For the For the Fiscal Year Ended Year Ended Period Ended October 31, 2015 October 31, 2014(a) April 30, 2014 486,948 298,200 601,943 68,595 7,788 36,711 (308,287) (173,465) (113,937) 247,256 132,523 524,717 878,269 543,597 859,238 114,440 6,068 65,716 (522,786) (232,754) (241,047) 469,923 316,911 683,907 639,114 268,460 794,021 79,298 10,588 54,114 (517,459) (83,369) (291,301) 200,953 195,679 556,834 RiverFront Global Allocation Fund For the For the For the Fiscal Year Ended Year Ended Period Ended October 31, 2015 October 31, 2014(a) April 30, 2014 187,353 145,922 53,535 – 54,813 21,838 (186,115) (117,670) (157,419) (64,135) 56,051 10,341 445,383 131,314 460,035 – 94,535 26,360 (253,151) (131,094) (164,939) 286,767 321,456 220 732,674 247,340 357,419 – 91,727 24,973 (259,448) (74,901) (126,577) 564,953 172,439 255,815 189 | October 31, 2015 . Notes to Financial Statements October 31, 2015 Class A Shares sold Dividends reinvested Shares redeemed Net increase in shares outstanding Class C Shares sold Dividends reinvested Shares redeemed Net increase/(decrease) in shares outstanding Class I Shares sold Dividends reinvested Shares redeemed Net increase in shares outstanding Class L Shares sold Dividends reinvested Shares redeemed Net increase/(decrease) in shares outstanding Investor Class Shares sold Dividends reinvested Shares redeemed Net decrease in shares outstanding Class A Shares sold Dividends reinvested Shares redeemed Net increase/(decrease) in shares outstanding Class C Shares sold Dividends reinvested Shares redeemed Net increase in shares outstanding Class I Shares sold Dividends reinvested Shares redeemed Net increase in shares outstanding RiverFront Global Growth Fund For the For the For the Fiscal Year Ended Year Ended Period Ended October 31, 2015 October 31, 2014(a) April 30, 2014 461,853 274,216 711,148 126,977 – 73,149 (357,314) (270,395) (279,502) 231,516 504,795 3,821 299,191 332,183 71,276 – 86,034 60,174 (193,028) (83,298) (114,858) 192,197 (12,022) 277,499 539,263 141,152 312,894 – 96,480 75,213 (325,705) (54,618) (135,371) 310,038 252,736 86,534 381,064 208,438 91,284 186,091 – 156,519 (278,706) (157,229) (297,731) 288,449 (65,945) 67,226 18,530 4,306 17,783 – 54,628 52,483 (79,199) (49,732) (138,604) (6,041) (45,426) (68,338) RiverFront Moderate Growth & Income Fund For the For the For the Fiscal Year Ended Year Ended Period Ended October 31, 2015 October 31, 2014(a) April 30, 2014 366,429 346,863 929,036 148,964 131,056 15,435 (660,624) (679,187) (964,205) (145,231) (316,889) 95,887 1,473,735 637,442 1,598,320 331,196 231,095 18,215 (1,084,631) (442,477) (1,075,044) 720,300 213,180 754,371 1,228,437 536,778 1,406,353 248,980 171,628 26,841 (905,092) (255,089) (642,198) 572,325 308,530 935,783 (a) Effective May 1, 2014, the Board approved changing the fiscal year-end of the Funds from April 30 to October 31. 190 | October 31, 2015 . Notes to Financial Statements October 31, 2015 7. AFFILIATED COMPANIES Funds may invest in certain securities that are considered securities issued by affiliated companies. As defined by the Investment Company Act of 1940, an affiliated person, including an affiliated company, is one in which a Fund owns 5% or more of the outstanding voting securities, or a company which is under common ownership or control with the Fund. The purchases, sales, dividend income, capital gains, return of capital distributions received, shares and value of investments in affiliated companies for the Fiscal Year Ended October 31, 2015 were as follows: RiverFront Conservative Income Builder Fund Security Name RiverFront Strategic Income Fund Share Balance November 1, 2014 34,106 Market Value Dividend Realized October 31, Income Loss 2015 $ 32,199 $ (7,360) $ 1,160,199 $ 32,199 $ (7,360) $ 1,160,199 Share Balance October 31, 2015 215,714 Market Value Dividend Realized October 31, Income Loss 2015 $ 181,900 $ (30,319) $ 5,315,193 $ 181,900 $ (30,319) $ 5,315,193 Sales 60,966 Share Balance October 31, 2015 39,386 Market Value Dividend Realized October 31, Income Loss 2015 $ 51,007 $ (33,482) $ 970,471 $ 51,007 $ (33,482) $ 970,471 Sales 48,502 Purchases 24,800 Share Balance October 31, 2015 47,086 Share Balance October 31, 2015 562,358 Market Value Dividend Realized October 31, Income Loss 2015 $ 495,767 $ (38,996) $13,856,501 $ 495,767 $ (38,996) $13,856,501 Sales 11,820 RiverFront Dynamic Equity Income Fund Security Name RiverFront Strategic Income Fund Share Balance November 1, 2014 142,382 Purchases 122,185 Sales 48,853 RiverFront Global Allocation Fund Security Name RiverFront Strategic Income Fund Share Balance November 1, 2014 18,764 Purchases 81,588 RiverFront Moderate Growth & Income Fund Security Name RiverFront Strategic Income Fund Share Balance November 1, 2014 489,954 Purchases 120,906 191 | October 31, 2015 . Notes to Financial Statements October 31, 2015 8. MANAGEMENT AND RELATEDâ€PARTY TRANSACTIONS ALPS Advisors, Inc. (“AAI”), subject to the authority of the Board, is responsible for the overall management of the Funds listed below. AAI has delegated daily management of the Funds listed below to the corresponding Subâ€Advisor(s) listed in the table below. Each Subâ€Advisor manages the investments of the Fund in accordance with its investment objective, policies and limitations and investment guidelines established jointly by AAI and the Board. Fund ALPS | CoreCommodity Management CompleteCommodities® Strategy Fund ALPS | Kotak India Growth Fund ALPS | Red Rocks Listed Private Equity Fund ALPS | Sterling ETF Tactical Rotation Fund ALPS | WMC Research Value Fund Clough China Fund RiverFront Conservative Income Builder Fund RiverFront Dynamic Equity Income Fund RiverFront Global Allocation Fund RiverFront Global Growth Fund RiverFront Moderate Growth & Income Fund Sub-Advisor(s) CoreCommodity Management, LLC Kotak Mahindra (UK) Limited Red Rocks Capital LLC(a) Sterling Global Strategies LLC Wellington Management Company, LLP Clough Capital Partners, LP RiverFront Investment Group, LLC RiverFront Investment Group, LLC RiverFront Investment Group, LLC RiverFront Investment Group, LLC RiverFront Investment Group, LLC (a) On July 31, 2015, Red Rocks Capital LLC was acquired by ALPS Advisers, Inc. AAI and Westport Resources Management, Inc. (“Westport Resources”) (“collectively the “Westport Coâ€Advisors”), subject to the authority of the Board, serve as coâ€investment advisors for the ALPS | Westport Resources Hedged High Income Fund (the “Westport Fund”). AAI provides fund administration services and other portfolio support services and compliance monitoring for the Westport Fund. Westport Resources manages the Fund’s investment program and selects, subject to the approval of the Board, subâ€advisors to the Fund. Westport Resources and the Trust have entered into subâ€advisory agreements with respect to the Fund with three Subâ€Advisors (the “Westport Subâ€Advisors”), Concise Capital Management, LP, Amundi Smith Breeden LLC, and Sound Point Capital Management, L.P., to manage a portion of the Fund’s assets. Pursuant to the Investment Advisory Agreement (the “Advisory Agreement”), the Funds listed below pay AAI an annual management fee which is based on each Fund’s average daily net assets. The management fee is paid on a monthly basis. The following table reflects the Funds’ contractual management fee rates (expressed as an annual rate). Fund ALPS | Alerian MLP Infrastructure Index Fund ALPS | CoreCommodity Management CompleteCommodities® Strategy Fund ALPS | Kotak India Growth Fund ALPS | Red Rocks Listed Private Equity Fund ALPS | Sterling ETF Tactical Rotation Fund ALPS | WMC Research Value Fund Clough China Fund RiverFront Conservative Income Builder Fund RiverFront Dynamic Equity Income Fund RiverFront Global Allocation Fund RiverFront Global Growth Fund RiverFront Moderate Growth & Income Fund Contractual Management Fee 0.70% 0.85% 1.25% 0.85% 0.95% 0.95%(a) 1.35% 0.85% 0.85% 0.85% 0.85% 0.85% (a) The contractual management fee is 0.95% for the first $250 million of net assets, 0.85% for the next $250 million of net assets, and 0.75% for net assets in excess of $500 million. Pursuant to the Investment Advisory Agreement between the Westport Fund and AAI, the Westport Fund pays AAI an annual management fee of the greater of (i) 0.20%, based on the Westport Fund’s average daily net assets, or (ii) $150,000. Effective as of July 1, 2015, AAI has agreed voluntarily to waive the $150,000 minimum portion of its annual management fee for the Fund. Pursuant to the Investment Advisory Agreement between the Westport Fund and Westport Resources, the Westport Fund pays Westport Resources an annual management fee of 1.50% based on 192 | October 31, 2015 . Notes to Financial Statements October 31, 2015 the Westport Fund’s average daily net assets. The management fee for each Advisory Agreement is paid on a monthly basis. The Westport Sub†Advisors will be engaged to manage the investments of the Westport Fund according to the its investment objective, policies and limitations and any investment guidelines established by the Westport Coâ€Advisors and the Board. Westport Resources will pay the Westport Subâ€Advisors out of the advisory fee paid to it pursuant to the Westport Resources Advisory Agreement. Pursuant to an Investment Subâ€advisory Agreement, AAI pays the Subâ€Advisors of the Funds listed below an annual subâ€advisory management fee which is based on each Fund’s average daily assets. AAI is required to pay all fees due to each Subâ€Advisor out of the management fee AAI receives from each Fund listed below. The following table reflects the Funds’ contractual subâ€advisory fee rates. Fund ALPS | CoreCommodity Management CompleteCommodities® Strategy Fund ALPS | Kotak India Growth Fund ALPS | Red Rocks Listed Private Equity Fund ALPS | Sterling ETF Tactical Rotation Fund ALPS | WMC Research Value Fund Clough China Fund RiverFront Conservative Income Builder Fund RiverFront Dynamic Equity Income Fund RiverFront Global Allocation Fund RiverFront Global Growth Fund RiverFront Moderate Growth & Income Fund Average Daily Net Assets of the Fund All Asset Levels First $50 Million Over $50 Million All Asset Levels All Asset Levels First $250 Million $250 Million †$500 Million Over $500 Million All Asset Levels All Asset Levels All Asset Levels All Asset Levels All Asset Levels All Asset Levels Contractual Sub-Advisory Fee 0.75% 1.15% 1.05% 0.57% 0.60% 0.50% 0.40% 0.30% 0.90% 0.60% 0.60% 0.60% 0.60% 0.60% The Advisor(s) and each Subâ€Advisor have contractually agreed to limit the amount of each Fund’s total annual expenses, exclusive of distribution and service (12bâ€1) fees (except Clough China Class A and Class C shares), shareholder service fees (except Clough China Class A shares and Class C shares), acquired fund fees and expenses, brokerage expenses, interest expense, taxes and extraordinary expenses, that exceed the following annual rates below. These agreements are reevaluated on an annual basis based on the terms disclosed below. The ALPS | CoreCommodity Management CompleteCommodities® Strategy Fund has entered into a separate advisory agreement (the “Subsidiary Advisory Agreement”) with its subsidiary, the Subsidiary’s investment adviser and the Fund’s investment adviser, for the management of the Subsidiary’s portfolio pursuant to which the Subsidiary is obligated to pay the Adviser a management fee at the same rate that the Fund pays the Adviser for investment advisory services provided to the Fund. The Adviser has agreed to waive the advisory fee it receives from the Fund in an amount equal to the management fee paid by the Subsidiary. This waiver may not be terminated or modified without the consent of the Board. For the period ending 10.31.15 this amount equaled 668,490. Term of Expense Fund Class A Class C Class I Class Inv Class L Class R Limit Agreement 8/27/2014 – 8/31/2015 & ALPS | Alerian MLP Infrastructure Index Fund 0.85% 0.85% 0.85% N/A N/A N/A 12/9/2014 – 2/29/2016 ALPS | CoreCommodity Management 9/11/2013 – 9/11/2015 & CompleteCommodities® Strategy Fund 1.05% 1.05% 1.15% N/A N/A N/A 2/28/2015 – 2/29/2016 9/1/2014 – 8/31/2015 & ALPS | Kotak India Growth Fund 1.60% 1.60% 1.60% N/A N/A N/A 2/28/2015 – 2/29/2016 9/1/2014 – 8/31/2015 & ALPS | Red Rocks Listed Private Equity Fund 1.25% 1.25% 1.25% N/A N/A 1.25% 7/31/2015 – 2/28/2017 ALPS | Sterling ETF Tactical Rotation Fund 1.15% 1.15% 1.15% N/A N/A N/A 6/30/2014 – 2/29/2016 ALPS | Westport Resources Hedged High 12/19/2013 – 8/31/2015 & Income Fund 1.99% 1.99% 1.99% N/A N/A N/A 2/28/2015 – 2/29/2016 9/1/2014 – 8/31/2015 & ALPS | WMC Research Value Fund 1.15% 1.15% 1.15% N/A N/A N/A 2/28/2015 – 2/29/2016 9/1/2014 – 8/31/2015 & Clough China Fund 1.95% 2.70% 1.70% N/A N/A N/A 2/28/2015 – 2/29/2016 193 | October 31, 2015 . Notes to Financial Statements October 31, 2015 Fund Class A Class C Class I Class Inv Class L Class R RiverFront Conservative Income Builder Fund 0.90% 0.90% 0.90% N/A N/A N/A RiverFront Dynamic Equity Income Fund 0.90% 0.90% 0.90% N/A N/A N/A RiverFront Global Allocation Fund 0.90% 0.90% 0.90% N/A N/A N/A RiverFront Global Growth Fund 0.90% 0.90% 0.90% 0.90% 0.90% N/A Term of Expense Limit Agreement 9/1/2014 – 8/31/2015 & 2/28/2015 – 2/29/2016 9/1/2014 – 8/31/2015 & 2/28/2015 – 2/29/2016 9/1/2014 – 8/31/2015 & 2/28/2015 – 2/29/2016 9/1/2014 – 8/31/2015 & 2/28/2015 – 2/29/2016 9/1/2014 – 8/31/2015 & 2/28/2015 – 2/29/2016 RiverFront Moderate Growth & Income Fund 0.90% 0.90% 0.90% N/A N/A N/A The Advisor(s) and each Subâ€Advisor are permitted to recover expenses they have waived or reimbursed, on a classâ€byâ€class basis, through the agreements described above to the extent that expenses in later periods fall below the annual limits set forth in these agreements. Clough China Fund is not obligated to pay any such waived or reimbursed fees and expenses more than one year after the end of the fiscal year in which the fees or expenses were waived or reimbursed. The ALPS | Alerian MLP Infrastructure Index Fund, ALPS | CoreCommodity Management CompleteCommodities® Strategy Fund, ALPS | Kotak India Growth Fund, ALPS | Red Rocks Listed Private Equity Fund, ALPS | Sterling ETF Tactical Rotation Fund, ALPS | Westport Resources Hedged High Income, ALPS | WMC Research Value Fund, RiverFront Conservative Income Builder Fund, RiverFront Global Growth Fund, RiverFront Dynamic Equity Income Fund, RiverFront Global Allocation Fund and RiverFront Moderate Growth & Income Fund are not obligated to pay any such waived or reimbursed fees and expenses more than three years after the end of the fiscal year in which the fees or expenses were waived or reimbursed. At October 31, 2015, the Advisor(s) and Subâ€Advisor may seek reimbursement of previously waived and reimbursed fees as follows: Expires Fund 4/30/16 ALPS | Alerian MLP Infrastructure Index Fund †Class A $ 9,499 ALPS | Alerian MLP Infrastructure Index Fund †Class C 9,045 ALPS | Alerian MLP Infrastructure Index Fund †Class I 36,196 ALPS | CoreCommodity Management CompleteCommodities® Strategy Fund †Class A 91,338 ALPS | CoreCommodity Management CompleteCommodities® Strategy Fund †Class C 17,117 ALPS | CoreCommodity Management 21,636 CompleteCommodities® Strategy Fund †Class I ALPS | Kotak India Growth Fund †Class A 188,194 ALPS | Kotak India Growth Fund †Class C 37,562 ALPS | Kotak India Growth Fund †Class I 121,202 ALPS | Red Rocks Listed Private Equity Fund †Class A N/A ALPS | Red Rocks Listed Private Equity Fund †Class C N/A ALPS | Red Rocks Listed Private Equity Fund †Class I N/A ALPS | Red Rocks Listed Private Equity Fund †Class R N/A ALPS | Sterling ETF Tactical Rotation Fund †Class A N/A ALPS | Sterling ETF Tactical Rotation Fund †Class C N/A ALPS | Sterling ETF Tactical Rotation N/A Fund †Class I Expires 10/31/16 $ Expires 4/30/17 Expires 10/31/17 N/A $ 95,994 $ 48,763 N/A 28,674 24,506 48,448 110,673 N/A 38,321 23,256 34,028 131,801 N/A 55,147 5,093 6,800 158,378 N/A 9,066 1,738 1,837 29,758 N/A N/A N/A N/A 30,311 198,350 38,130 87,957 11,487 81,178 16,958 78,795 86,129 95,360 29,402 150,329 149,563 563,082 122,052 438,283 N/A N/A N/A N/A N/A N/A N/A N/A N/A N/A N/A N/A N/A N/A N/A N/A N/A N/A N/A N/A N/A N/A 15,562 78,926 94,488 N/A N/A 7,752 8,258 16,010 N/A N/A 53,715 86,740 140,455 194 | October 31, 2015 Expires 10/31/18 Total $ 74,027 $ 228,283 . Notes to Financial Statements October 31, 2015 Expires Expires Expires Expires Expires Fund 4/30/16 10/31/16 4/30/17 10/31/17 10/31/18 Total ALPS | Westport Resources Hedged High Income Fund †Class A $ N/A $ N/A $ N/A $ 33,823 $ 34,235 $ 68,058 ALPS | Westport Resources Hedged High Income Fund †Class C N/A N/A N/A 14,345 11,798 26,143 ALPS | Westport Resources Hedged High Income Fund †Class I N/A N/A N/A 188,185 191,137 379,322 ALPS | WMC Research Value Fund †Class A 50,013 N/A 39,957 25,559 51,771 167,300 ALPS | WMC Research Value Fund †Class C 90 N/A 81 74 1,084 1,329 ALPS | WMC Research Value Fund †Class I 36,903 N/A 31,790 18,931 38,056 125,680 Clough China Fund †Class A N/A 10,534 N/A N/A N/A 10,534 Clough China Fund †Class C N/A 9,198 N/A N/A N/A 9,198 Clough China Fund †Class I N/A 30,012 N/A N/A N/A 30,012 RiverFront Conservative Income Builder Fund †Class A 6,224 N/A 14,608 6,814 10,173 37,819 RiverFront Conservative Income Builder 38,763 N/A 50,536 28,317 44,843 162,459 Fund †Class C RiverFront Conservative Income Builder Fund †Class I 21,584 N/A 23,541 11,336 19,129 75,590 RiverFront Dynamic Equity Income Fund †Class A 25,434 N/A 28,302 20,436 36,445 110,617 RiverFront Dynamic Equity Income Fund †Class C 54,152 N/A 55,724 35,936 65,254 211,066 RiverFront Dynamic Equity Income Fund †Class I 29,280 N/A 39,925 24,440 43,549 137,194 RiverFront Global Allocation Fund †Class A 32,881 N/A 31,141 15,480 24,491 103,993 RiverFront Global Allocation Fund †Class C 44,218 N/A 41,816 26,510 44,562 157,106 RiverFront Global Allocation Fund †Class I 21,009 N/A 30,843 21,125 43,041 116,018 RiverFront Global Growth Fund †Class A 22,444 N/A 28,381 20,675 40,534 112,034 RiverFront Global Growth Fund †Class C 23,097 N/A 22,962 13,878 29,002 88,939 RiverFront Global Growth Fund †Class I 18,595 N/A 27,339 29,599 36,381 111,914 RiverFront Global Growth Fund †Class L 78,131 N/A 60,282 15,078 60,547 214,038 RiverFront Global Growth Fund †Investor Class 31,778 N/A 22,272 9,650 17,309 81,009 RiverFront Moderate Growth & Income Fund 49,603 N/A 52,042 25,024 39,744 166,413 RiverFront Moderate Growth & Income Fund 92,197 N/A 96,176 54,689 102,129 345,191 RiverFront Moderate Growth & Income Fund 38,570 N/A 55,830 33,901 67,897 196,198 ALPS Portfolio Solutions Distributor, Inc. (the “Distributor”) acts as the distributor of the Funds’ shares pursuant to a Distribution Agreement with the Trust. Shares are sold on a continuous basis by the Distributor, as agent for the Funds, and the Distributor has agreed to use its best efforts to solicit orders for the sale of Funds’ shares, although it is not obliged to sell any particular amount of shares. The Distributor is not entitled to any compensation for its services. The Distributor is registered as a brokerâ€dealer with the Securities and Exchange Commission. The Funds’ Distributor is also the distributor of the Select Sector SPDR exchange traded funds (the “Underlying Sector ETFs”). As required by exemptive relief obtained by the Underlying Sector ETFs, the Advisor(s) will reimburse any applicable Fund an amount equal to the distribution fee received by the Distributor from the Underlying Sector ETFs attributable to such Fund’s investment in the Underlying Sector ETFs, for so long as the Distributor acts as distributor to such Fund and the Underlying Sector ETFs. Each Fund has adopted a Distribution and Services Plan (the “Plan”) pursuant to Rule 12bâ€1 of the 1940 Act for the Class A, Class C, Class R (ALPS | Red Rocks Listed Private Equity Fund only), and Investor Class (RiverFront Global Growth Fund only) shares. The Plan allows a Fund to use Class A, Class C, Class R and Investor Class assets to pay fees in connection with the distribution and marketing of Class A, Class C, Class R and Investor Class shares and/or the provision of shareholder services to Class A, Class C, Class R and Investor Class shareholders. The Plan permits payment for services in connection with the administration of plans or programs that use Class A, Class C, Class R and Investor Class shares of a Fund, if any, as their funding medium and for related expenses. The Plan permits a Fund to make total payments at an annual rate of up to 0.25% of a Fund’s average daily net assets attributable to its Class A and Investor Class shares, 0.75% of a Fund’s average daily net assets attributable to its Class C shares and 0.50% of the ALPS | Red Rocks Listed Private Equity Fund’s average daily net assets attributable to its Class R shares. 195 | October 31, 2015 . Notes to Financial Statements October 31, 2015 Because these fees are paid out of a Fund’s Class A, Class C, Class R and Investor Class assets, if any, on an ongoing basis, over time they will increase the cost of an investment in Class A, Class C, Class R and Investor Class shares, if any, and Plan fees may cost an investor more than other types of sales charges. The ALPS | Alerian MLP Infrastructure Index Fund Class A and Class C shares, ALPS | Kotak India Growth Fund Class A and Class C shares, ALPS | Red Rocks Listed Private Equity Fund Class A and Class C shares, ALPS | Sterling ETF Tactical Rotation Fund Class A and Class C shares, ALPS | Westport Resources Hedged High Income Fund Class A and Class C shares, ALPS | WMC Research Value Fund Class C shares, Clough China Fund Class C shares, ALPS | CoreCommodity Management CompleteCommodities® Strategy Fund Class A and Class C shares, RiverFront Conservative Income Builder Fund Class C shares, RiverFront Dynamic Equity Income Fund Class C shares, RiverFront Global Allocation Fund Class C shares, RiverFront Global Growth Fund Class C Shares, and the RiverFront Moderate Growth & Income Fund Class C shares have adopted a shareholder services plan (“Shareholder Services Plan”). Under the Shareholder Services Plan for each Fund, the Funds are authorized to pay banks and their affiliates and other institutions, including brokerâ€dealers and Fund affiliates (“Participating Organizations”), an aggregate fee in an amount not to exceed on an annual basis 0.15% for ALPS | Alerian MLP Infrastructure Index Fund Class A shares, ALPS | CoreCommodity Management CompleteCommodities® Strategy Fund Class A shares, ALPS | Kotak India Growth Fund Class A shares, ALPS | Red Rocks Listed Private Equity Fund Class A shares, ALPS | Sterling ETF Tactical Rotation Fund Class A shares, and ALPS | Westport Resources Hedged High Income Fund Class A shares, and not to exceed 0.25% for each Fund’s Class C shares of the average daily net asset value of the Class A shares and Class C shares, respectively, attributable to or held in the name of a Participating Organization for its clients as compensation for providing shareholder service activities, which do not include distribution services, pursuant to an agreement with a Participating Organization. Shareholder Services plan fees are included with distribution and service fees on the Statements of Operations. Certain intermediaries may charge networking, omnibus account or other administrative fees with respect to transactions in shares of each Fund. Transactions may be processed through the National Securities Clearing Corporation or similar systems or processed on a manual basis. These fees generally are paid by the Fund to the Distributor, which uses such fees to reimburse intermediaries. In the event an intermediary receiving payments from the Distributor on behalf of the Fund converts from a networking structure to an omnibus account structure or otherwise experiences increased costs, fees borne by the Fund may increase. Networking fees are shown in the Statements of Operations, if applicable to the Fund. ALPS Fund Services, Inc. (“ALPS”) serves as administrator to the Funds and the Funds have agreed to pay expenses incurred in connection with their administrative activities. Pursuant to an Administrative Agreement, ALPS provides operational services to the Funds including, but not limited to, fund accounting and fund administration and generally assists in the Funds’ operations. Officers of the Trust are employees of ALPS. The Funds’ administration fee is accrued on a daily basis and paid monthly. Administration fees paid by the Funds for the Fiscal Year Ended October 31, 2015 are disclosed in the Statement of Operations. ALPS is reimbursed by the Funds for certain outâ€ofâ€pocket expenses. ALPS | WMC Research Value Fund engaged in cross trades with an affiliate during the Fiscal Year Ended October 31, 2015 pursuant to Rule 17aâ€7 under the 1940 Act. Generally, cross trading is the buying or selling of portfolio securities between funds to which the Adviser serves as the investment adviser. The Board of Trustees previously adopted procedures that apply to transactions between the Funds and its affiliates pursuant to Rule 17aâ€7. At its regularly scheduled meetings, the Board of Trustees reviews such transactions as of the most current calendar quarter for compliance with the requirements set forth by Rule 17aâ€7 and the Funds’ procedures. The Funds’ procedures require that the transactions be a purchase or sale for no consideration other than cash payment against prompt delivery of a security for which market quotations are readily available, and be consistent with the investment policies of each Fund. ALPS | WMC Research Value Fund sold securities to other funds for which the Subâ€Adviser is the investment adviser in the amount of $378 with a realized loss of $14. 9. INDEMNIFICATIONS Under the Trust’s organizational documents, its officers and Trustees are indemnified against certain liability arising out of the performance of their duties to the Trust. Additionally, in the normal course of business, the Trust enters into contracts with service providers that may contain general indemnification clauses which may permit indemnification to the extent permissible under applicable law. The Trust’s maximum exposure under these arrangements is unknown, as this would involve future claims that may be made against the Trust that have not yet occurred. 196 | October 31, 2015 . Report of Independent Registered Public Accounting Firm To the Shareholders and Board of Trustees of Financial Investors Trust: We have audited the accompanying statements of assets and liabilities, including the statements of investments, of ALPS | Alerian MLP Infrastructure Index Fund, ALPS | Red Rocks Listed Private Equity Fund, ALPS | Sterling ETF Tactical Rotation Fund, ALPS | Westport Resources Hedged High Income Fund, ALPS | WMC Research Value Fund (formerly known as ALPS | WMC Disciplined Value Fund), Clough China Fund, RiverFront Conservative Income Builder Fund, RiverFront Global Growth Fund, RiverFront Dynamic Equity Income Fund, RiverFront Global Allocation Fund, RiverFront Moderate Growth & Income Fund, eleven of the funds of Financial Investors Trust (the “Trust”), as of October 31, 2015, the related statements of operations for the year then ended, and the statements of changes in net assets and the financial highlights for the periods presented. We have also audited the accompanying consolidated statements of assets and liabilities, including the consolidated statements of investments, of ALPS | Kotak India Growth Fund and ALPS | CoreCommodity Management CompleteCommodities® Strategy Fund, two of the funds of the Trust, as of October 31, 2015, the related consolidated statements of operations for the year then ended, and the consolidated statements of changes in net assets and the consolidated financial highlights for each of the periods presented. These financial statements and financial highlights for these thirteen funds are the responsibility of the Trust’s management. Our responsibility is to express an opinion on these financial statements and financial highlights based on our audits. We conducted our audits in accordance with the standards of the Public Company Accounting Oversight Board (United States). Those standards require that we plan and perform the audit to obtain reasonable assurance about whether the financial statements and financial highlights are free of material misstatement. The Trust is not required to have, nor were we engaged to perform, an audit of its internal control over financial reporting. Our audits included consideration of internal control over financial reporting as a basis for designing audit procedures that are appropriate in the circumstances, but not for the purpose of expressing an opinion on the effectiveness of the Trust’s internal control over financial reporting. Accordingly, we express no such opinion. An audit also includes examining, on a test basis, evidence supporting the amounts and disclosures in the financial statements, assessing the accounting principles used and significant estimates made by management, as well as evaluating the overall financial statement presentation. Our procedures included confirmation of securities owned as of October 31, 2015, by correspondence with the custodian, agent banks and brokers; where replies were not received from agent banks and brokers, we performed other auditing procedures. We believe that our audits provide a reasonable basis for our opinion. In our opinion, the financial statements and financial highlights referred to above present fairly, in all material respects, the financial position of each of the thirteen funds constituting Financial Investors Trust as of October 31, 2015, and the results of their operations, the changes in their net assets and the financial highlights for the periods presented, in conformity with accounting principles generally accepted in the United States of America. DELOITTE & TOUCHE LLP Denver, Colorado December 21, 2015 197 | October 31, 2015 . Additional Information October 31, 2015 (Unaudited) 1. FUND HOLDINGS The Funds file their complete schedule of portfolio holdings with the Securities and Exchange Commission (the “SEC”) for the first and third quarters of each fiscal year on Form Nâ€Q within 60 days after the end of the period. Copies of the Funds’ Form Nâ€Q are available without charge on the SEC website at http:// www.sec.gov. You may also review and copy the Form Nâ€Q at the SEC’s Public Reference Room in Washington, D.C. For more information about the operation of the Public Reference Room, please call the SEC at 1â€800â€SECâ€0330. 2. FUND PROXY VOTING POLICIES, PROCEDURES AND SUMMARIES Fund policies and procedures used in determining how to vote proxies and information regarding how each of the Funds voted proxies relating to portfolio securities during the most recent prior 12â€month period ending June 30 are available without charge, (1) upon request, by calling (tollâ€free) (866) 759â€5679 and (2) on the SEC’s website at http://www.sec.gov. 3. TAX DESIGNATIONS Of the distributions paid by the Funds from ordinary income for the calendar year ended December 31, 2014, the following percentages met the requirements to be treated as qualifying for the corporate dividends received deduction and qualified dividend income: QDI DRD ALPS | CoreCommodity Management CompleteCommodities® Strategy Fund 9.55% 9.55% ALPS | Kotak India Growth Fund 32.23% 0.00% ALPS | Red Rocks Listed Private Equity Fund 18.71% 1.23% ALPS | Sterling ETF Tactical Rotation Fund 35.99% 39.74% ALPS | Westport Resources Hedged High Income Fund 0.00% 0.00% ALPS | WMC Research Value Fund 30.28% 29.68% Clough China Fund 64.50% 0.00% RiverFront Conservative Income Builder Fund 21.49% 10.02% RiverFront Dynamic Equity Income Fund 49.83% 20.36% RiverFront Global Allocation Fund 59.25% 2.98% RiverFront Global Growth Fund 54.75% 3.01% RiverFront Moderate Growth & Income Fund 34.16% 17.77% In early 2015, if applicable, shareholders of record received this information for the distribution paid to them by the Funds during the calendar year 2014 via Form 1099. The Funds will notify shareholders in early 2016 of amounts paid to them by the Funds, if any, during the calendar year 2015. Pursuant to Section 852(b)(3) of the Internal Revenue Code the Funds that designated longâ€term capital gain dividends are: ALPS | CoreCommodity Management CompleteCommodities® Strategy Fund $ – ALPS | Kotak India Growth Fund $ 245,199 ALPS | Red Rocks Listed Private Equity Fund $ 1,431,943 ALPS | Sterling ETF Tactical Rotation Fund $ – ALPS | Westport Resources Hedged High Income Fund $ – ALPS | WMC Research Value Fund $ 8,298,461 Clough China Fund $ 1,612,835 RiverFront Conservative Income Builder Fund $ 95,413 RiverFront Dynamic Equity Income Fund $ 1,736,888 RiverFront Global Allocation Fund $ 2,042,515 RiverFront Global Growth Fund $ 5,687,960 RiverFront Moderate Growth & Income Fund $ 4,753,671 Pursuant to Section 853(c) of the Internal Revenue Code, the following Funds designate the amounts listed below as foreign taxes paid and foreign source income during the current fiscal year: Foreign Taxes Paid Foreign Source Income Clough China Fund $ 149,681 $ 2,479,086 198 | October 31, 2015 . Additional Information October 31, 2015 (Unaudited) 4. DISCLOSURE REGARDING APPROVAL OF FUND ADVISORY AND SUBâ€ADVISORY AGREEMENTS Clough China Fund On June 9â€10, 2015, the Trustees met in person to discuss, among other things, the approval of the investment advisory agreement between Financial Investors Trust (the “Trust”) and ALPS Advisors, Inc. (“ALPS Advisors”) (the “Investment Advisory Agreement”), and the subâ€advisory agreement with Clough Capital Partners, LLC (“Clough Capital”) (the “Subâ€Advisory Agreement”), in accordance with Section 15(c) of the 1940 Act. The Independent Trustees met with independent legal counsel during executive session and discussed the Investment Advisory Agreement, the Subâ€Advisory Agreement and other related materials. In renewing and approving the Investment Advisory Agreement with ALPS Advisors and the Subâ€Advisory Agreement with Clough Capital, the Trustees, including the Independent Trustees, considered the following factors with respect to the Clough China Fund (the “China Fund”): Investment Advisory Fee Rate: The Trustees reviewed and considered the contractual annual advisory fee to be paid by (a) the Trust, on behalf of the China Fund, to ALPS Advisors of 1.35% of the China Fund’s daily average net assets and (b) ALPS Advisors to Clough Capital of 0.90% of the China Fund’s daily average net assets, in light of the extent and quality of the advisory services provided by the ALPS Advisors and Clough Capital to the China Fund. The Board received and considered information including a comparison of the China Fund’s contractual and actual advisory fees and overall expenses with those of funds in the relevant peer expense group of funds provided by an independent provider of investment company data (the “Data Provider”). The Trustees also considered information regarding compensation to be paid to affiliates of ALPS Advisors under other agreements, such as the Fund Accounting and Administration Agreement with ALPS. The Trustees noted that the investment advisory fee rate was above the median expense group fee and the median expense universe fee, but within a reasonable range of such medians when considered in light of particular services provided to the China Fund. Total Expense Ratios: Based on such information, the Trustees further reviewed and considered the total expense ratios (after waivers, subject to certain exclusions) of 1.95%, 2.70% and 1.70% for Class A, Class C and Class I, respectively, of the China Fund, taking into account the contractual fee waivers in place through February 29, 2016. The Trustees noted that the total expense ratios (after waivers) were above the median expense group fee and the median expense universe fee, but within a reasonable range of such medians when considered in light of particular services provided to the China Fund. Nature, Extent and Quality of the Services under the Investment Advisory Agreement and the Subâ€Advisory Agreement: The Trustees received and considered information regarding the nature, extent and quality of services provided to the China Fund under the Investment Advisory Agreement and the Subâ€Advisory Agreement. The Trustees reviewed certain background materials supplied by ALPS Advisors and Clough Capital in each of their presentations, including their Forms ADV and compliance policies and procedures. The Trustees reviewed and considered ALPS Advisors’ and Clough Capital’s investment advisory personnel, their history as asset managers, their performance and the amount of assets currently under management by ALPS Advisors and Clough Capital. The Trustees also reviewed the research and decisionâ€making processes utilized by ALPS Advisors and Clough Capital, including the methods adopted to seek to achieve compliance with the investment objectives, policies and restrictions of the China Fund. The Trustees considered the background and experience of ALPS Advisors’ and Clough Capital’s management in connection with the China Fund, including reviewing the qualifications, backgrounds and responsibilities of the management team primarily responsible for the dayâ€toâ€day portfolio management of the China Fund and the extent of the resources devoted to research and analysis of actual and potential investments. The Trustees also reviewed the accompanying complianceâ€related materials and noted that they have received reports on these services and compliance issues from ALPS Advisors and Clough Capital at each regular Board meeting throughout the year related to the services rendered by ALPS Advisors and Clough Capital with respect to the China Fund. Performance: The Trustees reviewed performance information for the China Fund and the predecessor fund of the China Fund (December 30, 2005 inception date) for the 1â€year, 2â€year, 3â€year, 4â€year and 5â€year periods ended March 31, 2014. That review included a comparison of the China Fund’s performance to the performance of a group of comparable funds selected by Lipper. The Trustees noted the China Fund’s generally favorable longerâ€term performance over such periods ended March 31, 2014, compared against peer funds identified by Lipper. The Trustees also considered Clough Capital’s performance and reputation generally and its investment techniques, risk management controls and decisionâ€making processes, as well as Clough Capital’s overview of the China market, the economic outlook for investing in China and the potential effects of certain political and economic issues on trading in Chinese stocks. 199 | October 31, 2015 . Additional Information October 31, 2015 (Unaudited) Comparable Accounts: The Trustees considered information provided by Clough Capital regarding fees charged to its closedâ€end investment company and private fund clients, noting Clough Capital’s statements regarding differences in trading strategies, activity levels and use of short sales and options. Profitability: The Trustees received and considered a projected profitability analyses prepared by ALPS Advisors and by Clough Capital based on the fees payable under the Investment Advisory Agreement and Subâ€Advisory Agreement, respectively. The Trustees considered that the China Fund was currently profitable to ALPS Advisors without the inclusion of distributionâ€related expenses, as well as the losses realized by Clough Capital in connection with the operation of the China Fund. The Trustees also considered Clough Capital’s statements regarding its continuing commitment to the China Fund despite these losses. The Board then reviewed ALPS Advisors’ and Clough Capital’s financial statements in order to analyze the financial condition and stability and profitability of each adviser. Economies of Scale: The Trustees considered whether economies of scale in the provision of services to the China Fund were being passed along to the shareholders. The Trustees considered whether any economies of scale, fallâ€out benefits or any other direct or indirect benefits would accrue to ALPS Advisors or Clough Capital from their relationship with the Trust. Other Benefits to the Advisers: The Trustees reviewed and considered any other benefits derived or to be derived by ALPS Advisors and Clough Capital from their relationship with the China Fund, including whether softâ€dollar arrangements were used. The Board summarized its deliberations with respect to the Investment Advisory Agreement with ALPS Advisors and the Subâ€Advisory Agreement with Clough Capital. In selecting ALPS Advisors and Clough Capital and approving the investment advisory and subâ€advisory agreements and fees under such agreements, the Trustees concluded that no single factor reviewed by the Trustees was identified by the Trustees to be determinative as the principal factor in whether to approve the investment advisory and subâ€advisory agreements. Further, the Independent Trustees were advised by independent legal counsel throughout the process. Moreover, each Trustee may have afforded different weight to the various factors in reaching his or her conclusions with respect to each agreement. The Trustees, including all of the Independent Trustees, concluded that: • the investment advisory fee rate was above the median expense group fee and the median expense universe fee, but within a reasonable range of such medians when considered in light of particular services provided to the China Fund; • the total expense ratios (after waivers) were above the median expense group fee and the median expense universe fee, but within a reasonable range of such medians when considered in light of particular services provided to the China Fund; • the nature, extent and quality of services rendered by ALPS Advisors under the Investment Advisory Agreement and by Clough Capital under the Subâ€Advisory Agreement were adequate; • the performance of the China Fund was generally comparable to, or in some cases more favorable than, the longerâ€term performance of the funds in its performance peer universe; • bearing in mind the limitations of comparing different types of managed accounts and the different levels of service typically associated with such accounts, the fee structures applicable to Clough Capital’s other clients employing a comparable strategy were not indicative of any unreasonableness with respect to the subâ€advisory fees proposed to be payable to Clough Capital by the Adviser; • the profit, if any, realized by ALPS Advisors and by Clough Capital in connection with the operation of the China Fund is not unreasonable, especially in light of the fee waiver agreement between the Trust and ALPS Advisors, and to the extent currently unprofitable, each of ALPS Advisors and by Clough Capital remains committed to the China Fund; and • there were no material economies of scale or other benefits accruing to either ALPS Advisors or Clough Capital in connection with its relationship with the China Fund. Based on the Trustees’ deliberations and their evaluation of the information described above, all of the Trustees, including all of the Independent Trustees in person at the Meeting, concluded that ALPS Advisors’ and Clough Capital’s compensation for investment advisory services is consistent with the best interests of the China Fund and its shareholders. ALPS | Red Rocks Listed Private Equity Fund On April 22, 2015, the Trustees met in person to discuss, among other things, the approval, in accordance with Section 15(c) of the 1940 Act, of (i) the new investment subâ€advisory agreement among the Trust, ALPS Advisors and Red Rocks Capital, LLC (“Red Rocks”) (the “New Subâ€Advisory Agreement”), for consideration and approval by the shareholders of the ALPS | Red Rocks Listed Private Equity Fund (the “LPE Fund”) in connection with the acquisition of Red Rocks by ALPS Advisors (the “Transaction”), and (ii) the existing investment subâ€advisory agreement among the Trust, ALPS Advisors and Red Rocks (the “Existing Subâ€Advisory Agreement”). The Independent Trustees met with independent legal counsel during executive session and discussed the New Subâ€Advisory Agreement, the Existing Subâ€Advisory Agreement and other related materials. 200 | October 31, 2015 . Additional Information October 31, 2015 (Unaudited) Approval of the New Subâ€Advisory Agreement with Red Rocks In voting to approve the New Subâ€Advisory Agreement, the Board did not identify any single factor as allâ€important or controlling. The Board considered whether the New Subâ€Advisory would be in the best interests of the LPE Fund and its shareholders, based on: (i) the nature, extent and quality of the services to be provided under the New Subâ€Advisory Agreement; (ii) the investment performance of the LPE Fund; (iii) the expenses borne by the LPE Fund (including management fees and other expenses), the fees indirectly charged by Red Rocks to the LPE Fund and to its other clients, and projected profits to be realized by Red Rocks and its affiliates from their relationships with the LPE Fund; (iv) the fact that economies of scale may be realized as the LPE Fund grows and whether fee levels will reflect economies of scale for the benefit of shareholders; (v) potential fallâ€out benefits to Red Rocks from its relationships with the LPE Fund; and (vi) other general information about Red Rocks. The following is a summary of the Board’s consideration and conclusions regarding these matters. Nature, Extent and Quality of the Services Provided. The Board received and considered information regarding the nature, extent and quality of services provided to the LPE Fund under the New Subâ€Advisory Agreement. The Trustees reviewed certain background materials supplied by Red Rocks, including its Form ADV. The Board reviewed and considered Red Rocks’ investment advisory personnel, its history as an asset manager, its performance and the amount of assets currently under management by Red Rocks and reviewed the qualifications, backgrounds and responsibilities of the management team primarily responsible for the dayâ€toâ€day portfolio management of the LPE Fund and the extent of the resources devoted to research and analysis of actual and potential investments. The Board also reviewed the research and decisionâ€making processes utilized by Red Rocks, including the methods adopted to seek to achieve compliance with the investment objectives, policies and restrictions of the LPE Fund. The Board also reviewed certain complianceâ€related materials and noted that they have received reports on advisory services and compliance matters from Red Rocks at each regular Board meeting throughout the year. Investment Performance. The Board reviewed performance information for the LPE Fund for the 1â€year, 3â€year and 5â€year periods ended March 31, 2015. The review included a comparison of the LPE Fund’s performance to the performance of a group of comparable funds selected by an independent provider of research data. The Trustees noted that the LPE Fund had favorable performance for each of these periods when compared against its peer universe average as identified by the independent provider of research data. The Board also considered Red Rocks’ performance and reputation generally and its investment techniques, risk management controls and decisionâ€making processes. Fees and Expenses. The Board reviewed and considered (a) the contractual annual advisory fee rate to be paid by the Trust, on behalf of the LPE Fund, to ALPS Advisors and (b) the contractual subâ€advisory fee rate to be paid by ALPS Advisors to Red Rocks, in light of the extent and quality of the advisory services provided by ALPS Advisors and Red Rocks to the LPE Fund. The Board also considered fees charged by Red Rocks to comparable accounts, including other registered investment companies, noting the types of services offered by Red Rocks to those other accounts and Red Rocks’ cost considerations in managing such accounts. Based on such information, the Board further determined that the contractual annual advisory fees, inclusive of the subâ€advisory fees to be paid by ALPS Advisors to Red Rocks, and taking into account the contractual fee waivers in place, are generally lower than the peer universe median or within an acceptable range of the peer universe median. The Board also determined that the LPE Fund’s total expenses, on a classâ€byâ€class basis, were generally lower than the peer universe median, or within an acceptable range thereof. Projected Profitability and Costs of Services to Red Rocks. The Trustees received and considered a projected profitability analysis prepared by Red Rocks based on the fees payable under the New Subâ€Advisory Agreement and on Red Rocks’ estimates of its operating expenses, and also considered information regarding the financial condition of Red Rocks. The Trustees also received information from ALPS Advisors regarding the anticipated effects of the Transaction on its projected profitability. In assessing the projected profitability analysis, the Board noted that the LPE Fund’s total fees and expenses were within an acceptable range of the median expenses of comparable funds identified by the independent provider of investment company data. Extent of Economies of Scale as the LPE Fund Grows and Whether Fee Levels Reflect Economies of Scale. The Trustees considered whether economies of scale in the provision of services to the LPE Fund were being passed along to the shareholders. The Trustees also considered whether any fallâ€out benefits or any other direct or indirect benefits would accrue to Red Rocks from its relationship with the LPE Fund. The Board also reviewed and considered any other benefits derived or to be derived by Red Rocks from its relationship with the LPE Fund, including soft dollar arrangements. Based on its evaluation of the aforementioned considerations, the Board unanimously voted to approve the New Subâ€Advisory Agreement, and to recommend to the shareholders of the LPE Fund that they approve the New Subâ€Advisory Agreement. 201 | October 31, 2015 . Additional Information October 31, 2015 (Unaudited) Renewal of the Existing Subâ€Advisory Agreement with Red Rocks In renewing and approving the Existing Subâ€Advisory Agreement with Red Rocks, the Trustees, including the Independent Trustees, considered the following factors with respect to the LPE Fund: In voting to approve the Existing Subâ€Advisory Agreement, the Board did not identify any single factor to be determinative. The Board considered whether the Existing Subâ€Advisory Agreement would be in the best interests of the LPE Fund and its shareholders, based on: (i) the nature, extent and quality of the services to be provided under the Existing Subâ€Advisory Agreement; (ii) the investment performance of the LPE Fund; (iii) the expenses borne by the LPE Fund (including management fees and other expenses), the fees indirectly charged by Red Rocks to the LPE Fund and to its other clients, and projected profits to be realized by Red Rocks and its affiliates from their relationships with the LPE Fund; (iv) the fact that economies of scale may be realized as the LPE Fund grows and whether fee levels will reflect economies of scale for the benefit of shareholders; (v) potential fallâ€out benefits to Red Rocks from its relationships with the LPE Fund; and (vi) other general information about Red Rocks. The following is a summary of the Board’s consideration and conclusions regarding these matters. Nature, Extent and Quality of the Services Provided. The Board received and considered information regarding the nature, extent and quality of services provided to the LPE Fund under the Existing Subâ€Advisory Agreement. The Trustees reviewed certain background materials supplied by Red Rocks, including its Form ADV. The Board reviewed and considered Red Rocks’ investment advisory personnel, its history as an asset manager, its performance and the amount of assets currently under management by Red Rocks, and reviewed the qualifications, backgrounds and responsibilities of the management team primarily responsible for the dayâ€toâ€day portfolio management of the LPE Fund and the extent of the resources devoted to research and analysis of actual and potential investments. The Board also reviewed the research and decisionâ€making processes utilized by Red Rocks, including the methods adopted to seek to achieve compliance with the investment objectives, policies and restrictions of the LPE Fund. The Board also reviewed certain complianceâ€related materials and noted that they have received reports on advisory services and compliance matters from Red Rocks at each regular Board meeting throughout the year. Investment Performance. The Board reviewed performance information for the LPE Fund for the 1â€year, 3â€year and 5â€year periods ended March 31, 2015. The review included a comparison of the LPE Fund’s performance to the performance of a group of comparable funds selected by an independent provider of research data. The Trustees noted that the LPE Fund had favorable performance for each of these periods when compared against its peer universe average as identified by the independent provider of research data. The Board also considered Red Rocks’ performance and reputation generally and its investment techniques, risk management controls and decisionâ€making processes. Fees and Expenses. The Board reviewed and considered (a) the contractual annual advisory fee rate to be paid by the Trust, on behalf of the LPE Fund, to ALPS Advisors and (b) the contractual subâ€advisory fee rate to be paid by ALPS Advisors to Red Rocks, in light of the extent and quality of the advisory services provided by ALPS Advisors and Red Rocks to the LPE Fund. The Board also considered fees charged by Red Rocks to comparable accounts, including other registered investment companies, noting the types of services offered by Red Rocks to those other accounts and Red Rocks’ cost considerations in managing such accounts. Based on such information, the Board further determined that the contractual annual advisory fees, inclusive of the subâ€advisory fees to be paid by ALPS Advisors to Red Rocks, and taking into account the contractual fee waivers in place, are generally lower than the peer universe median or within an acceptable range of the peer universe median. The Board also determined that the LPE Fund’s total expenses, on a classâ€byâ€class basis, were generally lower than the peer universe median, or within an acceptable range thereof. Projected Profitability and Costs of Services to Red Rocks. The Trustees received and considered a historical, current and projected profitability analysis prepared by Red Rocks based on the fees payable under the Existing Subâ€Advisory Agreement and on Red Rocks’ estimates of its operating expenses, and also considered information regarding the financial condition of Red Rocks. In assessing the profitability analysis, the Board noted that the LPE Fund’s total fees and expenses were within an acceptable range of the median expenses of comparable funds identified by the independent provider of investment company data. Extent of Economies of Scale as the LPE Fund Grows and Whether Fee Levels Reflect Economies of Scale. The Trustees considered whether economies of scale in the provision of services to the LPE Fund were being passed along to the shareholders. The Trustees also considered whether any fallâ€out benefits or any other direct or indirect benefits would accrue to Red Rocks from its relationship with the LPE Fund. The Board also reviewed and considered any other benefits derived or to be derived by Red Rocks from its relationship with the LPE Fund, including soft dollar arrangements. Based on its evaluation of the aforementioned considerations, the Board unanimously voted to approve the Existing Investment Subâ€Advisory Agreement. 202 | October 31, 2015 . Additional Information October 31, 2015 (Unaudited) Approval of the Existing Investment Advisory Agreement with ALPS Advisors On June 9â€10, 2015, the Trustees met in person to discuss, among other things, the approval of the investment advisory agreement between the Trust and ALPS Advisors (the “Investment Advisory Agreement”), in accordance with Section 15(c) of the 1940 Act. The Trustees noted that the existing investment subâ€advisory agreement with Red Rocks Capital was not subject to review at this time as it had been renewed at the Board’s April 22, 2015 meeting. The Independent Trustees met with independent legal counsel during executive session and discussed the Investment Advisory Agreement and other related materials. In renewing and approving the Investment Advisory Agreement with ALPS Advisors, the Trustees, including the Independent Trustees, considered the following factors with respect to the LPE Fund: Investment Advisory Fee Rate: The Trustees reviewed and considered the contractual annual advisory fee to be paid by the Trust, on behalf of the LPE Fund, to ALPS Advisors of 0.85% of the LPE Fund’s daily average net assets, in light of the extent and quality of the advisory services provided by ALPS Advisors to the LPE Fund. The Board received and considered information including a comparison of the LPE Fund’s contractual and actual advisory fees and overall expenses with those of funds in the relevant peer expense group of funds provided by an independent provider of investment company data. The Trustees also considered information regarding compensation to be paid to affiliates of ALPS Advisors under other agreements, such as the Fund Accounting and Administration Agreement with ALPS. The Trustees noted that the investment advisory fee rate was above the median expense group fee and the median expense universe fee, but within a reasonable range of such medians when considered in light of particular services provided to the LPE Fund. Total Expense Ratios: Based on such information, the Trustees further reviewed and considered the total expense ratio (after waivers, subject to certain exclusions) of 1.25% for all classes of the LPE Fund, taking into account the contractual fee waivers in place through February 29, 2016. The Trustees noted that the total expense ratios (after waivers) were above the median expense group fee and the median expense universe fee, but within a reasonable range of such medians when considered in light of particular services provided to the LPE Fund. Nature, Extent and Quality of the Services under the Investment Advisory Agreement: The Trustees received and considered information regarding the nature, extent and quality of services provided to the LPE Fund under the Investment Advisory Agreement. The Trustees reviewed certain background materials supplied by ALPS Advisors in their presentations, including its Form ADV and compliance policies and procedures. The Trustees reviewed and considered ALPS Advisors’ investment advisory personnel, its history as asset managers, its performance and the amount of assets currently under management by ALPS Advisors. The Trustees also reviewed the research and decisionâ€making processes utilized by ALPS Advisors, including the methods adopted to seek to achieve compliance with the investment objectives, policies and restrictions of the LPE Fund. The Trustees considered the background and experience of ALPS Advisors’ management in connection with the LPE Fund, including reviewing the qualifications, backgrounds and responsibilities of the management team primarily responsible for the management of the LPE Fund and the extent of the resources devoted to research and analysis of actual and potential investments. The Trustees also reviewed the accompanying complianceâ€related materials and further noted that they have received reports on these services and compliance issues from ALPS Advisors at each regular Board meeting throughout the year related to the services rendered by ALPS Advisors with respect to the LPE Fund. Performance: The Trustees reviewed performance information for the LPE Fund for the 1â€year, 2â€year, 3â€year, 4â€year and 5â€year periods ended March 31, 2015. That review included a comparison of the LPE Fund’s performance to the performance of a universe of comparable funds selected by an independent provider of investment company data. The Trustees noted the generally favorable performance of the LPE Fund over more recent periods compared with the applicable performance peer universe of funds identified by an independent provider of investment company data. Comparable Accounts: The Trustees noted that for the purposes of reviewing comparable accounts, the focus has been on the comparable accounts of the subâ€adviser, and that the existing subâ€advisory agreement with Red Rocks was not being presented to the Trustees at this time. Profitability: The Trustees received and considered a profitability analysis prepared by ALPS Advisors based on the fees payable under the Investment Advisory Agreement. The Trustees considered the statements by ALPS Advisors that the LPE Fund was currently profitable to ALPS Advisors. The Board then reviewed and discussed ALPS Advisors’ financial statements in order to analyze the financial condition and stability of the adviser. 203 | October 31, 2015 . Additional Information October 31, 2015 (Unaudited) Economies of Scale: The Trustees considered whether economies of scale in the provision of services to the LPE Fund were being passed along to the shareholders. The Trustees considered whether any economies of scale, fallâ€out benefits or any other direct or indirect benefits would accrue to ALPS Advisors from its relationship with the Trust. Other Benefits to the Advisers: The Trustees reviewed and considered any other benefits derived or to be derived by ALPS Advisors from its relationship with the LPE Fund, including whether softâ€dollar arrangements were used. The Board summarized its deliberations with respect to the Investment Advisory Agreement with ALPS Advisors. In selecting ALPS Advisors and approving the Investment Advisory Agreement and fees under such agreement, the Trustees concluded that no single factor reviewed by the Trustees was identified by the Trustees to be determinative as the principal factor in whether to approve the investment advisory agreement. Further, the Independent Trustees were advised by separate independent legal counsel throughout the process. The Trustees, including all of the Independent Trustees, concluded that: • the investment advisory fee rate was above the median expense group fee and the median expense universe fee, but within a reasonable range of such medians; • the total expense ratios (after waivers) were above the median expense group fee and the median expense universe fee, but within a reasonable range of such medians; • the nature, extent and quality of services rendered by ALPS Advisors under the Investment Advisory Agreement were adequate; • the performance of the LPE Fund was generally comparable to, or in some cases more favorable than, the longerâ€term performance of the funds in its performance peer universe; • for the purposes of reviewing comparable accounts, the focus has been on the comparable accounts of the subâ€adviser, and that the existing subâ€advisory agreement with Red Rocks was not being presented to the Trustees at this time; • the profit realized by ALPS Advisors in connection with the operation of the LPE Fund is not unreasonable, especially in light of the fee waiver agreement among the Trust, ALPS Advisors and Red Rocks; and • there were no material economies of scale or other benefits accruing to ALPS Advisors in connection with its relationship with the LPE Fund. Based on the Trustees’ deliberations and their evaluation of the information described above, all of the Trustees, including all of the Independent Trustees in person at the meeting, concluded that ALPS Advisors’ compensation for investment advisory services is consistent with the best interests of the LPE Fund and its shareholders. ALPS | WMC Research Value Fund On June 9â€10, 2015, the Trustees met in person to discuss, among other things, the approval of the investment advisory agreement between the Trust and ALPS Advisors, Inc. (“ALPS Advisors”) (the “Investment Advisory Agreement”), and the subâ€advisory agreement with Wellington Management Company LLP (“Wellington”) (the “Subâ€Advisory Agreement”), in accordance with Section 15(c) of the 1940 Act. The Independent Trustees met with independent legal counsel during executive session and discussed the Investment Advisory Agreement, the Subâ€Advisory Agreement and other related materials. In renewing and approving the Investment Advisory Agreement with ALPS Advisors and the Subâ€Advisory Agreement with Wellington, the Trustees, including the Independent Trustees, considered the following factors with respect to the ALPS | WMC Research Value Fund (the “WMC Fund”): Investment Advisory Fee Rate: The Trustees reviewed and considered the tiered contractual annual advisory fee to be paid by (a) the Trust, on behalf of the WMC Fund, to ALPS Advisors of (i) 0.95% of the WMC Fund’s daily average net assets of $0â€$250M; (ii) 0.85% of the WMC Fund’s daily average net assets between $250Mâ€$500M ; and (iii) 0.75% of the WMC Fund’s daily average net assets over $500M and (b) by ALPS Advisors to Wellington of (i) 0.50% of the WMC Fund’s daily average net assets of $0â€$250M; (ii) 0.40% of the WMC Fund’s daily average net assets between $250Mâ€$500M; and (iii) 0.30% of the WMC Fund’s daily average net assets over $500M, in light of the extent and quality of the advisory services provided by the ALPS Advisors and Wellington to the WMC Fund. The Board received and considered information including a comparison of the WMC Fund’s contractual and actual advisory fees and overall expenses with those of funds in the relevant peer expense group of funds provided by an independent provider of investment company data. The Trustees also considered information regarding compensation to be paid to affiliates of ALPS Advisors under other agreements, such as the Fund Accounting and Administration Agreement with ALPS. The Trustees noted that the investment advisory fee rate was above the median expense group fee and the median expense universe fee, but within a reasonable range of such medians when considered in light of particular services provided to the WMC Fund. Total Expense Ratios: Based on such information, the Trustees further reviewed and considered total expense ratio (after waivers, subject to certain exclusions) of 1.15% for the WMC Fund’s, taking into account the contractual fee waiver in place until February 29, 2016. The Trustees 204 | October 31, 2015 . Additional Information October 31, 2015 (Unaudited) noted that the total expense ratios (after waivers) were slightly above the median expense group fee and the median expense universe fee, but within a reasonable range of such medians when considered in light of particular services provided to the WMC Fund. Nature, Extent and Quality of the Services under the Investment Advisory Agreement and the Subâ€Advisory Agreement: The Trustees received and considered information regarding the nature, extent and quality of services provided to the WMC Fund under the Investment Advisory Agreement and the Subâ€Advisory Agreement. The Trustees reviewed certain background materials supplied by ALPS Advisors and Wellington in each of their presentations, including their Forms ADV and compliance policies and procedures. The Trustees reviewed and considered ALPS Advisors’ and Wellington’s investment advisory personnel, their history as asset managers, their performance and the amount of assets currently under management by ALPS Advisors and Wellington. The Trustees also reviewed the research and decisionâ€making processes utilized by ALPS Advisors and Wellington, including the methods adopted to seek to achieve compliance with the investment objectives, policies and restrictions of the WMC Fund. The Trustees considered the background and experience of ALPS Advisors’ and Wellington’s management in connection with the WMC Fund, including reviewing the qualifications, backgrounds and responsibilities of the management team primarily responsible for the dayâ€toâ€day portfolio management of the WMC Fund and the extent of the resources devoted to research and analysis of actual and potential investments. The Trustees also reviewed the accompanying complianceâ€related materials and noted that they have received reports on these services and compliance issues from ALPS Advisors and Wellington at each regular Board meeting throughout the year related to the services rendered by ALPS Advisors and Wellington with respect to the WMC Fund. Performance: The Trustees reviewed performance information for the WMC Fund and the predecessor fund of the WMC Fund (December 31, 1999 inception) for the 1â€year, 2â€year, 3â€year, 4â€year, 5â€year and 10â€year periods ended March 31, 2015. That review included a comparison of the WMC Fund’s performance to the performance of a universe of comparable funds selected by an independent provider of investment company data. The Trustees noted the generally favorable performance of the WMC Fund over much of those periods compared against funds identified by an independent provider of investment company data. The Trustees also considered Wellington’s discussion of the WMC Fund’s performance contributors and detractors and its portfolio position and outlook, as well as Wellington’s performance and reputation generally and its investment techniques, risk management controls and decisionâ€making processes. Comparable Accounts: The Trustees considered information provided by Wellington regarding their institutional fee schedule for comparable strategies. Profitability: The Trustees received and considered a projected profitability analysis prepared by ALPS Advisors and by Wellington based on the fees payable under the Investment Advisory Agreement and the Subâ€Advisory Agreement, respectively. The Trustees considered that the WMC Fund was currently profitable to ALPS Advisors without the inclusion of distributionâ€related expenses. The Trustees also considered the advisers’ statements regarding their continuing commitment to the WMC Fund despite these losses. The Board then reviewed ALPS Advisors’ and Wellington’s financial statements in order to analyze the financial condition and stability and profitability of each adviser. Economies of Scale: The Trustees considered whether economies of scale in the provision of services to the WMC Fund were being passed along to the shareholders. The Trustees considered whether any economies of scale, fallâ€out benefits or any other direct or indirect benefits would accrue to ALPS Advisors or Wellington from their relationship with the Trust. Other Benefits to the Advisers: The Trustees reviewed and considered any other benefits derived or to be derived by ALPS Advisors and Wellington from their relationship with the WMC Fund, including whether softâ€dollar arrangements were used. The Board summarized its deliberations with respect to the Investment Advisory Agreement with ALPS Advisors and the Subâ€Advisory Agreement with Wellington. In selecting ALPS Advisors and Wellington and approving the Investment Advisory Agreement and the Subâ€Advisory Agreement and fees under such agreements, the Trustees concluded that no single factor reviewed by the Trustees was identified by the Trustees to be determinative as the principal factor in whether to approve the Investment Advisory Agreement and the Subâ€Advisory Agreement. Further, the Independent Trustees were advised by separate independent legal counsel throughout the process. The Trustees, including all of the Independent Trustees, concluded that: • the investment advisory fee rate was slightly above the median expense group fee and the median expense universe fee, but within a reasonable range of such medians when considered in light of particular services provided to the WMC Fund; • the total expense ratios (after waivers) were slightly above the median expense group fee and the median expense universe fee, but within a reasonable range of such medians when considered in light of particular services provided to the WMC Fund; 205 | October 31, 2015 . Additional Information October 31, 2015 (Unaudited) • • • • • the nature, extent and quality of services rendered by ALPS Advisors under the Investment Advisory Agreement and by Wellington under the Subâ€Advisory Agreement were adequate; the performance of the WMC Fund was generally comparable to, or in some cases more favorable than, the performance of the funds in its performance peer universe; bearing in mind the limitations of comparing different types of managed accounts and the different levels of service typically associated with such accounts, the fee structures applicable to Wellington’s other clients employing a comparable strategy were not indicative of any unreasonableness with respect to the subâ€advisory fees proposed to be payable to Wellington by ALPS Advisors; the profit realized by ALPS Advisors and by Wellington in connection with the operation of the WMC Fund is not unreasonable, especially in light of the fee waiver agreement between the Trust and ALPS Advisors, and to the extent currently unprofitable or profitable, each remains committed to the WMC Fund; and there were no material economies of scale or other benefits accruing to either ALPS Advisors or Wellington in connection with its relationship with the WMC Fund. Based on the Trustees’ deliberations and their evaluation of the information described above, all of the Trustees, including all of the Independent Trustees in person at the Meeting, concluded that ALPS Advisors’ and Wellington’s compensation for investment advisory services is consistent with the best interests of the WMC Fund and its shareholders. ALPS | CoreCommodity Management CompleteCommodities® Strategy Fund On June 9â€10, 2015, the Trustees met in person to discuss, among other things, the approval of the investment advisory agreement between the Trust and ALPS Advisors, Inc. (“ALPS Advisors”) (the “Investment Advisory Agreement”), and the subâ€advisory agreement with CoreCommodity Management LLC (“CoreCommodity”) (the “Subâ€Advisory Agreement”), in accordance with Section 15(c) of the 1940 Act. The Independent Trustees met with independent legal counsel during executive session and discussed the Investment Advisory Agreement, the Subâ€Advisory Agreement and other related materials. In renewing and approving the Investment Advisory Agreement with ALPS Advisors and the Subâ€Advisory Agreement with CoreCommodity, the Trustees, including the Independent Trustees, considered the following factors with respect to the ALPS | CoreCommodity Management CompleteCommodities® Strategy Fund (the “CoreCommodity Fund”): Investment Advisory Fee Rate: The Trustees reviewed and considered the contractual annual advisory fee to be paid by (a) the Trust, on behalf of the CoreCommodity Fund, to ALPS Advisors of 0.85% of the CoreCommodity Fund’s daily average net assets and (b) by ALPS Advisors to CoreCommodity of 0.75% of the CoreCommodity Fund’s daily average net assets, in light of the extent and quality of the advisory services provided by the ALPS Advisors and CoreCommodity to the CoreCommodity Fund. The Board received and considered information including a comparison of the CoreCommodity Fund’s contractual and actual advisory fees and overall expenses with those of funds in the relevant peer expense group of funds provided by an independent provider of investment company data. The Trustees also considered information regarding compensation to be paid to affiliates of ALPS Advisors under other agreements, such as the Fund Accounting and Administration Agreement with ALPS. The Trustees noted that the investment advisory fee rate was generally above the median expense group fee and the median expense universe fee, but within a reasonable range of such medians when considered in light of particular services provided to the CoreCommodity Fund. Total Expense Ratios: Based on such information, the Trustees further reviewed and considered the total expense ratio (after waivers, subject to certain exclusions) of 1.05% for Class A shares, 1.05% for Class C shares, and 1.15% for Class I shares of the CoreCommodity Fund, taking into account the contractual fee waiver in place until February 29, 2016. The Trustees noted that the total expense ratios (after waivers) were within a reasonable range of the median expense group ratio and the median expense universe ratio when considered in light of particular services provided to the Core Commodity Fund. Nature, Extent and Quality of the Services under the Investment Advisory Agreement: The Trustees received and considered information regarding the nature, extent and quality of services provided to the CoreCommodity Fund under the Investment Advisory Agreement. The Trustees reviewed certain background materials supplied by ALPS Advisors in its presentations, including its Form ADV. The Trustees reviewed and considered ALPS Advisors’ investment advisory personnel, its history as an asset manager, its performance and the amount of assets currently under management by ALPS Advisors. The Trustees also reviewed the research and decisionâ€making processes utilized by ALPS Advisors, including the methods adopted to seek to achieve compliance with the investment objectives, policies and restrictions of the CoreCommodity Fund. The Trustees considered the background and experience of ALPS Advisors’ management in connection with the CoreCommodity Fund. 206 | October 31, 2015 . Additional Information October 31, 2015 (Unaudited) The Trustees also reviewed the accompanying complianceâ€related materials and noted that they have received reports on these services and compliance issues from ALPS Advisors and CoreCommodity at each regular Board meeting throughout the year related to the services rendered by ALPS Advisors and CoreCommodity with respect to the CoreCommodity Fund. Performance: The Trustees reviewed performance information for the CoreCommodity Fund for the 1â€year, 2â€year, 3â€year, and 4â€year periods ended March 31, 2015. The review included a comparison of the CoreCommodity Fund’s performance to the performance of a universe of comparable funds selected by Lipper. The Trustees noted that the CoreCommodity Fund had generally near median and favorable long term performance when compared against comparable funds identified by Lipper. The Trustees also considered ALPS Advisors’ CoreCommodity’s performance and reputation generally and their investment techniques, risk management controls and decisionâ€making processes. Comparable Accounts: The Trustees considered information provided by CoreCommodity indicating that there were no comparable accounts managed by CoreCommodity. Profitability: The Trustees received and considered a projected profitability analyses prepared by ALPS Advisors and by CoreCommodity based on the fees payable under the Investment Advisory Agreement and the Subâ€Advisory Agreement, respectively. The Trustees considered that the CoreCommodity Fund was currently profitable to ALPS Advisors without the inclusion of distributionâ€related expenses, and currently profitable to CoreCommodity both before and after distribution expenses. The Board then reviewed ALPS Advisors’ and CoreCommodity’s financial statements in order to analyze the financial condition and stability and profitability of each adviser. Economies of Scale: The Trustees considered whether economies of scale in the provision of services to the CoreCommodity Fund were being passed along to the shareholders. The Trustees considered whether any economies of scale, fallâ€out benefits or any other direct or indirect benefits would accrue to ALPS Advisors or CoreCommodity from their relationship with the Trust. Other Benefits to the Adviser: The Trustees reviewed and considered any other benefits derived or to be derived by ALPS Advisors and CoreCommodity from their relationship with the CoreCommodity Fund, including whether soft dollar arrangements were used. The Board summarized its deliberations with respect to the Investment Advisory Agreement with ALPS Advisors and the Subâ€Advisory Agreement with CoreCommodity Management. In selecting ALPS Advisors and CoreCommodity Management and approving the Investment Advisory Agreement and the Subâ€Advisory Agreement and fees under such agreements, the Trustees concluded that no single factor reviewed by the Trustees was identified by the Trustees to be determinative as the principal factor in whether to approve the investment advisory and subâ€advisory agreements. Further, the Independent Trustees were advised by separate independent legal counsel throughout the process. The Trustees, including all of the Independent Trustees, concluded that: • the investment advisory fee rate was above the median expense group fee and the median expense universe fee, but within a reasonable range of such medians when considered in light of particular services provided to the CoreCommodity Fund; • the total expense ratios (after waivers) were near the median expense group fee and the median expense universe fee, and within a reasonable range of such medians when considered in light of particular services provided to the CoreCommodity Fund; • the nature, extent and quality of services rendered by ALPS Advisors under the Investment Advisory Agreement and by CoreCommodity under the Subâ€Advisory Agreement were adequate; • the performance of the CoreCommodity Fund was near median and generally favorable compared with the longâ€term performance of the funds in its performance peer universe; • there were no comparable accounts managed by CoreCommodity; • the profit realized by ALPS Advisors and CoreCommodity in connection with the operation of the CoreCommodity Fund is not unreasonable, especially in light of the fee waiver agreement between the Trust and CoreCommodity; and to the extent currently unprofitable, ALPS Advisors remains committed to the CoreCommodity Fund; and • there were no material economies of scale or other benefits accruing to ALPS Advisors in connection with its relationship with the CoreCommodity Fund. Based on the Trustees’ deliberations and their evaluation of the information described above, all of the Trustees, including all of the Independent Trustees in person at the meeting, concluded that ALPS Advisors’ and CoreCommodity’s compensation for investment advisory services is consistent with the best interests of the CoreCommodity Fund and its shareholders. The Trustees applied the same analysis to the advisory arrangements between ALPS Advisors, CoreCommodity and the wholly owned Cayman Island subsidiary of the CoreCommodity Fund. 207 | October 31, 2015 . Additional Information October 31, 2015 (Unaudited) RiverFront Global Allocation Series On June 9â€10, 2015, the Trustees met in person to discuss, among other things, the approval of the investment advisory agreement between the Trust and ALPS Advisors, Inc. (“ALPS Advisors”) (the “Investment Advisory Agreement”), and the subâ€advisory agreement with RiverFront Investment Group, LLC (“RiverFront”) (the “Subâ€Advisory Agreement”), in accordance with Section 15(c) of the 1940 Act. The Independent Trustees met with independent legal counsel during executive session and discussed the Investment Advisory Agreement, the Subâ€Advisory Agreement and other related materials. In renewing and approving the Investment Advisory Agreement with ALPS Advisors and the Subâ€Advisory Agreement with RiverFront, the Trustees, including the Independent Trustees, considered the following factors with respect to the RiverFront Global Allocation Series (the “RiverFront Funds”): Investment Advisory Fee Rate: The Trustees reviewed and considered the contractual annual advisory fee to be paid by (a) the Trust, on behalf of the RiverFront Funds, to ALPS Advisors of 0.85% of each RiverFront Fund’s daily average net assets and (b) by ALPS Advisors to RiverFront of 0.60% of each of the RiverFront Fund’s daily average net assets, in light of the extent and quality of the advisory services provided by the ALPS Advisors and RiverFront to the RiverFront Funds. The Board received and considered information including a comparison of each RiverFront Fund’s contractual and actual advisory fees and overall expenses with those of funds in the relevant peer expense group of funds provided by an independent provider of investment company data. The Trustees also considered information regarding compensation to be paid to affiliates of ALPS Advisors under other agreements, such as the Fund Accounting and Administration Agreement with ALPS. The Trustees noted that the investment advisory fee rate was generally above the median expense group fee and the median expense universe fee, but within a reasonable range of such medians when considered in light of particular services provided to each RiverFront Fund. Total Expense Ratios: Based on such information, the Trustees further reviewed and considered the total expense ratios (after waivers, subject to certain exclusions), of 0.90% for Class A, Class C, Class I, Class L and Investor Class shares of each of the RiverFront Funds, if applicable, taking into account the contractual fee waiver in place until February 29, 2016. The Trustees noted that the total expense ratios (after waivers) were within a reasonable range of, and sometimes below, the median expense group ratio and the median expense universe ratio when considered in light of particular services provided to the RiverFront Funds. Nature, Extent and Quality of the Services under the Investment Advisory Agreement and the Subâ€Advisory Agreement: The Trustees received and considered information regarding the nature, extent and quality of services provided to the RiverFront Funds under the Investment Advisory Agreement and the Subâ€Advisory Agreement. The Trustees reviewed certain background materials supplied by ALPS Advisors and RiverFront in each of their presentations, including their Forms ADV and compliance policies and procedures. The Trustees reviewed and considered ALPS Advisors’ and RiverFront’s investment advisory personnel, their history as asset managers, their performance and the amount of assets currently under management by ALPS Advisors and RiverFront. The Trustees also reviewed the research and decisionâ€making processes utilized by ALPS Advisors and RiverFront, including the methods adopted to seek to achieve compliance with the investment objectives, policies and restrictions of the RiverFront Funds. The Trustees considered the background and experience of ALPS Advisors’ and RiverFront’s management in connection with the RiverFront Funds, including reviewing the qualifications, backgrounds and responsibilities of the management team primarily responsible for the dayâ€toâ€day portfolio management of the RiverFront Funds and the extent of the resources devoted to research and analysis of actual and potential investments. The Trustees also reviewed the accompanying complianceâ€related materials and noted that they have received reports on these services and compliance issues from ALPS Advisors and RiverFront at each regular Board meeting throughout the year related to the services rendered by ALPS Advisors and RiverFront with respect to the RiverFront Funds. Performance: The Trustees reviewed performance information for each RiverFront Fund for the 1â€year, 2â€year, 3â€year and 4â€year periods ended March 31, 2015, as applicable. The review included a comparison of each of the RiverFront Fund’s performance to the performance of a universe of comparable funds selected by an independent provider of investment company data. The Trustees noted that, with the exception of the RiverFront Global Growth Fund, the net total return performance for each RiverFront Fund was generally below the respective performance universe average. The Trustees also considered RiverFront’s performance and reputation generally and its investment techniques, risk management controls and decisionâ€making processes. Comparable Accounts: The Trustees noted certain information provided by RiverFront regarding its typical fee ranges for UMA and SMA accounts. 208 | October 31, 2015 . Additional Information October 31, 2015 (Unaudited) Profitability: The Trustees received and considered a profitability analysis prepared by ALPS Advisors and by RiverFront based on the fees payable under the Investment Advisory Agreement and the Subâ€Advisory Agreement, respectively. The Trustees considered that certain of the RiverFront Funds were profitable to ALPS Advisors without the inclusion of distributionâ€related expenses, and that all of the RiverFront Funds were currently profitable to RiverFront excluding the RiverFront Conservative Income Builder Fund. The Trustees also considered ALPS Advisors’ and RiverFront’s statements regarding their continuing commitment to the RiverFront Funds despite any losses with respect to certain of the Funds. The Board then reviewed and discussed ALPS Advisors’ and RiverFront’s financial statements in order to analyze the financial condition and stability and profitability of each adviser. Economies of Scale: The Trustees considered whether economies of scale in the provision of services to the RiverFront Funds were being passed along to the shareholders. The Trustees considered whether any economies of scale, fallâ€out benefits or any other direct or indirect benefits would accrue to ALPS Advisors or RiverFront from their relationship with the Trust. Other Benefits to the Advisers: The Trustees reviewed and considered any other benefits derived or to be derived by ALPS Advisors and RiverFront from their relationship with the RiverFront Funds, including whether soft dollar arrangements were used. The Board summarized its deliberations with respect to the Investment Advisory Agreement with ALPS Advisors and the Subâ€Advisory Agreement with RiverFront. In selecting ALPS Advisors and RiverFront and approving the Investment Advisory Agreement and the Subâ€Advisory Agreement and fees under such agreements, the Trustees concluded that no single factor reviewed by the Trustees was identified by the Trustees to be determinative as the principal factor in whether to approve the Investment Advisory Agreement and the Subâ€Advisory Agreement. Further, the Independent Trustees were advised by separate independent legal counsel throughout the process. The Trustees, including all of the Independent Trustees, concluded that: • the investment advisory fee rate was generally above the median expense group fee and the median expense universe fee, but within a reasonable range of such medians when considered in light of particular services provided to each RiverFront Fund; • the total expense ratios (after waivers) were near, and sometimes below, the median expense group fee and the median expense universe fee, and within a reasonable range of such medians when considered in light of particular services provided to each RiverFront Fund; • the nature, extent and quality of services rendered by ALPS Advisors under the Investment Advisory Agreement and by RiverFront under the Subâ€Advisory Agreement were adequate; • the performance of each of the RiverFront Funds was generally below the respective performance universe average; • bearing in mind the limitations of comparing different types of managed accounts and the different levels of service typically associated with such accounts, the fee structures applicable to RiverFront’s other clients employing a comparable strategy were not indicative of any unreasonableness with respect to the advisory fees proposed to be payable by the RiverFront Funds; • the profit, if any, anticipated to be realized by ALPS Advisors and by RiverFront in connection with the operation of each RiverFront Fund is not unreasonable, especially in light of the fee waiver agreement among the Trust, ALPS Advisors and RiverFront, and to the extent currently unprofitable, ALPS Advisors and RiverFront remain committed to each of the RiverFront Funds; and • there were no material economies of scale or other benefits accruing to either ALPS Advisors or RiverFront in connection with its relationship with any RiverFront Fund. Based on the Trustees’ deliberations and their evaluation of the information described above, the Trustees, including all of the Independent Trustees, concluded that ALPS Advisors’ and RiverFront’s compensation for investment advisory services is consistent with the best interests of each of the RiverFront Funds and its shareholders. ALPS | Kotak India Growth Fund On June 9â€10, 2015, the Trustees met in person to discuss, among other things, the approval of the investment advisory agreement between the Trust and ALPS Advisors, Inc. (“ALPS Advisors”) (the “Investment Advisory Agreement”), and the subâ€advisory agreement with Kotak Mahindra (UK) Limited (“Kotak”) (the “Subâ€Advisory Agreement”), in accordance with Section 15(c) of the 1940 Act. The Independent Trustees met with independent legal counsel during executive session and discussed the Investment Advisory Agreement, the Subâ€Advisory Agreement and other related materials. In renewing and approving the Investment Advisory Agreement with ALPS Advisors and the Subâ€Advisory Agreement with Kotak, the Trustees, including the Independent Trustees, considered the following factors with respect to the ALPS | Kotak India Growth Fund (the “India Fund”): Investment Advisory Fee Rate: The Trustees reviewed and considered the contractual annual advisory fee to be paid by (a) the Trust, on behalf of the India Fund, to ALPS Advisors of 1.25% of the India Fund’s daily average net assets and (b) by ALPS Advisors to Kotak of (i) 1.15% of the India Fund’s daily average net assets on the first $50 million and 1.05% of the India Fund’s daily average net assets over $50 million, in light of the extent 209 | October 31, 2015 . Additional Information October 31, 2015 (Unaudited) and quality of the advisory services provided by the ALPS Advisors and Kotak to the India Fund. The Board received and considered information including a comparison of the India Fund’s contractual and actual advisory fees and overall expenses with those of funds in the relevant peer expense group of funds provided by an independent provider of investment company data. The Trustees also considered information regarding compensation to be paid to affiliates of ALPS Advisors under other agreements, such as the Fund Accounting and Administration Agreement with ALPS. The Trustees noted that the investment advisory fee rate was near the median expense group fee and the median expense universe fee, and within a reasonable range of such medians when considered in light of particular services provided to the India Fund. Total Expense Ratios: Based on such information, the Trustees further reviewed and considered the total expense ratio (net of waivers, subject to certain exclusions) of 1.60% for Class A shares, Class C shares and Class I shares, taking into account the contractual fee waiver in place until February 29, 2016. The Trustees noted that the total expense ratios (after waivers) were above the median expense group fee and the median expense universe fee, but within a reasonable range of such medians when considered in light of particular services provided to the India Fund. Nature, Extent and Quality of the Services under the Investment Advisory Agreement and the Subâ€Advisory Agreement: The Trustees received and considered information regarding the nature, extent and quality of services provided to the India Fund under the Investment Advisory Agreement and the Subâ€Advisory Agreement. The Trustees reviewed certain background materials supplied by ALPS Advisors and Kotak in each of their presentations, including their Forms ADV and compliance policies and procedures. The Trustees reviewed and considered ALPS Advisors’ and Kotak’s investment advisory personnel, their history as asset managers, their performance and the amount of assets currently under management by ALPS Advisors and Kotak. The Trustees also reviewed the research and decisionâ€making processes utilized by ALPS Advisors and Kotak, including the methods adopted to seek to achieve compliance with the investment objectives, policies and restrictions of the India Fund. The Trustees considered the background and experience of ALPS Advisors’ and Kotak’s management in connection with the India Fund, including reviewing the qualifications, backgrounds and responsibilities of the management team primarily responsible for the dayâ€toâ€day portfolio management of the India Fund and the extent of the resources devoted to research and analysis of actual and potential investments. The Trustees also reviewed the accompanying complianceâ€related materials and noted that they have received reports on these services and compliance issues from ALPS Advisors and Kotak at each regular Board meeting through the year related to the services rendered by ALPS Advisors and Kotak with respect to the India Fund. Performance: The Trustees reviewed performance information for the India Fund for the 1â€year, 2â€year, 3â€year, and 4â€year periods ended March 31, 2015. The review included a comparison of the India Fund’s performance to the performance of a group of comparable funds selected by an independent provider of investment company data. The Trustees noted that the India Fund had generally favorable performance when compared against comparable funds identified by an independent provider of investment company data. The Trustees also considered Kotak’s performance and reputation generally and its investment techniques, risk management controls and decisionâ€making processes. Comparable Accounts: The Trustees considered information provided by Kotak regarding fee schedules applicable to certain collective investment vehicles managed by Kotak and marketed outside the United States and certain other institutional clients. Profitability: The Trustees received and considered a profitability analysis prepared by ALPS Advisors and by Kotak based on the fees payable under the Investment Advisory Agreement and the Subâ€Advisory Agreement, respectively. The Trustees considered the losses realized by ALPS Advisors and by Kotak in connection with the operation of the India Fund. The Trustees also considered the advisers’ statements regarding their continuing commitment to the India Fund despite these losses. The Board then reviewed and discussed ALPS Advisors’ and Kotak’s financial statements in order to analyze the financial condition and stability and profitability of each adviser. Economies of Scale: The Trustees considered whether economies of scale in the provision of services to the India Fund were being passed along to the shareholders. The Trustees considered whether any economies of scale, fallâ€out benefits or any other direct or indirect benefits would accrue to ALPS Advisors or Kotak from their relationship with the Trust. Other Benefits to the Adviser: The Trustees reviewed and considered any other benefits derived or to be derived by ALPS Advisors and Kotak from their relationship with the India Fund, including whether soft dollar arrangements were used. The Board summarized its deliberations with respect to the Investment Advisory Agreement with ALPS Advisors and the Subâ€Advisory Agreement with Kotak. In selecting ALPS Advisors and Kotak and approving the Investment Advisory Agreement and the Subâ€Advisory Agreement and fees under such agreements, the Trustees concluded that no single factor reviewed by the Trustees was identified by the Trustees to be determinative 210 | October 31, 2015 . Additional Information October 31, 2015 (Unaudited) as the principal factor in whether to approve the Investment Advisory Agreement and the Subâ€Advisory Agreement. Further, the Independent Trustees were advised by separate independent legal counsel throughout the process. The Trustees, including all of the Independent Trustees, concluded that: • the investment advisory fee rate was generally near the median expense group fee and the median expense universe fee, and within a reasonable range of such medians when considered in light of particular services provided to the India Fund; • the total expense ratios (after waivers) were above the median expense group fee and the median expense universe fee, and within a reasonable range of such medians when considered in light of particular services provided to the India Fund; • the nature, extent and quality of services rendered by ALPS Advisors under the Investment Advisory Agreement and by Kotak under the Subâ€Advisory Agreement were adequate; • the performance of the India Fund was generally favorable to the performance of the funds in its performance peer universe over more recent periods; • bearing in mind the limitations of comparing different types of managed accounts and the different levels of service typically associated with such accounts, the fee structures applicable to Kotak’s other clients employing a comparable strategy were not indicative of any unreasonableness with respect to the advisory fees proposed to be payable by the India Fund; • the India Fund is currently unprofitable to ALPS Advisors and Kotak, and each remains committed to the India Fund; and • there were no material economies of scale or other benefits accruing to ALPS Advisors or Kotak in connection with its relationship with the India Fund. Based on the Trustees’ deliberations and their evaluation of the information described above, the Trustees, including all of the Independent Trustees, concluded that ALPS Advisors’ and Kotak’s compensation for investment advisory services is consistent with the best interests of the India Fund and its shareholders. ALPS | Alerian MLP Infrastructure Index Fund On June 9â€10, 2015, the Trustees met in person to discuss, among other things, the approval of the investment advisory agreement between the Trust and ALPS Advisors, Inc. (“ALPS Advisors”) (the “Investment Advisory Agreement”), in accordance with Section 15(c) of the 1940 Act. The Independent Trustees met with independent legal counsel during executive session and discussed the Investment Advisory Agreement and other related materials. In renewing and approving the Investment Advisory Agreement with ALPS Advisors, the Trustees, including the Independent Trustees, considered the following factors with respect to the ALPS | Alerian MLP Infrastructure Index Fund (the “Alerian Fund”): Investment Advisory Fee Rate: The Trustees reviewed and considered the contractual annual advisory fee to be paid by the Trust, on behalf of the Alerian Fund, to ALPS Advisors of 0.70% of the Fund’s average daily net assets, in light of the extent and quality of the advisory services to be provided by ALPS Advisors to the Alerian Fund. The Board received and considered information including a comparison of the Alerian Fund’s contractual and actual advisory fees and overall expenses with those of funds in the relevant peer expense group of funds provided by an independent provider of investment company data. The Trustees also considered information regarding compensation to be paid to affiliates of ALPS Advisors under other agreements, such as the Fund Accounting and Administration Agreement with ALPS. The Trustees noted that the investment advisory fee rate was less than the median expense group fee and the median expense universe fee. Total Expense Ratios: Based on such information, the Trustees further reviewed and considered the total expense ratio (net of waivers, subject to certain adjustments) of 0.85% for Class C, Class A and Class I shares of the Fund, taking into account the contractual fee waiver in place until February 29, 2016. The Trustees noted that the total expense ratio (after waivers) was less than the median expense group ratio and the median expense universe ratio. Nature, Extent and Quality of the Services under the Investment Advisory Agreement: The Trustees received and considered information regarding the nature, extent and quality of services provided to the Alerian Fund under the Investment Advisory Agreement. The Trustees reviewed certain background materials supplied by ALPS Advisors in its presentation, including its Form ADV. The Trustees reviewed and considered ALPS Advisors’ investment advisory personnel, its history as an asset manager and its performance and the amount of assets currently under management by ALPS Advisors and its affiliated entities. The Trustees also reviewed the research and decision†making processes utilized by ALPS Advisors, including the methods adopted to seek to achieve compliance with the investment objectives, policies and restrictions of the Alerian Fund. 211 | October 31, 2015 . Additional Information October 31, 2015 (Unaudited) The Trustees considered the background and experience of ALPS Advisors’ management in connection with the Alerian Fund, including reviewing the qualifications, backgrounds and responsibilities of the management team primarily responsible for the dayâ€toâ€day portfolio management of the Alerian Fund and the extent of the resources devoted to research and analysis of actual and potential investments. The Trustees also reviewed, among other things, ALPS Advisors’ Code of Ethics. Performance: The Trustees reviewed performance information for the Alerian Fund for the 1â€year and 2â€year periods ended March 31, 2015. The review included a comparison of the Alerian Fund’s performance to the performance of a universe of comparable funds selected by an independent provider of investment company data. The Trustees considered that, unlike many of its competitors, the Alerian Fund was based on a passive, indexâ€tracking strategy and was not actively managed. The Trustees also considered ALPS Advisors’ performance and reputation generally and its investment techniques, risk management controls and decisionâ€making processes. Comparable Accounts: The Trustees also considered information provided by ALPS Advisors regarding the fee rate applicable to a different investment company utilizing a similar strategy, noting ALPS Advisors’ statements regarding differences in competitive markets and operational structures. Profitability: The Trustees received and considered a profitability analysis prepared by ALPS Advisors based on the fees payable under the Investment Advisory Agreement. The Trustees considered the losses realized by ALPS Advisors in connection with the operation of the Alerian Fund. The Trustees also considered ALPS Advisors’ statements regarding its continuing commitment to the Alerian Fund despite these losses. The Board then reviewed and discussed ALPS Advisors’ financial statements in order to analyze the financial condition and stability and profitability of the adviser. Economies of Scale: The Trustees considered whether economies of scale in the provision of services to the Alerian Fund would be passed along to the shareholders. Other Benefits to the Adviser: The Trustees reviewed and considered any other incidental benefits derived or to be derived by ALPS Advisors from its relationship with the Alerian Fund, including whether soft dollar arrangements were used. In selecting ALPS Advisors as the Alerian Fund’s investment adviser and approving the Investment Advisory Agreement and the fees charged under the Investment Advisory Agreement, the Trustees concluded that no single factor reviewed by the Trustees was identified by the Trustees to be determinative as the principal factor in whether to approve the Investment Advisory Agreement. Further, the Independent Trustees were advised by independent legal counsel throughout the process. The Trustees, including all of the Independent Trustees, concluded that: • the investment advisory fee rate was generally below the median expense group fee and the median expense universe fee; • the total expense ratio (after waivers) were below the median expense group fee and the median expense universe fee, and within a reasonable range of such medians when considered in light of particular services provided to the Alerian Fund; • the nature, extent and quality of services rendered by ALPS Advisors under the Investment Advisory Agreement were adequate; • the performance history of the Alerian Fund, including the fact that its performance was within a reasonable range of those funds in its peer performance universe, and the fact that unlike many funds in the peer universe it did not follow an active management investment strategy; • bearing in mind the limitations of comparing different types of managed accounts and the different levels of service typically associated with such accounts, the fee structures applicable to ALPS Advisors’ other clients employing a comparable strategy were not indicative of any unreasonableness with respect to the advisory fees proposed to be payable by the Alerian Fund; • the profit, if any, realized by ALPS Advisors in connection with the operation of the Alerian Fund is not unreasonable to the Alerian Fund, and to the extent currently unprofitable to ALPS Advisors, ALPS Advisors remains committed to the Alerian Fund; and • there were no material economies of scale or other incidental benefits accruing to ALPS Advisors in connection with its relationship with the Alerian Fund at this time. Based on the Trustees’ deliberations and their evaluation of the information described above, the Trustees, including all of the Independent Trustees, concluded that ALPS Advisors’ compensation for investment advisory services is consistent with the best interests of the Alerian Fund and its shareholders. ALPS | Westport Resources Hedged High Income Fund On June 9â€10, 2015, the Trustees met in person to discuss, among other things, the approval of the investment advisory agreement between the Trust and ALPS Advisors, Inc. (“ALPS Advisors”) (the “Investment Advisory Agreement”), the coâ€investment advisory agreement among the Trust, ALPS Advisors and Westport Resources Management, Inc. (“Westport”) (the “Coâ€Investment Advisory Agreement”), and the subâ€advisory 212 | October 31, 2015 . Additional Information October 31, 2015 (Unaudited) agreements with each of Sound Point Capital Management, L.P. (“Sound Point”), Concise Capital Management, LP (“Concise Capital”) and Amundi Smith Breeden LLC (“Amundi Smith Breeden”) (the “Subâ€Advisory Agreements”), in accordance with Section 15(c) of the 1940 Act. The Independent Trustees met with independent legal counsel during executive session and discussed the Investment Advisory Agreement, the Coâ€Investment Advisory Agreement, the Subâ€Advisory Agreements and other related materials. In renewing and approving the Investment Advisory Agreement with ALPS Advisors, the Coâ€Investment Advisory Agreement with Westport and the Subâ€Advisory Agreements with Sound Point, Concise Capital and Amundi Smith Breeden, the Trustees, including the Independent Trustees, considered the following factors with respect to the ALPS | Westport Resources Hedged High Income Fund (the “Westport Resources Fund”): Investment Advisory Fee Rate: The Trustees reviewed and considered the contractual annual advisory fee rate paid by: • the Trust, on behalf of the Westport Resources Fund, to ALPS Advisors, the greater of (i) 0.20%, based on Fund’s average daily net assets, or (ii) $150,000; • the Trust, on behalf of the Westport Resources Fund, to Westport Resources of 1.50% of the Funds daily net assets; • Westport Resources to Sound Point of 1.00% of the Westport Fund’s daily average net assets allocated to Sound Point up to $50 million, and 0.80% of each of the Westport Fund’s daily average net assets allocated to Sound Point above $50 million; • Westport Resources to Concise Capital of 0.75% of the Westport Resources Fund’s daily average net assets allocated to Concise Capital; and • Westport Resources to Amundi Smith Breeden of 1.00% of the Westport Resources Fund’s daily average net assets allocated to Amundi Smith Breeden, each in light of the extent and quality of the advisory services to be provided by it to the Westport Resources Fund. The Board received and considered information including a comparison of the Westport Resources Fund’s contractual and actual advisory fees and overall expenses with those of funds in the relevant peer expense group of funds provided by an independent provider of investment company data. The Trustees also considered information regarding compensation to be paid to affiliates of ALPS Advisors under other agreements, such as the Fund Accounting and Administration Agreement with ALPS. The Trustees noted that the investment advisory fee rate was generally above the median expense group fee and the median expense universe fee, but within a reasonable range of such medians when considered in light of particular services provided to the Westport Resources Fund. The Trustees noted that the investment advisory fee rate was above the median expense group fee and the median expense universe fee, but within a reasonable range of such medians when considered in light of particular services provided to the Westport Fund. Total Expense Ratios: Based on such information, the Trustees further reviewed and considered the total expense ratios (net of waivers, subject to certain adjustments) of 1.99% for the Class A, Class C and Class I Shares of the Westport Resources Fund, taking into account the contractual fee waiver in place until February 29, 2016. The Trustees noted that the total expense ratios (after waivers) were above the median expense group fee and the median expense universe fee, but within a reasonable range of such medians when considered in light of particular services provided to the Westport Fund. Nature, Extent and Quality of the Services under the Advisory Agreements: The Trustees received and considered information regarding the nature, extent and quality of services to be provided to the Westport Resources Fund under the Investment Advisory Agreement with ALPS Advisors, the Coâ€Investment Advisory Agreement with Westport and the Subâ€Advisory Agreements with Sound Point, Concise Capital and Amundi Smith Breeden. The Trustees reviewed certain background materials supplied by each of ALPS Advisors, Westport, Sound Point, Concise Capital and Amundi Smith Breeden in its presentation, including its Form ADV. The Trustees reviewed and considered each entity’s investment advisory personnel, its history as asset managers and its performance and the amount of assets currently under management by it. The Trustees also reviewed the research and decisionâ€making processes utilized by each entity, including the methods adopted to seek to achieve compliance with the investment objectives, policies and restrictions of the portion of the Westport Resources Fund for which it was responsible. The Trustees considered the background and experience of each entity’s management in connection with the Westport Resources Fund, including reviewing the qualifications, backgrounds and responsibilities of the management team primarily responsible for the dayâ€toâ€day portfolio management of the Westport Resources Fund assets allocated to it and the extent of the resources devoted to research and analysis of actual and potential investments. The Trustees also reviewed, among other things, each entity’s Code of Ethics. Performance: The Trustees reviewed performance information for the Westport Resources Fund for the 1â€year period ended March 31, 2015. The review included a comparison of the Westport Resources Fund’s performance to the performance universe of comparable funds selected by an 213 | October 31, 2015 . Additional Information October 31, 2015 (Unaudited) independent provider of investment company data. The Trustees noted that the Westport Resources Fund’s performance was lower than the median for comparable funds, but reflected a very short period of time. Comparable Accounts. The Trustees also considered information provided by Sound Point, Concise Capital and Amundi Smith Breeden regarding the fee rates applicable to other comparable accounts managed by such subâ€adviser. Profitability: The Trustees received and considered a profitability analysis prepared by each entity based on the fees payable to such entity under the various agreements. The Trustees further considered the profits and losses realized by each entity in connection with the operation of the Westport Resources Fund, noting that the Westport Resources Fund was unprofitable to Westport and Amundi Smith Breeden, and Westport’s statements regarding its continuing commitment to the Westport Resources Fund despite its losses. Economies of Scale: The Trustees considered whether economies of scale in the provision of services to the Westport Resources Fund will be passed along to the shareholders under the proposed agreement. Other Benefits to the Adviser: The Trustees reviewed and considered any other incidental benefits derived or to be derived by any of the entities from its relationship with the Westport Resources Fund, including soft dollar arrangements. The Board summarized its deliberations with respect to the Investment Advisory Agreement with ALPS Advisors, the Coâ€Investment Advisory Agreement with Westport, and the Subâ€Advisory Agreements with Sound Point, Concise Capital and Amundi Smith Breeden. In selecting each entity and the fees charged under the agreements, the Trustees concluded that no single factor reviewed by the Trustees was identified by the Trustees to be determinative as the principal factor in whether to approve each of the agreements. Further, the Independent Trustees were advised by separate independent legal counsel throughout the process. The Trustees, including all of the Independent Trustees, concluded that: • the investment advisory fee rate was generally above the median expense group fee and the median expense universe fee, but within a reasonable range of such medians when considered in light of particular services provided to the Westport Resources Fund; • the total expense ratio (after waivers) were above the median expense group fee and the median expense universe fee, but within a reasonable range of such medians when considered in light of particular services provided to the Westport Resources Fund; • the nature, extent and quality of services rendered by each entity under its applicable agreement were adequate; • the performance of the Westport Resources Fund was generally lower than the median for comparable funds in its performance peer universe, but reflected a very short period of time; • bearing in mind the limitations of comparing different types of managed accounts and the different levels of service typically associated with such accounts, the fee structures applicable to each subâ€adviser’s other clients employing a comparable strategy were not indicative of any unreasonableness with respect to the advisory fees proposed to be payable by the Westport Resources Fund; • the profit, if any, anticipated to be realized by any entity in connection with the operation of the Westport Resources Fund is not unreasonable, and to the extent currently unprofitable, Westport remains committed to the Westport Resources Fund; and • there were no material economies of scale or other incidental benefits accruing to any entity in connection with its relationship with the Westport Resources Fund at this time. Based on the Trustees’ deliberations and their evaluation of the information described above, the Trustees, including all of the Independent Trustees, concluded that each entity’s compensation for investment advisory services is consistent with the best interests of the Westport Resources Fund and its shareholders. 214 | October 31, 2015 . Trustees and Officers October 31, 2015 (Unaudited) Additional information regarding the Funds’ trustees is included in the Statement of Additional Information, which can be obtained without charge by calling (tollâ€free) (866) 759â€5679. INDEPENDENT TRUSTEES Name, Address* & Year of Birth Number of Funds in Fund Complex Overseen by Trustee**** Position(s) Held with Fund Term of Office and Length of Time Served** Mary K. Anstine, 1940 Trustee Ms. Anstine was elected at a special meeting of shareholders held on March 21, 1997 and reâ€elected at a special meeting of shareholders held on August 7, 2009. Ms. Anstine was President/Chief Executive Officer of HealthONE Alliance, Denver, Colorado, and former Executive Vice President of First Interstate Bank of Denver. Ms. Anstine is also Trustee/Director of AV Hunter Trust and Colorado Uplift Board. Ms. Anstine was formerly a Director of the Trust Bank of Colorado (later purchased and now known as Northern Trust Bank) and a member of the American Bankers Association Trust Executive Committee. 63 Ms. Anstine is a Trustee of ALPS ETF Trust (21 funds); ALPS Variable Investment Trust (9 funds); Reaves Utility Income Fund (1 fund); and Westcore Trust (12 funds). John R. Moran, Jr., 1930 Trustee Mr. Moran was elected at a special meeting of shareholders held on March 21, 1997 and reâ€elected at a special meeting of shareholders held on August 7, 2009. Mr. Moran is formerly President and CEO of The Colorado Trust, a private foundation serving the health and hospital community in the state of Colorado. Currently, Mr. Moran is a member of the Treasurer’s Investment Advisory Committee for the University of Colorado. 34 None. Jeremy W. Deems, 1976 Trustee Mr. Deems was appointed as a Trustee at the March 11, 2008 meeting of the Board of Trustees and elected at a special meeting of shareholders held on August 7, 2009. Mr. Deems is the Coâ€Founder, Chief Operations Officer and Chief Financial Officer of Green Alpha Advisors, LLC. Mr. Deems is Coâ€Portfolio Manager of the Shelton Green Alpha Fund. Prior to joining Green Alpha Advisors, Mr. Deems was CFO and Treasurer of Forward Management, LLC, ReFlow Management Co., LLC, ReFlow Fund, LLC, a private investment fund, and Sutton Place Management, LLC, an administrative services company, from 2004 to June 2007. 65 Mr. Deems is a Trustee of ALPS ETF Trust (21 funds); ALPS Variable Investment Trust (9 funds); Reaves Utility Income Fund (1 fund); and Clough Funds Trust (1 fund). Principal Occupation(s) During Past 5 Years*** * ** Other Directorships Held by Trustee All communications to Trustees and Officers may be directed to Financial Investors Trust c/o 1290 Broadway, Suite 1100, Denver, CO 80203. This is the period for which the Trustee or Officer began serving the Trust. Each Trustee and/or Officer serves an indefinite term, until his successor is elected. *** Except as otherwise indicated, each individual has held the office shown or other offices in the same company for the last five years. **** The Fund Complex includes all series of the Trust, currently 34, and any other investment companies for which any Trustee serves as Trustee for and which ALPS Advisors, Red Rocks, Wellington Management, Clough Capital, RiverFront, Kotak, RREEF America, Westport Resources, Concise Capital Management, LP, Amundi Smith Breeden LLC, Sound Point Capital Management, L.P. or Sterling Global Strategies LLC provides investment advisory services (currently 38 funds, 0 funds, 0 funds, 4 funds, 1 fund, 0 funds, 0 funds, 0 funds, 0 funds, 0 funds, 0 funds and 0 funds, respectively). 215 | October 31, 2015 . Trustees and Officers October 31, 2015 (Unaudited) INDEPENDENT TRUSTEES Name, Address* & Year of Birth Number of Funds in Fund Complex Overseen by Trustee**** Position(s) Held with Fund Term of Office and Length of Time Served** Jerry G. Rutledge, 1944 Trustee Mr. Rutledge was elected at a special meeting of shareholders held on August 7, 2009. Mr. Rutledge is the President and owner of Rutledge’s Inc., a retail clothing business. He was from 1994 to 2007 a Regent of the University of Colorado. 38 Mr. Rutledge is a Trustee of Principal Real Estate Income Fund (1 fund), Clough Global Allocation Fund (1 fund), Clough Global Equity Fund (1 fund) and Clough Global Opportunities Fund (1 fund). Michael “Ross” Shell, 1970 Trustee Mr. Shell was elected at a special meeting of shareholders held on August 7, 2009. Mr. Shell is Founder and CEO of Red Idea, LLC, a strategic consulting/early stage venture firm (since June 2008). From 1999 to 2009, he was a part†owner and Director of Tesser, Inc., a brand agency. From December 2005 to May 2008, he was Director, Marketing and Investor Relations, of Woodbourne, a REIT/real estate hedge fund and private equity firm. Prior to this, from May 2004 to November 2005, he worked as a business strategy consultant; from June 2003 to April 2004, he was on the Global Client Services team of IDEO, a product design/innovation firm; and from 1999 to 2003, he was President of Tesser, Inc. Mr. Shell graduated with honors from Stanford University with a degree in Political Science. 34 None. Principal Occupation(s) During Past 5 Years*** * ** Other Directorships Held by Trustee All communications to Trustees and Officers may be directed to Financial Investors Trust c/o 1290 Broadway, Suite 1100, Denver, CO 80203. This is the period for which the Trustee or Officer began serving the Trust. Each Trustee and/or Officer serves an indefinite term, until his successor is elected. *** Except as otherwise indicated, each individual has held the office shown or other offices in the same company for the last five years. **** The Fund Complex includes all series of the Trust, currently 34, and any other investment companies for which any Trustee serves as Trustee for and which ALPS Advisors, Red Rocks, Wellington Management, Clough Capital, RiverFront, Kotak, RREEF America, Westport Resources, Concise Capital Management, LP, Amundi Smith Breeden LLC, Sound Point Capital Management, L.P. or Sterling Global Strategies LLC provides investment advisory services (currently 38 funds, 0 funds, 0 funds, 4 funds, 1 fund, 0 funds, 0 funds, 0 funds, 0 funds, 0 funds, 0 funds and 0 funds, respectively). 216 | October 31, 2015 . Trustees and Officers October 31, 2015 (Unaudited) INTERESTED TRUSTEE Name, Address* & Year of Birth Edmund J. Burke, 1961 * ** *** **** Position(s) Held with Fund Term of Office and Length of Time Served** Trustee, Chairman and President Mr. Burke was elected as Chairman at the August 28, 2009 meeting of the Board of Trustees. Mr. Burke was elected as Trustee at a special meeting of shareholders held on August 7, 2009. Mr. Burke was elected President of the Trust at the December 17, 2002 meeting of the Board of Trustees. Principal Occupation(s) During Past 5 Years*** Mr. Burke is President and a Director of ALPS Holdings, Inc. (“AHI”) (since 2005) and Director of Boston Financial Data Services, Inc. (“BFDS”), ALPS Advisors, Inc. (“AAI”), ALPS Distributors, Inc. (“ADI”), ALPS Fund Services, Inc. (“AFS”) and ALPS Portfolio Solutions Distributor, Inc. (“APSD”) and from 2001â€2008, was President of AAI, ADI, AFS and APSD. Because of his positions with AHI, BFDS, AAI, ADI, AFS and APSD, Mr. Burke is deemed an affiliate of the Trust as defined under the 1940 Act. Mr. Burke is Trustee and President of the Clough Global Allocation Fund (Trustee since 2006; President since 2004); Trustee and President of the Clough Global Equity Fund (Trustee since 2006; President since 2005); Trustee and President of the Clough Global Opportunities Fund (since 2006); Trustee of the Liberty Allâ€Star Equity Fund; and Director of the Liberty Allâ€Star Growth Fund, Inc. Number of Funds in Fund Complex Overseen by Trustee**** 40 Other Directorships Held by Trustee Mr. Burke is a Trustee of Clough Global Allocation Fund (1 fund); Clough Global Equity Fund (1 fund); Clough Global Opportunities Fund (1 fund); Clough Funds Trust (1 fund); Trustee of the Liberty Allâ€Star Equity Fund (1 fund); and Director of the Liberty Allâ€Star Growth Fund, Inc. (1 fund). All communications to Trustees and Officers may be directed to Financial Investors Trust c/o 1290 Broadway, Suite 1100, Denver, CO 80203. This is the period for which the Trustee began serving the Trust. Each Trustee serves an indefinite term, until his successor is elected. Except as otherwise indicated, each individual has held the office shown or other offices in the same company for the last five years. The Fund Complex includes all series of the Trust, currently 34, and any other investment companies for which any Trustee serves as Trustee for and which ALPS Advisors, Red Rocks, Wellington Management, Clough Capital, RiverFront, Kotak, RREEF America, Westport Resources, Concise Capital Management, LP, Amundi Smith Breeden LLC, Sound Point Capital Management, L.P. or Sterling Global Strategies LLC provides investment advisory services (currently 38 funds, 0 funds, 0 funds, 4 funds, 1 fund, 0 funds, 0 funds, 0 funds, 0 funds, 0 funds, 0 funds and 0 funds, respectively). 217 | October 31, 2015 . Trustees and Officers October 31, 2015 (Unaudited) OFFICERS Name, Address* & Year of Birth Position(s) Held with Fund Term of Office and Length of Time Served** Principal Occupation(s) During Past 5 Years*** Kimberly R. Storms, 1972 Treasurer Ms. Storms was elected Treasurer of the Trust at the March 12, 2013 meeting of the Board of Trustees. Ms. Storms is Senior Vice President †Director of Fund Administration of ALPS. Ms. Storms joined ALPS in 1998 as Assistant Controller. Because of her position with ALPS, Ms. Storms is deemed an affiliate of the Trust as defined under the 1940 Act. Ms. Storms is also Treasurer of BPV Family of Funds and ALPS Series Trust; Assistant Treasurer of Liberty Allâ€Star Equity Fund and Liberty Allâ€Star Growth Fund, Inc.; Assistant Treasurer of Tilson Funds; and Chief Financial Officer of The Arbitrage Funds. JoEllen L. Legg, 1961 Secretary Ms. Legg was elected Secretary of the Trust at the September 15, 2015 meeting of the Board of Trustees. Ms. Legg joined ALPS in October 2007 and is currently Vice President, Assistant General Counsel of ALPS. Prior to joining ALPS, Ms. Legg served as Senior Counsel †Law (Corporate & Securities) for Adelphia Communications Corporation (February 2005 †March 2007). Prior to this, Ms. Legg held associate positions at Fried Frank Harris Shriver & Jacobson LLP (1998 †2004) and at Patton Boggs LLP (2004 †2005). Because of her position with ALPS, Ms. Legg is deemed an affiliate of the Trust as defined under the 1940 Act. Ms. Legg is also the Secretary of ALPS Series Trust and Reaves Utility Income Fund and Assistant Secretary of Griffin Institutional Access Real Estate Fund. Mr. Uhl was appointed CCO of the Trust at the June 8, 2010 meeting of the Board of Trustees. Mr. Uhl joined ALPS in October 2006, and is currently Deputy Compliance Officer of ALPS. Prior to his current role, Mr. Uhl served as Senior Risk Manager for ALPS from October 2006 until June 2010. Before joining ALPS, Mr. Uhl served a Sr. Analyst with Enenbach and Associates (RIA), and a Sr. Financial Analyst at Sprint. Because of his position with ALPS, Mr. Uhl is deemed an affiliate of the Trust as defined under the 1940 Act. Mr. Uhl is also CCO of the Clough Global Funds, Reaves Utility Income Fund, Drexel Hamilton Funds and Transparent Value Trust. Ted Uhl, 1974 Chief Compliance Officer (“CCO”) * All communications to Trustees and Officers may be directed to Financial Investors Trust c/o 1290 Broadway, Suite 1100, Denver, CO 80203. ** This is the period for which the Trustee began serving the Trust. Each Trustee serves an indefinite term, until his successor is elected. *** Except as otherwise indicated, each individual has held the office shown or other offices in the same company for the last five years. 218 | October 31, 2015 . Trustees and Officers October 31, 2015 (Unaudited) OFFICERS (continued) Name, Address* & Year of Birth Position(s) Held with Fund Term of Office and Length of Time Served** Principal Occupation(s) During Past 5 Years*** Jennell Panella, 1974 Assistant Treasurer Ms. Panella was elected Assistant Treasurer of the Trust at the September 15, 2015 meeting of the Board of Trustees. Ms. Panella joined ALPS in June 2012 and is currently Fund Controller of ALPS Fund Services, Inc. Prior to joining ALPS, Ms. Panella served as Financial Reporting Manager for Parker Global Strategies, LLC (2009â€2012). Because of her position with ALPS, Ms. Panella is deemed an affiliate of the Trust as defined under the 1940 Act. Ms. Panella also serves as Assistant Treasurer of James Advantage Funds. Nate Mandeville, 1977 Assistant Treasurer Mr. Mandeville was elected Assistant Treasurer of the Trust at the September 15, 2015 meeting of the Board of Trustees. Mr. Mandeville joined ALPS in December 2013 and is Fund Controller for ALPS. Prior to joining ALPS, Mr. Mandeville worked for Greatâ€West Financial (2011â€2013), Virtuoso Sourcing Group (2008â€2011) and Janus Capital Group (2000â€2008). Because of his position with ALPS, Mr. Mandeville is deemed an affiliate of the Trust as defined under the 1940 Act. Mr. Mandeville also serves as Assistant Treasurer of ALPS Series Trust. Sharon Akselrod, 1974 Assistant Secretary Ms. Akselrod was elected Assistant Secretary of the Trust at the September 15, 2015 meeting of the Board of Trustees. Ms. Akselrod joined ALPS in August 2014 and is currently Senior Investment Company Act Paralegal of ALPS Fund Services, Inc. Prior to joining ALPS, Ms. Akselrod served as Corporate Governance and Regulatory Associate for Nordstrom fsb (2013†2014) and Senior Legal Assistant – Legal Manager for AXA Equitable Life Insurance Company (2008â€2013). Because of her position with ALPS, Ms. Akselrod is deemed an affiliate of the Trust as defined under the 1940 Act. * All communications to Trustees and Officers may be directed to Financial Investors Trust c/o 1290 Broadway, Suite 1100, Denver, CO 80203. ** This is the period for which the Trustee began serving the Trust. Each Trustee serves an indefinite term, until his successor is elected. *** Except as otherwise indicated, each individual has held the office shown or other offices in the same company for the last five years. 219 | October 31, 2015 . . . ANNUAL REPORT | October 31, 2015 The Management Commentaries included in this shareholder report contain certain forward-looking statements about the factors that may affect the performance of the Funds in the future. These statements are based on Fund management’s predictions and expectations concerning certain future events and their expected impact on the Funds, such as performance of the economy as a whole and of specific industry sectors, changes in the levels of interest rates, the impact of developing world events, and other factors that may influence the future performance of the Funds. Management believes these forward-looking statements to be reasonable, although they are inherently uncertain and difficult to predict. Actual events may cause adjustments in portfolio management strategies from those currently expected to be employed. Must be accompanied or preceded by a prospectus.
Investors are reminded to read the prospectus carefully before investing. ALPS Portfolio Solutions Distributor, Inc., distributor. ALP000903 .
The subject matter contained in this letter has been derived from several sources believed to be reliable and accurate at the time of compilation. Neither ALPS Advisors, Inc., Alerian, nor the Fund accept any liability for losses either direct or consequential caused by the use of this information. Diversification cannot guarantee gain or prevent losses. * At the time of the distribution the character was estimated to be 100% return of capital. Please reference the year-end tax forms for the final character. 5 | October 31, 2015 .
ALPS | Alerian MLP Infrastructure Index Fund Performance Update October 31, 2015 (Unaudited) Performance of $10,000 Initial Investment (as of October 31, 2015) Comparison of change in value of a $10,000 investment (includes maximum sales charges of 5.50%) $16k $14k $12k Alerian MLP Infrastructure Index - $10,565 ALPS | Alerian MLP Infrastructure Index Fund Class A, (NAV) - $9,317 ALPS | Alerian MLP Infrastructure Index Fund Class A, (MOP) - $8,807 $10k $8k 10/31/15 4/30/15 10/31/14 4/30/14 10/31/13 4/30/13 12/31/12^ $6k The chart above represents historical performance of a hypothetical investment of $10,000 in the Fund since inception. Past performance does not guarantee future results. This chart does not reflect the deduction of taxes that a shareholder would pay on Fund distributions or the redemption of Fund shares. Average Annual Total Returns (as of October 31, 2015) 6 Month â€2.46% â€31.24% â€4.39% â€27.18% â€2.70% â€24.38% â€27.85% â€2.70% â€23.68% Alerian MLP Infrastructure Index â€27.23% â€23.66% 1 Since Inception^ â€28.08% Class A (NAV) Class A (MOP) Class C (NAV) Class C (CDSC) Class I 1 Year â€23.89% â€26.95% â€2.22% â€24.53% â€29.05% 1.96% Total Expense Ratio* What You Pay*,** 2.22% 1.25% 2.82% 1.85% 1.81% 0.85% Performance data quoted represents past performance. Past performance does not guarantee future results.
Investment return and principal value of an investment will fluctuate so that an investor's shares, when sold or redeemed, may be worth more or less than the original cost. Current performance data may be higher or lower than actual data quoted. For the most current month-end performance data please call 1-866-759-5679. Maximum Offering Price (MOP) for Class A shares includes the Fund’s maximum sales charge of 5.50%.
Performance shown at NAV does not include these sales charges and would have been lower had it been taken into account. If you invest $1 million or more, either as a lump sum or through the Fund’s accumulation or letter of intent programs, you can purchase Class A shares without an initial sales charge (load). A Contingent Deferred Sales Charge (“CDSC”) of 1.00% may apply to Class C shares redeemed within the first 12 months after a purchase, and on Class A shares redeemed within the first 18 months after a purchase in excess of $1 million. Performance less than 1 year is cumulative. 6 | October 31, 2015 .
ALPS | Alerian MLP Infrastructure Index Fund Performance Update October 31, 2015 (Unaudited) 1 Alerian MLP Infrastructure Index is comprised of midstream energy Master Limited Partnerships. The index is not actively managed and does not reflect any deductions for fees, expenses or taxes. An investor may not invest directly in an index. ^ Fund inception date of December 31, 2012. * Excludes deferred income tax expense of 4.49% for Class A, 4.27% for Class C, and 4.63% for Class I. ** What You Pay reflects the Advisor's and Sub-Advisor’s decision to contractually limit expenses through February 29, 2016. Please see the prospectus for additional information. Investments in securities of MLPs involve risks that differ from an investment in common stock.
MLPs are controlled by their general partners, which generally have conflicts of interest and limited fiduciary duties to the MLP, which may permit the general partner to favor its own interests over the MLPs. The benefit you are expected to derive from the Fund’s investment in MLPs depends largely on the MLPs being treated as partnerships for federal income tax purposes. As a partnership, an MLP has no federal income tax liability at the entity level.
Therefore, treatment of one or more MLPs as a corporation for federal income tax purposes could affect the Fund’s ability to meet its investment objective and would reduce the amount of cash available to pay or distribute to you. Legislative, judicial, or administrative changes and differing interpretations, possibly on a retroactive basis, could negatively impact the value of an investment in MLPs and therefore the value of your investment in the Fund. The table does not reflect the deduction of taxes that a shareholder would pay on Fund distributions or the redemption of Fund shares. This Fund is not suitable for all investors and is subject to investment risks, including possible loss of the principal amount invested. There is no guarantee that the Fund will continue to hold any one particular security or stay invested in any one particular company. The composition of the Fund's top holdings is subject to change.
Performance figures are historical and reflect the change in share price, reinvested distributions, changes in net asset value, sales charges and capital gains distributions, if any. Not FDIC Insured – No Bank Guarantee – May Lose Value Top Ten Holdings (as a % of Net Assets) † Industry Sector Allocation (as a % of Total Investments) Enterprise Products Partners LP 10.69% Energy Transfer Partners LP 7.32% Magellan Midstream Partners LP 7.29% Plains All American Pipeline LP 7.17% Williams Partners LP 6.43% MarkWest Energy Partners LP 6.34% Enbridge Energy Partners LP 5.24% ONEOK Partners LP 4.97% Buckeye Partners LP 4.85% Targa Resources Partners LP Top Ten Holdings Pipeline Transportation | Petroleum - 41.90% Pipeline Transportation | Natural Gas - 30.76% Gathering & Processing - 25.65% 4.63% 64.93% † Holdings are subject to change, and may not reflect the current or future position of the Portfolio. Table presents approximate values only. 7 | October 31, 2015 . ALPS | Alerian MLP Infrastructure Index Fund Statement of Investments October 31, 2015 Value (Note 2) Shares MASTER LIMITED PARTNERSHIPS (98.31%) Gathering & Processing (25.65%) Pipelines (25.65%) DCP Midstream Partners LP EnLink Midstream Partners LP MarkWest Energy Partners LP Targa Resources Partners LP Western Gas Partners LP Williams Partners LP 23,010 34,082 39,401 41,907 19,406 51,673 $ 661,077 587,915 1,721,036 1,257,210 992,035 1,746,547 6,965,820 TOTAL GATHERING & PROCESSING 6,965,820 Common Abbreviations: LP - Limited Partnerships. For Fund compliance purposes, the Fund's industry classifications refer to any one or more of the industry sub-classifications used by one or more widely recognized market indexes or ratings group indexes, and/or as defined by Fund management. This definition may not apply for purposes of this report, which may combine industry sub-classifications for reporting ease. Industries are shown as a percent of net assets. See Notes to Financial Statements. 1,987,774 2,903,416 900,622 1,349,433 608,317 603,234 8,352,796 Pipeline Transportation | Natural Gas (30.76%) Pipelines (30.76%) Energy Transfer Partners LP 45,013 Enterprise Products Partners LP 105,082 EQT Midstream Partners LP 12,164 ONEOK Partners LP 42,395 Spectra Energy Partners LP 14,101 TC PipeLines LP 11,677 TOTAL PIPELINE TRANSPORTATION | NATURAL GAS 8,352,796 Pipeline Transportation | Petroleum (41.90%) Pipelines (41.90%) Buckeye Partners LP 19,403 Enbridge Energy Partners LP 50,901 Genesis Energy LP 23,641 Magellan Midstream Partners LP 31,021 NGL Energy Partners LP 23,246 NuStar Energy LP 16,144 Plains All American Pipeline LP 61,341 Shell Midstream Partners LP 13,363 Sunoco Logistics Partners LP 42,014 Tesoro Logistics LP 14,913 1,316,105 1,422,174 952,969 1,979,450 430,516 817,694 1,945,736 457,415 1,220,087 836,172 11,378,318 11,378,318 TOTAL PIPELINE TRANSPORTATION | PETROLEUM TOTAL MASTER LIMITED PARTNERSHIPS (Cost $31,484,363) 26,696,934 TOTAL INVESTMENTS (98.31%) (Cost $31,484,363) Other Assets In Excess Of Liabilities (1.69%) NET ASSETS (100.00%) $ 26,696,934 459,050 $ 27,155,984 8 | October 31, 2015 . ALPS | Alerian MLP Infrastructure Index Fund Statement of Assets and Liabilities October 31, 2015 ASSETS Investments, at value Receivable for investments sold Receivable for shares sold Dividends receivable Deferred tax asset(a) (Note 4) Income tax receivable Prepaid expenses and other assets Total Assets $ 26,696,934 258,695 264,754 277,384 – 6,904 10,624 27,515,295 $ 2,800 39,160 252,058 4,965 3,469 17,318 4 28,576 10,961 359,311 27,155,984 $ $ LIABILITIES Franchise tax payable Payable for shares redeemed Payable due to custodian †overdraft Investment advisory fees payable Administration and transfer agency fees payable Distribution and services fees payable Trustees' fees and expenses payable Professional fees payable Accrued expenses and other liabilities Total Liabilities NET ASSETS NET ASSETS CONSIST OF Paidâ€in capital Accumulated net investment loss, net of deferred income taxes Accumulated net realized loss on investments, net of deferred income taxes Net unrealized depreciation on investments, net of deferred income taxes NET ASSETS INVESTMENTS, AT COST PRICING OF SHARES $ 31,484,363 Class A: Net Asset Value, offering and redemption price per share Net Assets Shares of beneficial interest outstanding (unlimited number of shares, no par value common stock authorized) Maximum offering price per share ((NAV/0.9450), based on maximum sales charge of 5.50% of the offering price) Class C: Net Asset Value, offering and redemption price per share(b) Net Assets Shares of beneficial interest outstanding (unlimited number of shares, no par value common stock authorized) Class I: Net Asset Value, offering and redemption price per share Net Assets Shares of beneficial interest outstanding (unlimited number of shares, no par value common stock authorized) $ $ $ (b) 7.60 14,393,110 1,894,449 8.04 $ $ 7.54 8,290,640 1,100,131 $ $ 7.66 4,472,234 583,877 (a) 35,019,545 (651,915) (2,421,153) (4,790,493) 27,155,984 Any net deferred tax asset was fully offset by a 100% valuation allowance. Redemption price per share may be reduced for any applicable contingent deferred sales charge. For a description of a possible sales charge, please see the Fund's Prospectus. See Notes to Financial Statements. 9 | October 31, 2015 . ALPS | Alerian MLP Infrastructure Index Fund Statement of Operations For the Year Ended October 31, 2015 INVESTMENT INCOME Dividends Distributions from master limited partnerships Less return of capital distributions Total Investment Income $ 150 1,783,256 (1,783,256) 150 EXPENSES Investment advisory fees Administrative fees Transfer agency fees Distribution and service fees Class A Class C Professional fees Reports to shareholders and printing fees State registration fees SEC registration fees Insurance fees Franchise tax expenses Custody fees Trustees' fees and expenses Miscellaneous expenses Total Expenses Less fees waived/reimbursed by investment advisor (Note 8) Class A Class C Class I Net Expenses Net Investment Loss, Before Income Taxes Income tax expense Income tax expense †Class A Income tax expense †Class C Net Investment Loss, Net of Income Taxes REALIZED AND UNREALIZED GAIN/(LOSS) Net realized loss on investments, before income taxes Income tax expense Net Realized Loss on investments, Net of Income Taxes Net change in unrealized depreciation on investment, before deferred income taxes Income tax benefit Net Change in Unrealized Depreciation on Investments NET REALIZED AND UNREALIZED LOSS ON INVESTMENTS, NET OF INCOME TAXES See Notes to Financial Statements. 10 | October 31, 2015 54,871 90,921 84,911 7,759 42,831 1,303 287 2,385 14,125 677 16,727 554,601 (74,023) (48,445) (34,034) 398,099 (397,949) (60,756) (15,096) (15,409) (489,210) (2,029,855) (22,374) (2,052,229) NET DECREASE IN NET ASSETS RESULTING FROM OPERATIONS 205,873 30,998 933 $ (8,253,358) 1,238,743 (7,014,615) (9,066,844) (9,556,054) . ALPS | Alerian MLP Infrastructure Index Fund Statements of Changes in Net Assets For the Year Ended October 31, 2015 For the Fiscal Period Ended October 31, 2014(a) For the Year Ended April 30, 2014 OPERATIONS Net investment loss, net of income taxes Net realized gain/(loss) on investments, net of income taxes Net change in unrealized appreciation/(depreciation) on investments, net of deferred income taxes Net Increase/(Decrease) in Net Assets Resulting from Operations $ (489,210) $ (2,052,229) (84,514) $ 3,372 (70,565) (40,286) (7,014,615) (9,556,054) 902,714 821,572 918,233 807,382 DISTRIBUTIONS Distributions to shareholders from net investment income Class A Class C Class I Distributions to shareholders from tax return of capital Class A Class C Class I Net Decrease in Net Assets from Distributions (4,150) (2,627) (1,614) (1,160,636) (734,478) (451,330) (2,354,835) (26,390) (32,401) (36,117) (422,657) (205,706) (200,052) (923,323) (137,326) (42,694) (47,927) (120,029) (41,147) (74,680) (463,803) BENEFICIAL INTEREST TRANSACTIONS (NOTE 6) Shares sold Class A Class C Class I Distributions reinvested Class A Class C Class I Shares redeemed Class A Class C Class I Net Increase in Net Assets Derived from Beneficial Interest Transactions Net increase in net assets NET ASSETS Beginning of year End of year * *Including accumulated net investment loss, net of deferred income taxes, of: (a) 12,474,282 8,002,639 7,103,832 1,105,212 721,890 448,126 (4,057,509) (3,615,264) (7,165,800) 15,017,408 3,106,519 24,049,465 $ 27,155,984 $ (651,915) $ $ 3,317,091 3,457,848 5,196,869 427,003 178,058 219,273 (1,375,093) (245,100) (184,339) 10,991,610 10,889,859 13,159,606 24,049,465 (162,705) Effective May 1, 2014, the Board approved changing the fiscal year-end of the Funds from April 30 to October 31. See Notes to Financial Statements. 11 | October 31, 2015 $ $ 9,171,152 3,336,491 1,646,324 240,424 58,350 118,124 (2,345,899) (621,954) (2,533,055) 9,069,957 9,413,536 3,746,070 13,159,606 (78,191) . ALPS | Alerian MLP Infrastructure Index Fund – Class A Financial Highlights Selected data for a share of beneficial interest outstanding throughout the periods indicated: For the Year Ended October 31, 2015 $11.32 DISTRIBUTIONS: From net investment income From tax return of capital Total distributions Net increase/(decrease) in net asset value Net asset value, end of year TOTAL RETURN(d) (0.05) 0.67 0.62 (0.03) (0.50) (0.53) 0.09 $11.32 (0.09) 0.90 0.81 (0.36) (0.32) (0.68) 0.13 $11.23 (0.03) 1.29 1.26 – (0.16) (0.16) 1.10 $11.10 (27.23)% Net investment loss(b) Net realized and unrealized gain/(loss) Total from investment operations For the Year Ended April 30, 2014 $11.10 For the Period January 2, 2013 (Commencement) to April 30, 2013 $10.00 (0.15) (2.83) (2.98) (c) (0.00) (0.74) (0.74) (3.72) $7.60 Net asset value, beginning of period INCOME/(LOSS) FROM INVESTMENT OPERATIONS: For the Fiscal Period Ended October 31, 2014(a) $11.23 5.61% 7.59% 12.68% $14,393 $10,619 $8,223 $928 1.77% (0.53%) 2.20%(e) (e) (0.97%) 3.09% (1.84%) 5.51%(e)(f) (4.26%)(e)(f) 1.24%(g) 1.23%(e)(g) 1.25% 1.25%(e)(f) (4.03%) (2.79%) 4.49%(e) 5.72%(e) 5.38% 6.63% 20.55%(e) 21.80%(e) (1.77%) (0.53%) (e) (2.20%) (e) (0.97%) (3.09%) (1.84%) (5.51%)(e)(f) (4.26%)(e)(f) (1.24%)(g) (1.23%)(e)(g) (1.25%) (1.25%)(e)(f) RATIOS/SUPPLEMENTAL DATA: Net assets, end of year (000s) Ratio of expenses to average net assets before waivers, franchise tax expense and income tax expense/benefit Ratio of expense waivers to average net assets Ratio of expenses to average net assets net of waivers before franchise tax expense and income tax expense/benefit Ratio of franchise tax expense and income tax expense/(benefit) to average net assets(h) Ratio of total expenses to average net assets Ratio of investment loss to average net assets before waivers, franchise tax expense and income tax expense/benefit Ratio of expense waivers to average net assets Ratio of investment loss to average net assets net of waivers before franchise tax expense and income tax expense/benefit Ratio of franchise tax expense and income tax (expense)/benefit to average net assets(i) Ratio of net investment loss to average net assets Portfolio turnover rate(j) (0.34%) (1.58%) 52% 0.43%(e) (0.80%)(e) 7% See Notes to Financial Statements. 12 | October 31, 2015 0.43% (0.82%) 63% 0.40%(e) (0.85%)(e) 3% . ALPS | Alerian MLP Infrastructure Index Fund – Class A Financial Highlights Selected data for a share of beneficial interest outstanding throughout the periods indicated: (a) (c) (d) (b) (e) (g) (f) (h) (i) (j) Effective May 1, 2014, the Board approved changing the fiscal year-end of the Funds from April 30 to October 31. Calculated using the average shares method. Less than $0.005 per share. Total returns are for the period indicated and have not been annualized. Total returns would have been lower had certain expenses not been waived during the period. Returns shown do not reflect the deduction of taxes that a shareholder would pay on Fund distributions or the redemption of Fund shares. Returns shown exclude any applicable sales charges. Annualized. Expense ratios before reductions for startup periods may not be representative of longer term operating periods. According to the Fund's shareholder services plan with respect to the Fund's Class A shares, any amount of such payment not paid during the Fund's fiscal year for such service activities shall be reimbursed to the Fund as soon as practical after the end of the fiscal year.
Fees were reimbursed to the Fund during the period ended October 31, 2015 and October 31, 2014, for the prior fiscal year in the amount of 0.01% and 0.02% (annualized) of average net assets of Class A shares respectively. Adjustment for income tax expense/(benefit) for the ratio calculation is derived from the net investment loss, and realized and unrealized gains/losses. Adjustment for income tax (expense)/benefit for the ratio calculation is derived from net investment loss only. Portfolio turnover rate for periods less than one full year have not been annualized. See Notes to Financial Statements. 13 | October 31, 2015 . ALPS | Alerian MLP Infrastructure Index Fund – Class C Financial Highlights Selected data for a share of beneficial interest outstanding throughout the periods indicated: For the Year Ended October 31, 2015 $11.23 For the Year Ended April 30, 2014 $11.09 For the Period January 2, 2013 (Commencement) to April 30, 2013 $10.00 (0.22) (2.73) (2.95) (c) (0.00) (0.74) (0.74) (3.69) $7.54 (0.07) 0.66 0.59 (0.08) (0.45) (0.53) 0.06 $11.23 (0.13) 0.89 0.76 (0.35) (0.33) (0.68) 0.08 $11.17 (0.05) 1.30 1.25 – (0.16) (0.16) 1.09 $11.09 (27.18)% 5.37% 7.13% 12.58% $8,291 $6,773 $3,429 $563 2.38% (0.53%) 2.82%(e) (e) (0.97%) 3.71% (1.86%) 7.01%(e)(f) (5.16%)(e)(f) 1.85% 1.85%(e) 1.85% 1.85%(e)(f) (4.09%) (2.24%) Net asset value, beginning of period For the Fiscal Period Ended October 31, 2014(a) $11.17 4.27%(e) 6.12%(e) 5.16% 7.01% 20.55%(e) 22.40%(e) (2.38%) (0.53%) (2.82%)(e) (e) (0.97%) (3.71%) (1.86%) (7.01%)(e)(f) (5.16%)(e)(f) (1.85%) (1.85%)(e) (1.85%) (1.85%)(e)(f) (0.40%) (2.25%) 52% 0.65%(e) (1.20%)(e) 7% 0.65% (1.20%) 63% INCOME/(LOSS) FROM INVESTMENT OPERATIONS: Net investment loss(b) Net realized and unrealized gain/(loss) Total from investment operations DISTRIBUTIONS: From net investment income From tax return of capital Total distributions Net increase/(decrease) in net asset value Net asset value, end of year TOTAL RETURN(d) RATIOS/SUPPLEMENTAL DATA: Net assets, end of year (000s) Ratio of expenses to average net assets before waivers, franchise tax expense and income tax expense/benefit Ratio of expense waivers to average net assets Ratio of expenses to average net assets net of waivers before franchise tax expense and income tax expense/benefit Ratio of franchise tax expense and income tax expense/(benefit) to average net assets(g) Ratio of total expenses to average net assets Ratio of investment loss to average net assets before waivers, franchise tax expense and income tax expense/benefit Ratio of expense waivers to average net assets Ratio of investment loss to average net assets net of waivers before franchise tax expense and income tax expense/benefit Ratio of franchise tax expense and income tax (expense)/benefit to average net assets(h) Ratio of net investment loss to average net assets Portfolio turnover rate(i) (a) (c) (d) (b) (e) (g) (f) (h) (i) 0.40%(e) (1.45%)(e) 3% Effective May 1, 2014, the Board approved changing the fiscal year-end of the Funds from April 30 to October 31. Calculated using the average shares method. Less than $0.005 per share. Total returns are for the period indicated and have not been annualized. Total returns would have been lower had certain expenses not been waived during the period. Returns shown do not reflect the deduction of taxes that a shareholder would pay on Fund distributions or the redemption of Fund shares. Returns shown exclude any applicable sales charges. Annualized. Expense ratios before reductions for startup periods may not be representative of longer term operating periods. Adjustment for income tax expense/(benefit) for the ratio calculation is derived from the net investment loss, and realized and unrealized gains/losses. Adjustment for income tax (expense)/benefit for the ratio calculation is derived from net investment loss only. Portfolio turnover rate for periods less than one full year have not been annualized. See Notes to Financial Statements. 14 | October 31, 2015 .
ALPS | Alerian MLP Infrastructure Index Fund – Class I Financial Highlights Selected data for a share of beneficial interest outstanding throughout the periods indicated: For the Year Ended October 31, 2015 $11.36 For the Year Ended April 30, 2014 $11.11 For the Period January 2, 2013 (Commencement) to April 30, 2013 $10.00 (0.11) (2.85) (2.96) (c) (0.00) (0.74) (0.74) (3.70) $7.66 (0.03) 0.67 0.64 (0.04) (0.49) (0.53) 0.11 $11.36 (0.06) 0.88 0.82 (0.27) (0.41) (0.68) 0.14 $11.25 (0.02) 1.29 1.27 – (0.16) (0.16) 1.11 $11.11 (26.95)% 5.78% 7.68% 12.78% $4,472 $6,658 $1,507 $2,256 1.38% (0.53%) 1.81%(e) (e) (0.96%) 3.03% (2.18%) 6.01%(e)(f) (5.16%)(e)(f) 0.85% 0.85%(e) 0.85% 0.85%(e)(f) (3.92%) (3.07%) Net asset value, beginning of period For the Fiscal Period Ended October 31, 2014(a) $11.25 4.63%(e) 5.48%(e) 5.53% 6.38% 20.55%(e) 21.40%(e) (1.38%) (0.53%) (1.81%)(e) (e) (0.96%) (3.03%) (2.18%) (6.01%)(e)(f) (5.16%)(e)(f) (0.85%) (0.85%)(e) (0.85%) (0.85%)(e)(f) (0.23%) (1.08%) 52% 0.28%(e) (0.57%)(e) 7% 0.29% (0.56%) 63% INCOME/(LOSS) FROM INVESTMENT OPERATIONS: Net investment loss(b) Net realized and unrealized gain/(loss) Total from investment operations DISTRIBUTIONS: From net investment income From tax return of capital Total distributions Net increase/(decrease) in net asset value Net asset value, end of year TOTAL RETURN(d) RATIOS/SUPPLEMENTAL DATA: Net assets, end of year (000s) Ratio of expenses to average net assets before waivers, franchise tax expense and income tax expense/benefit Ratio of expense waivers to average net assets Ratio of expenses to average net assets net of waivers before franchise tax expense and income tax expense/benefit Ratio of franchise tax expense and income tax expense/(benefit) to average net assets(g) Ratio of total expenses to average net assets Ratio of investment loss to average net assets before waivers, franchise tax expense and income tax expense/benefit Ratio of expense waivers to average net assets Ratio of investment loss to average net assets net of waivers before franchise tax expense and income tax expense/benefit Ratio of franchise tax expense and income tax (expense)/benefit to average net assets(h) Ratio of net investment loss to average net assets Portfolio turnover rate(i) (a) (c) (d) (b) (e) (g) (f) (h) (i) 0.40%(e) (0.45%)(e) 3% Effective May 1, 2014, the Board approved changing the fiscal year-end of the Funds from April 30 to October 31. Calculated using the average shares method. Less than $0.005 per share. Total returns are for the period indicated and have not been annualized. Total returns would have been lower had certain expenses not been waived during the period. Returns shown do not reflect the deduction of taxes that a shareholder would pay on Fund distributions or the redemption of Fund shares. Annualized. Expense ratios before reductions for startup periods may not be representative of longer term operating periods. Adjustment for income tax expense/(benefit) estimate for the ratio calculation is derived from the net investment loss, and realized and unrealized gains/losses. Adjustment for income tax (expense)/benefit for the ratio calculation is derived from net investment loss only. Portfolio turnover rate for periods less than one full year have not been annualized. See Notes to Financial Statements. 15 | October 31, 2015 . ALPS | CoreCommodity Management CompleteCommodities® Strategy Fund Management Commentary October 31, 2015 (Unaudited) The twelve month period ending on October 31, 2015 produced negative returns for commodities. Commodity futures prices, as measured by the diversified Bloomberg Commodities Total Return Index, were down (25.72%). Thomson Reuters/CoreCommodity CRB Total Return Index was down (28.05%) for the same period. Commodity equities also declined during the period, down (21.44%) as measured by the Standard and Poor’s Global Natural Resources Net Total Return Index. Commodity equities diverged notably from the performance of the broader Standard & Poor’s 500 Total Return Index for the period which posted +5.20% gains. The ALPS CoreCommodity Management Complete Commodities® Strategy Fund (JCRIX)(the “Fund”) delivered a net negative return of â€24.88% (JCRAX was †29.35% at MOP and JCRCX was down â€26.41% with CDSC). The Fund outperformed its benchmark, the Bloomberg Commodity Total Return Index, by 84 basis points during this period (measured against the performance of the “I” shares). The Fund employs a strategy that combines an actively managed portfolio of commodity futures related exposure (collateralized by U.S. Treasury Inflation Protected Securities – TIPS), commodity equities, and physical commodity ETF’s. At the end of October, the Fund allocated approximately 65% of its assets toward commodity futures related investments and approximately 35% of its assets in commodity equities. The Fund was more than 99% invested at the end of the period. Commodity prices were under considerable pressure during the twelve month period ended October 31, 2015. Cocoa was the only major commodity constituent to appreciate for the period, up 12.42%. Cocoa was supported by robust global demand and production difficulties in the key West African nations of the Ivory Coast, Ghana, Nigeria, Cameroon, and Togo. The most noteworthy decline in the price of commodities occurred in crude oil. West Texas Intermediate (WTI), the US benchmark crude, fell (42.15%) in the twelve month period ending in October. Natural gas prices posted nearly similar losses (40.07%). Crude oil product prices dropped as well, but not quite as sharply; heating oil down (39.60%) and reformulated gasoline (36.14%). Decisions that were made last November by OPEC and voiced by Saudi Arabia during our 2014 Thanksgiving holiday had a meaningful effect on an already oversupplied and declining energy complex. No production cuts were called for by OPEC and prices recoiled further. Reductions in energy costs weighed on the cost of production for other commodities. Global gross domestic product (GDP) growth was challenged by a variety of factors. The decline in growth rates led to hiring slowdowns, reductions in wages, and smaller amounts of disposable incomes. The effects could be felt throughout the commodity asset class. Industrial metals like nickel, essential in the manufacturing of stainless steel (36.22%), copper (23.94%), and aluminum (29.08%) clearly reflect the lowered demand and high inventory pressure. Calm weather conditions without any major disruptions around the globe led to high yields and lowered prices for many agricultural commodities. Fertilizer and seed costs were negatively impacted by energy price reductions. Soybean prices fell (15.58%), wheat dropped (11.42%) and corn prices declined by (8.26%). Coffee prices (35.66%), were hurt by expanding supplies and currency devaluations of more than 40% in Brazil, the leading producer of premium coffee in the world. Protein prices, represented by lean hogs (32.75%) and live cattle (14.65%), were pushed lower in part by reductions in feed costs. The US Dollar strengthened significantly during the year ending in October, up +11.55% as measured by the US Dollar Index (DXY). Since most commodities are priced in Dollars, commodity prices tend to be inversely related to Dollar moves. The strength of the Dollar was certainly a contributing factor in the slide of commodity prices over the same time frame. With that thought in mind, precious metals – gold (2.58%) and silver (3.35%) – performed better than most other commodities. In fact, precious metal prices were up relative to other weaker currencies. The Fund’s top equity holdings at the end of October 2015 included Sanderson Farms Inc (SAFM) (17.27%) YTD, Hormel Foods Corp. (HRL) +29.65% YTD, Pilgrim’s Pride (PPC) (42.09%) YTD, Monsanto (MON) (21.97%) YTD, Yara International (YAR NO) +15.55% YTD, Sociedad Quimica Minera de Chile (SQM) (18.84%) YTD, Calâ€Maine Foods (CALM) +36.97% YTD, Kubota Corp (6326 JP) +7.38% YTD, Dril†Quip Inc (DRQ) (19.77%) YTD, Weyerhauser Co (WY) (18.28%), YTD. TIPS and nominal US Treasuries are held by the Fund to invest excess cash and as collateral for commodity futures related investments held in our Cayman Island subsidiary. Nominal yields on the benchmark 10 year note were at 2.335% at the end of October 2014 and ended the twelve month period lower, 2.142%. Committee members of the FOMC, including Chairman Yellen, have recently voiced their desire to begin to raise and normalize interest rates, if certain data justifies the move. We believe we may be nearing the end of what has been a significant multiâ€year rally in US treasury prices. As a result, we continue to invest in TIPS with limited duration exposure. At the end of October, our weighted average maturity was approximately 1.10 years in our TIPS portfolio. We strongly believe that the long term fundamental drivers of commodity demand and ultimately higher prices are still in place. Population growth is likely to remain unabated regardless of the economic environment in the US and Europe. A billion more people are likely to be added to the world population over the next decade or so. The trend of wealth distribution is tipping toward the developing world as those economies grow at faster rates relative to the slow or negative growth occurring in the developed countries. The improving global quality of life is contributing to ever increasing demand for raw materials and food. Incremental gains in disposable income in the developing nations have led to competition for the commodities needed for more complex and costly lifestyles. The recent significant decline in prices of many commodities has resulted in serious curtailment of capital expenditures of global sovereign and corporate producers. Profits for these producers have 16 | October 31, 2015 . ALPS | CoreCommodity Management CompleteCommodities® Strategy Fund Management Commentary October 31, 2015 (Unaudited) been dramatically reduced and in some cases prices do not support marginal or ongoing operations. As a result, future supplies may be negatively impacted. In a world with limited supplies of food, fuel, building materials, and other necessities of life, price may become the ultimate allocator of these commodities. Additionally, the aggressively accommodative central bank monetary policies recently announced coupled with measures already in place globally are likely to make commodities and other real assets more attractive over time as currencies, including the US Dollar, may decline in value. Robert Hyman Portfolio Manager Standard & Poor’s 500 Index is a composite index of 500 stocks, a widely recognized, unmanaged index of common stock prices which does not reflect any deduction for fees, expenses, or taxes. An investor may not invest directly in an index. The Standard & Poor’s Global Natural Resources Index includes 90 of the largest publicly-traded companies in natural resources and commodities businesses that meet specific investability requirements, offering investors diversified and investable equity exposure across 3 primary commodity-related sectors: agribusiness, energy, and metals & mining. The views of the author and information discussed in this commentary are as of the date of publication, are subject to change, and may not reflect the writer's current views. The views expressed are those of the author only, and represent an assessment of market conditions at a specific point in time, are opinions only and should not be relied upon as investment advice regarding a particular investment or markets in general. Such information does not constitute a recommendation to buy or sell specific securities or investment vehicles.
It should not be assumed that any investment will be profitable or will equal the performance of the fund(s) or any securities or any sectors mentioned in this letter. The subject matter contained in this letter has been derived from several sources believed to be reliable and accurate at the time of compilation. Neither ALPS Advisors, Inc., CoreCommodity Management, LLC, nor the Fund accepts any liability for losses either direct or consequential caused by the use of this information. Diversification cannot guarantee gain or prevent losses. 17 | October 31, 2015 . ALPS | CoreCommodity Management CompleteCommodities® Strategy Fund Performance Update October 31, 2015 (Unaudited) Performance of $10,000 Initial Investment (as of October 31, 2015) Comparison of change in value of a $10,000 investment (includes maximum sales charges of 5.50%) $16k $14k $12k ALPS | CoreCommodity Management CompleteCommodities® Strategy Fund Class A (NAV) - $8,203 $10k ALPS | CoreCommodity Management CompleteCommodities® Strategy Fund Class A (MOP) - $7,754 $8k TR/CC CRB Total Return Index - $7,659 Bloomberg Commodity TR Index - $7,062 10/31/15 10/31/14 10/31/13 10/31/12 10/31/11 10/31/10 6/29/10^ $6k The chart above represents historical performance of a hypothetical investment of $10,000 in the Fund since inception. Past performance does not guarantee future results. This chart does not reflect the deduction of taxes that a shareholder would pay on Fund distributions or the redemption of Fund shares. Average Annual Total Returns (as of October 31, 2015) 6 Month 3 Year 5 Year Since Inception^ â€25.21% â€12.60% â€7.23% â€3.64% â€20.47% â€29.35% â€14.25% â€8.26% â€4.65% â€16.21% â€25.67% â€13.14% â€7.82% â€4.20% â€17.04% â€26.41% â€13.14% â€7.82% â€4.20% â€15.68% 1 1 Year â€15.88% Class A (NAV) Class A (MOP) Class C (NAV) Class C (CDSC) Class I â€24.88% â€12.31% â€6.96% â€3.33% TR/CC CRB Total Return Index â€14.75% â€28.05% â€12.84% â€8.19% â€4.87% Bloomberg Commodity TR Index1 â€15.72% â€25.72% â€15.04% â€9.85% â€6.31% Total Expense Ratio What You Pay* 1.46% 1.45% 2.07% 2.05% 1.16% 1.15% Performance data quoted represents past performance. Past performance does not guarantee future results.
Investment return and principal value of an investment will fluctuate so that an investor's shares, when sold or redeemed, may be worth more or less than the original cost. Current performance data may be higher or lower than actual data quoted. For the most current month-end performance data, please call 1-866-759-5679. Maximum Offering Price (MOP) for Class A shares includes the Fund’s maximum sales charge of 5.50%.
Performance shown at NAV does not include these sales charges and would have been lower had it been taken into account. If you invest $1 million or more, either as a lump sum or through the Fund’s accumulation or letter of intent programs, you can purchase Class A shares without an initial sales charge (load). A Contingent Deferred Sales Charge (“CDSC”) of 1.00% may apply to Class C shares redeemed within the first 12 months after a purchase, and on Class A shares redeemed within the first 18 months after a purchase in excess of $1 million.
The Fund imposes a 2.00% redemption fee on shares held for less than 30 days. Performance less than 1 year is cumulative. 18 | October 31, 2015 . ALPS | CoreCommodity Management CompleteCommodities® Strategy Fund Performance Update October 31, 2015 (Unaudited) 1 Thomson Reuters/CC CRB Total Return Index and the Bloomberg Commodity TR Index (formerly the Dow Jones-UBS Commodity Index) are unmanaged indices used as a measurement of change in commodity market conditions based on the performance of a basket of different commodities. Each index is composed of a different basket of commodities, a different weighting of the commodities in the basket, and a different re-balancing schedule. The indices are not actively managed and do not reflect any deduction for fees, expenses or taxes. An investor may not invest directly in an index. ^ Fund Inception date of June 29, 2010. * What You Pay reflects the Advisor’s decision to contractually limit expenses through February 29, 2016.
Please see the prospectus for additional information. Investments in securities of MLPs involve risks that differ from an investment in common stock. MLPs are controlled by their general partners, which generally have conflicts of interest and limited fiduciary duties to the MLP, which may permit the general partner to favor its own interests over the MLPs. The benefit you are expected to derive from the Fund’s investment in MLPs depends largely on the MLPs being treated as partnerships for federal income tax purposes.
As a partnership, an MLP has no federal income tax liability at the entity level. Therefore, treatment of one or more MLPs as a corporation for federal income tax purposes could affect the Fund’s ability to meet its investment objective and would reduce the amount of cash available to pay or distribute to you. Legislative, judicial, or administrative changes and differing interpretations, possibly on a retroactive basis, could negatively impact the value of an investment in MLPs and therefore the value of your investment in the Fund. Investing in commodity-related securities involves risk and considerations not present when investing in more conventional securities.
The Fund may be more susceptible to high volatility of commodity markets. Derivatives generally are more sensitive to changes in economic or market conditions than other types of investments; this could result in losses that significantly exceed the Fund's original investment. The table does not reflect the deduction of taxes that a shareholder would pay on Fund distributions or the redemption of Fund shares. This Fund is not suitable for all investors, and is subject to investment risks, including possible loss of the principal amount invested. There is no guarantee that the Fund will continue to hold any one particular security or stay invested in any one particular company. The composition of the Fund's top holdings is subject to change. Performance figures are historical and reflect the change in share price, reinvested distributions, changes in net asset value, sales charges and capital gains distributions, if any. Not FDIC Insured – No Bank Guarantee – May Lose Value Asset Type Allocation (as a % of Net Assets) † † Government Bonds Common Stocks Master Limited Partnerships Purchased Options Short Term Investments and Other Assets Total 61.25% 34.97% 0.50% 0.00% 3.28% 100.00% Holdings are subject to change, and may not reflect the current or future position of the portfolio.
Table presents approximate values only. 19 | October 31, 2015 . ALPS | CoreCommodity Management CompleteCommodities® Strategy Fund Consolidated Statement of Investments Shares COMMON STOCKS (34.97%) Argentina (0.11%) YPF SA, Sponsored ADR Australia (0.83%) BHP Billiton, Ltd. BlueScope Steel, Ltd. Fortescue Metals Group, Ltd. GrainCorp, Ltd., Class A Iluka Resources, Ltd. Incitec Pivot, Ltd. Nufarm, Ltd. Regis Resources, Ltd. Sandfire Resources NL South32, Ltd.(a) South32, Ltd., ADR(a) Woodside Petroleum, Ltd. Austria (0.13%) OMV AG Voestalpine AG Bermuda (0.25%) Kosmos Energy, Ltd.(a) Nabors Industries, Ltd. Seadrill, Ltd.(a) Brazil (0.54%) BRF SA, ADR(a) Cia de Saneamento Basico do Estado de Sao Paulo, ADR(a) Cia Siderurgica Nacional SA, Sponsored ADR Gerdau SA, Sponsored ADR Petroleo Brasileiro SA, Sponsored ADR(a) Vale SA, Sponsored ADR Canada (5.90%) Advantage Oil & Gas, Ltd.(a) Agnicoâ€Eagle Mines, Ltd. Alamos Gold, Inc., Class A ARC Resources, Ltd. Argonaut Gold, Inc.(a) AuRico Metals, Inc.(a) B2Gold Corp.(a) Barrick Gold Corp. Baytex Energy Corp.(a) Birchcliff Energy, Ltd.(a) Bonavista Energy Corp. Cameco Corp. Value (Note 2) 21,316 $ 455,310 402,263 400,991 46,668 366,252 276,650 529,692 369,447 306,350 188,777 71,895 6,631 372,910 3,338,526 24,505 126,081 31,313 56,752 60,429 188,051 61,898 206,540 41,755 68,819 1,290 17,661 425,412 83,299 508,711 15,986 2,300 462,696 119,637 418,117 1,000,450 67,844 11,916 64,624 31,540 483,508 241,150 1,058,649 1,580 190,337 1,943 264,568 35,152 42,979 171,542 187,389 2,167,599 35,400 40,269 96,038 69,987 14,775 42,229 168,500 5,870 113,300 51,600 84,800 22,228 196,817 1,139,163 369,203 1,031,928 15,254 25,513 181,695 45,140 460,964 224,931 189,367 314,971 October 31, 2015 Value (Note 2) Shares Canada (continued) Canadian Energy Services & Technology Corp. Canadian Natural Resources, Ltd. Canadian Oil Sands, Ltd. Cenovus Energy, Inc. Centerra Gold, Inc. Crescent Point Energy Corp. Detour Gold Corp.(a) Eldorado Gold Corp. Encana Corp. Endeavour Silver Corp.(a) Enerplus Corp. Ensign Energy Services, Inc. First Quantum Minerals, Ltd. Francoâ€Nevada Corp. Freehold Royalties, Ltd. Goldcorp, Inc. HudBay Minerals, Inc. Husky Energy, Inc. IAMGOLD Corp.(a) Imperial Oil, Ltd. Maple Leaf Foods, Inc. MEG Energy Corp.(a) Mullen Group, Ltd. New Gold, Inc.(a) Osisko Gold Royalties, Ltd. Pacific Rubiales Energy Corp. Pan American Silver Corp. Paramount Resources, Ltd., Class A(a) Parex Resources, Inc.(a) Pason Systems, Inc. Pengrowth Energy Corp.(a) Peyto Exploration & Development Corp. Potash Corp. of Saskatchewan, Inc. Precision Drilling Corp. Primero Mining Corp.(a) Raging River Exploration, Inc.(a) Sandstorm Gold, Ltd.(a) Secure Energy Services, Inc. SEMAFO, Inc.(a) Seven Generations Energy, Ltd., Class A(a) ShawCor, Ltd. Silver Standard Resources, Inc.(a) Silver Wheaton Corp. SunCoke Energy, Inc. Suncor Energy, Inc. Tahoe Resources, Inc. Teck Resources, Ltd., Class B TORC Oil & Gas, Ltd. Tourmaline Oil Corp.(a) Turquoise Hill Resources, Ltd.(a) Vermilion Energy, Inc. 20 | October 31, 2015 57,800 $ 5,741 197,808 105,029 78,900 10,981 16,587 65,346 118,905 18,980 90,600 27,700 33,447 9,227 22,900 31,061 23,000 10,586 456 25,209 10,500 48,000 20,800 69,617 2,569 28,200 8,431 249,748 133,306 1,493,090 1,564,672 444,099 149,649 184,441 228,711 907,245 31,317 427,502 174,131 178,541 467,717 177,757 398,202 119,433 143,052 821 838,822 166,943 399,388 277,736 170,562 26,680 54,994 63,823 19,800 43,000 13,400 164,500 200,332 322,928 197,167 161,028 10,500 58,870 89,606 37,900 62,300 39,467 42,200 110,100 216,809 1,190,940 353,944 87,243 395,450 104,588 280,451 250,074 24,900 12,700 44,960 88,221 16,171 46,695 110,700 10,972 35,600 21,200 81,758 18,900 265,262 269,520 310,224 1,198,923 80,208 1,389,243 924,475 64,385 180,505 441,153 222,382 665,027 . ALPS | CoreCommodity Management CompleteCommodities® Strategy Fund Consolidated Statement of Investments Shares Canada (continued) Yamana Gold, Inc. Chile (0.45%) Sociedad Quimica y Minera de Chile SA, Sponsored ADR China (0.66%) China Petroleum & Chemical Corp., ADR China Petroleum & Chemical Corp., Class H China Shenhua Energy Co., Ltd., Class H CNOOC, Ltd. CNOOC, Ltd., Sponsored ADR Jiangxi Copper Co., Ltd., Class H PetroChina Co., Ltd., ADR PetroChina Co., Ltd., Class H Zijin Mining Group Co., Ltd., Class H Colombia (0.12%) Ecopetrol SA, Sponsored ADR Denmark (0.06%) FLSmidth & Co. A/S Finland (0.07%) Kemira OYJ Outotec OYJ France (0.14%) TOTAL SA TOTAL SA, Sponsored ADR Germany (0.21%) Aurubis AG K+S AG Salzgitter AG Great Britain (0.08%) Amec Foster Wheeler PLC John Wood Group PLC India (0.01%) Vedanta, Ltd., ADR Israel (0.06%) The Israel Corp., Ltd. Value (Note 2) 92,948 $ 203,537 23,643,126 92,915 1,800,693 464 33,445 308,358 220,807 95,369 193,001 10,885 50,082 4,087 330,045 161,438 216,393 1,237,407 66,297 321,361 258,054 560,331 151,097 2,666,299 50,903 474,416 6,011 227,594 10,739 43,438 127,303 149,509 276,812 4,886 6,996 237,186 337,417 574,603 639 20,353 10,429 42,723 513,760 301,099 857,582 13,636 18,458 149,461 169,876 319,337 9,014 53,904 785 October 31, 2015 Value (Note 2) Shares Israel (continued) Tower Semiconductor, Ltd.(a) Japan (2.31%) Hitachi Metals, Ltd. Idemitsu Kosan Co., Ltd. Inpex Corp. Iseki & Co., Ltd. Japan Petroleum Exploration Co., Ltd. JFE Holdings, Inc. Kubota Corp. Kurita Water Industries, Ltd. Maruichi Steel Tube, Ltd. Nihon Nohyaku Co., Ltd. Nihon Trim Co., Ltd. Nippon Suisan Kaisha, Ltd. Nisshin Steel Co., Ltd. Osaka Titanium Technologies Co., Ltd. Sumitomo Forestry Co., Ltd. Sumitomo Metal Mining Co., Ltd. Tokyo Steel Manufacturing Co., Ltd. Yamato Kogyo Co., Ltd. Jersey (0.45%) Petrofac, Ltd. Randgold Resources, Ltd., ADR Luxembourg (0.07%) ArcelorMittal Subsea 7 SA(a) Tenaris SA, ADR Marshall Islands (0.07%) Seadrill Partners LLC Mexico (0.25%) Grupo Lala SAB de CV Grupo Mexico SAB de CV, Series B Industrias Penoles SAB de CV Netherlands (0.24%) Frank's International NV Fugro N.V.(a) Royal Dutch Shell PLC, Class A, Sponsored ADR 202,258 21 | October 31, 2015 1,846 $ 25,233 227,491 17,900 8,931 135,133 20,907 204,559 147,209 1,293,993 34,651 10,600 12,600 112,000 70,016 20,000 105,300 4,101 200,600 29,000 319,748 200,063 1,755,134 1,591,563 515,455 689,376 153,613 676,591 300,887 8,500 37,659 21,000 232,804 454,080 262,870 248,977 179,896 9,261,469 37,000 6,700 165,162 1,649,884 1,815,046 12,709 24,673 150,776 42,182 69,316 262,274 26,951 5,410 2,743 25,493 285,776 267,937 547,880 173,627 989,444 104,900 224,783 $ 13,107 27,242 7,518 467,473 142,609 6,890 361,449 971,531 . ALPS | CoreCommodity Management CompleteCommodities® Strategy Fund Consolidated Statement of Investments Shares Norway (1.56%) Aker Solutions ASA Bakkafrost P/F Det Norske OLJ ASA(a) DNO ASA(a) Marine Harvest ASA(a) Norsk Hydro ASA Petroleum Geoâ€Services ASA Statoil ASA TGS Nopec Geophysical Co. ASA Yara International ASA Peru (0.11%) Cia de Minas Buenaventura SAA, ADR Singapore (0.32%) First Resources, Ltd. Golden Agriâ€Resources, Ltd. Olam International, Ltd. Wilmar International, Ltd. South Africa (0.50%) Anglo Platinum, Ltd.(a) Exxaro Resources, Ltd. Gold Fields, Ltd., Sponsored ADR Harmony Gold Mining Co., Ltd., Sponsored ADR(a) Impala Platinum Holdings, Ltd.(a) Kumba Iron Ore, Ltd. Sasol, Ltd. Sibanye Gold, Ltd., Sponsored ADR South Korea (0.03%) POSCO, Sponsored ADR Spain (0.03%) Acerinox SA Sweden (0.34%) Boliden AB Holmen AB, B Shares Lundin Petroleum AB(a) SSAB AB, A Shares(a) Svenska Cellulosa AB SCA, Class B Switzerland (0.53%) Glencore PLC(a) Noble Corp. PLC Syngenta AG Transocean, Ltd. Value (Note 2) 44,620 $ 178,548 3,986 128,070 28,431 174,499 295,286 296,094 108,913 1,459,993 104,109 373,220 64,335 267,887 17,750 284,527 35,976 709,210 52,450 2,380,906 6,252,954 71,096 455,725 102,200 893,758 46,254 366,661 137,152 248,815 66,035 819,223 1,271,225 5,831 35,057 489,941 102,265 145,583 1,239,551 38,989 39,295 22,220 8,185 2,515 26,368 107,388 96,208 262,116 16,423 1,995,902 2,859 114,446 10,270 111,172 7,842 11,000 16,470 41,117 16,465 150,166 331,794 238,080 148,759 485,650 1,354,449 28,003 9,174 4,716 8,890 48,566 123,574 1,587,824 140,729 October 31, 2015 Value (Note 2) Shares Switzerland (continued) Weatherford International, Ltd.(a) United Kingdom (0.84%) Anglo American PLC Antofagasta PLC BG Group PLC BHP Billiton PLC, ADR BP PLC, Sponsored ADR CNH Industrial N.V. Fresnillo PLC Kazakhmys PLC(a) Lonmin PLC(a) Severn Trent PLC United Utilities Group PLC United States (17.70%) AGCO Corp. Allegheny Technologies, Inc. Allied Nevada Gold Corp.(a)(b) American States Water Co. American Vanguard Corp. American Water Works Co., Inc. The Andersons, Inc. Antero Resources Corp.(a) Apache Corp. Aqua America, Inc. Archerâ€Danielsâ€Midland Co. Atwood Oceanics, Inc. Baker Hughes, Inc. Boulder Brands, Inc.(a) BP Prudhoe Bay Royalty Trust Bristow Group, Inc. Bunge, Ltd. Calgon Carbon Corp. California Resources Corp. California Water Service Group Calâ€Maine Foods, Inc. Cameron International Corp.(a) Carpenter Technology Corp. Carrizo Oil & Gas, Inc.(a) Century Aluminum Co.(a) CF Industries Holdings, Inc. Chesapeake Energy Corp. Chevron Corp. Cimarex Energy Co. Civeo Corp. Cliffs Natural Resources, Inc. Coeur Mining, Inc.(a) Commercial Metals Co. ConocoPhillips Continental Resources, Inc.(a) Core Laboratories N.V. CST Brands, Inc. 22 | October 31, 2015 20,498 $ 209,899 2,110,592 6,469 13,306 17,867 3,227 21,309 36,636 14,550 11,431 32,588 18,234 64,416 54,510 107,999 282,324 104,071 760,731 248,758 163,741 20,459 12,811 630,498 981,618 3,367,520 33,294 5,767 28,885 12,117 9,167 3,695 23,477 17,644 4,465 18,258 13,777 25,676 3,155 106,740 5,689 9,527 2,390 20,375 5,559 12,143 33,172 17,026 5,307 1,829 28,070 15,723 39,687 8,502 3,872 14,255 7,741 22,697 24,641 5,846 143 9,180 1,278 1,611,097 84,775 1,127 493,768 122,929 211,945 831,086 415,869 210,435 522,179 629,058 424,938 166,205 945,716 223,578 330,873 174,374 350,450 22,458 271,518 1,773,375 1,157,938 176,776 68,825 101,613 798,257 282,968 772,662 457,128 26,514 21,365 61,282 354,091 311,884 4,849 1,067,909 45,919 . ALPS | CoreCommodity Management CompleteCommodities® Strategy Fund Consolidated Statement of Investments Shares United States (continued) Darling Ingredients, Inc.(a) Deere & Co. Devon Energy Corp. Diamond Offshore Drilling, Inc. Diamondback Energy, Inc.(a) Drilâ€Quip, Inc.(a) Energen Corp. Ensco PLC, Class A EOG Resources, Inc. EP Energy Corp., Class A(a) EQT Corp. Exterran Holdings, Inc. Exxon Mobil Corp. First Majestic Silver Corp.(a) FMC Corp. FMC Technologies, Inc.(a) Forum Energy Technologies, Inc.(a) Freeportâ€McMoRan, Inc. Halliburton Co. Harsco Corp. Hecla Mining Co. Helix Energy Solutions Group, Inc.(a) Helmerich & Payne, Inc. Hess Corp. HollyFrontier Corp. Hormel Foods Corp. Ingredion, Inc. Intrepid Potash, Inc.(a) Joy Global, Inc. Kaiser Aluminum Corp. Kinder Morgan, Inc. Laredo Petroleum, Inc.(a) Lindsay Corp. Marathon Oil Corp. Marathon Petroleum Corp. Matador Resources Co.(a) McEwen Mining, Inc. Memorial Resource Development Corp.(a) Monsanto Co. The Mosaic Co. Murphy Oil Corp. National Oilwell Varco, Inc. Newfield Exploration Co.(a) Newmont Mining Corp. Newpark Resources, Inc.(a) Noble Energy, Inc. NOW, Inc.(a) Occidental Petroleum Corp. Oceaneering International, Inc. Oil States International, Inc.(a) Paragon Offshore PLC Pattersonâ€UTI Energy, Inc. PDC Energy, Inc.(a) Peabody Energy Corp. Value (Note 2) 18,472 $ 186,937 6,627 516,906 5,560 233,131 3,190 63,417 2,929 216,277 27,052 1,665,321 12,697 738,331 9,480 157,652 3,824 328,290 39,837 219,502 230,783 3,493 18,986 412,756 13,502 1,117,155 40,390 133,691 15,273 621,764 26,399 893,078 25,706 340,605 6,163 72,539 564 21,646 21,983 235,878 101,198 209,480 73,603 9,209 13,655 28,340 72,879 9,393 32,370 19,293 1,761 5,763 39,853 17,871 56,926 31,343 18,153 29,851 425,425 518,190 767,548 1,387,810 4,922,976 892,899 124,948 331,454 143,152 157,618 457,512 1,211,296 1,046,300 1,623,567 466,714 26,872 31,199 39,699 37,615 29,118 17,661 15,964 84 24,549 4,222 1,643 5,631 32,913 32,770 3,058 17,623 5,676 491 551,910 3,700,741 1,271,011 827,825 664,760 641,593 1,635 138,947 151,317 27,126 419,735 1,383,004 983,428 734 262,406 342,490 6,280 October 31, 2015 Value (Note 2) Shares United States (continued) Phillips 66 Pilgrim's Pride Corp. Pioneer Natural Resources Co. Plum Creek Timber Co., Inc. REIT Potash Corp. REIT Rayonier, Inc. REIT Reliance Steel & Aluminum Co. Royal Gold, Inc. RPC, Inc. RSP Permian, Inc.(a) Sanderson Farms, Inc. Schlumberger, Ltd. Seventy Seven Energy, Inc.(a) Southern Copper Corp. Southwestern Energy Co.(a) Steel Dynamics, Inc. Stillwater Mining Co.(a) Superior Energy Services, Inc. Synergy Resources Corp.(a) Tyson Foods, Inc., Class A Valero Energy Corp. Walter Energy, Inc.(a) Weyerhaeuser Co. REIT Whiting Petroleum Corp.(a) Worthington Industries, Inc. TOTAL COMMON STOCKS (Cost $168,537,684) MASTER LIMITED PARTNERSHIPS (0.50%) United States (0.50%) Alliance Resource Partners LP Breitburn Energy Partners LP Buckeye Partners LP CVR Partners LP Energy Transfer Partners LP 11/10/15 Enterprise Products Partners LP Magellan Midstream Partners LP MarkWest Energy Partners LP Memorial Production Partners LP Plains All American Pipeline LP Rentech Nitrogen Partners LP Vanguard Natural Resources LLC Williams Partners LP TOTAL MASTER LIMITED PARTNERSHIPS (Cost $2,603,105) 23 | October 31, 2015 10,779 $ 959,870 228,386 4,337,050 1,605 220,110 4,614 187,974 31,180 974,063 36,867 835,038 3,847 230,666 2,115 101,182 107,192 1,182,328 14,082 386,128 76,894 5,344,902 12,112 946,674 592 675 12,204 338,783 12,696 140,164 17,923 331,038 112 1,046 13,527 191,542 41,496 464,340 4,769 211,553 20,330 1,340,154 68,768 4,298 56,586 1,659,667 2,961 51,018 15,573 478,091 70,940,449 140,152,427 14,363 63,482 977 19,930 307,943 145,374 66,270 181,761 2,591 10,676 2,054 1,427 37,657 3,090 7,631 34,876 1,242 114,418 294,978 131,066 62,331 210,126 98,015 90,427 275,172 41,980 2,019,861 2,019,861 . ALPS | CoreCommodity Management CompleteCommodities® Strategy Fund Consolidated Statement of Investments October 31, 2015 (d) Principal Amount Value (Note 2) GOVERNMENT BONDS (61.25%) U.S. Treasury Bonds (61.25%) United States Treasury Inflation Indexed Bonds 2.000%, 1/15/16 $ 16,270,569 $ 16,259,017 0.125%, 4/15/16(c) 68,022,360 67,610,076 2.500%, 7/15/16 2,183,222 2,225,494 0.875%, 11/30/16 25,000,000 25,107,100 2.375%, 1/15/17(c) 10,340,750 10,638,584 1.000%, 3/31/17(c) 36,000,000 36,211,860 0.125%, 4/15/17(c) 15,214,705 15,209,745 0.750%, 6/30/17(c) 45,000,000 45,072,945 2.625%, 7/15/17(c) 14,661,353 15,382,676 1.625%, 1/15/18 11,376,200 11,791,773 245,509,270 TOTAL GOVERNMENT BONDS 245,509,270 (Cost $247,612,383) Expiration Exercise Number of Value Date Price Contracts (Note 2) PURCHASED OPTIONS (0.00%) Purchased Call Options (0.00%) WTI Crude Future: 11/17/15 $80.00 500 $ 5,000 2,250 11/17/15 100.00 225 7,250 Total Purchased Call Options (Cost $1,373,465) 7,250 7-Day Value Yield Shares (Note 2) SHORT TERM INVESTMENTS (1.20%) Money Market Fund (1.20%) Dreyfus Treasury Prime Cash Management Fund, Institutional Shares 0.00004% 4,793,239 $ 4,793,239 TOTAL SHORT TERM INVESTMENTS 4,793,239 (Cost $4,793,239) TOTAL INVESTMENTS (97.92%) (Cost $424,919,876) $ 392,482,047 Other Assets In Excess Of Liabilities (2.08%)(d) 8,327,400 NET ASSETS †100.00% $ 400,809,447 Includes cash which is being held as collateral for total return swap contracts, future contracts and written options in the amount of $595,033. Common Abbreviations: A/S - Aktieselskab is the Danish equivalent for the term Stock Company. AB - Aktiebolag is the Swedish equivalent of the term corporation. ADR - American Depositary Receipt. AG - Aktiengesellschaft is a German term that refers to a corporation that is limited by shares, i.e., owned by shareholders. ASA - Allmennaksjeselskap is the Norwegian term for public limited company. Ltd. - Limited. LP - Limited Partnership. N.V. - Naamloze vennootschap is the Dutch term for a public limited liability corporation. OYJ - Osakeyhtio is the Finnish equivalent of a public limited company. PLC - Public Limited Co. REIT - Real Estate Investment Trust. SA - Generally designated corporations in various countries, mostly those employing the civil law. SAA - Sociedad Anonima Abierta is the Peruvian term used for companies with 20 or more shareholders. SAB de CV - A variable capital company. SCA - Societe en commandite pe actiuni is the Romanian term for limited liability partnership. For Fund compliance purposes, the Fund's industry and geographical classifications refer to any one or more of the industry sub-classifications used by one or more widely recognized market indexes or ratings group indexes, and/or as defined by Fund management. This definition may not apply for purposes of this report, which may combine sub-classifications for reporting ease.
Industries and regions are shown as a percent of net assets. See Notes to Financial Statements. (a) (b) (c) Non-Income Producing Security. Fair valued security; valued by management in accordance with procedures approved by the Fund's Board of Trustees. As of October 31, 2015, these securities had a total value of $1,127 or 0.0003% of total net assets. Security, or portion of security, is being held as collateral for total return swap contracts, futures contracts and written options aggregating a total market value of $48,658,925. 24 | October 31, 2015 .
ALPS | CoreCommodity Management CompleteCommodities® Strategy Fund Consolidated Statement of Investments October 31, 2015 SCHEDULE OF WRITTEN OPTIONS Expiration Date Written Call Options Sugar #11 Future Sugar (WRLD) Future: WTI Crude Future: TOTAL WRITTEN CALL OPTIONS (Premiums received $802,326) Exercise Price Value (Note 2) Contracts 1/16/16 $ 15.50 (20) $ (10,080) 2/16/16 2/16/16 15.00 15.50 (50) (50) (41,440) (31,920) 11/17/15 11/17/15 90.00 100.00 (500) (225) (5,000) (2,250) (90,690) (36,562) (2,341,000) (2,377,562) $ (2,468,252) Written Put Options Coffee 'C' Future WTI Crude Future TOTAL WRITTEN PUT OPTIONS (Premiums received $339,723) TOTAL WRITTEN OPTIONS (Premiums received $1,142,049) 1/23/16 11/17/15 115.00 70.00 (30) (100) Position Contracts Expiration Date Value (Note 2) Long Long Short Long 265 25 (39) 10 11/14/15 12/21/15 12/30/15 12/15/15 FUTURES CONTRACTS Description Brent Crude Future Coffee 'C' Future Copper Future LME Nickel Future Description Gold 100 Oz Future LME Zinc Future Natural Gas Future Platinum Future Silver Future Sugar #11 (World) WTI Crude Futures Contracts Expiration Date Long Long Long Long Long Long Short 35 2 15 61 39 140 (244) 12/30/15 12/15/15 11/26/15 1/28/16 12/30/15 3/01/16 11/20/15 Position $ $ 25 | October 31, 2015 13,133,400 $ 1,133,906 (2,259,563) 602,729 12,610,472 $ Unrealized Appreciation Value (Note 2) $ $ 3,994,900 $ 84,893 348,150 3,016,755 3,035,565 2,276,736 (11,367,960) 1,389,039 $ 728,750 34,219 38,513 2,583 804,065 Unrealized Depreciation (86,915) (5,673) (4,800) (25,620) (65,910) (18,816) (827,160) (1,034,894) . ALPS | CoreCommodity Management CompleteCommodities® Strategy Fund Consolidated Statement of Investments October 31, 2015 TOTAL RETURN SWAP CONTRACTS(a) Swap Counterparty Reference Obligation Notional Dollars UBS CRB 3m Fwd TR Index* $ 14,375,255 Citigroup CRB 3m Fwd TR Index* 65,690,265 Societe Generale CRB 3m Fwd TR Index* 78,798,197 Bank of America †Merrill Lynch CRB 3m Fwd TR Index* 73,722,783 Bank of America †Merrill Lynch LME Copper Future 3,070,800 Bank of America †Merrill Lynch ML eXtra Coffee GA6 2,780,847 Bank of America †Merrill Lynch ML eXtra Silver GA6 465,253 Swap Counterparty Reference Obligation Bank of America †Merrill Lynch MLCS Coffee Jâ€F3 Bank of America †Merrill Lynch MLCS Copper Jâ€F3 Bank of America †Merrill Lynch MLCS Aluminum Jâ€F3 Floating Rate/Fixed Amount Paid by Fund USB3MTA + 40 bps** USB3MTA + 27 bps** USB3MTA + 35 bps** USB3MTA + 35 bps** n/a USB3MTA + 10 bps** USB3MTA + 10 bps** Notional Dollars $ (2,685,887) (3,895,657) (3,832,047) Swap Counterparty Reference Obligation Bank of America †Merrill Lynch ML Nickel Bank of America †Merrill Lynch ML Aluminum GA6 Bank of America †Merrill Lynch ML eXtra Copper GA6 Notional Dollars 612,600 3,907,193 3,911,311 Swap Counterparty Reference Obligation Bank of America †Merrill Lynch MLCS Silver Jâ€F3 Notional Dollars $ (462,236) Floating Rate/Fixed Amount Paid by Fund USB3MTA** USB3MTA** USB3MTA** Termination Date 6/30/2016 6/30/2016 6/30/2016 Total Appreciation Floating Rate/Fixed Amount Paid by Fund n/a USB3MTA + 10 bps** USB3MTA + 10 bps** Floating Rate/Fixed Amount Paid by Fund USB3MTA** (a) Termination Date 11/30/2015 9/19/2016 11/30/2015 6/30/2016 11/10/2015 6/30/2016 6/30/2016 Unrealized Appreciation $ 209,260 956,253 1,147,065 1,073,182 8,100 4,785 33,504 $ 3,432,149 Unrealized Appreciation $ 3,218 30,705 262,512 $ 296,435 $ 3,728,584 Termination Date Unrealized Depreciation 12/24/2015 $ (9,375) 6/30/2016 (270,815) 6/30/2016 (28,306) $ (308,496) Termination Date Unrealized Depreciation 06/30/2016 $ (33,292) $ (33,292) Total Depreciation $ (341,788) The Fund receives payments based on any positive return of the Reference Obligation less the rate paid by the Fund. The Fund makes payments on any negative return of such Reference Obligations plus the rate paid by the fund * CRB - Commodity Research Bureau ** United States Auction Results 3 Month Treasury Bill High Discount See Notes to Financial Statements. 26 | October 31, 2015 . ALPS | CoreCommodity Management CompleteCommodities® Strategy Fund Consolidated Statement of Assets and Liabilities October 31, 2015 ASSETS Investments, at value Cash Foreign currency, at value (Cost $80,812) Unrealized appreciation on total return swap contracts Receivable for investments sold Receivable for shares sold Cash collateral pledged for written options (Note 3) Deposit with broker for futures contracts (Note 3) Cash collateral pledged for total return swap contracts (Note 3) Deposit with broker for futures and options Dividends and interest receivable Prepaid expenses and other assets Total Assets $ 392,482,047 111,046 80,559 3,728,584 1,972,578 340,749 298,349 137,486 159,198 4,466,289 933,754 32,290 404,742,929 $ 2,468,252 3,058 31,852 592,660 341,788 264,451 57,974 29,825 22,526 121,096 3,933,482 400,809,447 LIABILITIES Written options, at value (premiums received $1,142,049) Payable for variation margin on futures contracts Payable due to broker for total return swap contracts Payable for shares redeemed Unrealized depreciation on total return swap contracts Investment advisory fees payable Administration and transfer agency fees payable Distribution and services fees payable Professional fees payable Accrued expenses and other liabilities Total Liabilities NET ASSETS NET ASSETS CONSIST OF Paidâ€in capital Accumulated net investment loss Accumulated net realized loss on investments, written options, futures contracts, total return swap contracts and foreign currency transactions Net unrealized depreciation on investments, written options, futures contracts, total return swap contracts and translation of assets and liabilities denominated in foreign currencies $ 460,840,912 (1,662,022) (27,755,417) (30,614,026) $ 400,809,447 NET ASSETS INVESTMENTS, AT COST $ 424,919,876 PRICING OF SHARES Class A: Net Asset Value, offering and redemption price per share Net Assets Shares of beneficial interest outstanding (unlimited number of shares, no par value common stock authorized) Maximum offering price per share ((NAV/0.9450), based on maximum sales charge of 5.50% of the offering price) Class C: (a) Net Asset Value, offering and redemption price per share Net Assets Shares of beneficial interest outstanding (unlimited number of shares, no par value common stock authorized) Class I: Net Asset Value, offering and redemption price per share Net Assets Shares of beneficial interest outstanding (unlimited number of shares, no par value common stock authorized) $ $ $ $ $ (a) 6.98 8,334,922 1,193,810 7.15 30,085,290 4,205,925 7.57 $ 7.15 $ 362,389,235 50,715,990 Redemption price per share may be reduced for any applicable contingent deferred sales charge. For a description of a possible sales charge, please see the Fund's Prospectus. See Notes to Financial Statements. 27 | October 31, 2015 . ALPS | CoreCommodity Management CompleteCommodities® Strategy Fund Consolidated Statement of Operations For the Year Ended October 31, 2015 INVESTMENT INCOME Dividends Foreign taxes withheld on dividends Interest and other income, net of premium amortization and accretion of discount Total Investment Income $ 3,735,923 (230,971) (1,799,534) 1,705,418 EXPENSES Investment advisory fees Investment advisory fees †subsidiary Administrative fees Transfer agency fees Distribution and service fees Class A Class C Professional fees Networking fees Class I Reports to shareholders and printing fees State registration fees SEC registration fees Insurance fees Custody fees Trustees' fees and expenses Miscellaneous expenses Total Expenses Less fees waived/reimbursed by investment advisor (Note 8) Waiver of investment advisory fees †subsidiary Class A Class C Class I Net Expenses Net Investment Loss Net realized loss on investments Net realized gain on written options Net realized loss on futures contracts Net realized loss on total return swap contracts Net realized gain on foreign currency transactions Net change in unrealized depreciation on investments Net change in unrealized depreciation on written options Net change in unrealized appreciation on futures contracts Net change in unrealized appreciation on total return swap contracts Net change in unrealized depreciation on translation of assets and liabilities denominated in foreign currencies See Notes to Financial Statements. 28 | October 31, 2015 140,662 94,219 73,093 389,977 78,413 58,580 8,859 5,618 60,439 16,991 26,107 5,791,071 3,575,556 668,490 496,960 97,107 NET REALIZED AND UNREALIZED LOSS ON INVESTMENTS NET DECREASE IN NET ASSETS RESULTING FROM OPERATIONS (668,490) (6,800) (1,838) (86,129) 5,027,814 (3,322,396) (23,188,518) 1,666,342 (2,057,904) (88,888,724) 1,478 (16,223,361) (1,573,724) 926,594 9,468,760 (43) (119,869,100) $ (123,191,496) . ALPS | CoreCommodity Management CompleteCommodities® Strategy Fund Consolidated Statements of Changes in Net Assets For the Year Ended October 31, 2015 For the Fiscal Period Ended October 31, 2014(a) For the Year Ended April 30, 2014 OPERATIONS Net investment loss $ (3,322,396) $ (225,381) $ (1,332,666) Net realized loss on investments, written options, futures contracts, total return swap contracts and foreign currency transactions (112,467,326) (21,185,447) (4,722,374) Net change in unrealized appreciation/(depreciation) on investments, written options, futures contracts, total return swap contracts and translation of assets and liabilities denominated in foreign currencies (7,401,774) (36,830,011) 20,918,827 Net Increase/(Decrease) in Net Assets Resulting from Operations (123,191,496) (58,240,840) 14,863,787 DISTRIBUTIONS Dividends to shareholders from net investment income Class I Net Decrease in Net Assets from Distributions (1,912,471) (1,912,471) – – – – BENEFICIAL INTEREST TRANSACTIONS (NOTE 6) Shares sold Class A Class C Class I Dividends reinvested Class I Shares redeemed, net of redemption fees Class A Class C Class I Net Increase in Net Assets Derived from Beneficial Interest Transactions Net increase/(decrease) in net assets NET ASSETS Beginning of year End of year * *Including accumulated net investment income/(loss) of: (a) 18,414,093 4,099,809 316,791,938 1,791,360 (17,894,431) (5,305,252) (238,107,077) 79,790,440 (45,313,527) 446,122,974 $ 400,809,447 $ (1,662,022) 21,322,142 3,307,759 225,598,695 – (86,135,268) (3,037,985) (49,542,035) 111,513,308 53,272,468 392,850,506 $ 446,122,974 $ 1,837,073 Effective May 1, 2014, the Board approved changing the fiscal year-end of the Funds from April 30 to October 31. See Notes to Financial Statements. 29 | October 31, 2015 78,069,155 5,689,512 234,370,555 – (73,729,663) (11,437,221) (165,799,406) 67,162,932 82,026,719 310,823,787 $ 392,850,506 $ 1,681,334 . ALPS | CoreCommodity Management CompleteCommodities® Strategy Fund – Class A Consolidated Financial Highlights Selected data for a share of beneficial interest outstanding throughout the periods indicated: For the Year Ended October 31, 2015 $9.56 For the Year Ended April 30, 2014 $10.40 For the Year Ended April 30, 2013(b) $11.18 For the Year Ended April 30, 2012 $14.28 For the Period June 29, 2010 (Inception) to April 30, 2011 $10.00 (0.09) (2.32) (2.41) – – – – 0.00(e) (1.31) (1.31) – – – – (0.06) 0.53 0.47 – – – – (0.03) (0.69) (0.72) – – (0.06) (0.06) 0.04 (2.29) (2.25) (0.83) (0.02) – (0.85) 0.12 4.87 4.99 (0.71) – – (0.71) 0.00(e) (2.41) $7.15 0.00(e) (1.31) $9.56 0.00(e) 0.47 $10.87 0.00(e) (0.78) $10.40 0.00(e) (3.10) $11.18 0.00(e) 4.28 $14.28 (25.21)% (12.05)% 4.52% (6.44)% (15.77)% 51.41% $30,085 (c) Net asset value, beginning of period For the Fiscal Period Ended October 31, 2014(a) $10.87 $39,971 $112,562 $104,234 $85,805 $37,060 1.50% INCOME/(LOSS) FROM INVESTMENT OPERATIONS: Net investment income/(loss)(d) Net realized and unrealized gain/(loss) Total from investment operations DISTRIBUTIONS: From net investment income From net realized gains Tax return of capital Total distributions REDEMPTION FEES ADDED TO PAIDâ€IN CAPITAL (NOTE 6) Net increase/(decrease) in net asset value Net asset value, end of year TOTAL RETURN(f) RATIOS/SUPPLEMENTAL DATA: Net assets, end of year (000s) Ratio of expenses to average net assets excluding fee waivers and reimbursements Ratio of expenses to average net assets including fee waivers and reimbursements Ratio of net investment income/(loss) to average net assets Portfolio turnover rate(i) 1.47% 1.50% 1.45% 1.46% (g) 1.45% (g) 1.45% (1.12)% 52% (g) 0.09% 12% (0.60)% 28% (a) (h) 2.59% (g) 1.40% 1.64% 1.45% 1.45% (0.30)% 117% 0.36% 264% 1.08%(g) 59% (g) Effective May 1, 2014, the Board approved changing the fiscal year-end of the Funds from April 30 to October 31. Prior to April 30, 2013 the ALPS | CoreCommodity Management CompleteCommodities® Strategy Fund was known as the Jefferies Asset Management Commodity Strategy Allocation Fund. (c) Per share amounts and ratios to average net assets include income and expenses of the CoreCommodity Management Cayman Commodity Fund Ltd. (wholly-owned subsidiary). (d) Calculated using the average shares method. (e) Less than $0.005 per share. (f) Total returns are for the period indicated and have not been annualized. Total returns would have been lower had certain expenses not been waived during the period. Returns shown do not reflect the deduction of taxes that a shareholder would pay on Fund distributions or the redemption of Fund shares.
Returns shown exclude any applicable sales charges. (g) Annualized. (h) According to the Fund's shareholder services plan with respect to the Fund's Class A shares, any amount of such payment not paid during the Fund's fiscal year for such service activities shall be reimbursed to the Fund as soon as practical after the end of the fiscal year. Fees were reimbursed to the Fund during the year ended April 30, 2013, for the prior fiscal year in the amount of 0.05% of average net assets of Class A shares. (i) Portfolio turnover rate for periods less than one full year have not been annualized. See Notes to Financial Statements. (b) 30 | October 31, 2015 . ALPS | CoreCommodity Management CompleteCommodities® Strategy Fund – Class C Consolidated Financial Highlights Selected data for a share of beneficial interest outstanding throughout the periods indicated: For the Year Ended October 31, 2015 $9.39 For the Year Ended April 30, 2014 $10.31 For the Year Ended April 30, 2013(b) $11.15 For the Year Ended April 30, 2012 $14.19 For the Period June 29, 2010 (Inception) to April 30, 2011 $10.00 (0.14) (2.27) (2.41) – – – – (0.04) (1.28) (1.32) – – – – (0.12) 0.52 0.40 – – – – (0.10) (0.69) (0.79) – – (0.05) (0.05) (0.05) (2.26) (2.31) (0.71) (0.02) – (0.73) 0.08 4.87 4.95 (0.76) – – (0.76) 0.00(e) (2.41) $6.98 0.00(e) (1.32) $9.39 0.00(e) 0.40 $10.71 0.00(e) (0.84) $10.31 0.00(e) (3.04) $11.15 0.00(e) 4.19 $14.19 (25.67)% (12.32)% 3.88% (7.10)% (16.26)% 50.90% $8,335 (c) Net asset value, beginning of period For the Fiscal Period Ended October 31, 2014(a) $10.71 $12,534 $13,996 $19,444 $18,095 $7,352 INCOME/(LOSS) FROM INVESTMENT OPERATIONS: Net investment income/(loss)(d) Net realized and unrealized gain/(loss) Total from investment operations DISTRIBUTIONS: From net investment income From net realized gains Tax return of capital Total distributions REDEMPTION FEES ADDED TO PAIDâ€IN CAPITAL (NOTE 6) Net increase/(decrease) in net asset value Net asset value, end of year TOTAL RETURN(f) RATIOS/SUPPLEMENTAL DATA: Net assets, end of year (000s) Ratio of expenses to average net assets excluding fee waivers and reimbursements Ratio of expenses to average net assets including fee waivers and reimbursements Ratio of net investment income/(loss) to average net assets Portfolio turnover rate(h) 2.07% (a) (b) (c) (d) (f) (e) (g) (h) 2.10% 2.14% 2.24% 4.00% (g) 2.05% 2.07% (g) 2.05% (g) 2.05% 2.05% 2.05% 2.05% (1.16)% 28% (0.92)% 117% (0.42)% 264% 0.72%(g) 59% (1.74)% 52% (g) (0.82)% 12% (g) Effective May 1, 2014, the Board approved changing the fiscal year-end of the Funds from April 30 to October 31. Prior to April 30, 2013 the ALPS | CoreCommodity Management CompleteCommodities® Strategy Fund was known as the Jefferies Asset Management Commodity Strategy Allocation Fund. Per share amounts and ratios to average net assets include income and expenses of the CoreCommodity Management Cayman Commodity Fund Ltd. (wholly-owned subsidiary). Calculated using the average shares method. Less than $0.005 per share. Total returns are for the period indicated and have not been annualized. Total returns would have been lower had certain expenses not been waived during the period. Returns shown do not reflect the deduction of taxes that a shareholder would pay on Fund distributions or the redemption of Fund shares.
Returns shown exclude any applicable sales charges. Annualized. Portfolio turnover rate for periods less than one full year have not been annualized. See Notes to Financial Statements. 31 | October 31, 2015 . ALPS | CoreCommodity Management CompleteCommodities® Strategy Fund – Class I Consolidated Financial Highlights Selected data for a share of beneficial interest outstanding throughout the periods indicated: For the Year Ended October 31, 2015 $9.57 For the Year Ended April 30, 2014 $10.37 For the Year Ended April 30, 2013(b) $11.12 For the Year Ended April 30, 2012 $14.25 For the Period June 29, 2010 (Inception) to April 30, 2011 $10.00 (0.06) (2.31) (2.37) (0.05) – – (0.05) (0.01) (1.29) (1.30) – – – – (0.03) 0.53 0.50 – – – – (0.00)(e) (0.69) (0.69) – – (0.06) (0.06) 0.10 (2.32) (2.22) (0.89) (0.02) – (0.91) 0.13 4.89 5.02 (0.77) – – (0.77) 0.00(e) (2.42) $7.15 0.00(e) (1.30) $9.57 0.00(e) 0.50 $10.87 0.00(e) (0.75) $10.37 0.00(e) (3.13) $11.12 0.00(e) 4.25 $14.25 (24.88)% (11.96)% 4.82% (6.16)% (15.53)% 51.74% $362,389 $393,618 $266,293 $187,146 $83,497 $73,630 1.17% 1.16% (g) 1.16% 1.17% 1.33% 2.04% (g) 1.15% (c) Net asset value, beginning of period For the Fiscal Period Ended October 31, 2014(a) $10.87 1.15% (g) 1.15% 1.15% 1.15% 1.15% (0.26)% 28% (0.02)% 117% 0.82% 264% 1.19%(g) 59% INCOME/(LOSS) FROM INVESTMENT OPERATIONS: Net investment income/(loss)(d) Net realized and unrealized gain/(loss) Total from investment operations DISTRIBUTIONS: From net investment income From net realized gains Tax return of capital Total distributions REDEMPTION FEES ADDED TO PAIDâ€IN CAPITAL (NOTE 6) Net increase/(decrease) in net asset value Net asset value, end of year TOTAL RETURN(f) RATIOS/SUPPLEMENTAL DATA: Net assets, end of year (000s) Ratio of expenses to average net assets excluding fee waivers and reimbursements Ratio of expenses to average net assets including fee waivers and reimbursements Ratio of net investment income/(loss) to average net assets Portfolio turnover rate(h) (a) (b) (c) (d) (f) (e) (g) (h) (0.73)% 52% (g) (0.12)% 12% (g) Effective May 1, 2014, the Board approved changing the fiscal year-end of the Funds from April 30 to October 31. Prior to April 30, 2013 the ALPS | CoreCommodity Management CompleteCommodities® Strategy Fund was known as the Jefferies Asset Management Commodity Strategy Allocation Fund. Per share amounts and ratios to average net assets include income and expenses of the CoreCommodity Management Cayman Commodity Fund Ltd. (wholly-owned subsidiary). Calculated using the average shares method. Less than $0.005 per share. Total returns are for the period indicated and have not been annualized. Total returns would have been lower had certain expenses not been waived during the period. Returns shown do not reflect the deduction of taxes that a shareholder would pay on Fund distributions or the redemption of Fund shares. Annualized. Portfolio turnover rate for periods less than one full year have not been annualized. See Notes to Financial Statements. 32 | October 31, 2015 .
ALPS | Kotak India Growth Fund Management Commentary October 31, 2015 (Unaudited) Performance ALPS | Kotak India Growth Fund (the “Fund”) was launched on February 14, 2011. During the 12â€month period ended October 31, 2015 (hereinafter also referred to as “the period”), the Fund’s Class A Shares, INDAX, delivered a total return of â€0.65% at Net Asset Value, Class C, INFCX, delivered â€2.29% with CDSC, and Class I, INDIX, delivered â€0.23%. The Fund outperformed the benchmark CNX 500 Index (“CNX 500”) which returned â€4.00% during the period (without taking into account sales charges for Class A Shares). Some key global events led to higher volatility in the emerging markets during the year. A key macroeconomic event for the year was around worries of a possible sovereign default from Greece and in the dire event, a possible “Grexit” – or exit from the European Union in order to be able to devalue and dig itself out of the piles of debt. Global markets turned extremely volatile on concerns emanating from the Greek crisis. After months of brinkmanship between Greece and the troika, Greece went in for a referendum on July 5, and eventually agreeing to enact the reforms package which comprised of sweeping austerity measures as demanded by lenders. However, the capping of the European Central Bank’s (the “ECB”) Emergency Liquidity Assistance (ELA) led to liquidity shock and thus, capital controls in Greece. The period also saw worries on the Chinese economy as the stock market saw a precipitous correction from its peak of June 12th and has entered the bear market territory. The People’s Bank of China (the “PBOC”) cut both base lending and base deposit rates multiple times during the first half of 2015 and injected liquidity via rate/RRR (Reserve Requirement Ratio) cuts by as many as 3 times. The deposit rate ceiling was also widened from a previous base of 130% to now 150%. The volatility in Chinese stock market has raised concerns around (a) an investment bubble in China with the investment share of Gross Domestic Product (“GDP”) already being higher than it ever was in Japan and Korea, (b) a real estate bubble with the real estate (directly and indirectly) being around 23% of GDP as per Moody’s, and (c) very high indebtedness with China’s private sector debt to GDP now at 196% (40% higher than the trend rate). Direct fallout of the slowdown in Chinese economic growth has been a collapse in global commodities which have entered a bear market. The US Federal Reserve incrementally moved closer through the year to policy rate normalization as the labor market continued to improve and the US economic recovery stabilized. The ECB, BOE (Bank of England) and BOJ (Bank of Japan), on the other hand continued on their dovish stance – reaffirming their preparedness to persist with monetary easing to support flagging growth and near†deflation in their economies. In India, during the year NIFTY, CNXMCAP, and CNX500 Index returned â€9.01%, 4.96%, and â€4.00% respectively. On the currency side, the Indian Rupee (INR) depreciated moderately by ~6.0% to 65.26/USD on 30 Oct 2015 from 61.36/USD on 31 Oct 2014. The INR, however, did relatively better than other commodityâ€linked currencies as well as currencies of economies with strong trade linkages to China – Brazilian Real depreciated ~36%, Russian Ruble down ~33%, South African Rand down ~20% and Australian Dollar down ~19% and Singapore Dollar down ~8.3%. The period saw net foreign institutional investor (FII) outflows to the tune of USD 300 million (mn) from the Indian equity market, while the domestic institutional investors (DIIs) poured in close to USD 8.0 billion (bn) to buy Indian equities. Some key highlights of the investment environment during the period are as follows: ï‚· Macro: India clearly emerged in a situation whereby macro parameters have improved and are on a strong footing on the back of the improvement in the Current Account Deficit (aided by lower oil, gold and commodity prices), higher forex reserves and steady inflation. ï‚· Oil: Brent oil declined from USD 90/barrel (bbl) to USD 50.2/bbl on 30 Oct 2015. We estimate that every USD 1 fall in oil price leads to a saving of close to USD 1 bn on the trade deficit, leading to a cumulative savings of about USD 40bn ~1.8% GDP. This has led to a significant contraction of India’s current account deficit. During the year India removed subsidies on the principal fuel †diesel, and also reduced subsidies on cooking gas leading to significant benefit on the fiscal deficit side. Oil decline is a key macro variable which is benefiting India on multiple fronts – namely current account deficit, fiscal deficit, inflation and currency. ï‚· Corporate earnings: On the corporate earnings front, the picture has been quite different and the performance has been mixed and patchy. The sectors that beat estimates were materials and consumer discretionary. Trends in the information technology (IT) sector were mixed with large cap IT services companies exhibiting resilience in terms of revenue growth whereas mid cap IT services companies have been plagued by client specific issues which have hampered growth. Public sector banks continued to report muted core operating performance trends and there are few signs of improvement in asset quality. ï‚· Banking Reforms: The Indian government announced the PSB (Public Sector Bank) revamp planâ€named “Indradhanush” (or rainbow). The government announced a seven point agenda which includes: (1) Appointments of top management, (2) setting up of the Bank Board Bureau, (3) Capitalization of the banks, (4) Deâ€stressing banks and improving NPA disclosures, (5) Empowerment, (6) framework of accountability, and (7) Governance reforms. ï‚· Monetary policy: The Reserve Bank of India (the “RBI”) cut key policy rates during the period by 125 basis points (“bps”) including a 50bps cut in September 2015. The Repo Rate now stands at 6.75% and the Reverse Repo rate at 5.75%. We feel the overall tone of the RBI has also turned mildly dovish in recent months and monetary policy will be likely stay accommodative to the extent possible given that inflation is under control (with stable food prices despite poor monsoons), global commodity prices are likely to remain weak. Domestic demand is needed to substitute weakening global demand so as to ensure pick up in the investment cycle. In fiscal year (FY) 17, given that RBI expects inflation to fall to around 4.8% †5% 33 | October 31, 2015 . ALPS | Kotak India Growth Fund Management Commentary October 31, 2015 (Unaudited) ï‚· ï‚· ï‚· ï‚· range and keeping real rate at ~1.5%, there is room for RBI to cut rates by another 25â€50bps. Inflation: India’s Wholesale Price Inflation (WPI) continued to be in a secular decline all through the year, being (â€) 4.54% in Sep 2015. The deceleration in the headline inflation was largely driven by a contraction in energy (petrol and diesel) and manufactured goods (chemicals and base metals). Core inflation, however, picked up to 4.41% in Sep 2015 after being in a declining trajectory for many months prior to that. Index of Industrial Production (IIP): In terms of economic activity, IIP growth has picked up in recent months – accelerating to 6.4% in Aug 2015, with the underlying momentum remaining healthy. Sectorâ€wise, mining, manufacturing and electricity have printed good recovery growth numbers in recent months. Within manufacturing, there are encouraging signs of some domestic recovery in components such as fabricated metal products and electrical machinery showing signs of strength. U.S. Federal Reserve (Fed): In its September policy review meeting the Fed maintained its 0â€0.25% target range for the federal funds rate, expressing its concerns over recent developments in global economy as it may “restrain economic activity somewhat” and risk pushing inflation down in the near term. The Fed did acknowledge the improvement in economic conditions, particularly the diminishing labor market slack, and expects inflation to rise gradually to 2% target due to the transitory effects of the fall in energy and imported inflation. The European Central Bank (ECB) in its policy meeting signaled that it stands ready to deploy another stimulus program which could include more bond purchases and additional cuts to the already negative deposit rate as the region remains stuck in ultraâ€low inflation and the recovery was tepid. ECB’s Draghi blamed the slowdown in emerging markets, including China, for the renewed weakness in Eurozone. Portfolio Composition We believe the portfolio continues to be positioned in a way as to benefit from a revival in the economy and improving macroeconomic tailwinds from the four broad investment themes in India – consumption lead by favourable demographics, financial services, infrastructure and outsourcing. The Fund mandate is flexible to invest across the spectrum of market capitalizations in order to take advantage of any opportunistic mispricing arising from market conditions, valuation differential, earnings growth or liquidity flows. As of 31st Oct 2015, Banking & Finance remains the largest sector (26.91% wt.), followed by Information Technology (12.98%) and Auto & Auto Ancillary (10.61%). The top 5 holdings in the portfolio are Infosys Ltd, HDFC Bank, TCS, ICICI Bank and ITC Ltd. Large active deviations in the portfolio are in Cement & Cement Products (+6.1% deviation from benchmark), Auto & Auto Ancillary (+1.2% deviation), Oil & Gas (â€3.1% deviation) and Utilities (â€2.4% deviation). In terms st of market capitalization focus, as of 31 Oct, the Fund is invested 69.3% in large caps, 26.93% in midcaps and 2.39% in smallâ€caps. Thematically, Consumption (at ~34% of portfolio) and Financials (at ~26% of portfolio) constitute the most bullish themes, while Infrastructure (at ~11.2% of exposure) is the smallest thematic bet in the portfolio as of the period end. During the period, some of the names within our favored sectors where we initiated new positions and continue to hold on are Akzo India, Bayer Crop Sciences, Colgate Palmolive, Gulf Oil, Just Dial, Gateway Distriparks, Finolex Cables, TVS Motors and Solar Industries. Some of the stocks where we booked profit and exited completely include Bata India, Bajaj Auto, Emami, Hindustan Zinc, Bharti Airtel, KSK Energy and Tata Chemical. Outlook After a volatile last few months, global investor sentiment has stabilized on the back of a delay in Fed's rate hike and policy announcement by China, especially the rate cut. The monetary stimulus in China is assuaging some concerns over the outlook of Chinese economy. The ECB under Mr. Mario Draghi is expected to evaluate the need for further easing in the month of December. The Fed is expected to ascertain the need for first rate hike in almost a decade in their scheduled December meeting. Currently, the expectation of a rate hike is 50:50. Domestic corporate earnings have been below expectations for the Jul†Sep quarter so far. While the season started on a decent note, overall we see revenue weakness leading to disappointing earnings and also the banking sector continues to see asset quality challenges. Significant part of the weakness can be attributed to weak rural economy which is seeing stress on the back of weak monsoons. However, margins continued to expand on the back of continued fall in commodity prices. While the earnings have been disappointing, we are seeing some encouraging data points which suggest some turnaround in the current quarter. We have seen very robust grown in passenger car sales and recently even two wheeler sales have picked up. Domestic airline passenger traffic has been robust for many months running now. Even cement dispatches have shown some uptick in recent months. Coal production and offâ€take both have seen strong growth and suggests an improving energy demand. Some of the uptick could be seasonal and festive demand and follow up in the next 2â€3 months will only tell whether this is a trend change or just festive demand. NIFTY is presently trading at 15.3x Mar 2017 earnings (source: Kotak Securities) and markets need earnings support to make the next move up. We feel that Octâ€Dec quarter could well be the first quarter of better earnings. In the near term, risk appetite will likely turn volatile on account of the midâ€December Fed decision on the liftâ€off. Nitin Jain – Portfolio Manager Important Notice Investments in India are subject to a number of risks including, but not limited to, risk of losing some or all of the capital invested, high 34 | October 31, 2015 . ALPS | Kotak India Growth Fund Management Commentary October 31, 2015 (Unaudited) market volatility, variable market liquidity, geopolitical risks (including political instability), exchange rate fluctuations (between the currency of the fund’s share class and the Indian Rupee), changes in tax regime and restrictions on investment activities of foreign investors. Basis Point – a unit that is equal to 1/100th of 1% and is used to denote the change in a financial instrument. NIFTY – NIFTY is an Index computed from performance of top stocks from different sectors listed on NSE (National stock exchange). NIFTY consists of 50 companies from 24 different sectors. NIFTY stands for National Stock Exchange’s fifty. The companies which form index of NIFTY may vary from time to time based on many factors considered by NSE. CNXMCAP – The CNX Midcap Index comprises 100 tradable stocks listed on the National Stock Exchange (NSE). The primary objective of the CNX Midcap Index is to capture the movement of the midcap segment of the market.
CNX Midcap Index is computed using free float market capitalization method, wherein the level of the index reflects the total free float market value of all the stocks in the index relative to particular base market capitalization value. The views of the author and information discussed in this commentary are as of the date of publication, are subject to change, and may not reflect the writer's current views. The views expressed are those of the author only, and represent an assessment of market conditions at a specific point in time, are opinions only and should not be relied upon as investment advice regarding a particular investment or markets in general. Such information does not constitute a recommendation to buy or sell specific securities or investment vehicles.
It should not be assumed that any investment will be profitable or will equal the performance of the fund or any securities or any sectors mentioned in this letter. The subject matter contained in this letter has been derived from several sources believed to be reliable and accurate at the time of compilation. Neither ALPS Advisors, Inc., Kotak Mahindra (UK) Limited, nor the Fund accepts any liability for losses either direct or consequential caused by the use of this information. Diversification cannot guarantee gain or prevent losses. 35 | October 31, 2015 . ALPS | Kotak India Growth Fund Performance Update October 31, 2015 (Unaudited) Performance of $10,000 Initial Investment (as of October 31, 2015) Comparison of change in value of a $10,000 investment (includes maximum sales charges of 5.50%) $16k $14k ALPS | Kotak India Growth Fund Class A (NAV) - $13,113 ALPS | Kotak India Growth Fund Class A (MOP) - $12,394 CNX 500 Index - $11,578 $12k $10k MSCI India Index Total Return - $10,459 $8k 10/31/15 10/31/14 10/31/13 10/31/12 10/31/11 2/14/11^ $6k The chart above represents historical performance of a hypothetical investment of $10,000 in the Fund since inception. Past performance does not guarantee future results. This chart does not reflect the deduction of taxes that a shareholder would pay on Fund distributions or the redemption of Fund shares. Average Annual Total Returns (as of October 31, 2015) Class A (NAV) Class A (MOP) Class C (NAV) Class C (CDSC) Class I CNX 500 Index1 MSCI India Index Total Return2 6 Month â€1.10% â€6.54% â€1.37% â€2.36% â€0.93% â€1.72% 1 Year â€0.65% â€6.13% â€1.34% â€2.29% â€0.23% â€4.00% 3 Year 13.72% 11.59% 12.99% 12.99% 14.16% 9.30% Since Inception^ 5.92% 4.66% 5.24% 5.24% 6.31% 3.16% Total Expense Ratio What You Pay* 5.02% 2.00% 5.57% 2.60% 4.49% 1.60% â€2.28% â€8.03% 6.19% 0.96% Performance data quoted represents past performance. Past performance does not guarantee future results.
Investment return and principal value of an investment will fluctuate so that an investor’s shares, when sold or redeemed, may be worth more or less than the original cost. Current performance data may be higher or lower than actual data quoted. For the most current month-end performance data, please call 1-866-759-5679. Maximum Offering Price (MOP) for Class A shares includes the Fund’s maximum sales charge of 5.50%. Performance shown at NAV does not include these sales charges and would have been lower had it been taken into account.
If you invest $1 million or more, either as a lump sum or through the Fund’s accumulation or letter of intent programs, you can purchase Class A shares without an initial sales charge (load). A Contingent Deferred Sales Charge (“CDSC”) of 1.00% may apply to Class C shares redeemed within the first 12 months after a purchase, and on Class A shares redeemed within the first 18 months after a purchase in excess of $1 million. The Fund imposes a 2.00% redemption fee on shares held for less than 30 days. Performance less than 1 year is cumulative. 36 | October 31, 2015 .
ALPS | Kotak India Growth Fund Performance Update October 31, 2015 (Unaudited) Derivatives generally are more sensitive to changes in economic or market conditions than other types of investments; this could result in losses that significantly exceed the funds original investment. 1 CNX 500 Index - India's first broad based benchmark of the Indian capital market. The CNX 500 companies are disaggregated into 72 industry indices. Industry weightages in the index reflect the industry weightages in the market. The index is not actively managed and does not reflect any deduction for fees, expenses or taxes.
An investor may not invest directly in an index. 2 MSCI India Index - designed to measure the performance of the large and mid cap segments of the Indian market. With 64 constituents, the index covers approximately 85% of the Indian equity universe. ^ Fund inception date of February 14, 2011. * What You Pay reflects the Advisor's and Sub-Advisor’s decision to contractually limit expenses through February 29, 2016. Please see the prospectus for additional information. The table does not reflect the deduction of taxes that a shareholder would pay on Fund distributions or the redemption of Fund shares. This Fund is not suitable for all investors and is subject to investment risks, including possible loss of the principal amount invested. There is no guarantee that the Fund will continue to hold any one particular security or stay invested in any one particular company.
The composition of the Fund's top holdings is subject to change. Performance figures are historical and reflect the change in share price, reinvested distributions, changes in net asset value, sales charges and capital gains distributions, if any. Not FDIC Insured – No Bank Guarantee – May Lose Value Investing in India involves risk and considerations not present when investing in more established securities markets. The Fund may be more susceptible to economic, market, political and local risks of the region than a fund that is more geographically diversified.
Investments in India are subject to a number of risks including, but not limited to, risk of losing some or all of the capital invested, high market volatility, variable market liquidity, geopolitical risks (including political instability), exchange rate fluctuations (between the currency of the fund’s share class and the Indian Rupee), changes in tax regime and restrictions on investment activities of foreign investors. Industry Sector Allocation (as a % of Net Assets) Top Ten Holdings (as a % of Net Assets) † Infosys, Ltd. HDFC Bank, Ltd. Tata Consultancy Services, Ltd. ICICI Bank, Ltd. ITC, Ltd. Axis Bank, Ltd. Sun Pharmaceutical Industries, Ltd. Maruti Suzuki India, Ltd. Housing Development Finance Corp., Ltd. Larsen & Toubro, Ltd. Top Ten Holdings Financials - 27.89% Materials - 13.08% 5.57% 4.90% 4.23% 3.60% 3.58% 3.46% 3.18% 3.15% 2.90% 2.71% 37.28% Information Technology - 13.05% Industrials - 12.09% Consumer Discretionary - 10.92% Consumer Staples - 9.49% Health Care - 7.26% Energy - 3.77% Telecommunication Services - 1.51% Cash, Cash Equivalents & Other Net Assets - 0.94% † Holdings are subject to change, and may not reflect the current or future position of the portfolio. Table presents approximate values only. 37 | October 31, 2015 . ALPS | Kotak India Growth Fund Consolidated Statement of Investments October 31, 2015 Value (Note 2) Shares COMMON STOCKS (99.06%) Consumer Discretionary (10.92%) Auto Components (2.39%) Motherson Sumi Systems, Ltd. MRF, Ltd. 45,520 $ 171,221 363 220,859 392,080 Automobiles (6.87%) Maruti Suzuki India, Ltd. Tata Motors, Ltd., Class A(a) TVS Motor Co., Ltd. Media (1.66%) (a) Dish TV India, Ltd. 7,600 517,244 96,894 384,496 56,000 227,205 1,128,945 273,342 12,500 22,360 326,177 115,011 587,743 TOTAL CONSUMER STAPLES 136,114 1,559,720 Energy (3.77%) Oil, Gas & Consumable Fuels (3.77%) Hindustan Petroleum Corp., Ltd. 24,500 287,645 Reliance Industries, Ltd. 22,959 332,515 620,160 78,364 101,240 48,033 140,000 29,135 110,900 567,926 246,653 804,826 591,989 405,641 400,776 191,453 148,110 477,278 4,584,484 174,916 226,738 268,113 523,527 1,193,294 1,193,294 Health Care (7.26%) Pharmaceuticals (7.26%) Cadila Healthcare, Ltd. 27,445 Cipla, Ltd. 21,500 Lupin, Ltd. 9,100 Sun Pharmaceutical Industries, Ltd. 38,500 TOTAL HEALTH CARE Industrials (12.09%) Construction & Engineering (3.60%) Larsen & Toubro, Ltd. 20,700 446,129 MBL Infrastructures, Ltd. 45,800 146,498 592,627 620,160 23,750 TOTAL FINANCIALS Financials (27.89%) Commercial Banks (19.91%) Axis Bank, Ltd. Bank of Baroda HDFC Bank, Ltd. ICICI Bank, Ltd. IndusInd Bank, Ltd. State Bank of India Thrifts & Mortgage Finance (2.90%) Housing Development Finance Corp., Ltd. 24,900 TOTAL ENERGY Real Estate Management & Development (0.90%) The Phoenix Mills, Ltd. 29,000 179,038 29,000 Personal Products (1.98%) Colgateâ€Palmolive India, Ltd. Tobacco (3.58%) ITC, Ltd. 132,476 1,794,367 330,648 Insurance (1.16%) MAX India, Ltd. 6,700 Household Products (0.83%) Jyothy Laboratories, Ltd. Food Products (2.01%) Britannia Industries, Ltd. Consumer Staples (9.49%) Beverages (1.09%) United Breweries, Ltd. 254,453 3,272,264 Diversified Financial Services (0.81%) Multi Commodity Exchange of India, Ltd. 9,750 22,002 $ Consumer Finance (2.21%) Shriram Transport Finance Co., Ltd. 12,815 184,459 SKS Microfinance, Ltd.(a) 27,200 178,444 362,903 TOTAL CONSUMER DISCRETIONARY Commercial Banks (continued) Yes Bank, Ltd. 169,000 Value (Note 2) Shares Electrical Equipment (4.03%) Amara Raja Batteries, Ltd. Crompton Greaves, Ltd. Finolex Cables, Ltd. Vâ€Guard Industries, Ltd. 231,765 189,173 168,850 72,074 661,862 117,393 163,750 281,143 Machinery (1.71%) Thermax, Ltd. Timken India, Ltd. 38 | October 31, 2015 9,021 18,200 16,800 71,200 44,000 5,257 . ALPS | Kotak India Growth Fund Consolidated Statement of Investments October 31, 2015 Shares Miscellaneous Manufacturing (0.62%) Solar Industries India, Ltd. 2,000 $ Value (Note 2) TOTAL INDUSTRIALS IT Services (12.90%) HCL Technologies, Ltd. Infosys, Ltd. Tata Consultancy Services, Ltd. Tech Mahindra, Ltd. 2,400 20,300 52,750 18,248 29,000 23,663 270,377 915,670 695,709 239,117 2,120,873 2,144,536 TOTAL INFORMATION TECHNOLOGY Materials (13.08%) Auto Parts&Equipment (0.48%) Gulf Oil Lubricants India, Ltd. 10,628 10,100 1,810 44,470 18,000 Chemicals (3.83%) Akzo Nobel India, Ltd. Bayer CropScience, Ltd. Berger Paints India, Ltd. Supreme Industries, Ltd. 79,546 208,430 96,410 150,793 173,097 628,730 228,812 162,464 282,442 77,071 287,696 182,344 220,781 1,441,610 Telecommunication Services (1.51%) Diversified Telecommunication (0.91%) Tata Communications, Ltd. 22,970 Construction Materials (8.77%) ACC, Ltd. 10,860 Century Textiles & Industries, Ltd. 19,200 JK Cement, Ltd. 27,000 Orient Cement, Ltd. 30,974 The Ramco Cements, Ltd. 52,119 Shree Cement, Ltd.(a) 970 Ultratech Cement, Ltd. 5,000 TOTAL COMMON STOCKS (Cost $15,810,828) 7-Day Yield 16,283,580 Value (Note 2) Shares Money Market Fund (0.29%) Dreyfus Cash Advantage Fund, Institutional Class 0.091% 46,969 TOTAL SHORT TERM INVESTMENTS (Cost $46,969) TOTAL INVESTMENTS (99.35%) (Cost $15,857,797) Other Assets In Excess Of Liabilities (0.65%) NET ASSETS (100.00%) 46,969 46,969 $ 16,330,549 107,171 $ 16,437,720 (a) Non-Income Producing Security. Common Abbreviations: Ltd. - Limited. For Fund compliance purposes, the Fund's industry classifications refer to any one or more of the industry sub-classifications used by one or more widely recognized market indexes or ratings group indexes, and/or as defined by Fund management. This definition may not apply for purposes of this report, which may combine industry sub-classifications for reporting ease. Industries are shown as a percent of net assets. See Notes to Financial Statements. 249,119 TOTAL MATERIALS 150,580 98,539 TOTAL TELECOMMUNICATION SERVICES 2,149,886 8,050 $ SHORT TERM INVESTMENTS (0.29%) Information Technology (13.05%) Computers (0.15%) Persistent Systems, Ltd. 1,988,014 Internet (0.60%) Just Dial, Ltd. 102,859 Transportation Infrastructure (2.13%) Gateway Distriparks, Ltd. 49,500 252,476 IL&FS Transportation Networks, Ltd. 67,843 97,047 349,523 Value (Note 2) Shares 39 | October 31, 2015 .
ALPS | Kotak India Growth Fund Consolidated Statement of Assets and Liabilities October 31, 2015 ASSETS Investments, at value Cash Foreign currency, at value (Cost $187,631) Receivable for investments sold Receivable for shares sold Dividends receivable Receivable due from advisor Prepaid expenses and other assets Total Assets $ 16,330,549 5,955 186,532 2,320 28,395 3,331 213 14,026 16,571,321 $ 23,680 572 26,331 8,602 2,000 44,522 27,894 133,601 16,437,720 $ $ 14,075,259 (70,722) 1,961,507 471,676 16,437,720 LIABILITIES Payable for shares redeemed Investment advisory fees payable Administration and transfer agency fees payable Distribution and services fees payable Trustees' fees and expenses payable Professional fees payable Accrued expenses and other liabilities Total Liabilities NET ASSETS NET ASSETS CONSIST OF Paidâ€in capital Accumulated net investment loss Accumulated net realized gain on investments and foreign currency transactions Net unrealized appreciation on investments and translation of assets and liabilities denominated in foreign currencies NET ASSETS INVESTMENTS, AT COST PRICING OF SHARES $ 15,857,797 Class A: Net Asset Value, offering and redemption price per share Net Assets Shares of beneficial interest outstanding (unlimited number of shares, no par value common stock authorized) Maximum offering price per share ((NAV/0.9450), based on maximum sales charge of 5.50% of the offering price) Class C: Net Asset Value, offering and redemption price per share(a) Net Assets Shares of beneficial interest outstanding (unlimited number of shares, no par value common stock authorized) Class I: Net Asset Value, offering and redemption price per share Net Assets Shares of beneficial interest outstanding (unlimited number of shares, no par value common stock authorized) $ $ $ (a) 12.57 5,905,574 469,992 13.30 $ $ 12.23 1,965,461 160,731 $ $ 12.76 8,566,685 671,528 Redemption price per share may be reduced for any applicable contingent deferred sales charge. For a description of a possible sales charge, please see the Fund's Prospectus. See Notes to Financial Statements. 40 | October 31, 2015 . ALPS | Kotak India Growth Fund Consolidated Statement of Operations For the Year Ended October 31, 2015 INVESTMENT INCOME Dividends Total Investment Income $ 169,827 169,827 EXPENSES Investment advisory fees Administrative fees Transfer agency fees Distribution and service fees Class A Class C Professional fees Reports to shareholders and printing fees State registration fees SEC registration fees Insurance fees Custody fees Trustees' fees and expenses Miscellaneous expenses Total Expenses Less fees waived/reimbursed by investment advisor (Note 8) Class A Class C Class I Net Expenses Net Investment Loss Net realized gain on investments Net realized loss on foreign currency transactions Net change in unrealized depreciation on investments Net change in unrealized depreciation on translation of assets and liabilities denominated in foreign currencies See Notes to Financial Statements. 41 | October 31, 2015 25,217 19,425 33,027 5,692 43,361 310 2,562 83,376 4,428 20,951 612,557 NET REALIZED AND UNREALIZED LOSS ON INVESTMENTS NET DECREASE IN NET ASSETS RESULTING FROM OPERATIONS 228,768 143,097 2,343 $ (97,837) (29,402) (150,329) 334,989 (165,162) 2,490,210 (57,755) (2,668,780) (822) (237,147) (402,309) . ALPS | Kotak India Growth Fund Consolidated Statements of Changes in Net Assets For the Year Ended October 31, 2015 For the Fiscal Period Ended October 31, 2014(a) For the Year Ended April 30, 2014 OPERATIONS Net investment income/(loss) Net realized gain/(loss) on investments and foreign currency transactions Net change in unrealized appreciation/(depreciation) on investments and translation of assets and liabilities denominated in foreign currencies Net Increase/(Decrease) in Net Assets Resulting from Operations $ (165,162) $ 2,432,455 (2,669,602) (402,309) 15,803 $ 804,742 2,192,910 3,013,455 (19,677) (99,022) 449,502 330,803 DISTRIBUTIONS Dividends to shareholders from net investment income Class A Class C Class I Dividends to shareholders from net realized gains Class A Class C Class I Net Decrease in Net Assets from Distributions (79,832) (13,011) (89,195) (174,473) (45,295) (266,183) (667,989) – – – – – – – – – (9,601) – – – (9,601) BENEFICIAL INTEREST TRANSACTIONS (NOTE 6) Shares sold Class A Class C Class I Dividends reinvested Class A Class C Class I Shares redeemed, net of redemption fees Class A Class C Class I Net Increase/(Decrease) in Net Assets Derived from Beneficial Interest Transactions Net increase in net assets NET ASSETS Beginning of year End of year * *Including accumulated net investment income/(loss) of: (a) $ $ 3,689,065 1,063,029 4,898,712 225,433 55,484 348,314 (3,230,457) (551,771) (4,977,421) 1,520,388 450,090 15,987,630 16,437,720 (70,722) $ $ 2,894,035 545,448 6,266,320 – – – (3,972,790) (211,571) (577,957) 4,943,485 7,956,940 8,030,690 15,987,630 63,475 Effective May 1, 2014, the Board approved changing the fiscal year-end of the Funds from April 30 to October 31. See Notes to Financial Statements. 42 | October 31, 2015 $ $ 2,368,871 348,482 325,772 – – 8,639 (2,090,462) (419,549) (586,477) (44,724) 276,478 7,754,212 8,030,690 (37,846) . ALPS | Kotak India Growth Fund – Class A Consolidated Financial Highlights Selected data for a share of beneficial interest outstanding throughout the periods indicated: For the Year Ended October 31, 2015 $13.20 For the Year Ended April 30, 2014 $9.47 For the Year Ended April 30, 2013 $8.22 For the Year Ended April 30, 2012 $10.35 For the Period February 14, 2011 (Inception) to April 30, 2011 $10.00 (0.14) 0.06 (0.08) (0.17) (0.38) (0.55) 0.01 3.20 3.21 – – – (0.02) 0.54 0.52 – – – (0.07) 1.32 1.25 – – – (0.08) (2.04) (2.12) – (0.01) (0.01) (0.04) 0.39 0.35 – – – 0.00(d) (0.63) $12.57 0.00(d) 3.21 $13.20 0.00(d) 0.52 $9.99 0.00(d) 1.25 $9.47 0.00(d) (2.13) $8.22 0.00(d) 0.35 $10.35 (0.65)% 32.13% 5.49% 15.21% (20.44)% 3.40% $5,906 (b) Net asset value, beginning of period For the Fiscal Period Ended October 31, 2014(a) $9.99 $5,536 $5,211 $4,681 $2,404 $935 INCOME/(LOSS) FROM INVESTMENT OPERATIONS: Net investment income/(loss)(c) Net realized and unrealized gain/(loss) Total from investment operations DISTRIBUTIONS: From net investment income From net realized gains Total distributions REDEMPTION FEES ADDED TO PAIDâ€IN CAPITAL (NOTE 6) Net increase/(decrease) in net asset value Net asset value, end of year TOTAL RETURN(e) RATIOS/SUPPLEMENTAL DATA: Net assets, end of year (000s) Ratio of expenses to average net assets excluding fee waivers and reimbursements Ratio of expenses to average net assets including fee waivers and reimbursements Ratio of net investment income/(loss) to average net assets (h) Portfolio turnover rate (a) (c) (d) (e) (b) (f) (g) (h) 7.99% 6.51% 12.42% 69.96% (f) 2.00%(f) 1.96%(g) 4.92% (f) 3.51% 1.90%(f)(g) 1.88%(g) 2.00% 2.00% (1.03)% 58% (f) 0.19% 28% (0.27)% 65% (0.82)% 93% (0.89)% 114% (1.82)%(f) 9% Effective May 1, 2014, the Board approved changing the fiscal year-end of the Funds from April 30 to October 31. Per share amounts and ratios to average net assets include income and expenses of the Kotak Mauritius Portfolio (wholly-owned subsidiary). Calculated using the average shares method. Less than $0.005 per share. Total returns are for the period indicated and have not been annualized. Total returns would have been lower had certain expenses not been waived during the period. Returns shown do not reflect the deduction of taxes that a shareholder would pay on Fund distributions or the redemption of Fund shares. Returns shown exclude any applicable sales charges. Annualized. According to the Fund's shareholder services plan with respect to the Fund's Class A shares, any amount of such payment not paid during the Fund's fiscal year for such service activities shall be reimbursed to the Fund as soon as practical after the end of the fiscal year.
Fees were reimbursed to the Fund during the period ended October 31, 2015, for the prior fiscal year in the amount of 0.04% of average net assets of Class A shares, during the period ended October 31, 2014, for the prior fiscal year in the amount of 0.10% (annualized) of average net assets of Class A shares and during the year ended April 30, 2014, for the prior fiscal year in the amount of 0.12% of average net assets of Class A shares. Portfolio turnover rate for periods less than one full year have not been annualized. See Notes to Financial Statements. 43 | October 31, 2015 . ALPS | Kotak India Growth Fund – Class C Consolidated Financial Highlights Selected data for a share of beneficial interest outstanding throughout the periods indicated: For the Year Ended October 31, 2015 $12.88 For the Fiscal Period Ended October 31, 2014(a) $9.77 For the Year Ended April 30, 2014 $9.34 For the Year Ended April 30, 2013 $8.15 For the Year Ended April 30, 2012 $10.32 For the Period February 14, 2011 (Inception) to April 30, 2011 $10.00 (0.21) 0.05 (0.16) (0.11) (0.38) (0.49) (0.03) 3.14 3.11 – – – (0.09) 0.52 0.43 – – – (0.12) 1.31 1.19 – – – (0.13) (2.03) (2.16) – (0.01) (0.01) (0.05) 0.37 0.32 – – – – (0.65) $12.23 0.00(d) 3.11 $12.88 – 0.43 $9.77 – 1.19 $9.34 0.00(d) (2.17) $8.15 – 0.32 $10.32 (1.34)% 31.83% 4.60% 14.60% (20.97)% 3.20% Net assets, end of year (000s) $1,965 Ratio of expenses to average net assets excluding fee waivers and reimbursements 4.11% Ratio of expenses to average net assets including fee waivers and reimbursements 2.60% Ratio of net investment loss to average net (1.67)% assets (g) 58% Portfolio turnover rate $1,497 $875 $924 $435 $466 5.57% (f) 7.26% 8.54% 13.39% 69.64% (f) 2.60%(f) 2.60% 2.60% 2.60% 2.60%(f) (1.00)% 65% (1.42)% 93% (1.49)% 114% (b) Net asset value, beginning of period INCOME/(LOSS) FROM INVESTMENT OPERATIONS: Net investment loss(c) Net realized and unrealized gain/(loss) Total from investment operations DISTRIBUTIONS: From net investment income From net realized gains Total distributions REDEMPTION FEES ADDED TO PAIDâ€IN CAPITAL (NOTE 6) Net increase/(decrease) in net asset value Net asset value, end of year TOTAL RETURN(e) RATIOS/SUPPLEMENTAL DATA: (a) (c) (d) (e) (b) (f) (g) (f) (0.50)% 28% (2.42)%(f) 9% Effective May 1, 2014, the Board approved changing the fiscal year-end of the Funds from April 30 to October 31. Per share amounts and ratios to average net assets include income and expenses of the Kotak Mauritius Portfolio (wholly-owned subsidiary). Calculated using the average shares method. Less than $0.005 per share. Total returns are for the period indicated and have not been annualized. Total returns would have been lower had certain expenses not been waived during the period. Returns shown do not reflect the deduction of taxes that a shareholder would pay on Fund distributions or the redemption of Fund shares. Returns shown exclude any applicable sales charges. Annualized. Portfolio turnover rate for periods less than one full year have not been annualized. See Notes to Financial Statements. 44 | October 31, 2015 .
ALPS | Kotak India Growth Fund – Class I Consolidated Financial Highlights Selected data for a share of beneficial interest outstanding throughout the periods indicated: For the Year Ended October 31, 2015 $13.29 For the Year Ended April 30, 2014 $9.55 For the Year Ended April 30, 2013 $8.25 For the Year Ended April 30, 2012 $10.34 For the Period February 14, 2011 (Inception) to April 30, 2011 $10.00 (0.09) 0.06 (0.03) (0.13) (0.38) (0.51) 0.03 3.22 3.25 – – – 0.00(d) 0.54 0.54 (0.05) – (0.05) (0.04) 1.34 1.30 – – – (0.04) (2.04) (2.08) – (0.01) (0.01) (0.03) 0.37 0.34 – – – 0.01 (0.53) $12.76 0.00(d) 3.25 $13.29 – 0.49 $10.04 0.00(d) 1.30 $9.55 0.00(d) (2.09) $8.25 – 0.34 $10.34 (0.23)% 32.37% 5.70% 15.76% (20.23)% 3.50% $8,567 (b) Net asset value, beginning of period For the Fiscal Period Ended October 31, 2014(a) $10.04 $8,955 $1,945 $2,149 $1,609 $568 INCOME/(LOSS) FROM INVESTMENT OPERATIONS: Net investment income/(loss)(c) Net realized and unrealized gain/(loss) Total from investment operations DISTRIBUTIONS: From net investment income From net realized gains Total distributions REDEMPTION FEES ADDED TO PAIDâ€IN CAPITAL (NOTE 6) Net increase/(decrease) in net asset value Net asset value, end of year TOTAL RETURN(e) RATIOS/SUPPLEMENTAL DATA: Net assets, end of year (000s) Ratio of expenses to average net assets excluding fee waivers and reimbursements Ratio of expenses to average net assets including fee waivers and reimbursements Ratio of net investment income/(loss) to average net assets (h) Portfolio turnover rate (c) (d) (e) (b) (f) (h) (g) 4.49% (f) 6.28% 7.65% 12.05% 96.67% (f) 1.60% (a) 3.10% 1.60%(f) 1.60% 1.60% 1.60% 1.60%(f) (0.67)% 58% (f) 0.50% 28% 0.00%(g) 65% (0.42)% 93% (0.49)% 114% (1.36)%(f) 9% Effective May 1, 2014, the Board approved changing the fiscal year-end of the Funds from April 30 to October 31. Per share amounts and ratios to average net assets include income and expenses of the Kotak Mauritius Portfolio (wholly-owned subsidiary). Calculated using the average shares method. Less than $0.005 per share. Total returns are for the period indicated and have not been annualized. Total returns would have been lower had certain expenses not been waived during the period. Returns shown do not reflect the deduction of taxes that a shareholder would pay on Fund distributions or the redemption of Fund shares. Annualized. Less than 0.005% Portfolio turnover rate for periods less than one full year have not been annualized. See Notes to Financial Statements. 45 | October 31, 2015 . ALPS | Red Rocks Listed Private Equity Fund Management Commentary October 31, 2015 (Unaudited) Overview Conundrum: Volatility, slow growth and asset inflation After a brief hint of volatility in December 2014 and January 2015, the next several months turned out to be quite benign – that is until the end of June, at which time, something changed. And then in August things really changed; China’s central bank deâ€valued the yuan on August 11th taking the world by surprise. From that point through midâ€October it was not much fun to be a portfolio manager. Emerging markets, commodities and currencies were volatile. In some cases extremely volatile. For those of us hoping for a quiet end to summer and a relaxed entry into fall, the last few months have been anything but quiet and relaxed. A slowing China, with some wellâ€known prognosticators suggesting much worse is yet to come, has demanded everyone’s attention of late. China’s sheer size and the fact that it has exhibited strong growth over the last couple of decades, has economists and financial types wondering what to make of all this. Add to that the neverâ€ending guessing game around when the U.S. Federal Reserve (the “Fed”) will raise interest rates. Not in September. Or October. By how much? For how long? And what will that mean for the broader capital markets? All very good questions. And yet no one really knows the answers. All of this uncertainty has led to volatility in the capital markets. Yes, it’s hard to forecast certain input costs. Energy and most commodities garner much of the attention; they’re significantly cheaper than they were a year ago. And exportâ€based businesses are having a difficult time managing their foreign currency exposure. Yet this uncertainty has not filtered down to a change in core consumer demand in the developed world. Hmmm. Turning to private equity, while the aforementioned developments are quite relevant, not much has changed here. Businesses continue to operate. Industries continue to evolve. Management teams continue to strive for growth, albeit muted, both top line (revenue) and bottom line (cash flow). From what we can see, private equity backed businesses have adapted to the slow growth environment and are doing just fine. Private equity fund managers like that. A broader challenge for private equity is that buyout valuations continue to be high by historical measures, and they are trending higher. It is the same phenomena we’ve witnessed for the past few years. That’s good if you’re a seller of a private equity backed business, but not so good if you’re a buyer. And if you are sitting on large amounts of undrawn commitments/cash (“dry powder”), which most private equity firms are, a lower valuation environment is preferred; better to buy low and hopefully sell high. However, that probably doesn’t change anytime soon. Why? Because the world continues to be awash in liquidity; the Fed and other Central Banks being the drivers behind this condition since the Great Financial Crisis began in 2008. And yet liquidity does not equal growth, much to the chagrin of policy makers and governments. It can equal asset inflation or inflation in the form of business valuations; private equity being keenly aware of this. It is a real conundrum. Portfolio Review For the twelve months ended October 31, 2015, the ALPS Red Rocks Listed Private Equity Fund's ("Fund") Class A shares, LPEFX, returned 6.01%, (Class A delivered a net return of 0.25% at MOP), compared with 2.33% and 7.97% for the MSCI World Index and the Red Rocks Global Listed Private Equity Index, respectively . During the period, we added APAX Global Alpha LTD, Ares Management LP, Fifth Street Senior Floating, Graphite Enterprise Trust PLC and Ratos AB (two securities that we have previously owned) and Sofina, while we exited AP Alternative Assets LP, Better Capital PCC LTD, Capital Southwest Corp, Intermediate Capital Group PLC and Melrose Industries PLC. At the end of the period the Fund had 38 holdings in what we believe are some of the top performing private equity funds/firms from around the globe. We believe that finding, researching and analyzing these investments is what Red Rocks Capital does best; it is partly intellectual curiosity and partly competitive. It’s why we come to work excited. And with that, our objective remains a constant: to assemble the best global portfolio of listed private equity companies for the benefit of our shareholders. Net contributors to performance for the period included: • Aurelius SE & CO KGaA (previously known as Aurelius AG) • 3I Group PLC • The Blackstone Group LP Net detractors to performance for the period included: • Hosken Consolidate Investments LTD • Grand Parade Investments LTD • The Carlyle Group Outlook What does all of the volatility, slow growth and asset inflation add up to? How will it affect the private equity business model: raising capital in a fund/vehicle, investing that capital in promising companies, improving the value of those companies, exiting/realizing value, and returning capital to investors? I’m not exactly sure. One thing I am fairly certain of is that when the Fed and the other Central Banks begin to close the liquidity spigot (raise interest rates), it will have a profound effect on the capital markets, private equity included. It will be a big reâ€set for the cost of capital, return expectations and risk. There will be natural winners and losers. Based on prior experience, I believe that private equity will be on the winning side of the ledger once things settle down. Until then, as the saying goes, stay tuned. As always, we appreciate your continued support and interest in Red Rocks and the Listed Private Equity strategy. Adam Goldman Coâ€Portfolio Manager 46 | October 31, 2015 . ALPS | Red Rocks Listed Private Equity Fund Management Commentary October 31, 2015 (Unaudited) The views of the author and information discussed in this commentary are as of the date of publication, are subject to change, and may not reflect the writer's current views. The views expressed are those of the author only, and represent an assessment of market conditions at a specific point in time, are opinions only and should not be relied upon as investment advice regarding a particular investment or markets in general. Such information does not constitute a recommendation to buy or sell specific securities or investment vehicles. It should not be assumed that any investment will be profitable or will equal the performance of the fund(s) or any securities or any sectors mentioned in this letter.
The subject matter contained in this letter has been derived from several sources believed to be reliable and accurate at the time of compilation. Neither ALPS Advisors, Inc., Red Rocks Capital LLC, nor the Fund accepts any liability for losses either direct or consequential caused by the use of this information. Diversification cannot guarantee gain or prevent losses. 47 | October 31, 2015 . ALPS | Red Rocks Listed Private Equity Fund Performance Update October 31, 2015 (Unaudited) Performance of $10,000 Initial Investment (as of October 31, 2015) Comparison of change in value of a $10,000 investment (includes maximum sales charges of 5.50%) $14k MSCI World Index - $13,285 $12k Red Rocks Global Listed Private Equity Index - $10,959 $10k ALPS|Red Rocks Listed Private Equity Fund Class A (NAV) - $10,141 $8k ALPS|Red Rocks Listed Private Equity Fund Class A (MOP) - $9,585 $6k $4k 10/31/15 10/31/14 10/31/13 10/31/12 10/31/11 10/31/10 10/31/09 10/31/08 12/31/07^ $2k The chart above represents historical performance of a hypothetical investment of $10,000 in the Fund since inception. Past performance does not guarantee future results. This chart does not reflect the deduction of taxes that a shareholder would pay on Fund distributions or the redemption of Fund shares. Average Annual Total Returns (as of October 31, 2015) 6 Month 5 Year Since Inception^ Total Expense Ratio What You Pay* 6.01% 15.33% 10.19% 0.18% 0.25% 13.17% 8.96% â€0.54% 2.35% 2.35% â€4.51% 5.14% 14.57% 9.39% â€0.61% â€5.47% 4.14% 14.57% 9.39% â€0.61% 2.85% 2.85% â€4.06% 6.30% 15.74% 10.50% 0.47% 1.95% 1.95% â€4.16% MSCI World Index Red Rocks Global Listed Private 2 Equity Index 3 Year â€9.37% 1 1 Year â€4.10% Class A (NAV) Class A (MOP) Class C (NAV) Class C (CDSC) Class I Class R 5.87% 15.47% 10.15% â€0.05% 2.33% 2.33% â€2.89% 2.33% 12.24% 9.76% 3.69% â€4.70% 7.97% 15.07% 10.11% 1.18% Performance data quoted represents past performance. Past performance does not guarantee future results.
Investment return and principal value of an investment will fluctuate so that an investor’s shares, when sold or redeemed, may be worth more or less than the original cost. Current performance data may be higher or lower than actual data quoted. For the most current month-end performance data, please call 1-866-759-5679. Maximum Offering Price (MOP) for Class A shares includes the Fund’s maximum sales charge of 5.50%. Performance shown at NAV does not include these sales charges and would have been lower had it been taken into account.
If you invest $1 million or more, either as a lump sum or through the Fund’s accumulation or letter of intent programs, you can purchase Class A shares without an initial sales charge (load). A Contingent Deferred Sales Charge (“CDSC”) of 1.00% may apply to Class C shares redeemed within the first 12 months after a purchase, and on Class A shares redeemed within the first 18 months after a purchase in excess of $1 million. The Fund imposes a 2.00% redemption fee on shares held for less than 90 days. Performance less than 1 year is cumulative. 48 | October 31, 2015 .
ALPS | Red Rocks Listed Private Equity Fund Performance Update October 31, 2015 (Unaudited) Performance shown for Class C shares prior to June 30, 2010 reflects the historical performance of the Fund’s Class A shares, calculated using the fees and expenses of Class C shares. 1 MSCI World Index: Morgan Stanley Capital International’s market capitalization weighted index is composed of companies representative of the market structure of 22 developed market countries in North America, Europe and the Asia/Pacific Region. The index is not actively managed and does not reflect any deduction for fees, expenses or taxes. An investor may not invest directly in an index. 2 The Red Rocks Global Listed Private Equity Index includes securities, ADRs and GDRs of 40 to 75 private equity companies, including business development companies, master limited partnerships and other vehicles whose principal business is to invest in, lend capital to or provide services to privately held companies. The Red Rocks Global Listed Private Equity Index is managed by the Fund’s Sub-Advisor.
An investor may not invest directly in an index. ^ Fund inception date of December 31, 2007 for Classes A, I, and R; Fund inception date 6/30/10 for Class C. * What You Pay reflects the Advisor's and Sub-Advisor’s decision to contractually limit expenses through February 28, 2017 and Acquired Fund Fees and Expenses of 0.70%. Please see the current prospectus for additional information. The table does not reflect the deduction of taxes that a shareholder would pay on Fund distributions or the redemption of Fund shares. This Fund is not suitable for all investors and is subject to investment risks, including possible loss of the principal amount invested. Listed Private Equity Companies are subject to various risks depending on their underlying investments, which could include, but are not limited to, additional liquidity risk, industry risk, non-U.S. security risk, currency risk, credit risk, managed portfolio risk and derivatives risk (derivatives risk is the risk that the value of the Listed Private Equity Companies’ derivative investments will fall because of pricing difficulties or lack of correlation with the underlying investment). There are inherent risks in investing in private equity companies, which encompass financial institutions or vehicles whose principal business is to invest in and lend capital to privately held companies.
Generally, little public information exists for private and thinly traded companies, and there is a risk that investors may not be able to make a fully informed investment decision. Listed Private Equity Companies may have relatively concentrated investment portfolios, consisting of a relatively small number of holdings. A consequence of this limited number of investments is that the aggregate returns realized may be adversely impacted by the poor performance of a small number of investments, or even a single investment, particularly if a company experiences the need to write down the value of an investment. Certain of the Fund’s investments may be exposed to liquidity risk due to low trading volume, lack of a market maker or legal restrictions limiting the ability of the Fund to sell particular securities at an advantageous price and/or time. As a result, these securities may be more difficult to value. Foreign investing involves special risks, such as currency fluctuations and political uncertainty.
The Fund invests in derivatives and is subject to the risk that the value of those derivative investments will fall because of pricing difficulties or lack of correlation with the underlying investment. There is no guarantee that the Fund will continue to hold any one particular security or stay invested in any one particular company. The composition of the Fund's top holdings is subject to change. Performance figures are historical and reflect the change in share price, reinvested distributions, changes in net asset value, sales charges and capital gains distributions, if any. Not FDIC Insured – No Bank Guarantee – May Lose Value 49 | October 31, 2015 .
ALPS | Red Rocks Listed Private Equity Fund Performance Update October 31, 2015 (Unaudited) Industry Sector Allocation (as a % of Net Assets) Top Ten Holdings (as a % of Net Assets) † HarbourVest Global Private Equity, Ltd. Aurelius AG Brookfield Asset Management, Inc., Class A The Blackstone Group LP 3i Group PLC Ackermans & van Haaren N.V. Onex Corp. Eurazeo SA SVG Capital PLC Schouw & Co. Top Ten Holdings † 6.31% 5.51% 4.95% 4.57% 4.56% 4.54% 4.17% 3.82% 3.76% 3.51% 45.70% Holdings are subject to change and my not reflect the current or future position of the portfolio. Table presents indicative values only. Financials - 67.99% Diversified - 14.55% Closed End Funds - 12.92% Industrials - 2.70% Cash, Cash Equivalents & Other Net Assets - 1.84% 50 | October 31, 2015 . ALPS | Red Rocks Listed Private Equity Fund Statement of Investments October 31, 2015 Value (Note 2) Shares CLOSEDâ€END FUNDS (12.92%) Apax Global Alpha, Ltd.(a) Graphite Enterprise Trust PLC HBM Healthcare Investments AG, Class A(a) HgCapital Trust PLC Oakley Capital Investments, (a) Ltd. Pantheon International Participations PLC, Ordinary Shares(a) Pantheon International Participations PLC, Redeemable Shares(a) 4,415,779 $ 677,006 8,202,884 6,402,937 139,507 1,043,999 13,041,071 17,220,907 3,990,546 8,858,639 217,971 4,569,933 357,700 6,768,814 65,065,185 TOTAL CLOSEDâ€END FUNDS (Cost $63,921,111) 65,065,185 COMMON STOCKS (85.24%) Diversified (14.55%) Holding Companiesâ€Diversified Operations (14.55%) Ackermans & van Haaren N.V. 150,099 22,860,313 Remgro, Ltd. 417,397 8,362,417 Schouw & Co. 337,708 17,676,224 Sofina SA 69,249 7,786,305 Wendel SA 138,185 16,585,908 73,271,167 TOTAL DIVERSIFIED 73,271,167 Financials (67.99%) Diversified Financial Services (11.93%) Apollo Global Management LLC, Class A 248,971 Ares Management LP 340,917 The Blackstone Group LP 696,330 The Carlyle Group LP 720,629 KKR & Co. LP 788,231 Shares Investment Companies (continued) Hosken Consolidated Investments, Ltd. 784,890 Investor AB, B Shares 433,882 IP Group PLC(a) 1,435,880 mutares AG 241,548 Onex Corp. 346,739 (a) 2,587,474 SVG Capital PLC $ 8,025,286 16,119,078 5,263,834 4,741,287 21,022,842 18,947,058 170,767,133 5,814,161 17,489,577 31,772,045 5,028,881 10,980,266 15,582,095 86,667,025 Private Equity (17.21%) (a) 361,447 Castle Private Equity, Ltd. Electra Private Equity PLC 305,797 HarbourVest Global Private (a) 2,433,266 Equity, Ltd. Ratos AB, B Shares 859,290 Riverstone Energy, Ltd.(a) 868,614 Standard Life European Private Equity Trust PLC, Ordinary Shares 4,859,486 Real Estate (4.95%) Brookfield Asset Management, Inc., Class A 713,024 24,934,449 342,480,172 Industrials (2.70%) Miscellaneous Manufacturers (2.70%) Danaher Corp. 145,799 13,604,505 TOTAL FINANCIALS 13,604,505 TOTAL INDUSTRIALS 429,355,844 4,548,700 5,519,446 23,020,670 13,504,587 13,518,162 60,111,565 Investment Companies (33.90%) 3i Group PLC 2,976,393 Altamir 777,365 Ares Capital Corp. 711,392 Aurelius AG 622,153 Eurazeo SA 273,077 Fifth Street Senior Floating Rate Corp. 428,100 Grand Parade Investments, Ltd. 8,990,517 Value (Note 2) 22,987,946 8,762,004 10,834,500 27,762,837 19,242,532 3,660,255 TOTAL COMMON STOCKS (Cost $389,864,360) 7-Day Yield Value (Note 2) Shares SHORT TERM INVESTMENTS (1.84%) Money Market Fund (1.84%) Morgan Stanley Institutional Liquidity Fund †Prime Portfolio 0.096% 9,262,230 3,397,674 TOTAL SHORT TERM INVESTMENTS (Cost $9,262,230) 51 | October 31, 2015 9,262,230 9,262,230 .
ALPS | Red Rocks Listed Private Equity Fund Statement of Investments October 31, 2015 Value (Note 2) TOTAL INVESTMENTS (100.00%) (Cost $463,047,701) $ 503,683,259 Liabilities In Excess Of Other Assets (0.00%)(b) (14,167) NET ASSETS (100.00%) $ 503,669,092 (a) (b) Non-Income Producing Security. Less than 0.005%. Common Abbreviations: AB - Aktiebolag is the Swedish equivalent of the term corporation. AG - Aktiengesellschaft is a German term that refers to a corporation that is limited by shares, i.e., owned by shareholders. LLC - Limited Liability Company. LP - Limited Partnership. Ltd. - Limited. N.V. - Naamloze Vennootschap is the Dutch term for a public limited liability corporation. PLC - Public Limited Company. SA - Generally designates corporations in various countries, mostly those employing the civil law. For Fund compliance purposes, the Fund's industry classifications refer to any one or more of the industry sub-classifications used by one or more widely recognized market indexes or ratings group indexes, and/or as defined by Fund management. This definition may not apply for purposes of this report, which may combine industry sub-classifications for reporting ease.
Industries are shown as a percent of net assets. See Notes to Financial Statements. 52 | October 31, 2015 . ALPS | Red Rocks Listed Private Equity Fund Statement of Assets and Liabilities October 31, 2015 ASSETS Investments, at value Foreign currency, at value (Cost $13,811) Receivable for investments sold Receivable for shares sold Dividends receivable Prepaid expenses and other assets Total Assets $ 503,683,259 13,811 491,242 450,191 713,039 29,452 505,380,994 $ 191,825 816,702 359,741 80,197 146,874 15,751 14,342 86,470 1,711,902 503,669,092 $ $ LIABILITIES Payable for investments purchased Payable for shares redeemed Investment advisory fees payable Administration and transfer agency fees payable Distribution and services fees payable Professional fees payable Custody fees payable Accrued expenses and other liabilities Total Liabilities NET ASSETS NET ASSETS CONSIST OF Paidâ€in capital Accumulated net investment loss Accumulated net realized gain on investments and foreign currency transactions Net unrealized appreciation on investments and translation of assets and liabilities denominated in foreign currencies NET ASSETS INVESTMENTS, AT COST PRICING OF SHARES $ 463,047,701 Class A: Net Asset Value, offering and redemption price per share Net Assets Shares of beneficial interest outstanding (unlimited number of shares, no par value common stock authorized) Maximum offering price per share ((NAV/0.9450), based on maximum sales charge of 5.50% of the offering price) Class C: (a) Net Asset Value, offering and redemption price per share Net Assets Shares of beneficial interest outstanding (unlimited number of shares, no par value common stock authorized) Class I: Net Asset Value, offering and redemption price per share Net Assets Shares of beneficial interest outstanding (unlimited number of shares, no par value common stock authorized) Class R: Net Asset Value, offering and redemption price per share Net Assets Shares of beneficial interest outstanding (unlimited number of shares, no par value common stock authorized) $ $ $ 6.76 193,560,508 28,650,579 7.15 $ 6.53 $ 19,299,831 2,953,420 $ 6.83 $ 287,740,949 42,118,570 (a) 448,817,078 (10,280,498) 24,527,341 40,605,171 503,669,092 $ $ 5.96 3,067,804 515,105 Redemption price per share may be reduced for any applicable contingent deferred sales charge. For a description of a possible sales charge, please see the Fund's Prospectus. See Notes to Financial Statements. 53 | October 31, 2015 . ALPS | Red Rocks Listed Private Equity Fund Statement of Operations For the Year Ended October 31, 2015 INVESTMENT INCOME Dividends Foreign taxes withheld on dividends Total Investment Income $ 11,783,440 (950,327) 10,833,113 EXPENSES Investment advisory fees Administrative fees Transfer agency fees Distribution and service fees Class A Class C Class R Professional fees Networking fees Class C Class I Class R Reports to shareholders and printing fees State registration fees Insurance fees Custody fees Trustees' fees and expenses Repayment of previously waived fees Class A Class I Miscellaneous expenses Total Expenses Net Investment Income Net realized gain on investments Net realized loss on foreign currency transactions Net realized gain distributions from other investment companies Net change in unrealized depreciation on investments Net change in unrealized depreciation on translation of assets and liabilities denominated in foreign currencies See Notes to Financial Statements. 54 | October 31, 2015 771,456 186,425 8,987 52,132 10,677 244,882 518 98,768 75,537 5,959 87,786 10,901 $ 58,222 14,669 23,082 6,572,621 4,260,492 36,491,629 (51,056) 6,673 (13,166,886) (16,464) 23,263,896 27,524,388 NET REALIZED AND UNREALIZED GAIN ON INVESTMENTS NET INCREASE IN NET ASSETS RESULTING FROM OPERATIONS 4,215,806 399,519 307,295 . ALPS | Red Rocks Listed Private Equity Fund Statements of Changes in Net Assets For the Year Ended October 31, 2015 For the Fiscal Period Ended October 31, 2014(a) For the Year Ended April 30, 2014 OPERATIONS Net investment income Net realized gain on investments and foreign currency transactions Net realized gain distributions from other investment companies Net change in unrealized appreciation/(depreciation) on investments and translation of assets and liabilities denominated in foreign currencies Net Increase/(Decrease) in Net Assets Resulting from Operations $ 4,260,492 $ 36,440,573 6,673 (13,183,350) 27,524,388 1,777,483 $ 2,203,871 9,109,785 30,962,396 – 7,133 (39,532,683) (28,638,282) 36,517,980 69,684,247 DISTRIBUTIONS Dividends to shareholders from net investment income Class A Class C Class I Class R Dividends to shareholders from net realized gains Class A Class C Class I Class R Net Decrease in Net Assets from Distributions (6,787,971) (546,212) (8,199,257) (38,970) (640,746) (55,244) (732,422) (3,531) (17,004,353) – – – – – – – – – (11,258,970) (444,823) (11,570,862) (25,293) – – – – (23,299,948) BENEFICIAL INTEREST TRANSACTIONS (NOTE 6) Shares sold Class A Class C Class I Class R Dividends reinvested Class A Class C Class I Class R Shares redeemed, net of redemption fees Class A Class C Class I Class R Net Increase in Net Assets Derived from Beneficial Interest Transactions Net increase in net assets NET ASSETS Beginning of year End of year * *Including accumulated net investment loss of: (a) 75,334,373 5,854,839 130,086,390 2,675,544 6,770,481 409,526 4,364,013 41,018 (97,968,261) (4,331,209) (101,036,008) (487,437) 21,713,269 32,233,304 471,435,788 $ 503,669,092 $ (10,280,498) 61,140,590 7,348,056 99,388,072 453,224 – – – – (50,641,540) (1,176,895) (36,901,005) (78,846) 79,531,656 50,893,374 420,542,414 $ 471,435,788 $ (13,757,302) Effective May 1, 2014, the Board approved changing the fiscal year-end of the Funds from April 30 to October 31. See Notes to Financial Statements. 55 | October 31, 2015 $ $ 104,537,580 7,052,467 93,622,391 330,734 10,565,914 357,600 4,362,094 23,238 (36,821,447) (554,548) (57,218,383) (52,283) 126,205,357 172,589,656 247,952,758 420,542,414 (21,142,940) . ALPS | Red Rocks Listed Private Equity Fund – Class A Financial Highlights Selected data for a share of beneficial interest outstanding throughout the periods indicated: For the Year Ended October 31, 2015 $6.61 For the Year Ended April 30, 2014 $6.05 For the Year Ended April 30, 2013 $4.67 For the Year Ended April 30, 2012 $6.44 For the Year Ended April 30, 2011 $5.17 0.05 0.34 0.39 (0.22) (0.02) (0.24) 0.02 (0.41) (0.39) – – – 0.03 1.37 1.40 (0.45) – (0.45) 0.08 1.39 1.47 (0.09) – (0.09) 0.07 (1.41) (1.34) (0.43) – (0.43) 0.04 1.61 1.65 (0.38) – (0.38) 0.00(c) 0.15 $6.76 0.00(c) (0.39) $6.61 0.00(c) 0.95 $7.00 0.00(c) 1.38 $6.05 0.00(c) (1.77) $4.67 0.00(c) 1.27 $6.44 6.01% Net asset value, beginning of period For the Fiscal Period Ended October 31, 2014(a) $7.00 (5.57)% 23.54% 31.75% (19.68)% 33.22% $203,996 $205,727 $105,488 $85,807 $124,874 1.59% (f) 1.64% 1.53% INCOME/(LOSS) FROM INVESTMENT OPERATIONS: Net investment income(b) Net realized and unrealized gain/(loss) Total from investment operations DISTRIBUTIONS: From net investment income From net realized gains Total distributions REDEMPTION FEES ADDED TO PAIDâ€IN CAPITAL (NOTE 6) Net increase/(decrease) in net asset value Net asset value, end of year TOTAL RETURN(d) RATIOS/SUPPLEMENTAL DATA: Net assets, end of year (000s) $193,561 Ratio of expenses to average net assets excluding fee waivers and (e) 1.47% reimbursements Ratio of expenses to average net assets including fee waivers and (e) 1.47%(g) reimbursements Ratio of net investment income to average (e) 0.72% net assets Portfolio turnover rate(i) 37% (a) (c) (d) (b) (e) (g) (f) (h) (i) 1.71% 1.70% 1.59%(f)(g) 1.64%(g) 1.51%(h) 1.50% 1.50% 0.71%(f) 11% 0.46% 40% 1.54% 32% 1.34% 72% 0.67% 43% Effective May 1, 2014, the Board approved changing the fiscal year-end of the Funds from April 30 to October 31. Calculated using the average shares method. Less than $0.005 per share. Total returns are for the period indicated and have not been annualized. Total returns would have been lower had certain expenses not been waived during the period. Returns shown do not reflect the deduction of taxes that a shareholder would pay on Fund distributions or the redemption of Fund shares. Returns shown exclude any applicable sales charges. The ratios exclude the impact of expenses of the underlying funds in which the Fund invests as represented in the Statement of Investments. Annualized. According to the Fund's shareholder services plan with respect to the Fund's Class A shares, any amount of such payment not paid during the Fund's fiscal year for such service activities shall be reimbursed to the Fund as soon as practical after the end of the fiscal year.
Fees were reimbursed to the Fund during the period ended October 31, 2015, for the prior fiscal year in the amount of 0.02% of average net assets of Class A shares, during the period ended October 31, 2014, for the prior fiscal year in the amount of 0.06% (annualized) of average net assets of Class A shares and during the year ended April 30, 2014, for the prior fiscal year in the amount of 0.01% of average net assets of Class A shares. Contractual expense limitation changed from 1.50% to 1.65% effective September 1, 2012. Portfolio turnover rate for periods less than one full year have not been annualized. See Notes to Financial Statements. 56 | October 31, 2015 . ALPS | Red Rocks Listed Private Equity Fund – Class C Financial Highlights Selected data for a share of beneficial interest outstanding throughout the periods indicated: For the Year Ended October 31, 2015 $6.43 For the Year Ended April 30, 2014 $5.92 For the Year Ended April 30, 2013 $4.59 For the Year Ended April 30, 2012 $6.37 For the Period July 2, 2010 (Inception) to April 30, 2011 $4.39 0.00(c) 0.32 0.32 (0.20) (0.02) (0.22) (0.00)(c) (0.40) (0.40) – – – (0.00)(c) 1.33 1.33 (0.42) – (0.42) 0.04 1.35 1.39 (0.06) – (0.06) 0.03 (1.39) (1.36) (0.42) – (0.42) (0.01) 2.36 2.35 (0.37) – (0.37) 0.00(c) 0.10 $6.53 0.00(c) (0.40) $6.43 0.00(c) 0.91 $6.83 0.00(c) 1.33 $5.92 0.00(c) (1.78) $4.59 0.00(c) 1.98 $6.37 5.14% (5.86)% 22.97% 30.55% (20.33)% 55.32% $19,300 Net asset value, beginning of period For the Fiscal Period Ended October 31, 2014(a) $6.83 $17,193 $12,200 $4,417 $2,838 $2,566 INCOME/(LOSS) FROM INVESTMENT OPERATIONS: Net investment income/(loss)(b) Net realized and unrealized gain/(loss) Total from investment operations DISTRIBUTIONS: From net investment income From net realized gains Total distributions REDEMPTION FEES ADDED TO PAIDâ€IN CAPITAL (NOTE 6) Net increase/(decrease) in net asset value Net asset value, end of year TOTAL RETURN(d) RATIOS/SUPPLEMENTAL DATA: Net assets, end of year (000s) Ratio of expenses to average net assets excluding fee waivers and reimbursements(e) Ratio of expenses to average net assets including fee waivers and reimbursements(e) Ratio of net investment income/(loss) to (e) average net assets (g) Portfolio turnover rate (c) (d) (b) (e) (g) (h) (f) 2.15% (f) 2.20% 2.25% 2.37% 2.31% (f) 2.12% (a) 2.12% 2.15%(f) 2.20% 2.25% 2.25% 2.25%(f) 0.06% 37% (0.13)%(f) 11% (0.04)% 40% 0.79% 32% 0.59% 72% (0.19)%(f) (h) 43% Effective May 1, 2014, the Board approved changing the fiscal year-end of the Funds from April 30 to October 31. Calculated using the average shares method. Less than $0.005 per share. Total returns are for the period indicated and have not been annualized. Total returns would have been lower had certain expenses not been waived during the period. Returns shown do not reflect the deduction of taxes that a shareholder would pay on Fund distributions or the redemption of Fund shares. Returns shown exclude any applicable sales charges. The ratios exclude the impact of expenses of the underlying funds in which the Fund invests as represented in the Statement of Investments. Annualized. Portfolio turnover rate for periods less than one full year have not been annualized. Portfolio turnover rate is calculated at the Fund Level and represents the year ended April 30, 2011. See Notes to Financial Statements. 57 | October 31, 2015 .
ALPS | Red Rocks Listed Private Equity Fund – Class I Financial Highlights Selected data for a share of beneficial interest outstanding throughout the periods indicated: For the Year Ended October 31, 2015 $6.67 For the Year Ended April 30, 2014 $6.08 For the Year Ended April 30, 2013 $4.69 For the Year Ended April 30, 2012 $6.47 For the Year Ended April 30, 2011 $5.19 0.07 0.34 0.41 (0.23) (0.02) (0.25) 0.03 (0.41) (0.38) – – – 0.06 1.37 1.43 (0.46) – (0.46) 0.12 1.36 1.48 (0.09) – (0.09) 0.08 (1.42) (1.34) (0.44) – (0.44) 0.05 1.62 1.67 (0.39) – (0.39) 0.00(c) 0.16 $6.83 0.00(c) (0.38) $6.67 0.00(c) 0.97 $7.05 0.00(c) 1.39 $6.08 0.00(c) (1.78) $4.69 0.00(c) 1.28 $6.47 6.30% Net asset value, beginning of period For the Fiscal Period Ended October 31, 2014(a) $7.05 (5.39)% 24.02% 31.99% (19.52)% 33.47% $249,375 $202,076 $137,856 $77,750 $66,854 1.25% (f) 1.25% 1.27% 1.41% 1.36% 1.25%(f) 1.25% 1.25% 1.25% 1.25% 0.85%(f) 11% 0.91% 40% 2.27% 32% 1.60% 72% 0.91% 43% INCOME/(LOSS) FROM INVESTMENT OPERATIONS: Net investment income(b) Net realized and unrealized gain/(loss) Total from investment operations DISTRIBUTIONS: From net investment income From net realized gains Total distributions REDEMPTION FEES ADDED TO PAIDâ€IN CAPITAL (NOTE 6) Net increase/(decrease) in net asset value Net asset value, end of year TOTAL RETURN(d) RATIOS/SUPPLEMENTAL DATA: (a) (c) (d) (b) (e) (g) (f) Net assets, end of year (000s) $287,741 Ratio of expenses to average net assets excluding fee waivers and reimbursements(e) 1.16% Ratio of expenses to average net assets including fee waivers and reimbursements(e) 1.16% Ratio of net investment income to average (e) 1.02% net assets (g) 37% Portfolio turnover rate Effective May 1, 2014, the Board approved changing the fiscal year-end of the Funds from April 30 to October 31. Calculated using the average shares method. Less than $0.005 per share. Total returns are for the period indicated and have not been annualized. Total returns would have been lower had certain expenses not been waived during the period. Returns shown do not reflect the deduction of taxes that a shareholder would pay on Fund distributions or the redemption of Fund shares. The ratios exclude the impact of expenses of the underlying funds in which the Fund invests as represented in the Statement of Investments. Annualized. Portfolio turnover rate for periods less than one full year have not been annualized. See Notes to Financial Statements. 58 | October 31, 2015 . ALPS | Red Rocks Listed Private Equity Fund – Class R Financial Highlights Selected data for a share of beneficial interest outstanding throughout the periods indicated: For the Year Ended October 31, 2015 $5.87 For the Year Ended April 30, 2014 $5.41 For the Year Ended April 30, 2013 $4.17 For the Year Ended April 30, 2012 $5.82 For the Year Ended April 30, 2011 $4.73 0.03 0.31 0.34 (0.23) (0.02) (0.25) 0.01 (0.36) (0.35) – – – 0.02 1.22 1.24 (0.44) – (0.44) 0.08 1.24 1.32 (0.08) – (0.08) 0.05 (1.27) (1.22) (0.43) – (0.43) 0.03 1.43 1.46 (0.37) – (0.37) 0.00(c) 0.09 $5.96 0.01 (0.34) $5.87 – 0.80 $6.21 – 1.24 $5.41 – (1.65) $4.17 – 1.09 $5.82 5.87% Net asset value, beginning of period For the Fiscal Period Ended October 31, 2014(a) $6.21 (5.48)% 23.50% 32.05% (19.93)% 32.47% $872 $540 $191 $46 $125 1.63% (f) 1.72% 1.85% 1.89% 1.87% 1.63%(f) 1.72% 1.75% 1.75% 1.75% 0.46%(f) 11% 0.36% 40% 1.80% 32% 1.10% 72% 0.66% 43% INCOME/(LOSS) FROM INVESTMENT OPERATIONS: Net investment income(b) Net realized and unrealized gain/(loss) Total from investment operations DISTRIBUTIONS: From net investment income From net realized gains Total distributions REDEMPTION FEES ADDED TO PAIDâ€IN CAPITAL (NOTE 6) Net increase/(decrease) in net asset value Net asset value, end of year TOTAL RETURN(d) RATIOS/SUPPLEMENTAL DATA: (a) (c) (d) (b) (e) (g) (f) Net assets, end of year (000s) $3,068 Ratio of expenses to average net assets excluding fee waivers and reimbursements(e) 1.60% Ratio of expenses to average net assets including fee waivers and reimbursements(e) 1.60% Ratio of net investment income to average (e) 0.52% net assets (g) 37% Portfolio turnover rate Effective May 1, 2014, the Board approved changing the fiscal year-end of the Funds from April 30 to October 31. Calculated using the average shares method. Less than $0.005 per share. Total returns are for the period indicated and have not been annualized. Total returns would have been lower had certain expenses not been waived during the period. Returns shown do not reflect the deduction of taxes that a shareholder would pay on Fund distributions or the redemption of Fund shares. The ratios exclude the impact of expenses of the underlying funds in which the Fund invests as represented in the Statement of Investments. Annualized. Portfolio turnover rate for periods less than one full year have not been annualized. See Notes to Financial Statements. 59 | October 31, 2015 . ALPS | Sterling ETF Tactical Rotation Fund Management Commentary October 31, 2015 (Unaudited) During the twelve month period ending October 31, 2015 the ALPS ETF Tactical Rotation Fund’s ("Fund") Class I Shares produced a negative return of â€3.30% compared to a 3.04% return for the S&P 500 and a negative â€0.92% return for the Morningstar Global Allocation Index. The Fund rotates between six asset classes using ETFs for exposure. The Fund attempts to avoid asset classes that are experiencing prolonged declining values by using momentum to both allocate and equally weight the top two asset classes on a monthly basis. The rulesâ€based approach includes commodities, U.S. and international equities, U.S. bonds, REITs and cash. At the end of October, the Fund was allocated approximately 50% to U.S. bonds and 50% to cash. Over the period, the Fund paid one dividend: $0.076 per share on December 29, 2014. Across the 12 month period, the Fund owned REITs for six months for an overall exposure of 25%, U.S. bonds for six months or 25% exposure, International equities for five months or 20.83% exposure, cash for five months or 20.84% exposure and U.S. bonds for two months for an overall exposure of 8.33%. The Fund did not allocate to commodities during this period as they were the worst performing asset class. The DB Commodity Index fell â€31.89% through the 12 months ending October 31, 2015. The Fund uses momentum to allocate 50% allocations to the top two asset classes. The theory behind the investment methodology is that, under normal market conditions, a couple of asset classes should be trending higher, while a couple of asset classes are trending lower. The process is designed to invest in the strongest two asset classes that are trending higher over the longâ€term and to avoid the asset classes exhibiting less strength on a relative basis. Cash is utilized as a safety net in the event that everything is dropping in unison. While the investment process works well during normal market cycles, the past year has been anything but normal. Since our Sterling Tactical Rotation Index went live on June 23, 2010, the past year has been the first sideways trading cycle we have encountered. Asset classes have trended higher for very short periods of time and then reversed course lower for short periods of time, and so on, which has caused the Fund to underperform the Morningstar Global Allocation benchmark during the period. We believe this period has been a market anomaly that will soon reverse course as markets begin to behave in a more normal fashion. The Fund uses two distinct risk management tools to seek to dampen downside. Both were employed during this 12â€month period. The first was the utilization of cash as an asset class. Throughout the 3rd quarter of 2015 the Fund’s cash exposure was 66.67%, during which the Fund fell â€2.43% compared to the S&P 500 negative return of â€6.93%. The second is avoiding asset classes in prolonged downâ€trends. As previously mentioned, the Fund avoided the â€31.89% collapse of commodities entirely. The period has been uncharacteristically driven by “will the Fed, won’t the Fed” rhetoric which has also negatively impacted the Fund. We anticipate that once the Fed begins to raise interest rates investors will once again become more focused on economic and corporate growth and less on Federal Reserve rhetoric. Mark W. Eicker Chief Investment Officer Sterling Global Strategies The views of the author and information discussed in this commentary are as of the date of publication, are subject to change, and may not reflect the writer's current views. The views expressed are those of the author only, and represent an assessment of market conditions at a specific point in time, are opinions only and should not be relied upon as investment advice regarding a particular investment or markets in general. Such information does not constitute a recommendation to buy or sell specific securities or investment vehicles. It should not be assumed that any investment will be profitable or will equal the performance of the fund(s) or any securities or any sectors mentioned in this letter.
The subject matter contained in this letter has been derived from several sources believed to be reliable and accurate at the time of compilation. Neither ALPS Advisors, Inc., Sterling Global Strategies, nor the Fund accepts any liability for losses either direct or consequential caused by the use of this information. Diversification cannot guarantee gain or prevent losses. 60 | October 31, 2015 . ALPS | Sterling ETF Tactical Rotation Fund Performance Update October 31, 2015 (Unaudited) Performance of $10,000 Initial Investment (as of October 31, 2015) Comparison of change in value of a $10,000 investment (includes maximum sales charges of 5.50%) $11k $10.5k $9.5k Sterling Tactical Rotation Index - TR - $9,814 Morningstar Global Allocation Index - $9,775 ALPS | Sterling ETF Tactical Rotation Fund Class A (NAV) - $9,593 $9k ALPS | Sterling ETF Tactical Rotation Fund Class A (MOP) - $9,068 10/31/15 4/30/15 10/31/14 6/30/14^ $10k The chart above represents historical performance of a hypothetical investment of $10,000 in the Fund since inception. Past performance does not guarantee future results. This chart does not reflect the deduction of taxes that a shareholder would pay on Fund distributions or the redemption of Fund shares. Average Annual Total Returns (as of October 31, 2015) Class A (NAV) 6 Month â€4.60% 1 Year â€3.78% Since Inception^ â€3.06% Class A (MOP) â€9.84% â€9.07% â€7.06% Class C (NAV) â€4.92% â€4.37% â€3.65% Class C (CDSC) â€5.88% â€5.32% â€3.65% Class I (NAV) Morningstar Global Allocation Index1 â€4.39% â€3.20% â€2.55% â€3.42% â€0.92% â€1.69% Total Expense Ratio What You Pay* 1.85% 1.75% 2.45% 2.35% 1.45% 1.35% 2 Sterling Tactical Rotation Index TR â€3.90% â€2.30% â€1.40% Performance data quoted represents past performance. Past performance does not guarantee future results.
Investment return and principal value of an investment will fluctuate so that an investor's shares, when sold or redeemed, may be worth more or less than the original cost. Current performance data may be higher or lower than actual data quoted. For the most current month-end performance data, please call 1-866-759-5679. Maximum Offering Price (MOP) for Class A shares includes the Fund’s maximum sales charge of 5.50%. Performance shown at NAV does not include these sales charges and would have been lower had it been taken into account.
If you invest $1 million or more, either as a lump sum or through the Fund’s accumulation or letter of intent programs, you can purchase Class A shares without an initial sales charge (load). A Contingent Deferred Sales Charge (“CDSC”) of 1.00% may apply to Class C shares redeemed within the first 12 months after purchase, and on Class A shares redeemed within the first 18 months after purchase in excess of $1 million. The Fund imposes a 2.00% redemption fee on shares held less than 30 days. Performance less than 1 year is cumulative. 61 | October 31, 2015 .
ALPS | Sterling ETF Tactical Rotation Fund Performance Update October 31, 2015 (Unaudited) 1 Morningstar Global Allocation Index: Global allocation portfolios seek to provide both capital appreciation and income by investing across three areas: global equities, global bonds, and cash. The Morningstar Global Allocation Index represents a multi-asset-class portfolio of 60% global equities and 40% global bonds. An investor may not invest directly in an index. 2 The Sterling Tactical Rotation Index - seeks to provide absolute returns during any market cycle or condition by employing an equally weighted strategic rotation model, trading between commodities, REITs, bonds, international and domestic equities. An investor may not invest directly in an index. ^ Fund inception date of June 30, 2014. * What You Pay reflects the Advisor’s decision to contractually limit expenses through February 29, 2016 and estimated Acquired Fund Fees and Expenses of 0.20%.
Please see the prospectus for additional information. The Fund is “non-diversified” and will generally be more volatile than diversified funds. Investments in small and mid-cap companies generally will experience greater price volatility. International and Emerging markets are riskier than more developed markets because they tend to develop unevenly and may never fully develop. Prices of fixed income securities generally increase when interest rates decline and decrease when interest rates increase and may cause losses.
Real estate investments are subject to specific risks, such as risks related to general and local economic conditions and risks related to individual properties. The Fund invests in Exchange Traded Funds (“ETFs”) and the Fund could lose money by investing in an ETF if the prices of the securities owned by the ETF go down. The Fund’s shareholders will indirectly incur the fees and expenses charged by the underlying ETFs held by the Fund, in addition to the expense charged by the Fund. Commodities and futures generally are volatile and involve a high degree of risk. This fund enters into a short sale by selling a security it has borrowed.
If the market price of a security increases after the Fund borrows the security, the Fund will suffer a potentially unlimited loss when it replaces the borrowed security at the higher price. The use of derivatives exposes the Fund to additional risks including increased volatility, lack of liquidity, and possible losses greater than the Fund’s initial investment as well as increased transaction. The table does not reflect the deduction of taxes that a shareholder would pay on Fund distributions or the redemption of Fund shares. This Fund is not suitable for all investors and is subject to investment risks, including possible loss of the principal amount invested. There is no guarantee that the Fund will continue to hold any one particular security or stay invested in any one particular company. The composition of the Fund's top holdings is subject to change.
Performance figures are historical and reflect the change in share price, reinvested distributions, changes in net asset value, sales charges and capital gains distributions, if any. The ALPS | Sterling ETF Tactical Rotation Fund is new and has limited operating history. Not FDIC Insured – No Bank Guarantee – May Lose Value Portfolio Composition (as a % of Net Assets) * REITs - 49.86% Bonds - 49.86% Cash, Cash Equivalents & Other Net Assets - 0.28% * Holdings are subject to change, and may not reflect the current or future position of the portfolio. 62 | October 31, 2015 . ALPS | Sterling ETF Tactical Rotation Fund Statement of Investments October 31, 2015 Value (Note 2) Shares EXCHANGE TRADED FUNDS (99.73%) Vanguard® REIT ETF 217,363 $ 17,365,130 Vanguard® Total Bond Market ETF 212,313 17,365,080 34,730,210 TOTAL EXCHANGE TRADED FUNDS (Cost $34,763,995) 34,730,210 TOTAL INVESTMENTS (99.73%) (Cost $34,763,995) Other Assets In Excess Of Liabilities (0.27%) NET ASSETS (100.00%) $ 34,730,210 94,797 $ 34,825,007 Common Abbreviations: ETF - Exchange Traded Fund. REIT - Real Estate Investment Trust For Fund compliance purposes, the Fund's industry classifications refer to any one or more of the industry sub-classifications used by one or more widely recognized market indexes or ratings group indexes, and/or as defined by Fund management. This definition may not apply for purposes of this report, which may combine industry sub-classifications for reporting ease. Industries are shown as a percent of net assets. See Notes to Financial Statements. 63 | October 31, 2015 . ALPS | Sterling ETF Tactical Rotation Fund Statement of Assets and Liabilities October 31, 2015 ASSETS Investments, at value Receivable for investments sold Receivable for shares sold Dividends and interest receivable Prepaid expenses and other assets Total Assets $ 34,730,210 17,406,794 168,111 11 17,828 52,322,954 $ 17,366,760 27,190 41,240 14,261 9,653 14,858 24 15,669 8,292 17,497,947 34,825,007 $ $ 36,579,355 124,311 (1,844,874) (33,785) 34,825,007 LIABILITIES Payable for investments purchased Payable for shares redeemed Payable due to custodian †overdraft Investment advisory fees payable Administration and transfer agency fees payable Distribution and services fees payable Trustees' fees and expenses payable Professional fees payable Accrued expenses and other liabilities Total Liabilities NET ASSETS NET ASSETS CONSIST OF Paidâ€in capital Accumulated net investment income Accumulated net realized loss on investments Net unrealized depreciation on investments NET ASSETS INVESTMENTS, AT COST PRICING OF SHARES $ 34,763,995 Class A: Net Asset Value, offering and redemption price per share Net Assets Shares of beneficial interest outstanding (unlimited number of shares, no par value common stock authorized) Maximum offering price per share ((NAV/0.9450), based on maximum sales charge of 5.50% of the offering price) Class C: (a) Net Asset Value, offering and redemption price per share Net Assets Shares of beneficial interest outstanding (unlimited number of shares, no par value common stock authorized) Class I: Net Asset Value, offering and redemption price per share Net Assets Shares of beneficial interest outstanding (unlimited number of shares, no par value common stock authorized) $ $ $ $ $ (a) 9.46 2,530,009 267,357 9.53 14,233,597 1,493,094 10.08 $ 9.59 $ 18,061,401 1,883,473 Redemption price per share may be reduced for any applicable contingent deferred sales charge. For a description of a possible sales charge, please see the Fund's Prospectus. See Notes to Financial Statements. 64 | October 31, 2015 . ALPS | Sterling ETF Tactical Rotation Fund Statement of Operations For the Year Ended October 31, 2015 INVESTMENT INCOME Dividends Total Investment Income $ 570,633 570,633 EXPENSES Investment advisory fees Administrative fees Transfer agency fees Distribution and service fees Class A Class C Professional fees Networking fees Class A Class C Class I Reports to shareholders and printing fees State registration fees SEC registration fees Insurance fees Custody fees Trustees' fees and expenses Offering costs Miscellaneous expenses Total Expenses Less fees waived/reimbursed by investment advisor (Note 8) Class A Class C Class I Net Expenses Net Investment Income Net realized loss on investments Net change in unrealized depreciation on investments See Notes to Financial Statements. 65 | October 31, 2015 16 4 8,545 6,297 28,650 2,582 74 5,301 685 47,768 8,434 550,241 $ (78,926) (8,258) (86,740) 376,317 194,316 (1,696,139) (273,084) (1,969,223) (1,774,907) 51,076 14,151 16,346 NET REALIZED AND UNREALIZED LOSS ON INVESTMENTS NET DECREASE IN NET ASSETS RESULTING FROM OPERATIONS 256,993 100,886 2,433 . ALPS | Sterling ETF Tactical Rotation Fund Statements of Changes in Net Assets For the Period July 1, 2014 (Commencement) to October 31, 2014 For the Year Ended October 31, 2015 OPERATIONS Net investment income Net realized loss on investments Net change in unrealized appreciation/(depreciation) on investments Net Increase/(Decrease) in Net Assets Resulting from Operations $ DISTRIBUTIONS Dividends to shareholders from net investment income Class A Class C Class I Total Distributions Net Decrease in Net Assets from Distributions 194,316 (1,696,139) (273,084) (1,774,907) $ (55,630) (4,086) (67,213) (126,929) (126,929) 13,776 (148,734) 239,299 104,341 – – – – – BENEFICIAL INTEREST TRANSACTIONS (NOTE 6) Shares sold Class A Class C Class I Dividends reinvested Class A Class C Class I Shares redeemed, net of redemption fees Class A Class C Class I Net Increase in Net Assets Derived from Beneficial Interest Transactions Net increase in net assets NET ASSETS Beginning of period End of year * *Including accumulated net investment income of: See Notes to Financial Statements. 66 | October 31, 2015 $ $ 16,208,475 2,475,711 14,687,621 50,265 3,473 56,161 (6,305,132) (352,476) (3,228,985) 23,595,113 21,693,277 13,131,730 34,825,007 124,311 $ $ 5,280,333 540,462 7,423,186 – – – (85,902) (8,249) (122,441) 13,027,389 13,131,730 – 13,131,730 21,251 . ALPS | Sterling ETF Tactical Rotation Fund – Class A Financial Highlights Selected data for a share of beneficial interest outstanding throughout the periods indicated: For the Year Ended October 31, 2015 $9.97 0.06 (0.43) (0.37) (0.07) (0.07) 0.00(b) (0.44) $9.53 Net investment income(a) Net realized and unrealized loss Total from investment operations DISTRIBUTIONS: From net investment income Total distributions REDEMPTION FEES ADDED TO PAIDâ€IN CAPITAL (NOTE 6) Net (decrease) in net asset value Net asset value, end of year TOTAL RETURN(c) 0.02 (0.05) (0.03) – – 0.00(b) (0.03) $9.97 (3.78)% Net asset value, beginning of period INCOME FROM INVESTMENT OPERATIONS: For the Period July 1, 2014 (Commencement) to October 31, 2014 $10.00 (0.30)% $14,234 2.16% 1.55% 0.58% 465% $5,262 5.01% (d) (d) 1.55% 0.67% (d) 181% RATIOS/SUPPLEMENTAL DATA: Net assets, end of year (000s) Ratio of expenses to average net assets excluding fee waivers and reimbursements Ratio of expenses to average net assets including fee waivers and reimbursements Ratio of net investment income to average net assets Portfolio turnover rate(e) (a) (c) (b) (d) (e) Calculated using the average shares method. Less than $0.005 per share. Total returns are for the period indicated and have not been annualized. Total returns would have been lower had certain expenses not been waived during the period. Returns shown do not reflect the deduction of taxes that a shareholder would pay on Fund distributions or the redemption of Fund shares. Returns shown exclude any applicable sales charges. Annualized. Portfolio turnover rate for periods less than one full year have not been annualized. See Notes to Financial Statements. 67 | October 31, 2015 .
ALPS | Sterling ETF Tactical Rotation Fund – Class C Financial Highlights Selected data for a share of beneficial interest outstanding throughout the periods indicated: For the Year Ended October 31, 2015 $9.95 (0.00)(b) (0.43) (0.43) (0.06) (0.06) (0.49) $9.46 Net investment income(a) Net realized and unrealized loss Total from investment operations DISTRIBUTIONS: From net investment income Total distributions Net (decrease) in net asset value Net asset value, end of year TOTAL RETURN(c) – (0.05) (0.05) – – (0.05) $9.95 (4.37)% Net asset value, beginning of period INCOME FROM INVESTMENT OPERATIONS: For the Period July 1, 2014 (Commencement) to October 31, 2014 $10.00 (0.50)% $2,530 2.73% 2.15% (0.05%) 465% $530 (d) 9.70% 2.15% (d) 0.12% (d) 181% RATIOS/SUPPLEMENTAL DATA: Net assets, end of year (000s) Ratio of expenses to average net assets excluding fee waivers and reimbursements Ratio of expenses to average net assets including fee waivers and reimbursements Ratio of net investment income/(loss) to average net assets Portfolio turnover rate(e) (a) (c) (b) (d) (e) Calculated using the average shares method. Less than $0.005 per share. Total returns are for the period indicated and have not been annualized. Total returns would have been lower had certain expenses not been waived during the period. Returns shown do not reflect the deduction of taxes that a shareholder would pay on Fund distributions or the redemption of Fund shares. Returns shown exclude any applicable sales charges. Annualized. Portfolio turnover rate for periods less than one full year have not been annualized. See Notes to Financial Statements. 68 | October 31, 2015 .
ALPS | Sterling ETF Tactical Rotation Fund – Class I Financial Highlights Selected data for a share of beneficial interest outstanding throughout the periods indicated: For the Year Ended October 31, 2015 $9.98 0.09 (0.40) (0.31) (0.08) (0.08) 0.00(b) (0.39) $9.59 Net investment income(a) Net realized and unrealized loss Total from investment operations DISTRIBUTIONS: From net investment income Total distributions REDEMPTION FEES ADDED TO PAIDâ€IN CAPITAL (NOTE 6) Net (decrease) in net asset value Net asset value, end of year TOTAL RETURN(c) 0.03 (0.05) (0.02) – – – (0.02) $9.98 (3.20)% Net asset value, beginning of period INCOME FROM INVESTMENT OPERATIONS: For the Period July 1, 2014 (Commencement) to October 31, 2014 $10.00 (0.20)% $18,061 1.83% 1.15% 0.95% 465% $7,340 5.93% (d) (d) 1.15% 0.94% (d) 181% RATIOS/SUPPLEMENTAL DATA: Net assets, end of year (000s) Ratio of expenses to average net assets excluding fee waivers and reimbursements Ratio of expenses to average net assets including fee waivers and reimbursements Ratio of net investment income to average net assets Portfolio turnover rate(e) (a) (c) (b) (d) (e) Calculated using the average shares method. Less than $0.005 per share. Total returns are for the period indicated and have not been annualized. Total returns would have been lower had certain expenses not been waived during the period. Returns shown do not reflect the deduction of taxes that a shareholder would pay on Fund distributions or the redemption of Fund shares. Annualized. Portfolio turnover rate for periods less than one full year have not been annualized. See Notes to Financial Statements. 69 | October 31, 2015 . ALPS | Westport Resources Hedged High Income Fund Management Commentary October 31, 2015 (Unaudited) Portfolio Review – October 2015 The ALPS | Westport Resources Hedged High Income Fund’s (the “Fund”) Class I shares declined 0.89% for the fiscal year ended October 31, 2015, net of fees. The Fund has outperformed the average of the Morningstar Nonâ€Traditional Bond Universe by 0.40% for the year. The Barclays US Aggregate Bond Index advanced 1.95% for the same period in what has been a very volatile period. The 30†day SEC yield for the Fund at month end was 7.27% with an average weighted duration of 1.3 years. The Fund is invested in three subâ€strategies: the Senior Loan Floating Rate Strategy, the Short Duration High Yield Strategy, and the Relative Value Long/Short Debt Strategy. Fund assets are allocated approximately oneâ€third to each subâ€strategy. The Senior Loan Floating Rate Strategy has been the strongest contributor to the Fund’s performance for the past year with consistent positive returns for ten of the last twelve months. Its return of 5.16% exceeds its benchmark, the Credit Suisse Leverage Loan Index, by more than 400 basis points. The Relative Value Long/Short Debt Strategy and the Short Duration High Yield Strategy had negative returns for the period, â€0.68% and â€0.92%, respectively. Calendar year to date, all three strategies are posting positive returns. All individual strategy returns are gross of fees. As noted in the past, the softness in performance has created greater opportunities within different sectors, as Treasury yields remain low and range bound. The ability of our subâ€advisors to exploit different sectors of the credit markets should provide opportunities to add alpha through sector and issue selection. The Fund’s combination of the three active hedged credit strategies should make the navigation a much smoother ride through what has, and continues to be, a volatile market environment. Economic and Fixed Income Review The consensus among the Fund’s subâ€advisors is that even after the recent rally in spreads, the broad corporate credit valuations are reasonable when coupled with their outlook for trending modest domestic economic growth. Investment Grade corporate spreads offer compensation well in excess of fundamental credit risks. They remain constructive on spreads even in the face of a potential Federal Reserve Open Market Committee (the “FOMC”) “liftâ€off.” The solid performance of the labor market and robust private domestic demand, was reflected by the latest upward revision to second quarter GDP that was in large part spurred by private consumption. That said, inflation indicators remain soft and well below target. The Fed, however, appears prepared to see through the disinflationary oneâ€off effects from lower commodity prices and dollar strength. Though the gap within the leveraged finance space has recently narrowed, High Yield bonds remain moderately attractive versus Leveraged Loans. They view the 7.5% allâ€inâ€yield on offer by the U.S. High Yield market as attractive for incomeâ€seeking investors. The loan market continues to be a buyer’s market as new issue supply outweighs investor inflows and secondary market prices remain soft. This technical dynamic allowed investors to drive well†structured deals with attractive yield opportunities in companies with strong business fundamentals. CLO (Collateralized Loan Obligation) new issuance was $7.3 billion in October and retail outflows were $0.7 billion, whereas the loan market grew $10.4 billion to $855 billion of outstanding loans. Defaults decreased 2 basis points in October to 1.33% and they expect loan defaults outside of the energy and metals/mining sectors to remain low for the remainder of 2015. Given the significant M&A forward calendar of $56.8 billion and the moderate projection for CLO issuance, expectations for the market are to remain investor friendly for the remainder of the year. Outlook and Current Positioning Themes: ï‚· ï‚· ï‚· ï‚· GDP growth expected to rebound to around 3% in Q4 2015 and build slowly into next year. U.S consumers are spending with real final sales forecasted to remain above 3%. Low global growth and inflation expectations translate into low global yields. Most indicators of domestic labor market conditions have recovered to preâ€recession levels. Macro and Rates: ï‚· FOMC monetary normalization process expected to start in December. ï‚· Pace of rate hikes will be much slower and lower than prior cycles. ï‚· Modest long duration bias and scaling back on short intermediate swap spreads. Corporate Credit: Net Long Bias ï‚· Valuations are attractive on a long term basis after recovering in October. ï‚· U.S. corporate market spreads offer value relative to global alternatives. ï‚· Market technicals will play a large role in asset pricing. Securitized Credit: Long Bias ï‚· Outlook for U.S. housing is positive. ï‚· Securitized credit sector offers an attractive alternative to higher yielding corporate credit. ï‚· Underlying mortgage loan performance reflects better credit underwriting. Mark R. Tonucci, Coâ€Portfolio Manager Michael E. Portnoy, Coâ€Portfolio Manager The views of the author and information discussed in this commentary are as of the date of publication, are subject to change, and may not reflect the writer's current views. The views expressed are those of the author only, and represent an assessment of market conditions at a specific point in time, are opinions only and should not be relied upon as investment advice regarding a particular investment or markets in general. Such information does not constitute a recommendation to buy or sell specific securities or investment vehicles. It should not be assumed that any investment will be profitable or will equal the performance of the fund(s) or any securities or any sectors mentioned in this letter.
The subject matter contained in this letter has been derived from several sources believed to be reliable and accurate at the time of compilation. Neither ALPS Advisors, Inc., Westport Resources Management, Inc. nor the Fund accepts any liability for losses either direct or consequential caused by the use of this information. Diversification cannot guarantee gain or prevent loss. The Credit Suisse Leverage Loan Index is an index designed to mirror the investable universe of the US-denominated leveraged loan market. 70 | October 31, 2015 . ALPS | Westport Resources Hedged High Income Fund Performance Update October 31, 2015 (Unaudited) Performance of $10,000 Initial Investment (as of October 31, 2015) Comparison of change in value of a $10,000 investment (includes maximum sales charges of 5.50%) $11k Barclays U.S. Aggregate Bond Index - $10,718 $10.5k ALPS | Westport Resources Hedged High Income Fund Class A, (NAV) - $10,079 $10k ALPS | Westport Resources Hedged High Income Fund Class A, (MOP) - $9,526 $9.5k 10/31/15 4/30/15 10/31/14 4/30/14 12/31/13^ $9k The chart above represents historical performance of a hypothetical investment of $10,000 in the Fund since inception. Past performance does not guarantee future results. This chart does not reflect the deduction of taxes that a shareholder would pay on Fund distributions or the redemption of Fund shares. Average Annual Total Returns (as of October 31, 2015) Class A (NAV) Class A (MOP) Class C (NAV) Class C (CDSC) Class I Barclays U.S. Aggregate Bond Index1 6 Month â€1.76% â€7.19% â€2.15% â€3.11% â€1.63% 1 Year â€1.32% â€6.71% â€1.90% â€2.83% â€0.89% Since Inception^ 0.43% â€2.61% â€0.23% â€0.23% 0.80% â€0.10% 1.96% 3.85% Total Expense Ratio What You Pay* 3.64% 2.39% 4.25% 2.99% 3.39% 1.99% Performance data quoted represents past performance.
Past performance does not guarantee future results. Investment return and principal value of an investment will fluctuate so that an investor's shares, when sold or redeemed, may be worth more or less than the original cost. Current performance data may be higher or lower than actual data quoted. For the most current month-end performance data, please call 1-866-759-5679. Maximum Offering Price (MOP) for Class A shares includes the Fund’s maximum sales charge of 5.50%.
Performance shown at NAV does not include these sales charges and would have been lower had it been taken into account. If you invest $1 million or more, either as a lump sum or through the Fund’s accumulation or letter of intent programs, you can purchase Class A shares without an initial sales charge (load). A Contingent Deferred Sales Charge (“CDSC”) of 1.00% may apply to Class C shares redeemed within the first 12 months after a purchase, and on Class A shares redeemed within the first 18 months after a purchase in excess of $1 million. Performance less than 1 year is cumulative. 71 | October 31, 2015 .
ALPS | Westport Resources Hedged High Income Fund Performance Update 1 ^ * October 31, 2015 (Unaudited) The Barclays U.S. Aggregate Bond Index is a broad-based benchmark that measures the investment grade, U.S. dollar-denominated, fixed-rate taxable bond market, including Treasuries, government-related and corporate securities, MBS (agency fixed-rate and hybrid ARM passthroughs), ABS, and CMBS. The index is not actively managed and does not reflect any deductions for fees, expenses or taxes.
An investor may not invest directly in an index. Fund inception date of December 31, 2013. What You Pay reflects the Advisor’s decision to contractually limit expenses through February 29, 2016. Please see the prospectus for additional information. This table does not reflect the deduction of taxes a shareholder would pay on Fund distributions or the redemption of Fund Shares. This Fund is not suitable for all investors and is subject to investment risks including possible loss of the principal invested. There is no guarantee that the Fund will continue to hold any one particular security or stay invested in any one particular company. The composition of the Fund's top holdings is subject to change.
Performance figures are historical and reflect the change in share price, reinvested distributions, changes in net asset value, sales charges and capital gains distributions, if any. Not FDIC Insured – No Bank Guarantee – May Lose Value Derivatives generally are more sensitive to changes in economic or market conditions than other types of investments; this could result in losses that significantly exceed the Fund's original investment. All investments involve risks, including possible loss of principal. The risks associated with higher-yielding, lower-rated securities include higher risk of default and loss of principal. Changes in the financial strength of a bond issuer or in a bond’s credit rating may affect its value.
In addition, interest rate movements will affect the fund’s share price and yield. Credit risk refers to the possibility the bond issuer will not be able to make principal and interest payments. Bond prices generally move in the opposite direction of interest rates.
Thus, as the prices of bonds in the fund adjust to a rise in interest rates, the fund’s share price may decline. These and other risk considerations are discussed in the fund’s prospectus. The principal on mortgage or asset-backed securities normally may be prepaid at any time, which will reduce the yield and market value of those securities.
US obligations are supported by varying degrees of credit but generally are not backed by the full faith and credit of the US government. Investments in non-investment-grade debt securities (“high yield” or “junk” bonds) may be subject to greater market fluctuations and risk of default or loss of income and principal than securities in higher rating categories. Senior-secured and second lien loans and bonds: Assets pledged as security for these loans and bonds would first be made available to senior lenders before other investors’ demands were met when settling a bankruptcy. The Fund is not required to invest with any minimum number of sub-advisors, and does not have minimum or maximum limitations with respect to the allocations of the assets to any sub-advisor or investment option. Diversification cannot guarantee gain or prevent losses. Top Ten Holdings (as a % of Net Assets) † Broadview Networks Holdings, Inc., Sec. Notes TeleCommunication Systems, Inc., Conv. Sr. Unsec. Notes Global Investments Group Finance Ltd., Sr. Unsec. Notes American Gilsonite Co., Second Lien Notes Creditcorp, Sec. Notes Boardriders SA, Sr. Unsec. Notes Nebraska Book Holdings, Inc., Sec. Notes Tempel Steel Co., Sec. Notes Alion Science & Technology Corp., First Lien Term Loan ION Geophysical Corp., Second Lien Notes Top Ten Holdings Portfolio Composition (as a % of Net Assets) 2.09% Corporate Bonds - 44.36% Bank Loans - 28.89% Mortgage Backed Securities - 9.05% Convertible Corporate Bonds - 4.60% Exchange Traded Funds - 1.04% Cash, Cash Equivalents & Other Net Assets - 12.06% 1.97% 1.87% 1.82% 1.67% 1.67% 1.65% 1.64% 1.54% 1.45% 17.37% † Holdings are subject to change, and may not reflect the current or future position of the portfolio. Table presents indicative values only. 72 | October 31, 2015 . ALPS | Westport Resources Hedged High Income Fund Statement of Investments October 31, 2015 Shares 6,100 TOTAL EXCHANGE TRADED FUNDS (Cost $236,028) $ 234,179 Principal Amount 234,179 Value (Note 2) BANK LOANS (28.89%)(b) Communications (4.55%) Quincy Newspapers, Inc., Term B Loan L+4.50% 10/19/2022 (c) $ 40,000 $ RentPath LLC, First Lien Term Loan 6.250% 12/17/2021 38,678 TCHâ€2 Holdings LLC (TravelClick, Inc.), First Lien Initial Term Loan 5.500% 05/06/2021 98,782 Total Communications 39,767 34,616 98,349 1,025,694 Consumer, Cyclical (4.93%) Basic Materials (0.41%) Tensar Corp., First Lien Term Loan 5.750% 07/09/2021 Value (Note 2) Communications (continued) EXCHANGE TRADED FUNDS (1.04%) ProShares UltraShort Russell 2000®(a) Principal Amount Value (Note 2) $ 101,107 93,271 Ancestry.com, Inc., Initial Term Loan 5.000% 08/29/2022 49,500 Answers Corporation, First Lien Term Loan 6.250% 10/01/2021 61,535 Auction.com LLC, Existing Term Loan 6.000% 05/12/2019 53,730 ConvergeOne Holdings Corp., First Lien Initial Term Loan 6.000% 06/17/2020 50,363 CSC Holdings LLC (fka CSC Holdings Inc. (Cablevision)), Term B Loan L+4.00% 10/09/2022 (c) 26,000 Emerging Markets Communications LLC, First Lien Initial Term Loan 6.750% 07/01/2021 34,913 Encompass Digital Media, Inc., Second Lien Tranche B Term Loan 8.750% 06/06/2022 164,000 Extreme Reach, Inc., Second Lien Initial Term Loan 10.500% 01/22/2021 160,000 Global Healthcare Exchange LLC, Initial Term Loan 5.500% 08/15/2022 38,000 iParadigms Holdings LLC, First Lien Initial Term Loan 5.000% 07/30/2021 19,745 MediArena Acquisition BV, (fka AP NMT Acquisition BV), First Lien Dollar Term B Loan 6.750% 08/13/2021 98,010 Miller Heiman, Inc., Term Loan 6.750% 09/30/2019 33,906 NextGen Networks Pty Ltd. (Nextgen Finance LLC), Term B Loan 5.000% 05/31/2021 68,826 Numericableâ€SFR SA, USD Term Loan L+4.00% 01/20/2023 (c) 31,000 49,537 45,638 53,327 50,079 26,132 34,040 161,540 159,200 37,988 19,252 93,600 31,533 Agrofresh, Inc., Term Loan 5.750% 07/31/2021 80,798 Amaya Holdings BV, First Lien Initial Term B Loan 5.000% 08/01/2021 110,882 AMF Bowling Centers, Inc., Term B Loan L+6.25% 09/18/2021 (c) 91,580 BDF Acquisition Corp., Initial Term Loan 5.250% 02/12/2021 123,438 BDF Acquisition Corp., Second Lien Initial Term Loan 9.000% 02/12/2022 23,000 Big Jack Holdings LP, Initial Term Loan 5.750% 07/01/2022 57,000 CDS U.S. Intermediate Holdings, Inc. (Cirque Du Soleil Canada, Inc.), Second Lien Initial Loan 9.250% 07/10/2023 24,000 Deluxe Entertainment Services Group, Inc., Initial Term Loan 6.500% 02/28/2020 93,854 Fullbeauty Brands Holdings Corp., First Lien Initial Term Loan 5.750% 10/14/2022 21,000 GST AutoLeather, Inc., Term B Loan 6.500% 07/10/2020 99,000 PlayPower, Inc., First Lien Initial Term Loan 5.750% 06/23/2021 66,833 Twin River Management Group, Inc. (fka BLB Management Services, Inc.), Closing Date Term Loan 5.250% 07/10/2020 237,798 World Triathlon Corp., Initial Term Loan 5.250% 06/25/2021 98,750 Total Consumer, Cyclical 80,730 108,684 90,779 121,740 21,735 56,145 23,670 87,754 20,055 97,515 66,833 238,578 98,318 1,112,536 Consumer, Nonâ€cyclical (5.50%) 60,395 30,701 AF Borrower LLC (aka Accuvant Finance LLC), First Lien Initial Term Loan 6.250% 01/28/2022 73 | October 31, 2015 73,630 73,492 . ALPS | Westport Resources Hedged High Income Fund Statement of Investments Principal Amount October 31, 2015 Value (Note 2) Consumer, Nonâ€cyclical (continued) Candy Intermediate Holdings, Inc., Initial Term Loan 7.500% 06/18/2018 $ 15,877 $ Central Security Group, Inc., First Lien Initial Term Loan 6.250% 10/06/2020 46,648 Coty, Inc., USD Term B Loan L+3.00% 10/27/2022 (c) 15,667 CPI Buyer LLC, First Lien Initial Term Loan 5.500% 08/16/2021 77,527 DAE Aviation Holdings, Inc., Initial Term Loan 5.250% 07/07/2022 55,000 FHC Health Systems, Initial Term Loan 5.000% 12/23/2021 99,749 Galleria Co., USD Term B Loan L+3.00% 10/21/2022 (c) 31,333 GK Holdings, Inc. (aka Global Knowledge), First Lien Initial Term Loan 6.500% 01/20/2021 18,858 Global Cash Access, Inc., Term B Loan 6.250% 12/18/2020 21,670 Jackson Hewitt, Inc., Initial Term Loan 8.000% 07/30/2020 76,000 Kronos Acquisition Intermediate, Inc. (aka KIK Custom Products, Inc.), Initial Term Loan 6.000% 08/26/2022 11,000 Mister Car Wash Holdings, Inc., Term Loan 5.000% 08/20/2021 41,475 Navex Global, Inc., First Lien Term Loan 5.750% 11/19/2021 3,970 Navex Global, Inc., Second Lien Term Loan 9.750% 11/18/2022 46,000 Prime Security Services Borrower LLC (aka Protection 1 Security Solutions), First Lien Term B Loan 5.000% 07/01/2021 58,000 Prime Security Services Borrower LLC (aka Protection 1 Security Solutions), Second Lien Term B Loan 9.750% 07/01/2022 30,000 Ryan LLC, Tranche B Term Loan 6.750% 08/07/2020 20,738 Sitel Worldwide Corporation, First Lien Term Bâ€1 Loan L+5.50% 09/18/2021 (c) 81,000 Principal Amount Value (Note 2) Consumer, Nonâ€cyclical (continued) 15,718 45,831 15,750 77,042 54,977 98,253 31,417 18,810 21,142 Sun Products Corp. (fka Huish Detergents, Inc.), Tranche B Term Loan 5.500% 03/23/2020 Sundial Group Holdings LLC, Initial Term Loan L+6.25% 10/19/2021 (c)(d) Team Health, Inc., Bridge Term Loan L+5.00% 09/24/2016 (c)(d) USAGM Holdco LLC, First Lien Delayed Draw Term Loan 4.750% 07/28/2022 USAGM Holdco LLC, First Lien Initial Term Loan 4.750% 07/28/2022 Vestcom International, Inc. (fka Vector Investment Holdings, Inc.), Term Loan 5.250% 09/30/2021 Weight Watchers International, Inc., Initial Tranche Bâ€1 Term Loan L+3.00% 04/02/2016 (c) Wyle Services Corp., Term Loan 5.000% 05/23/2021 Total Consumer, Nonâ€cyclical Diversified (1.96%) $ 97,800 $ 97,000 39,000 94,707 95,060 39,000 2,371 2,302 33,629 32,648 115,345 114,769 10,000 33,987 9,838 33,881 1,239,043 74,860 10,918 41,319 3,930 Emerald 2 Ltd., Facility B1 Loan 5.000% 05/14/2021 First Eagle Investment Management LLC, Term Loan L+4.00% 10/30/2022 (c) Koosharem LLC, Term Loan 7.500% 05/15/2020 LBM Holdings LLC, First Lien Initial Term Loan 6.250% 08/20/2022 Total Diversified Energy (0.20%) 100,000 250,000 57,565 42,000 99,750 245,000 56,630 40,661 442,041 45,310 57,761 Expro Financial Services, S.a.r.l., Initial Term Loan 5.750% 09/02/2021 44,550 Preferred Proppants LLC, Term Loan 6.750% 07/27/2020 13,808 Total Energy 36,937 8,106 45,043 Financials (3.34%) 29,588 20,530 AmeriLife Group LLC, First Lien Initial Term Loan 5.750% 07/10/2022 14,963 AmeriLife Group LLC, Second Lien Initial Term Loan 9.750% 01/10/2023 22,000 Aptean, Inc., First Lien Term Loan 5.250% 02/26/2020 98,500 80,190 74 | October 31, 2015 14,925 21,670 96,530 . ALPS | Westport Resources Hedged High Income Fund Statement of Investments Principal Amount October 31, 2015 Value (Note 2) Principal Amount Financials (continued) Industrials (continued) Asurion LLC (fka Asurion Corp.), Bâ€4 Term Loan 5.000% 08/04/2022 $ 32,918 $ Asurion LLC (fka Asurion Corp.), Second Lien Term Loan 8.500% 03/03/2021 85,000 BATS Global Markets, Inc., Incremental Bâ€2 Term Loan 5.750% 01/31/2020 10,989 Confie Seguros Holding II Co., First Lien Term B Loan 5.750% 11/09/2018 11,969 DTZ U.S. Borrower LLC (DTZ AUS Holdco PTY Limited), First Lien 2015â€1 Additional Term Loan 4.250% 11/04/2021 69 Duff & Phelps Corporation, Second Lien Initial Term Loan 9.500% 04/23/2021 29,000 IG Investments Holdings LLC, Extended Tranche B Term Loan 6.000% 10/31/2021 49,617 Liquidnet Holdings, Inc., Term Loan 7.750% 05/22/2019 93,750 LTCG Holdings Corp., Initial Term Loan 6.000% 06/06/2020 70,964 NXT Capital, Inc. (NXT Capital LLC), Facility Term Loan 6.250% 09/04/2018 98,492 RCS Capital Corp., First Lien Term Loan 7.500% 04/29/2019 97,025 Vistra Group Limited, USD Term Loan L+3.75% 07/21/2022 (c) 8,000 Walter Investment Management Corp., Tranche B Term Loan 4.750% 12/18/2020 59,443 Total Financials Jeldâ€Wen, Inc. (Onex BP Finance LP), Term Bâ€1 Loan 5.000% 07/01/2022 $ 17,000 $ Lully Finance S.a.r.l. (Lully Finance LLC), First Lien Initial Bâ€1 Term Loan 5.000% 10/14/2022 14,000 Mirion Technologies (Finance) LLC (Mirion Technologies, Inc.), First Lien Initial Term Loan 5.750% 03/31/2022 28,855 NVLX Acquisition LLC, Second Lien Closing Date Term Loan L+8.75% 06/05/2022 (c) 69,123 Plaze, Inc., Term Loan 5.250% 07/31/2022 98,000 Prolampac Holdings, Inc., First Lien Initial Term Loan 5.000% 08/18/2022 19,000 Quality Home Brands Holdings LLC, First Lien Initial Term Loan 7.750% 12/17/2018 49,125 Quanex Building Products Corp., Initial Term Loan L+5.25% 11/02/2022 (c) 22,000 U.S. Farathane LLC, Initial Term Loan 6.750% 12/23/2021 44,141 XPO Logistics, Inc., Term Loan L+4.50% 11/01/2021 (c) 125,000 Total Industrials Value (Note 2) 31,189 76,925 11,057 11,999 69 28,746 49,656 90,938 65,642 98,739 13,860 28,906 68,777 97,633 18,917 49,288 21,780 44,500 124,063 676,071 Technology (4.90%) 92,477 7,970 54,390 752,922 Industrials (3.00%) ABG Operating LLC, Term Loan 6.250% 06/12/2020 65,175 Builders FirstSource, Inc., Term B Loan 6.000% 07/29/2022 45,000 C.H.I. Overhead Doors, Inc., First Lien Initial Term Loan 4.750% 07/29/2022 31,000 DI Purchaser, Inc., First Lien Initial Term Loan 6.000% 12/15/2021 32,753 Gruden Acquisition, Inc. (aka Quality Distributions), First Lien Term Loan 5.750% 08/18/2022 19,000 17,053 65,256 44,761 30,903 31,770 Alion Science & Technology Corp., First Lien Term Loan 5.500% 08/19/2021 349,125 Computer Sciences Government Services, Inc., Term B Loan L+3.00% 10/06/2022 (c) 59,000 Compuware Corp., First Lien Tranched Bâ€1 Term Loan L+5.25% 12/15/2019 (c) 75,000 Novetta Solutions LLC, First Lien Initial Term Loan 6.000% 10/17/2022 86,000 P2 Lower Acquisition LLC (aka Progressive Solutions), First Lien Initial Term Loan 5.500% 10/22/2020 85,739 QBS Holding Company, Inc., Term Loan 5.750% 08/07/2021 191,535 Regit Eins GmbH (TV Borrower US LLC), First Lien Dollar Term Loan 6.000% 01/08/2021 99,000 18,604 75 | October 31, 2015 347,379 59,221 71,906 85,570 86,008 189,620 98,753 . ALPS | Westport Resources Hedged High Income Fund Statement of Investments October 31, 2015 Principal Amount Value (Note 2) Principal Amount Technology (continued) Basic Materials (continued) STG †Fairway Acquisitions, Inc., First Lien Term Loan 6.250% 06/30/2022 $ 54,697 $ 54,253 Stratus Technologies Bermuda Ltd. (Stratus Technologies, Inc.), Initial Term Loan L+5.00% 04/28/2021 (c) 47,313 46,928 Vencore, Inc. (fka SI Organization, Inc.), First Lien Initial Term Loan 5.750% 11/23/2019 64,924 64,810 1,104,448 Total Technology ArcelorMittal, Sr. Unsec. Notes 6.125% 06/01/2025 $ 30,000 $ Barminco Finance Pty Ltd., Sr. Unsec. Notes, Series AI 9.000% 06/01/2018 40,000 BlueScope Steel Finance Ltd. / BlueScope Steel Finance USA LLC, Sr. Unsec. Notes 7.125% 05/01/2018 (e) 55,000 Eco Services Operations LLC / Eco Finance Corp., Sr. Unsec. Notes 8.500% 11/01/2022 (e) 26,000 Optima Specialty Steel, Inc., First Lien Notes 12.500% 12/15/2016 (e) 165,000 Total Basic Materials Value (Note 2) Utilities (0.10%) Invenergy Thermal Operating I LLC, Term Loan 6.500% 10/19/2022 22,000 21,890 25,940 31,400 54,450 23,270 147,675 692,735 TOTAL BANK LOANS Communications (5.72%) (Cost $6,561,732) 6,512,959 CONVERTIBLE CORPORATE BONDS (4.60%) Communications (3.35%) Alaska Communications Systems Group, Inc., Conv. Sub. Notes 6.250% 05/01/2018 ModusLink Global Solutions, Inc., Conv. Sr. Unsec. Notes 5.250% 03/01/2019 TeleCommunication Systems, Inc., Conv. Sr. Unsec. Notes 7.750% 06/30/2018 Total Communications Consumer, Cyclical (0.30%) 250,000 251,719 75,000 60,422 450,000 443,250 755,391 Iconix Brand Group, Inc., Sr. Sub. Notes 2.500% 06/01/2016 Consumer, Nonâ€cyclical (0.65%) 70,000 67,069 PDL BioPharma, Inc., Conv. Sr. Unsec. Notes 4.000% 02/01/2018 175,000 Financials (0.30%) 146,453 Pinetree Capital Ltd., Conv. Sub. Notes 10.000% 05/31/2016 80,719 67,453 TOTAL CONVERTIBLE CORPORATE BONDS (Cost $1,029,678) 1,036,366 CORPORATE BONDS (44.36%) Blue Coat Holdings, Inc., Sr. Unsec. Notes 8.375% 06/01/2023 (e) Broadview Networks Holdings, Inc., Sec. Notes 10.500% 11/15/2017 CCO Safari II LLC, First Lien Notes 4.908% 07/23/2025 (e) EarthLink Holdings Corp., Sr. Unsec. Notes 8.875% 05/15/2019 Frontier Communications Corp., Sr. Unsec. Notes 10.500% 09/15/2022 (e) 11.000% 09/15/2025 (e) iHeartCommunications, Inc., First Lien Notes 9.000% 12/15/2019 Interactive Network, Inc. / FriendFinder Networks, Inc., First Lien Notes 14.000% 12/20/2018 Postmedia Network, Inc., Second Lien Notes 12.500% 07/15/2018 Sprint Communications, Inc., Sr. Unsec. Notes 7.000% 08/15/2020 Visant Corp., Sr. Unsec. Notes 10.000% 10/01/2017 Windstream Services LLC, Sr. Unsec. Notes 7.750% 10/01/2021 Total Communications Consumer, Cyclical (10.13%) 40,000 500,000 25,000 41,600 471,250 25,511 75,000 77,813 35,000 70,000 36,400 73,543 75,000 63,750 238,363 133,483 40,000 37,800 125,000 100,000 125,000 116,250 102,900 108,399 1,288,699 Basic Materials (3.07%) American Gilsonite Co., Second Lien Notes 11.500% 09/01/2017 (e) 500,000 410,000 Boardriders SA, Sr. Unsec. Notes, Series REGS 8.875% 12/15/2017 (f) 76 | October 31, 2015 390,000 376,542 . ALPS | Westport Resources Hedged High Income Fund Statement of Investments Principal Amount October 31, 2015 Value (Note 2) Consumer, Cyclical (continued) Value (Note 2) Consumer, Nonâ€cyclical (3.48%) Bonâ€Ton Department Stores, Inc., Second Lien Notes 10.625% 07/15/2017 $ 115,000 $ 108,100 Brookfield Residential Properties, Inc., Sr. Unsec. Notes 6.375% 05/15/2025 (e) 65,000 62,725 Caesars Entertainment Operating Co., Inc., Sr. Unsec. Notes 10.750% 02/01/2016 (g) 250,000 71,250 Caesars Entertainment Resort Properties LLC / Caesars Entertainment Resort Properties, First Lien Notes 8.000% 10/01/2020 12,000 11,970 Ferrellgas LP / Ferrellgas Finance Corp., Sr. Unsec. Notes 6.750% 06/15/2023 (e) 50,000 46,375 General Motors Financial Co., Inc., Sr. Unsec. Notes 4.300% 07/13/2025 100,000 102,007 Gibson Brands, Inc., Sec. Notes 8.875% 08/01/2018 (e) 90,000 79,425 Icon Health & Fitness, Inc., First Lien Notes 11.875% 10/15/2016 (e) 238,000 237,702 K Hovnanian Enterprises, Inc., Sr. Unsec. Notes 8.000% 11/01/2019 (e) 55,000 42,625 KB Home, Sr. Unsec. Notes 8.000% 03/15/2020 100,000 109,250 L Brands, Inc., Sr. Unsec. Notes 6.875% 11/01/2035 (e) 45,000 47,081 Mohegan Tribal Gaming Authority, Sr. Unsec. Notes 9.750% 09/01/2021 (e) 95,000 98,325 Nebraska Book Holdings, Inc., Sec. Notes 15.000% 06/30/2016 (e) 374,500 372,628 Toll Brothers Finance Corp., Sr. Unsec. Notes 4.875% 11/15/2025 110,000 110,138 Tops Holding LLC / Tops Markets II Corp., Sec. Notes 8.000% 06/15/2022 (e) 40,000 41,700 Tunicaâ€Biloxi Gaming Authority, Sr. Unsec. Notes 9.000% 11/15/2015 (e)(g) 400,000 231,500 United Airlines 2014â€1 Class B Pass Through Trust, Second Lien Notes, Series B 4.750% 04/11/2022 95,209 95,745 Viking Cruises Ltd., Sr. Unsec. Notes 6.250% 05/15/2025 (e) 40,000 39,500 2,284,588 Total Consumer, Cyclical Principal Amount Avon Products, Inc., Sr. Unsec. Notes 4.200% 07/15/2018 6.500% 03/01/2019 Carolina Beverage Group LLC / Carolina Beverage Group Finance, Inc., Sec. Notes 10.625% 08/01/2018 (e) DJO Finco, Inc. / DJO Finance LLC / DJO Finance Corp., Second Lien Notes 8.125% 06/15/2021 (e) Fresenius US Finance II, Inc., Sr. Unsec. Notes 4.500% 01/15/2023 (e) HealthSouth Corp., Sr. Unsec. Notes 5.750% 09/15/2025 (e) JBS USA LLC / JBS USA Finance, Inc., Sr. Unsec. Notes 5.750% 06/15/2025 (e) Kraft Heinz Food Co., Sr. Unsec. Notes 3.950% 07/15/2025 (e) 5.200% 07/15/2045 (e) Vantage Oncology LLC / Vantage Oncology Finance Co., Sec. Notes 9.500% 06/15/2017 (e) Total Consumer, Nonâ€cyclical Energy (5.01%) $ 45,000 $ 25,000 39,150 22,375 103,000 104,802 100,000 99,500 50,000 45,000 51,313 44,775 30,000 29,175 60,000 35,000 61,668 37,060 325,000 294,125 783,943 Antero Resources Corp., Sr. Unsec. Notes 5.125% 12/01/2022 Blue Racer Midstream LLC / Blue Racer Finance Corp., Sr. Unsec. Notes 6.125% 11/15/2022 (e) Calumet Specialty Products Partners LP / Calumet Finance Corp., Sr. Unsec. Notes 7.750% 04/15/2023 (e) CONSOL Energy, Inc., Sr. Unsec. Notes 5.875% 04/15/2022 Diamond Offshore Drilling, Inc., Sr. Unsec. Notes 4.875% 11/01/2043 EV Energy Partners LP / EV Energy Finance Corp., Sr. Unsec. Notes 8.000% 04/15/2019 ION Geophysical Corp., Second Lien Notes 8.125% 05/15/2018 Kinder Morgan Energy Partners LP, Sr. Unsec. Notes 5.400% 09/01/2044 77 | October 31, 2015 100,000 90,250 30,000 28,200 50,000 47,750 75,000 49,125 50,000 35,476 161,000 112,700 560,000 327,600 100,000 82,513 . ALPS | Westport Resources Hedged High Income Fund Statement of Investments Principal Amount October 31, 2015 Value (Note 2) Principal Amount Energy (continued) Financials (continued) MarkWest Energy Partners LP / MarkWest Energy Finance Corp., Sr. Unsec. Notes 4.875% 06/01/2025 $ 85,000 $ 79,687 Newfield Exploration Co., Sr. Unsec. Notes 5.375% 01/01/2026 75,000 71,625 Petroleum Geoâ€Services ASA, Sr. Unsec. Notes 7.375% 12/15/2018 (e) 63,000 51,424 Pioneer Energy Services Corp., Sr. Unsec. Notes 6.125% 03/15/2022 100,000 58,000 Polarcus Ltd., Sr. Unsec. Notes 8.000% 06/07/2018 (e) 400,000 60,000 Sunoco LP / Sunoco Finance Corp., Sr. Unsec. Notes 6.375% 04/01/2023 (e) 35,000 35,438 1,129,788 Total Energy JPMorgan Chase & Co., Jr. Sub. Notes, Series V 5.000% Perpetual Maturity (b)(h) $ 50,000 $ KKR Group Finance Co. III LLC, Sr. Unsec. Notes 5.125% 06/01/2044 (e) 75,000 Morgan Stanley, Jr. Sub. Notes, Series J 5.550% Perpetual Maturity (b)(h) 45,000 Quicken Loans, Inc., Sr. Unsec. Notes 5.750% 05/01/2025 (e) 25,000 Wells Fargo & Co., Jr. Sub. Notes, Series S 5.900% Perpetual Maturity (b)(h) 100,000 Total Financials Value (Note 2) Aircastle Ltd., Sr. Unsec. Notes 5.500% 02/15/2022 35,000 CNO Financial Group, Inc., Sr. Unsec. Notes 5.250% 05/30/2025 25,000 Communications Sales & Leasing, Inc., First Lien Notes 6.000% 04/15/2023 (e) 27,000 Constellation Enterprises LLC, First Lien Notes 10.625% 02/01/2016 (e) 120,000 Corrections Corporation of America, Sr. Unsec. Notes 5.000% 10/15/2022 10,000 Creditcorp, Sec. Notes 12.000% 07/15/2018 (e) 510,000 Fly Leasing Ltd., Sr. Unsec. Notes 6.375% 10/15/2021 200,000 Global Investments Group Finance Ltd., Sr. Unsec. Notes 11.000% 09/24/2017 (e) 400,000 Goldman Sachs Group, Inc., Jr. Sub. Notes, Series L 5.700% Perpetual Maturity (b)(h) 100,000 Goldman Sachs Group, Inc., Jr. Sub. Notes, Series M 5.375% Perpetual Maturity (b)(h) 70,000 Goldman Sachs Group, Inc., Sr. Unsec. Notes 4.750% 10/21/2045 55,000 Goldman Sachs Group, Inc., Sub. Notes 5.150% 05/22/2045 35,000 37,100 26,656 26,325 88,200 10,175 376,762 206,500 421,000 101,500 69,388 55,990 35,307 74,366 45,000 24,906 102,500 1,751,038 Industrials (7.24%) Financials (7.77%) 49,363 Air Medical Merger Sub Corp., Sr. Unsec. Notes 6.375% 05/15/2023 (e) 75,000 Anixter, Inc., Sr. Unsec. Notes 5.500% 03/01/2023 (e) 20,000 ATS Automation Tooling Systems, Inc., Sr. Unsec. Notes 6.500% 06/15/2023 (e) 35,000 Builders FirstSource, Inc., Sr. Unsec. Notes 10.750% 08/15/2023 (e) 100,000 CTP Transportation Products LLC / CTP Finance, Inc., Sec. Notes 8.250% 12/15/2019 (e) 100,000 Dispensing Dynamics International, Sec. Notes 12.500% 01/01/2018 (e) 115,000 GEO Debt Finance SCA, First Lien Notes, Series REGS 7.500% 08/01/2018 (f) 120,000 Global Ship Lease, Inc., First Lien Notes 10.000% 04/01/2019 (e) 40,000 Kemet Corp., First Lien Notes 10.500% 05/01/2018 145,000 Kratos Defense & Security Solutions, Inc., First Lien Notes 7.000% 05/15/2019 36,000 NCSG Crane & Heavy Haul Services, Inc., Second Lien Notes 9.500% 08/15/2019 (e) 100,000 OPE KAG Finance Sub, Inc., Sr. Unsec. Notes 7.875% 07/31/2023 (e) 150,000 Optimas OE Solutions Holding LLC / Optimas OE Solutions, Inc., Sec. Notes 8.625% 06/01/2021 (e) 85,000 78 | October 31, 2015 68,625 20,700 35,963 103,750 107,000 113,850 126,027 40,200 131,587 27,090 58,500 156,375 81,175 . ALPS | Westport Resources Hedged High Income Fund Statement of Investments October 31, 2015 Principal Amount Value (Note 2) Principal Amount Value (Note 2) Industrials (continued) Real Alloy Holding, Inc., First Lien Notes 10.000% 01/15/2019 (e) Tempel Steel Co., Sec. Notes 12.000% 08/15/2016 (e) Total Industrials Technology (1.94%) $ 186,000 $ 190,650 368,000 370,226 1,631,718 DynCorp International, Inc., Sr. Unsec. Notes 10.375% 07/01/2017 65,000 First Data Corp., Sr. Unsec. Notes 12.625% 01/15/2021 150,000 Hutchinson Technology, Inc., Second Lien Notes 8.500% 01/15/2017 120,000 Interface Security Systems Holdings, Inc. / Interface Security Systems LLC, Second Lien Notes 9.250% 01/15/2018 20,000 MSCI, Inc., Sr. Unsec. Notes 5.250% 11/15/2024 (e) 20,000 Seagate HDD Cayman, Sr. Unsec. Notes 5.750% 12/01/2034 (e) 60,000 Total Technology 51,675 172,312 121,200 20,175 21,100 50,952 437,414 TOTAL CORPORATE BONDS (Cost $11,656,676) 9,999,923 MORTGAGE BACKED SECURITIES (9.05%) American Homes 4 Rent, Series 2014â€SFR1 3.500% 06/17/2016 (b)(e) American Residential Properties Trust, Series 2014â€SFR1 4.127% 09/17/2016 (b)(e) 4.627% 09/17/2016 (b)(e) 150,000 144,073 Fannie Mae Connecticut Avenue Securities, Series 2014â€C04 5.094% 11/25/2024 (b) Fannie Mae Connecticut Avenue Securities, Series 2014â€C02 2.794% 05/25/2024 (b) Fannie Mae Connecticut Avenue Securities, Series 2014â€C03 3.194% 07/25/2024 (b) Invitation Homes Trust, Series 2014†SFR1 3.957% 06/17/2016 (b)(e) JPMBB Commercial Mortgage Securities Trust, Series 2015†C31 4.273% 08/15/2025 (b) Luminent Mortgage Trust, Series 2006â€2 A1A 0.394% 02/25/2046 (b) Wells Fargo Commercial Mortgage Trust, Series 2015â€NXS2 4.394% 07/15/2058 (b) Wells Fargo Commercial Mortgage Trust, Series 2015â€SG1 4.620% 12/15/2047 (b) Wells Fargo Commercial Mortgage Trust, Series 2015â€C27 3.768% 03/15/2025 (e) Wells Fargo Commercial Mortgage Trust, Series 2015â€C29 4.365% 06/15/2048 (b) WFRBS Commercial Mortgage Trust, Series 2014â€LC14 4.586% 02/15/2024 (b)(e) $ 120,000 $ 120,399 50,000 44,677 190,000 171,505 200,000 191,249 100,000 77,880 72,788 50,781 100,000 81,623 53,000 44,892 100,000 80,326 50,000 40,693 125,000 109,809 100,000 100,000 Citigroup Commercial Mortgage Trust, Series 2014â€GC25 3.548% 10/10/2024 (e) 100,000 Colony American Homes, Series 2014â€1A 3.050% 05/17/2017 (b)(e) 125,000 Countrywide Alternative Loan Trust, Series 2006â€6CB 5.750% 05/25/2036 250,850 Fannie Mae Connecticut Avenue Securities, Series 2015â€C02 4.194% 05/25/2025 (b) 85,000 Fannie Mae Connecticut Avenue Securities, Series 2015â€C04 5.744% 04/25/2028 (b) 45,000 155,000 5.894% 04/25/2028 (b) TOTAL MORTGAGE BACKED SECURITIES (Cost $2,084,757) 98,519 97,672 Yield 79,906 119,527 201,528 80,774 45,773 158,234 Principal Amount 2,039,840 Value (Note 2) SHORT TERM INVESTMENTS (0.35%) Government (0.35%) U.S. Treasury Bills Discounted Notes, 06/23/2016(i) U.S. Treasury Bills Discounted Notes, (i) 03/03/2016 0.056% 50,000 49,909 0.061% 30,000 29,990 79,899 79,899 TOTAL SHORT TERM INVESTMENTS (Cost $79,910) 79 | October 31, 2015 . ALPS | Westport Resources Hedged High Income Fund Statement of Investments October 31, 2015 Value (Note 2) TOTAL INVESTMENTS (88.29%) (Cost $21,648,781) Other Assets In Excess Of Liabilities (11.71%) NET ASSETS (100.00%) $ 19,903,166 2,641,020 (j) $ 22,544,186 (a) (b) (c) (d) (e) (f) (g) (h) (i) (j) Non-Income Producing Security. Floating or variable rate security. Interest rate disclosed is that which is in effect at October 31, 2015. All or a portion of this position has not settled as of October 31, 2015. The interest rate shown represents the stated spread over the London Interbank Offered Rate ("LIBOR" or "L") or the applicable LIBOR floor; the Fund will not accrue interest until the settlement date, at which point LIBOR will be established. Fair valued security under the procedures approved by the Fund's Board of Trustees. Security exempt from registration under Rule 144A of the Securities Act of 1933. These securities have been deemed liquid under procedures approved by the Fund's Board of Trustees and may normally be sold to qualified institutional buyers in transactions exempt from registration.
Total market value of Rule 144A securities amounts to $6,408,971, which represents approximately 28.43% of net assets as of October 31, 2015. Securities were purchased pursuant to Regulation S under the Securities Act of 1933, which exempts securities offered and sold outside of the United States from registration. Such securities cannot be sold in the United States without either an effective registration statement filed pursuant to the Securities Act of 1933, or pursuant to an exemption from registration. These securities have been deemed liquid under guidelines approved by the Fund's Board of Trustees. As of October 31, 2015 the aggregate market value of those securities was $502,569, representing 2.23% of net assets. Security is in default and therefore is non-income producing. This security has no contractual maturity date, is not redeemable and contractually pays an indefinite stream of interest. All or a portion of the security is pledged as collateral on futures.
The aggregate market value of the collateralized securities totals $79,899 as of October 31, 2015. See Note 3 in Notes to Financial Statements. Portion of Assets in Excess of Liabilities is held as collateral for futures contracts and credit default swap contracts in the amount of $236,123. See Note 3 in the Notes to Financial Statements. Common Abbreviations: aka - Also known as. ASA - Allmennaksjeselskap is the Norwegian term for public limited company. BV - Besloten Vennootschap is the Dutch term for private limited liability company. Conv.
- Convertible. fka - Formerly known as. GmbH - Gesellschaft mit beschränkter Haftungis the German term for limited liability company. Jr. Sub. - Junior Subordinated. LLC - Limited Liability Company. LP - Limited Partnership. Ltd.
- Limited. PIK - Payment in-kind. Pty. - Proprietary. SA - Generally designates corporations in various countries, mostly those employing the civil law. S.a.r.l. - Societe Anonyme a Responsabilite Limitee is the French term for limited liability company. Sec.
- Secured. Sr. Unsec. - Senior Unsecured. Sub.
- Subordinated. For Fund compliance purposes, the Fund's industry classifications refer to any one or more of the industry sub-classifications used by one or more widely recognized market indexes or ratings group indexes, and/or as defined by Fund management. This definition may not apply for purposes of this report, which may combine industry sub-classifications for reporting ease. Industries are shown as a percent of net assets. 80 | October 31, 2015 .
ALPS | Westport Resources Hedged High Income Fund Statement of Investments October 31, 2015 FUTURES CONTRACTS Position Contracts Expiration Date Long Long 1 6 12/22/15 01/01/16 Description CME Ultra Long Term U.S. Treasury Bond Future U.S. 5 Year Treasury Note Future Description 10 Year USD Deliverable Interest Rate Swap Future 5 Year USD Deliverable Interest Rate Swap Future U.S. 10 Year Treasury Note Future U.S. Long Bond Future Value (Note 2) $ $ Position Contracts Expiration Date Short (9) 12/15/15 $ Short Long Short (45) 7 (1) 12/15/15 12/22/15 12/22/15 $ Unrealized Appreciation 159,750 $ 718,641 878,391 $ Value (Note 2) 1,380 427 1,807 Unrealized Depreciation (931,781) $ (4,594,219) 893,813 (156,438) (4,788,625) $ (12,453) (28,954) (2,323) (1,901) (45,631) CREDIT DEFAULT SWAP CONTRACTS Centrally cleared swap TOTAL Buy Credit Notional Clearing House Reference Obligation Protection Amount Intercontinental CDX North American High Exchange Yield Index Series 25 Buy $ 2,000,000 Rate Paid Termination Upfront Unrealized by Fund Date Payment Depreciation 5.00% 12/20/2020 $ (10,975) $ (52,685) $ (10,975) $ (52,685) OUTSTANDING FORWARD FOREIGN CURRENCY CONTRACTS Foreign Currency EUR Contracted Amount* 450,000 Purchase/Sale Contract Sale Settlement Date 11/05/15 Counterparty State Street Bank & Trust Co. State Street Bank & Trust Co. CAD 115,000 Sale 11/05/15 * The contracted amount is stated in the currency in which the contract is denominated. See Notes to Financial Statements. 81 | October 31, 2015 $ Current Value 494,880 $ Unrealized Appreciation/ (Depreciation) $ 10,439 $ 10,439 87,943 $ $ (879) (879) . ALPS | Westport Resources Hedged High Income Fund Statement of Assets and Liabilities October 31, 2015 ASSETS Investments, at value Cash Foreign currency, at value (Cost $32,423) Unrealized appreciation on forward foreign currency contracts Receivable for investments sold Receivable for shares sold Deposit with broker for credit default swap contracts (Note 3) Interest receivable Prepaid expenses and other assets Total Assets $ 19,903,166 2,669,175 32,652 10,439 589,937 25,000 131,368 356,344 6,225 23,724,306 $ 1,093,179 2,242 10,975 5,747 879 17,236 11,903 4,373 5,188 28,398 1,180,120 22,544,186 LIABILITIES Payable for investments purchased Payable for variation margin on centrally cleared swap contracts Payable for upfront premium on centrally cleared swap contracts Payable due to broker for futures contracts Unrealized depreciation on forward foreign currency contracts Investment advisory fees payable Administration and transfer agency fees payable Distribution and services fees payable Professional fees payable Accrued expenses and other liabilities Total Liabilities NET ASSETS NET ASSETS CONSIST OF Paidâ€in capital Accumulated net investment income Accumulated net realized loss on investments, futures contracts, credit default swap contracts and foreign currency transactions Net unrealized depreciation on investments, futures contracts, credit default swap contracts and translation of assets and liabilities denominated in foreign currencies and forward foreign currency contracts NET ASSETS INVESTMENTS, AT COST $ 24,687,160 43,126 (353,377) (1,832,723) $ 22,544,186 $ 21,648,781 See Notes to Financial Statements. 82 | October 31, 2015 . ALPS | Westport Resources Hedged High Income Fund Statement of Assets and Liabilities October 31, 2015 PRICING OF SHARES Class A: Net Asset Value, offering and redemption price per share Net Assets Shares of beneficial interest outstanding (unlimited number of shares, no par value common stock authorized) Maximum offering price per share ((NAV/0.9450), based on maximum sales charge of 5.50% of the offering price) Class C: Net Asset Value, offering and redemption price per share(a) Net Assets Shares of beneficial interest outstanding (unlimited number of shares, no par value common stock authorized) Class I: Net Asset Value, offering and redemption price per share Net Assets Shares of beneficial interest outstanding (unlimited number of shares, no par value common stock authorized) 9.16 3,090,222 337,244 9.69 $ $ 9.16 719,783 78,580 (a) $ $ $ $ 9.16 $ 18,734,181 2,045,334 Redemption price per share may be reduced for any applicable contingent deferred sales charge. For a description of a possible sales charge, please see the Fund's Prospectus. See Notes to Financial Statements. 83 | October 31, 2015 . ALPS | Westport Resources Hedged High Income Fund Statement of Operations For the Year Ended October 31, 2015 INVESTMENT INCOME Interest and other income Total Investment Income $ 1,765,967 1,765,967 EXPENSES Investment advisory fees Administrative fees Transfer agency fees Distribution and service fees Class A Class C Professional fees Networking fees Class I Reports to shareholders and printing fees State registration fees SEC registration fees Insurance fees Custody fees Trustees' fees and expenses Offering costs Miscellaneous expenses Total Expenses Less fees waived/reimbursed by investment advisor (Note 8) Class A Class C Class I Net Expenses Net Investment Income Net realized loss on investments Net realized loss on futures contracts Net realized gain on credit default swap Net realized gain on foreign currency transactions Net change in unrealized depreciation on investments Net change in unrealized depreciation on futures contracts Net change in unrealized depreciation on credit default swap Net change in unrealized appreciation on translation of assets and liabilities denominated in foreign currencies and forward foreign currency contracts See Notes to Financial Statements. 84 | October 31, 2015 8,130 3,221 38,982 968 334 21,125 660 12,451 37,253 699,635 (34,235) (11,798) (191,137) 462,465 1,303,502 (254,089) (149,102) 6,183 13,860 (1,186,926) (15,041) (42,011) 10,342 11,252 37,663 NET REALIZED AND UNREALIZED LOSS ON INVESTMENTS NET DECREASE IN NET ASSETS RESULTING FROM OPERATIONS 447,261 69,858 135 10,485 (1,616,641) $ (313,139) . ALPS | Westport Resources Hedged High Income Fund Statements of Changes in Net Assets For the Period January 1, 2014 (Commencement) to October 31, 2014 For the Year Ended October 31, 2015 OPERATIONS Net investment income Net realized gain/(loss) on investments, futures contracts and foreign currency transactions Net change in unrealized depreciation on investments, futures contracts and translation of assets and liabilities denominated in foreign currencies and forward foreign currency contracts Net Increase/(Decrease) in Net Assets Resulting from Operations $ 1,303,502 $ 774,512 (383,148) 138,936 (1,233,493) (313,139) (599,230) 314,218 DISTRIBUTIONS Dividends to shareholders from net investment income Class A Class C Class I Dividends to shareholders from net realized gains Class A Class C Class I Net Decrease in Net Assets from Distributions (183,098) (54,950) (1,058,483) (17,220) (5,789) (82,396) (1,401,936) (126,416) (45,997) (661,379) – – – (833,792) BENEFICIAL INTEREST TRANSACTIONS (NOTE 6) Shares sold Class A Class C Class I Dividends reinvested Class A Class C Class I Shares redeemed Class A Class C Class I Net Increase/(Decrease) in Net Assets Derived from Beneficial Interest Transactions Net increase/(decrease) in net assets NET ASSETS Beginning of year End of year * *Including accumulated net investment income of: $ $ See Notes to Financial Statements. 85 | October 31, 2015 604,963 – 6,681,709 175,165 60,739 1,123,436 (1,632,559) (844,906) (6,601,183) (432,636) (2,147,711) 24,691,897 22,544,186 $ 43,126 $ 4,376,893 1,732,540 20,102,463 84,424 33,245 450,245 (176,024) (142,172) (1,250,143) 25,211,471 24,691,897 – 24,691,897 10,674 . ALPS | Westport Resources Hedged High Income Fund – Class A Financial Highlights Selected data for a share of beneficial interest outstanding throughout the periods indicated: For the Year Ended October 31, 2015 $9.86 0.54 (0.67) (0.13) (0.53) (0.04) (0.57) (0.70) $9.16 Net investment income(a) Net realized and unrealized loss Total from investment operations DISTRIBUTIONS: From net investment income From net realized gains Total distributions Net (decrease) in net asset value Net asset value, end of year TOTAL RETURN(b) 0.36 (0.14) 0.22 (0.36) – (0.36) (0.14) $9.86 (1.32)% Net asset value, beginning of period INCOME FROM INVESTMENT OPERATIONS: For the Period January 1, 2014 (Commencement) to October 31, 2014 $10.00 2.13% $3,090 3.35% (c) 2.30% (c)(e) (c) 5.66% 91% $4,190 3.64% (c)(d) 2.39% (c)(d) 4.33% (c)(d) 108% RATIOS/SUPPLEMENTAL DATA: Net assets, end of year (000s) Ratio of expenses to average net assets excluding fee waivers and reimbursements Ratio of expenses to average net assets including fee waivers and reimbursements Ratio of net investment income to average net assets Portfolio turnover rate(f) (a) (b) (c) (d) (e) (f) Calculated using the average shares method. Total returns are for the period indicated and have not been annualized. Total returns would have been lower had certain expenses not been waived during the period. Returns shown do not reflect the deduction of taxes that a shareholder would pay on Fund distributions or the redemption of Fund shares. Returns shown exclude any applicable sales charges. Expense ratios before reductions for startup periods may not be representative of longer term operating periods. Annualized. According to the Fund's shareholder services plan with respect to the Fund's Class A shares, any amount of such payment not paid during the Fund's fiscal year for such service activities shall be reimbursed to the Fund as soon as practical after the end of the fiscal year.
Fees were reimbursed to the Fund during the period ended October 31, 2015, for the prior fiscal year in the amount of 0.09% of average net assets of Class A shares. Portfolio turnover rate for periods less than one full year have not been annualized. See Notes to Financial Statements. 86 | October 31, 2015 . ALPS | Westport Resources Hedged High Income Fund – Class C Financial Highlights Selected data for a share of beneficial interest outstanding throughout the periods indicated: For the Year Ended October 31, 2015 $9.85 0.48 (0.67) (0.19) (0.46) (0.04) (0.50) (0.69) $9.16 Net investment income(a) Net realized and unrealized loss Total from investment operations DISTRIBUTIONS: From net investment income From net realized gains Total distributions Net (decrease) in net asset value Net asset value, end of year TOTAL RETURN(b) 0.31 (0.16) 0.15 (0.30) – (0.30) (0.15) $9.85 (1.90)% Net asset value, beginning of period INCOME FROM INVESTMENT OPERATIONS: For the Period January 1, 2014 (Commencement) to October 31, 2014 $10.00 1.51% RATIOS/SUPPLEMENTAL DATA: Net assets, end of year (000s) Ratio of expenses to average net assets excluding fee waivers and reimbursements Ratio of expenses to average net assets including fee waivers and reimbursements Ratio of net investment income to average net assets Portfolio turnover rate(e) (a) (b) (c) (d) (e) $720 4.04% (c) 2.99% (c) 4.98% (c) 91% $1,587 4.25% (c)(d) 2.99% (c)(d) 3.70% (c)(d) 108% Calculated using the average shares method. Total returns are for the period indicated and have not been annualized. Total returns would have been lower had certain expenses not been waived during the period. Returns shown do not reflect the deduction of taxes that a shareholder would pay on Fund distributions or the redemption of Fund shares. Returns shown exclude any applicable sales charges. Expense ratios before reductions for startup periods may not be representative of longer term operating periods. Annualized. Portfolio turnover rate for periods less than one full year have not been annualized. See Notes to Financial Statements. 87 | October 31, 2015 .
ALPS | Westport Resources Hedged High Income Fund – Class I Financial Highlights Selected data for a share of beneficial interest outstanding throughout the periods indicated: For the Year Ended October 31, 2015 $9.85 0.57 (0.66) (0.09) (0.56) (0.04) (0.60) (0.69) $9.16 Net investment income(a) Net realized and unrealized loss Total from investment operations DISTRIBUTIONS: From net investment income From net realized gains Total distributions Net (decrease) in net asset value Net asset value, end of year TOTAL RETURN(b) 0.38 (0.14) 0.24 (0.39) – (0.39) (0.15) $9.85 (0.89)% Net asset value, beginning of period INCOME FROM INVESTMENT OPERATIONS: For the Period January 1, 2014 (Commencement) to October 31, 2014 $10.00 2.38% RATIOS/SUPPLEMENTAL DATA: Net assets, end of year (000s) Ratio of expenses to average net assets excluding fee waivers and reimbursements Ratio of expenses to average net assets including fee waivers and reimbursements Ratio of net investment income to average net assets Portfolio turnover rate(e) (a) (b) (c) (d) (e) $18,734 3.07% (c) 1.99% (c) 5.98% (c) 91% $18,915 3.39% (c)(d) 1.99% (c)(d) 4.59% (c)(d) 108% Calculated using the average shares method. Total returns are for the period indicated and have not been annualized. Total returns would have been lower had certain expenses not been waived during the period. Returns shown do not reflect the deduction of taxes that a shareholder would pay on Fund distributions or the redemption of Fund shares. Expense ratios before reductions for startup periods may not be representative of longer term operating periods. Annualized. Portfolio turnover rate for periods less than one full year have not been annualized. See Notes to Financial Statements. 88 | October 31, 2015 . ALPS | WMC Research Value Fund Management Commentary October 31, 2015 (Unaudited) Market Commentary The twelve month period ended October 31, 2015 was defined by significant volatility in the global markets, causing flat to modest gains for broad market indices, with the S&P 500® Index returning 5.20% and the Russell 1000® Value Index returning 0.53% during the twelveâ€month period. The period began strong as 2014 closed the year on a relative upswing. Accommodative global monetary policy continued to be a central theme. The Bank of Japan expanded its quantitative easing (QE) policy, the People's Bank of China surprised markets with its first rate cut in two years, and the European Central Bank continued to hint of sovereign QE for early 2015. The US Federal Reserve (Fed) helped to support riskier assets after it stated it can be "patient" with regards to starting its policy normalization process. US equities outperformed nonâ€US equities and emerging market equities underperformed their developed market counterparts. Despite the year beginning on a sour note, with January recording the worst monthly return for US stocks in a year, the first quarter of 2015 ended positive. However, earnings sentiment was fairly negative among many investors, in part due to currency headwinds and some accompanying highâ€profile guidance disappointments. The second quarter of 2015 was defined by strong merger and acquisition activity, a rebound in hiring, and solid housing data. May was the secondâ€best month ever for deals involving US companies with US $234 billion in M&A announcements. News of an economic contraction and comments from US Federal Reserve Chair Janet Yellen that equity valuations were "quite high" were not enough to quell bullish sentiment. As the twelveâ€month period came to a close, the markets were marred with volatility caused by geopolitical and macroeconomic conditions. US equities retreated for the first time in eleven quarters during Q3, as the S&P 500 experienced its first correction, a 10% decline from its recent high, since October 2011. The Fed’s statement appeared to spook some investors as it acknowledged that “recent global economic and financial developments may restrain economic activity somewhat and are likely to put further downward pressure on inflation in the near term.” The period ended with US equities rallying in October as the Fed left interest rates unchanged, though changes to its policy statement were more hawkish than expected. Overall, the US economy remained on solid footing, with a sharp rebound in GDP, a sevenâ€year low in unemployment, and a healthy housing market. Within the Russell 1000 Value Index, six of ten sectors posted positive returns during the period, with the health care and consumer discretionary sectors gaining the most. The energy sector declined the most during the period, followed by the materials sector. Fund Review On a grossâ€ofâ€fee basis, the ALPS | WMC Research Value Fund (the “Fund”) outperformed its benchmark, the Russell 1000 Value Index, for the period. During the period, the Fund achieved positive relative results in seven out of the ten broad market sectors. Overall, stock selection was additive relative to the Russell 1000 Value Index, as decisions in the consumer staples, information technology, and consumer discretionary more than offset weaker stock selection in the health care and industrials sectors. Top contributors to relative performance included Newfield Exploration (energy), Lowe’s (consumer discretionary), and Advance Auto Parts (consumer discretionary). Our position in Newfield Exploration, an oil and gas exploration and production company, delivered strong results driven by higherâ€thanâ€estimated domestic production and higher lifting from its assets in China. Lowe’s, a home improvement retailer, contributed to relative performance based on better home improvement trends, dividend growth around 20% per year, and sharpening execution. We eliminated our position in Lowe’s during the period on strength. Our position in Advance Auto Parts, an automotive aftermarket parts and accessories retailer, was helped by their recent acquisition of General Parts. We believe the acquisition will prove to be a transformative move with much greater profit enhancement over time than the market expects. We maintained positions in both Newfield Exploration and Advance Auto Parts at the end of the period. Detractors from relative performance for the period included Halliburton (energy) and General Electric (industrials). Shares of Halliburton, a global oilfield services company, fell during the period amid the precipitous drop in oil prices We believe Halliburton is in a stronger position to recover than many other oil services names if oil prices rise, and coupled with a strong balance sheet and a good management team, we continue to hold our position. An underweight in General Electric detracted from relative performance. Shares of this diversified multinational conglomerate rose after the firm announced a transformational new plan to sell most of GE Capital and essentially become a pureâ€play industrial company. Not owning strong benchmark constituent Pfizer, a large US pharmaceutical company, also detracted from relative performance during the period. Strategy and Outlook The portfolio takes a predominantly bottomâ€up approach to investing, with valueâ€added primarily from stock selection. As a result, we maintain industry neutrality in relation to the benchmark and do not look to add value through sector rotation. At the security level, however, we do take active positions which reflect our outlook for a specific company. Amid the recent market turbulence, our Global Industry Analysts remain focused on fundamental stock selection and believe now is a good time to add to quality names across many sectors. At the end of the period, the portfolio had several large overweight positions in the financials sector. We remain positive on several US banks due to (1) upside to higher rates but relatively good returns if rates stay low, (2) valuations at low levels relative to returns and (3) late innings of regulation/litigation. One stock we were overweight in is Bank of America, a USâ€based bank and financial services provider. We believe Bank of America has more upside from rising US short rates than some of its peers given its $1.1 trillion deposit base and $2.5 trillion in Merrill Lynch assets under custody. Further, 89 | October 31, 2015 . ALPS | WMC Research Value Fund Management Commentary October 31, 2015 (Unaudited) we believe the market underappreciates the company's ability to improve returns on equity through cost reductions associated with the runâ€off business, more efficient underwriting, and an increase in net interest income in the event of rising short term rates. Within energy, we prefer stocks with leverage to rising oil prices and attractive valuations, and believe the recent selloff in the sector is a good opportunity to add to names with access to high quality assets. We view the current oil price as unsustainable, and believe that selfâ€correcting forces are already on their way to rebalance the oil market. A top overweight here was Pioneer Natural Resources, a USâ€based oil and gas exploration company. We believe the opportunity in Pioneer continues to be driven by the market's fixation on shortâ€term results for what we believe is the best longâ€term asset in the industry. Over the next several years we think Pioneer's wells are likely to get better and cost less than they do today. We believe the consumer discretionary sector has some clear fundamental tailwinds for consumers today, including lower fuel prices and improvement in unemployment, wages, and housing. Our stance is that the market as a whole is underappreciating these impacts on many stocks. A name we liked in the retailing segment was Advance Auto Parts, one of the aforementioned top contributors over the period. Sales and margin trends have stabilized and management has indicated that the company should achieve its operating profit target earlier than expected. We continued to own a sizeable position in the portfolio during the period. Effective February 28, 2015 the Fund's Board approved the transition from the Disciplined US Value strategy to the Research Value strategy. Similar to Disciplined US Value, the Research Value approach seeks to achieve longâ€term total return in excess of the Russell 1000 Value Index by investing primarily in value oriented equity securities of US companies, emphasizing those with aboveâ€average potential for capital appreciation. The Research Value approach employs fundamental, bottomâ€up security analysis. The Research Value portfolio consists of multiple subportfolios, each of which is actively managed by one or more of Wellington Management’s Global Industry Analysts. The allocation of assets to the subportfolios corresponds to the relative weights of the analysts' coverage universes within the index. In addition, individual analysts have developed investment frameworks that have proven most relevant to their particular philosophy, process, and industry. Thus, the portfolio combines a blend of investment disciplines, which we believe diversifies investment style risk. The portfolio is rebalanced regularly to maintain industry weights that are close to the index and to maintain style diversification. Cheryl M. Duckworth, CFA Senior Managing Director and Associate Director, Global Industry Research Mark Mandel, CFA Senior Managing Director and Director, Global Industry Research The views of the author and information discussed in this commentary are as of the date of publication, are subject to change, and may not reflect the writer's current views. The views expressed are those of the author only, and represent an assessment of market conditions at a specific point in time, are opinions only and should not be relied upon as investment advice regarding a particular investment or markets in general. Such information does not constitute a recommendation to buy or sell specific securities or investment vehicles. It should not be assumed that any investment will be profitable or will equal the performance of the fund(s) or any securities or any sectors mentioned in this letter.
The subject matter contained in this letter has been derived from several sources believed to be reliable and accurate at the time of compilation. Neither ALPS Advisors, Inc., Wellington Management Company, LLP, nor the Fund accepts any liability for losses either direct or consequential caused by the use of this information. Diversification cannot guarantee gain or prevent losses. 90 | October 31, 2015 . ALPS | WMC Research Value Fund Performance Update October 31, 2015 (Unaudited) Performance of $10,000 Initial Investment (as of October 31, 2015) Comparison of change in value of a $10,000 investment (includes maximum sales charges of 5.50%) $25k $20k S&P 500® Total Return Index - $21,289 $15k Russell 1000® Value Index - $19,226 ALPS | WMC Research Value Fund Class A (NAV) - $18,581 ALPS | WMC Research Value Fund Class A (MOP) - $17,565 $10k 10/31/15 10/31/14 10/31/13 10/31/12 10/31/11 10/31/10 10/31/09 10/31/08 10/31/07 10/31/06 10/31/05 $5k The chart above represents historical performance of a hypothetical investment of $10,000 in the Fund since inception. Past performance does not guarantee future results. This chart does not reflect the deduction of taxes that a shareholder would pay on Fund distributions or the redemption of Fund shares. Average Annual Total Returns (as of October 31, 2015) 6 Month Class A (NAV) Class A (MOP) Class C (NAV) Class C (CDSC) Class I Russell 1000® 1 Value Index S&P 500® Total Return Index2 1 Year 5 Year 10 Year Since Inception Total Expense Ratio What You Pay* â€1.70% 2.57% 12.98% 6.39% 9.74% â€7.14% â€3.07% 11.70% 5.79% 9.60% 1.48% 1.15% â€2.08% 1.87% 12.14% 5.61% 8.93% â€3.06% 0.96% 12.14% 5.61% 8.93% 2.24% 1.90% â€1.59% 2.86% 13.26% 6.63% 9.99% 1.23% 0.90% â€2.29% 0.53% 13.26% 6.75% – 0.77% 5.20% 14.33% 7.85% – Performance data quoted represents past performance. Past performance does not guarantee future results.
Investment return and principal value of an investment will fluctuate so that an investor’s shares, when sold or redeemed, may be worth more or less than the original cost. Current performance data may be higher or lower than actual data quoted. For the most current month-end performance data, please call 1-866-759-5679. Maximum Offering Price (MOP) for Class A shares includes the Fund’s maximum sales charge of 5.50%. Performance shown at NAV does not include these sales charges and would have been lower had it been taken into account.
If you invest $1 million or more, either as a lump sum or through the Fund’s accumulation or letter of intent programs, you can purchase Class A shares without an initial sales charge (load). A Contingent Deferred Sales Charge (“CDSC”) of 1.00% may apply to Class C shares redeemed within the first 12 months after a purchase, and on Class A shares redeemed within the first 18 months after a purchase in excess of $1 million. Performance less than 1 year is cumulative. 91 | October 31, 2015 . ALPS | WMC Research Value Fund Performance Update October 31, 2015 (Unaudited) Performance shown for Class C shares prior to June 30, 2010 reflects the historical performance of the Fund’s Class A shares, calculated using the fees and expenses of Class C shares. Effective February 28, 2015 the Fund changed its name from the ALPS | WMC Disciplined Value Fund to the ALPS | WMC Research Value Fund. The performance shown for the ALPS | WMC Research Value Fund (the “Fund”) for periods prior to August 29, 2009, reflects the performance of the Activa Mutual Funds Trust – Activa Value Fund (as result of a prior reorganization of Activa Mutual Funds Trust – Activa Value Fund into the Fund). 1 The Russell 1000® Value Index measures the performance of those Russell 1000® companies with lower price-to-book ratios and lower forecasted growth values. The index is not actively managed and does not reflect any deduction for fees, expenses or taxes. An investor may not invest directly in an index. 2 The S&P 500® Index is the Standard & Poor’s composite index of 500 stocks, a widely recognized, unmanaged index of common stock prices. The index is not actively managed and does not reflect any deduction for fees, expenses or taxes.
An investor may not invest directly in an index. * What You Pay reflects the Advisor’s decision to contractually limit expenses through February 28, 2017. Please see the prospectus for additional information. The table does not reflect the deduction of taxes that a shareholder would pay on Fund distributions or the redemption of Fund shares. This Fund is not suitable for all investors and is subject to investment risks, including possible loss of the principal amount invested. There is no guarantee that the Fund will continue to hold any one particular security or stay invested in any one particular company. The composition of the Fund's top holdings is subject to change.
Performance figures are historical and reflect the change in share price, reinvested distributions, changes in net asset value, sales charges and capital gains distributions, if any. Not FDIC Insured – No Bank Guarantee – May Lose Value Top Ten Holdings (as a % of Net Assets) † Industry Sector Allocation (as a % of Net Assets) Wells Fargo & Co. Bank of America Corp. Mondelez International, Inc., Class A Medtronic PLC American International Group, Inc. Newfield Exploration Cisco Systems, Inc. Pioneer Natural Resources Co. Microsoft Corp. The PNC Financial Services Group, Inc. Top Ten Holdings 3.52% 3.50% 2.44% 2.09% 2.05% 2.03% 2.01% 1.93% 1.87% 1.86% 23.30% Financials - 32.05% Health Care - 12.52% Energy - 10.68% Information Technology - 10.13% Industrials - 9.33% Utilities - 7.31% Consumer Discretionary - 6.44% Consumer Staples - 6.41% Materials - 3.43% Cash, Cash Equivalents, & Other Net Assets - 1.70% † Holdings are subject to change, and may not reflect the current or future position of the portfolio. Table presents indicative values only. 92 | October 31, 2015 . ALPS | WMC Research Value Fund Statement of Investments October 31, 2015 Value (Note 2) Shares Energy (continued) Cobalt International Energy, Inc.(a) Continental Resources, Inc.(a) Enbridge, Inc. Ensco PLC, Class A EOG Resources, Inc. Forum Energy Technologies, (a) Inc. Halliburton Co. Hess Corp. (a) Newfield Exploration ONEOK, Inc. Pattersonâ€UTI Energy, Inc. Pioneer Natural Resources Co. (a) Southwestern Energy Co. Tesco Corp. TransCanada Corp. COMMON STOCKS (98.30%) Consumer Discretionary (6.44%) Consumer Services (2.02%) Las Vegas Sands Corp. McDonald's Corp. Norwegian Cruise Line Holdings, (a) Ltd. Royal Caribbean Cruises, Ltd. Media (2.47%) Comcast Corp., Class A DreamWorks Animation SKG, Inc., Class A(a) The Interpublic Group of Companies., Inc. Twentyâ€First Century Fox, Inc., Class A Retailing (1.95%) Advance Auto Parts, Inc. The Priceline Group, Inc.(a) 5,310 $ 7,820 262,898 877,795 9,745 619,977 2,060 202,601 1,963,271 20,270 1,269,307 11,420 231,141 6,770 155,236 24,414 749,266 2,404,950 6,386 1,267,174 437 635,503 1,902,677 Consumer Staples (6.41%) Food & Staples Retailing (0.85%) CVS Health Corp. 8,385 6,270,898 828,270 244,992 618,417 927,240 1,975,379 160,442 283,357 1,883,618 161,957 183,920 410,470 10,399,704 202,890 46,725 4,640 3,404,494 1,135,418 556,104 20,120 63,270 1,816,031 3,425,438 10,337,485 478,720 1,230,792 956,750 138,702 2,804,964 6,247,517 Energy (10.68%) Energy (10.68%) Anadarko Petroleum Corp. Cheniere Energy, Inc.(a) Chevron Corp. Household & Personal Products (2.88%) Avon Products, Inc. 118,789 Colgateâ€Palmolive Co. 18,550 The Estee Lauder Companies., Inc., Class A 11,891 Nu Skin Enterprises, Inc., Class A 3,630 TOTAL CONSUMER STAPLES 18,490 16,113 16,496 49,151 4,730 19,030 13,735 14,670 22,990 12,220 Financials (32.05%) Banks (10.61%) Bank of America Corp. Citizens Financial Group, Inc. M&T Bank Corp. The PNC Financial Services Group, Inc. Wells Fargo & Co. Food Beverage & Tobacco (2.68%) Mondelez International, Inc., Class A 51,414 2,373,270 Post Holdings, Inc.(a) 3,750 241,013 2,614,283 670,089 657,854 86,661 215,857 977,831 $ 87,365 19,400 2,030 12,980 11,390 TOTAL ENERGY TOTAL CONSUMER DISCRETIONARY Value (Note 2) Shares 4,480 2,500 5,702 299,622 123,800 518,198 Diversified Financials (6.29%) American Express Co. Ameriprise Financial, Inc. BlackRock, Inc. Invesco, Ltd. MSCI, Inc. Northern Trust Corp. Raymond James Financial, Inc. Santander Consumer USA (a) Holdings, Inc.
Springleaf Holdings, Inc.(a) UBS Group AG WisdomTree Investments, Inc. Insurance (9.65%) Alleghany Corp.(a) The Allstate Corp. American International Group, Inc. Assured Guaranty, Ltd. 93 | October 31, 2015 16,410 5,543 1,580 12,450 6,634 12,920 5,710 1,202,197 639,440 556,113 412,966 444,478 909,439 314,678 61,110 6,130 5,028 8,110 1,100,591 287,558 100,711 155,955 6,124,126 1,210 6,380 600,487 394,794 31,690 56,240 1,998,372 1,543,226 . ALPS | WMC Research Value Fund Statement of Investments October 31, 2015 Value (Note 2) Shares Insurance (continued) The Hartford Financial Services Group, Inc. Marsh & McLennan Companies, Inc. Principal Financial Group, Inc. Prudential Financial, Inc. XL Group PLC Real Estate (5.50%) American Tower Corp. AvalonBay Communities, Inc. Douglas Emmett, Inc. Essex Property Trust, Inc. Extra Space Storage, Inc. Federal Realty Investment Trust Forest City Enterprises, Inc., (a) Class A InfraREIT, Inc. Public Storage SL Green Realty Corp. 18,413 $ 21,230 14,820 8,434 36,360 851,785 1,183,360 743,371 695,805 1,384,589 9,395,789 3,290 6,090 23,990 1,755 3,750 4,634 336,337 1,064,715 732,894 386,872 297,150 664,933 41,093 5,010 1,280 4,670 908,155 119,639 293,709 553,955 5,358,359 Industrials (9.33%) Capital Goods (6.74%) Danaher Corp. Eaton Corp. PLC General Electric Co. Honeywell International, Inc. Illinois Tool Works, Inc. Lockheed Martin Corp. Owens Corning Pentair PLC Raytheon Co. United Technologies Corp. (a) WESCO International, Inc. 31,215,759 Health Care (12.52%) Health Care Equipment & Services (7.96%) Abbott Laboratories 15,980 Becton Dickinson and Co. 2,288 Boston Scientific Corp.(a) 65,720 (a) 8,710 HCA Holdings, Inc. McKesson Corp. 2,841 Medtronic PLC 27,540 St Jude Medical, Inc. 11,920 Stryker Corp. 6,678 UnitedHealth Group, Inc. 8,200 715,904 326,086 1,201,362 599,161 507,971 2,035,757 760,615 638,550 965,796 7,751,202 Pharmaceuticals, Biotechnology & Life Sciences (4.56%) (a) 2,430 174,766 Alkermes PLC (a) Allergan PLC 3,024 932,813 Alnylam Pharmaceuticals, Inc.(a) 2,790 239,800 Bristolâ€Myers Squibb Co. 17,114 1,128,668 Merck & Co., Inc. 30,382 1,660,680 Mylan N.V.(a) 6,840 301,576 4,438,303 TOTAL HEALTH CARE 12,189,505 10,960 5,100 43,340 3,966 3,560 2,276 12,860 4,260 6,216 10,012 4,560 $ 1,022,678 285,141 1,253,393 409,608 327,306 500,333 585,516 238,219 729,758 985,281 223,121 6,560,354 226,888 73,899 265,978 687,850 48,188 59,133 1,361,936 1,960 305,858 Commercial & Professional Services (1.40%) Equifax, Inc. 2,129 Huron Consulting Group, Inc.(a) 1,530 ManpowerGroup, Inc. 2,898 Nielsen N.V. 14,478 Towers Watson & Co., Class A 390 TransUnion(a) 2,300 TOTAL FINANCIALS Value (Note 2) Shares Transportation (1.19%) FedEx Corp. Genesee & Wyoming, Inc., Class (a) A JetBlue Airways Corp.(a) Kansas City Southern Knight Transportation, Inc. Swift Transportation Co.(a) (a) XPO Logistics, Inc. 247,868 70,546 106,760 252,039 75,712 103,267 1,162,050 3,694 2,840 1,290 9,915 4,844 3,720 9,084,340 TOTAL INDUSTRIALS Information Technology (10.13%) Semiconductors & Semiconductor Equipment (2.10%) Avago Technologies, Ltd. 137 16,869 (a) 4,752 271,197 First Solar, Inc.
Intel Corp. 38,751 1,312,109 Micron Technology, Inc.(a) 9,525 157,734 ON Semiconductor Corp.(a) 4,400 48,400 SunEdison Semiconductor, Ltd.(a) 7,960 85,570 SunPower Corp.(a) 5,840 156,745 2,048,624 Software & Services (4.97%) Accenture PLC, Class A 94 | October 31, 2015 1,244 133,357 . ALPS | WMC Research Value Fund Statement of Investments October 31, 2015 Value (Note 2) Shares Software & Services (continued) Alliance Data Systems Corp.(a) Alphabet, Inc., Class A(a) Alphabet, Inc., Class C(a) Automatic Data Processing, Inc. CACI International, Inc., Class (a) A Genpact, Ltd.(a) Global Payments, Inc. Heartland Payment Systems, Inc. Microsoft Corp. SS&C Technologies Holdings, Inc. Visa, Inc., A Shares 585 1,130 417 2,146 $ 227,656 312,228 185,381 1,790 34,683 132,460 1,825,713 6,140 455,281 1,060 82,235 4,844,576 14,837 76,986 1,958,050 926,595 2,976,468 9,869,668 3,460 6,100 5,530 4,220 5,600 4,425 7,223 7,780 237,010 182,573 198,748 299,831 153,216 234,702 373,212 332,128 2,580 839 6,100 1,980 5,150 1,960 710 2,633 239,708 130,171 206,119 83,754 110,983 117,522 189,449 254,295 3,343,421 8,150 7,280 355,992 417,581 Materials (3.43%) Materials (3.43%) Ball Corp. Boise Cascade Co.(a) Cabot Corp. Celanese Corp., Series A CRH PLC, Sponsored ADR Crown Holdings, Inc.(a) The Dow Chemical Co. International Paper Co. LyondellBasell Industries N.V., Class A Martin Marietta Materials, Inc. The Mosaic Co. Nucor Corp. (a) Owensâ€Illinois, Inc. Reliance Steel & Aluminum Co. The Sherwinâ€Williams Co. Vulcan Materials Co. TOTAL MATERIALS Utilities (7.31%) Utilities (7.31%) Ameren Corp. American Water Works Co., Inc. 656,085 399,791 566,757 478,713 379,712 261,433 194,635 1,357,884 466,556 342,319 2,646 29,400 980 109,253 1,078,098 49,970 $ 7,114,779 95,735,591 TOTAL INFORMATION TECHNOLOGY 9,185 4,900 7,930 7,910 13,600 7,990 10,320 13,227 8,737 5,390 TOTAL UTILITIES Technology Hardware & Equipment (3.06%) (a) 230 Arista Networks, Inc. Arrow Electronics, Inc.(a) 1,400 Cisco Systems, Inc. 67,870 QUALCOMM, Inc. 15,594 Utilities (continued) Dominion Resources, Inc. DTE Energy Co. Duke Energy Corp. Edison International Exelon Corp. ITC Holdings Corp. MDU Resources Group, Inc. NextEra Energy, Inc. PG&E Corp. Pinnacle West Capital Corp. Public Service Enterprise Group, Inc. UGI Corp. UIL Holdings Corp. 173,926 833,251 296,408 186,680 2,346 12,600 1,359 Value (Note 2) Shares TOTAL COMMON STOCKS (Cost $88,936,619) 7-Day Yield Value (Note 2) Shares SHORT TERM INVESTMENTS (1.69%) Money Market Fund (1.69%) Morgan Stanley Institutional Liquidity Fund †Prime Portfolio 0.082% 1,643,620 TOTAL SHORT TERM INVESTMENTS (Cost $1,643,620) TOTAL INVESTMENTS (99.99%) (Cost $90,580,239) Other Assets In Excess Of Liabilities (0.01%) NET ASSETS (100.00%) 1,643,620 1,643,620 $ 97,379,211 13,587 $ 97,392,798 (b) (a) (b) Non-Income Producing Security. Includes cash which is being held as collateral for futures contracts in the amount of $46,000. Common Abbreviations: ADR - American Depositary Receipt. AG - Aktiengesellschaft is a German term that refers to a corporation that is limited by shares, i.e., owned by shareholders. Ltd. - Limited. 95 | October 31, 2015 .
ALPS | WMC Research Value Fund Statement of Investments October 31, 2015 N.V. - Naamloze Vennootschap is the Dutch term for a public limited liability corporation. PLC - Public Limited Company. REIT - Real Estate Investment Trust. For Fund compliance purposes, the Fund's industry classifications refer to any one or more of the industry sub-classifications used by one or more widely recognized market indexes or ratings group indexes, and/or as defined by Fund management. This definition may not apply for purposes of this report, which may combine industry sub-classifications for reporting ease. Industries are shown as a percent of net assets. See Notes to Financial Statements. FUTURES CONTRACTS Description S&P 500 Emini Future Position Long Expiration Date 12/21/15 Contracts 10 96 | October 31, 2015 $ $ Value Unrealized (Note 2) Appreciation 1,036,850 $ 55,456 1,036,850 $ 55,456 .
ALPS | WMC Research Value Fund Statement of Assets and Liabilities October 31, 2015 ASSETS Investments, at value Receivable for investments sold Receivable for shares sold Deposit with broker for futures contracts (Note 3) Dividends receivable Prepaid expenses and other assets Total Assets $ 97,379,211 596,713 57,000 46,000 64,559 21,384 98,164,867 $ 617,419 4,650 30,100 62,947 20,268 12,278 13 13,868 10,526 772,069 97,392,798 $ $ 65,051,658 25,486,712 6,854,428 97,392,798 LIABILITIES Payable for investments purchased Payable for variation margin on futures contracts Payable for shares redeemed Investment advisory fees payable Administration and transfer agency fees payable Distribution and services fees payable Trustees' fees and expenses payable Professional fees payable Accrued expenses and other liabilities Total Liabilities NET ASSETS NET ASSETS CONSIST OF Paidâ€in capital Accumulated net realized gain on investments and futures contracts Net unrealized appreciation on investments, futures contracts NET ASSETS INVESTMENTS, AT COST PRICING OF SHARES $ 90,580,239 Class A: Net Asset Value, offering and redemption price per share Net Assets Shares of beneficial interest outstanding (unlimited number of shares, no par value common stock authorized) Maximum offering price per share ((NAV/0.9450), based on maximum sales charge of 5.50% of the offering price) Class C: Net Asset Value, offering and redemption price per share(a) Net Assets Shares of beneficial interest outstanding (unlimited number of shares, no par value common stock authorized) Class I: Net Asset Value, offering and redemption price per share Net Assets Shares of beneficial interest outstanding (unlimited number of shares, no par value common stock authorized) $ $ $ $ $ (a) 11.32 870,034 76,869 11.57 55,608,171 4,804,911 12.24 $ 11.75 $ 40,914,593 3,483,172 Redemption price per share may be reduced for any applicable contingent deferred sales charge. For a description of a possible sales charge, please see the Fund's Prospectus. See Notes to Financial Statements. 97 | October 31, 2015 . ALPS | WMC Research Value Fund Statement of Operations For the Year Ended October 31, 2015 INVESTMENT INCOME Dividends Foreign taxes withheld on dividends Total Investment Income $ 1,982,623 (5,384) 1,977,239 EXPENSES Investment advisory fees Administrative fees Transfer agency fees Distribution and service fees Class A Class C Professional fees Reports to shareholders and printing fees State registration fees SEC registration fees Insurance fees Custody fees Trustees' fees and expenses Miscellaneous expenses Total Expenses Less fees waived/reimbursed by investment advisor (Note 8) Class A Class C Class I Net Expenses Net Investment Income Net realized gain on investments Net realized gain on futures contracts Net realized gain distributions from other investment companies Net change in unrealized depreciation on investments Net change in unrealized appreciation on futures contracts See Notes to Financial Statements. 98 | October 31, 2015 145,892 11,456 23,475 10,421 48,377 169 1,230 14,738 2,308 12,807 1,425,901 NET REALIZED AND UNREALIZED GAIN ON INVESTMENTS NET INCREASE IN NET ASSETS RESULTING FROM OPERATIONS 972,834 160,111 22,083 $ (51,771) (1,084) (38,056) 1,334,990 642,249 28,988,753 103,218 15,732 (26,973,905) 55,456 2,189,254 2,831,503 . ALPS | WMC Research Value Fund Statements of Changes in Net Assets For the Fiscal Period Ended October 31, 2014(b) For the Year Ended October 31, 2015(a) For the Year Ended April 30, 2014 OPERATIONS Net investment income Net realized gain on investments, futures contracts Net realized gain distributions from other investment companies Net change in unrealized appreciation/(depreciation) on investments, futures contracts Net Increase in Net Assets Resulting from Operations $ 642,249 $ 29,091,971 15,732 310,060 $ 5,958,826 – (26,918,449) 2,831,503 (874,500) 5,394,386 612,825 6,559,877 13,515 12,117,145 19,303,362 DISTRIBUTIONS Dividends to shareholders from net investment income Class A Class C Class I Dividends to shareholders from net realized gains Class A Class C Class I Net Decrease in Net Assets from Distributions (280,500) (1,366) (222,337) (5,704,627) (35,924) (4,142,646) (10,387,400) – – – – – – – (528,474) (670) (470,800) (642,398) (1,397) (488,619) (2,132,358) BENEFICIAL INTEREST TRANSACTIONS (NOTE 6) Shares sold Class A Class C Class I Dividends reinvested Class A Class C Class I Shares redeemed Class A Class C Class I Net Increase/(Decrease) in Net Assets Derived from Beneficial Interest Transactions Net increase/(decrease) in net assets NET ASSETS Beginning of year End of year * *Including accumulated net investment income/(loss) of: (a) (b) $ $ 1,824,143 1,632,083 3,318,615 5,488,048 19,609 4,362,161 (6,874,850) (1,003,097) (7,204,797) 1,561,915 (5,993,982) 103,386,780 97,392,798 (0) 154,740 114,228 1,715,713 – – – (2,625,164) – (5,297,693) (5,938,176) (543,790) 103,930,570 $ 103,386,780 $ 214,377 $ $ 2,472,682 28,068 5,245,365 1,120,556 2,067 958,847 (4,195,516) (16,613) (8,515,750) (2,900,294) 14,270,710 89,659,860 103,930,570 (138,735) Effective February 28, 2015 the Fund changed its name from the ALPS | WMC Disciplined Value Fund to the ALPS | WMC Research Value Fund. Effective May 1, 2014, the Board approved changing the fiscal year-end of the Funds from April 30 to October 31. See Notes to Financial Statements. 99 | October 31, 2015 . ALPS | WMC Research Value Fund – Class A Financial Highlights Selected data for a share of beneficial interest outstanding throughout the periods indicated: For the Year Ended October 31, 2015(a) $12.54 For the Year Ended April 30, 2014 $10.01 For the Year Ended April 30, 2013(c) $8.42 For the Year Ended April 30, 2012 $8.64 For the Year Ended April 30, 2011(d) $7.43 0.06 0.23 0.29 (0.06) (1.20) (1.26) (0.97) $11.57 0.03 0.59 0.62 – – – 0.62 $12.54 0.06 2.09 2.15 (0.11) (0.13) (0.24) 1.91 $11.92 0.08 1.61 1.69 (0.10) – (0.10) 1.59 $10.01 0.06 (0.23) (0.17) (0.05) – (0.05) (0.22) $8.42 0.06 1.22 1.28 (0.07) – (0.07) 1.21 $8.64 2.57% Net asset value, beginning of period For the Fiscal Period Ended October 31, 2014(b) $11.92 5.20% 21.70% 20.17% (1.81)% 17.34% $59,628 $59,069 $50,142 $44,989 $48,899 INCOME/(LOSS) FROM INVESTMENT OPERATIONS: Net investment income(e) Net realized and unrealized gain/(loss) Total from investment operations DISTRIBUTIONS: From net investment income From net realized gains Total distributions Net increase/(decrease) in net asset value Net asset value, end of year TOTAL RETURN(f) RATIOS/SUPPLEMENTAL DATA: Net assets, end of year (000s) $55,608 Ratio of expenses to average net assets excluding fee waivers and 1.49% reimbursements Ratio of expenses to average net assets including fee waivers and reimbursements 1.40% Ratio of net investment income to average net assets 0.53% (h) 114% Portfolio turnover rate (a) (b) (d) (c) (e) (f) (g) (h) 1.48% (g) 1.51% 1.58% 1.71% 1.40%(g) 1.47% 1.40% 1.40% 1.40% 1.40% 0.48%(g) 13% 0.52% 19% 0.95% 34% 0.83% 46% 0.77% 44% Effective February 28, 2015 the Fund changed its name from the ALPS | WMC Disciplined Value Fund to the ALPS | WMC Research Value Fund. Effective May 1, 2014, the Board approved changing the fiscal year-end of the Funds from April 30 to October 31. Prior to August 31, 2012, the ALPS | WMC Disciplined Value Fund was known as the ALPS | WMC Value Intersection Fund. Prior to August 31, 2010, the ALPS | WMC Value Intersection Fund was known as the Activa Value Fund (as a result of the reorganization of Activa Mutual Funds Trust - Activa Value Fund into the fund). Calculated using the average shares method. Total returns are for the period indicated and have not been annualized. Total returns would have been lower had certain expenses not been waived during the period. Returns shown do not reflect the deduction of taxes that a shareholder would pay on Fund distributions or the redemption of Fund shares. Returns shown exclude any applicable sales charges. Annualized. Portfolio turnover rate for periods less than one full year have not been annualized. See Notes to Financial Statements. 100 | October 31, 2015 .
ALPS | WMC Research Value Fund – Class C Financial Highlights Selected data for a share of beneficial interest outstanding throughout the periods indicated: For the Year Ended October 31, 2015(a) $12.36 For the Year Ended April 30, 2014 $9.93 For the Year Ended April 30, 2013(c) $8.39 For the Year Ended April 30, 2012 $8.62 For the Period July 2, 2010 (Inception) to April 30, 2011(d) $6.40 (0.03) 0.24 0.21 (0.05) (1.20) (1.25) (1.04) $11.32 (0.02) 0.58 0.56 – – – 0.56 $12.36 (0.02) 2.08 2.06 (0.06) (0.13) (0.19) 1.87 $11.80 0.02 1.57 1.59 (0.05) – (0.05) 1.54 $9.93 (0.01) (0.20) (0.21) (0.02) – (0.02) (0.23) $8.39 (0.01) 2.27 2.26 (0.04) – (0.04) 2.22 $8.62 1.87% 4.75% 20.97% 19.07% (2.45)% 35.44% $870 Net asset value, beginning of period For the Fiscal Period Ended October 31, 2014(b) $11.80 $257 $133 $100 $79 $14 INCOME/(LOSS) FROM INVESTMENT OPERATIONS: Net investment income/(loss)(e) Net realized and unrealized gain/(loss) Total from investment operations DISTRIBUTIONS: From net investment income From net realized gains Total distributions Net increase/(decrease) in net asset value Net asset value, end of year TOTAL RETURN(f) RATIOS/SUPPLEMENTAL DATA: Net assets, end of year (000s) Ratio of expenses to average net assets excluding fee waivers and reimbursements Ratio of expenses to average net assets including fee waivers and reimbursements Ratio of net investment income/(loss) to average net assets (h) Portfolio turnover rate 2.24% (a) (b) (d) (c) (e) (f) (g) (i) (h) 2.22% 2.26% 2.38% 2.49% (g) 2.15% 2.24% (g) 2.15%(g) 2.15% 2.15% 2.15% 2.15%(g) (0.23)% 19% 0.19% 34% (0.16)% 46% (0.22)% 114% (0.30)%(g) 13% (0.09)%(g) 44%(i) Effective February 28, 2015 the Fund changed its name from the ALPS | WMC Disciplined Value Fund to the ALPS | WMC Research Value Fund. Effective May 1, 2014, the Board approved changing the fiscal year-end of the Funds from April 30 to October 31. Prior to August 31, 2012, the ALPS | WMC Disciplined Value Fund was known as the ALPS | WMC Value Intersection Fund. Prior to August 31, 2010, the ALPS | WMC Value Intersection Fund was known as the Activa Value Fund (as a result of the reorganization of Activa Mutual Funds Trust - Activa Value Fund into the fund). Calculated using the average shares method. Total returns are for the period indicated and have not been annualized. Total returns would have been lower had certain expenses not been waived during the period. Returns shown do not reflect the deduction of taxes that a shareholder would pay on Fund distributions or the redemption of Fund shares. Returns shown exclude any applicable sales charges. Annualized. Portfolio turnover rate for periods less than one full year have not been annualized. Portfolio turnover rate is calculated at the Fund Level and represents the year ended April 30, 2011. See Notes to Financial Statements. 101 | October 31, 2015 .
ALPS | WMC Research Value Fund – Class I Financial Highlights Selected data for a share of beneficial interest outstanding throughout the periods indicated: For the Year Ended October 31, 2015(a) $12.69 For the Year Ended April 30, 2014 $10.10 For the Year Ended April 30, 2013(c) $8.49 For the Year Ended April 30, 2012 $8.71 For the Year Ended April 30, 2011(d) $7.48 0.09 0.23 0.32 (0.06) (1.20) (1.26) (0.94) $11.75 0.05 0.59 0.64 – – – 0.64 $12.69 0.09 2.12 2.21 (0.13) (0.13) (0.26) 1.95 $12.05 0.11 1.61 1.72 (0.11) – (0.11) 1.61 $10.10 0.09 (0.24) (0.15) (0.07) – (0.07) (0.22) $8.49 0.07 1.24 1.31 (0.08) – (0.08) 1.23 $8.71 2.86% Net asset value, beginning of period For the Fiscal Period Ended October 31, 2014(b) $12.05 5.31% 22.11% 20.43% (1.62)% 17.67% $43,502 $44,729 $39,417 $34,636 $29,251 INCOME/(LOSS) FROM INVESTMENT OPERATIONS: Net investment income(e) Net realized and unrealized gain/(loss) Total from investment operations DISTRIBUTIONS: From net investment income From net realized gains Total distributions Net increase/(decrease) in net asset value Net asset value, end of year TOTAL RETURN(f) RATIOS/SUPPLEMENTAL DATA: Net assets, end of year (000s) $40,915 Ratio of expenses to average net assets excluding fee waivers and 1.24% reimbursements Ratio of expenses to average net assets including fee waivers and reimbursements 1.15% Ratio of net investment income to average net assets 0.78% (h) 114% Portfolio turnover rate (a) (b) (d) (c) (e) (f) (g) (h) 1.23% (g) 1.26% 1.33% 1.46% 1.15%(g) 1.22% 1.15% 1.15% 1.15% 1.15% 0.74%(g) 13% 0.77% 19% 1.20% 34% 1.08% 46% 0.95% 44% Effective February 28, 2015 the Fund changed its name from the ALPS | WMC Disciplined Value Fund to the ALPS | WMC Research Value Fund. Effective May 1, 2014, the Board approved changing the fiscal year-end of the Funds from April 30 to October 31. Prior to August 31, 2012, the ALPS | WMC Disciplined Value Fund was known as the ALPS | WMC Value Intersection Fund. Prior to August 31, 2010, the ALPS | WMC Value Intersection Fund was known as the Activa Value Fund (as a result of the reorganization of Activa Mutual Funds Trust - Activa Value Fund into the fund). Calculated using the average shares method. Total returns are for the period indicated and have not been annualized. Total returns would have been lower had certain expenses not been waived during the period. Returns shown do not reflect the deduction of taxes that a shareholder would pay on Fund distributions or the redemption of Fund shares. Annualized. Portfolio turnover rate for periods less than one full year have not been annualized. See Notes to Financial Statements. 102 | October 31, 2015 . Clough China Fund Management Commentary October 31, 2015 (Unaudited) The Clough China Fund’s (the “Fund”) Class A NAV fell â€3.49% for the fiscal year ended on October 31, 2015, while the MSCI China Index fell â€0.70%. Market Review This was a volatile year for Chinese stocks. Markets soared about 30% in the first half until April 2015 before losing more than 25% in the second half between May and the end of October. The initial rally was liquidity driven as investors began to discount lower interest rates after the first interest rate cut in November 2014 when the central bank (PBOC) relaxed its policy stance from “neutral” to active easing. The rally accelerated with the launch of the Hong Kong†Shanghai Connect system which opened both domestic and Hong Kong equity markets to biâ€directional, cross border investment. That attracted mainland Chinese investors to Hong Kong listed stocks which were much less expensive than Chinese stocks listed in Shanghai and Shenzhen. Investor enthusiasm eventually drove stocks to excessive valuations, particularly on the mainland bourses where the strong rally was at least partially driven by a steep rise in margin borrowing. Leveraged stock purchases reached unsustainable levels, leading market authorities to intervene to curb speculation. Curbs on margin lending contributed to a market reversal and the subsequent correction was almost as violent as the prior rally. Further interest rate cuts and commercial banks’ reserve requirements cuts by the Central Bank did not interrupt the fall until the margin leverage was cleared. This was only made possible by supportive policy measures being adopted by the PBOC, The China Securities Regulatory Commission and the Ministry of Finance. Together, these “Three Musketeers” created stock purchase vehicles and the major brokerage firms joined their efforts to calm down panicked individual investors in July. Just as markets looked to have reached a bottom and had started to stabilize, the PBOC surprised everybody on August 11th by announcing an 1.8% depreciation of the Chinese currency reference rate against the US dollar. This unexpected and unexplained decision spread questions and investor sentiment turned sharply lower once again. Share prices continued to dive until the beginning of September. From the top at the end of April to the trough on September 4th, the MSCI China index fell 35%. Meanwhile, international investors remained skeptical about the macroeconomic scenario as China’s growth continued to weaken gradually and monthly indicators of fixed asset investments, industrial production and global trade did not show any sign of improvement. Gross Domestic Product (GDP) growth has slowed from 7.4% last year to 6.9% for the first nine months 2015. Industrial production growth has decelerated from 7.9% last December to 5.7% in September. Fixed asset investments, up 15.7% last year have risen just 10.3% through the first nine months of 2015. Chinese exports are under pressure due to softer international demand and imports are now declining due partly to lower energy and commodity prices, whereas they were up 2 – 3% in 2014. Deflationary pressures persist given weak growth both domestically and abroad and excessive industrial capacity. Indeed, the producer price index (PPI) has been in negative territory for more than 30 months, hurting corporate profits and margins. However, as negative as they are, this data tells only part of the story. They do not mean that everything is going down in China and they certainly don’t signal a hard landing. These developments reflect the changing nature of China’s economic structure and landscape with a shift in the growth drivers far away from industrial engines towards consumption and services. The services sector reached 49.5% of GDP in the first half of 2015, up from 47.4% a year ago (and 44.3% in 2011) and it expanded by 8.4% in real term in the third quarter – versus a 6% increase for manufacturing. Household income continues to gain share in national income. Retail sales, that gained 10.7% over the first 2 months of this year are still up 10.6% over 10 months and accelerated to 11% growth in October, helped by a reacceleration in auto sales. While the manufacturing PMI (purchasing managers’ index) has declined below 50 since last August – signaling a contraction of the manufacturing sector – the nonâ€manufacturing PMI is still healthy above 53. Money supply (M2) remains reasonably strong, picking up 13.5% in October, from 12.2% last December. The widening gap between the different components of the economy is reflected in their diverging earnings trends. The market is a twoâ€tier market. From an industry perspective, the securities, insurance, airlines, media, and environmental services sectors are reporting faster earnings growth than the steel, building materials, oil and gas and coal sectors, whose earnings are actually falling. In the first eight months of this year, total profits of industrial enterprises fell 1.9% yearâ€overâ€year. However, the picture was very much contrasted between two camps. While profits in coal mining plunged 64.9% and ferrous metal smelting company earnings fell 51.6%, profits jumped 13.2% in the pharmaceutical equipment, 29.3% in water treatment, 13.9% in telecoms, and 12% in electrical equipment sectors1. Portfolio Composition Over the last twelve months, the best contributors to the Fund’s return were Tencent, CRRC and Man Wah. Tencent is the largest weighting in the MSCI China Index and has been the largest holding in the Fund for a number of years now. It is a privately owned group, founded in 1998 and listed in Hong Kong since 2004. Tencent is a leading provider of premium messaging services, Internet value added services and online games. It is highly profitable, with a return on equity (ROE) above 30% and a 30% net profit margin. Its balance sheet is very strong with a net cash position. Recently reported third quarter earnings showed revenue up 34%, boosted by mobile games and advertising (up 102% yearâ€overâ€year) and earnings per share surged 31% higher. Their instant messenger service, known as “QQ”, has the largest online community base with more than 800 million active users. Tencent is expanding into mobile payments and its powerful ecosystem continues to expand via cooperation with strategic partners. CRRC is China’s only rolling stock manufacturer, formed from the merger of two previously competing companies, CSR and CNR in June 2015. It manufactures railway equipment, locomotives, high speed trains and freight wagons. The share price surged in 103 | October 31, 2015 . Clough China Fund Management Commentary October 31, 2015 (Unaudited) December 2014 and again in April 2015 when details and terms of the merger were announced, on high expectations of cost savings synergy to be realized after the merger. The stock is no longer in the portfolio as its valuation appeared to have discounted more of the earnings upside potential. Established in 1992, Man Wah is the leading motion recliner sofa manufacturer in China where its brand Cheers holds a 29.2% market share, while it is number three in the USA with a 10.2% market share. It is also a privatelyâ€owned company operating four production facilities in mainland China. It’s most recent results – for the first half of their fiscal year 2016 – show revenue up 15.1% and core profits grew 21%. Man Wah's financial position is very healthy with net cash on the balance sheet, 22% ROE and a 17% net profit margin. On the other hand, the major detractors on the Fund’s performance were Sinotrans, China Fiber Optic System and CNOOC. Sinotrans is one of the largest logistic service providers in China, covering multiple segments of the supply chain; freight forwarding, logistics, storage and other related businesses. Its 63% subsidiary Sinoair holds a very profitable 50/50 joint venture with DHL. Sinotrans has transformed itself over the years to become a more dynamic group than in the past, for instance by disposing of their lossâ€making marine segment. It is a Stateâ€owned group. The share price was pressured several times this year by disappointing earnings releases. The Fund had trimmed the size of the holding, but is maintaining a position as this group is a target of the reform policy on Stateâ€owned enterprises, which should improve its fundamental quality and earnings outlook. We expect better days for Sinotrans if a successful restructuring is achieved. As China’s largest offshore oil explorer and producer, CNOOC suffered from falling oil prices. The stock was sold out at the end of August and is no longer in the portfolio. The same observation applies to China Fiber Optic, a manufacturer of fiber optic patch cords for telecom operators that was sold out at the end of July. Outlook We expect China to continue to transform and to transition from the old “workshop of the world” model towards a more consumption†driven economy. It is worth highlighting that Chinese consumers are also among the major actors of these changes. Consumption patterns in China are changing faster than ever; becoming a very dynamic area where new products and new segments are enjoying very strong growth. One of the best examples of this is the spectacular rise of eâ€commerce. Over 361 million internet users (56% of the total) 2 shopped online in 2014 . Eâ€commerce continued to boom this year as online sales of goods and services jumped 35% in the first ten months of 2015. Online sales of physical goods now account for around 10% of total retail sales – higher than the 6.8% proportion recorded in the United States. Another example is the takeoff experienced in leisure and entertainment spending. China's movie box office garnered a 48% increase in revenue over the last 12 months3. China is expected to become the world’s largest movie market by 2017, overtaking the 4 massive US market in box office revenues . The deep changes in Chinese consumers’ lifestyle are entrenched in the fast urbanization of the country. These developments create new investment opportunities not only in ecommerce and entertainment but also in sportswear, travel (airline passenger traffic increased 15% on the first nine months of 2015), insurance, healthcare and environmental services. Of course, mobile communications plays a key role in efficiently opening many of these markets. Online gaming, messaging services, online to offline (O2O) transactions are being driven by the rapid build out and deployment of 4G mobile data networks. The number of 4G mobile subscribers is rising very rapidly, with more than 20 million new highâ€speed data subscribers added every month. 4G penetration has now reached 302.4 million people, or 23.3% of the total number of mobile 5 subscribers through October 2015. There is a “New China” emerging with rapid growth, while the “Old China” of heavy industry, construction, and traditional retail networks slow down or even decline in relevance, as it was highlighted in the profitability divergences above in the first part of this report. Beijing has released its first communications of the recently approved 13th Five Year Plan which covers the years 2016 to 2020. The policy initiative from Beijing shows a target of at least 6.5% economic growth over the next five years in order to achieve the goal of “moderately prosperous society” with growth dividends to be shared by all citizens. This growth strategy is squarely focused on helping to improve the quality of life of China's citizens which, of course, will help to boost household consumption. The government also placed a high priority on green and ecoâ€friendly growth and on education, the establishment of a more equitable healthcare and social security systems and finally announced that it is abandoning the oneâ€child policy introduced 36 years ago to allow all couples to have two children6. The relaxation of the oneâ€child policy intends to address and hopefully turn around China’s demographic challenge. It may not have as strong an impact as hoped. For instance, a partial relaxation of this policy in November 2013 had actually very modest results with only 5% of qualified couples following the new rule and having a second child by the end of 2014. So if we applied the same 5% to the current number of couples who can have a second child, it implies the number of new births could reach 3 million per year, or a 17.7% increase from the 16.9mn 7 new babies born in 2014 . This may not look huge and the policy will not have a material impact on China’s labor force profile before two decades. However, assuming an average Rmb 30,000 annual spending to raise a child, this leads to some additional private consumption anyway. If the government later decides to provide financial support and better social security assistance to families, it will help the new policy to be much more efficient. Two movements converge at the same time to push in the new direction: bottom up, the society is changing fast; top down, the policy is backing the changes and goes along with them. There is no turnaround. People are no longer workers first – they are consumers first. China has fortunately built massive infrastructure in the last thirty years. The people are moving from builders of infrastructure 104 | October 31, 2015 . Clough China Fund Management Commentary October 31, 2015 (Unaudited) to users of the roads, high speed rail, buses and airports. This, again, creates new investment opportunities. As China transforms, so do Chinese equity markets and market indices. MSCI recently announced the inclusion of fourteen New Yorkâ€listed Chinese ADRs effective on November 30. This is merely recognizing the rising importance taken by these eâ€commerce and internet sectors in the real economy. Technologyâ€related stocks will account for 24% of your China Fund benchmark vs. 14% last month. On the other hand, the weighting of all financials will fall from 42 to 37%. Also note the weightings of New Economy and private sector companies will rise again next May since their inclusion takes place in two steps. In turn, the influence and importance of Stateâ€owned enterprises (SOEs) and Old Economy stocks will continue to wane. When investors stop focusing and obsessing on the surface of the slowdown of China’s GDP growth in volume and start looking a bit more in depth at the changes in the nature of GDP growth, we believe that they will find reasons for optimism in the new growth engines and investment themes. Our view is that China’s fundamentals are not as dangerous as the volatility of markets. That is where Beijing's economic reform agenda must continue to focus. A successful rebalancing requires the growth of financial markets which will be the key driver of funding the private sector led growth model. This is staunchly different than the bankâ€fund SOE led growth model of the past. The recommendation of the IMF to include the Chinese currency in Special Drawing Rights (SDR) likely at the end of November 2015 will encourage the Chinese government to continue to reform the financial system, which includes initiatives to establish a sustainable and healthy stock market. While some fret over the value of the Chinese Yuan exchange rate in the near term, China's growth prospects combined with Beijing's continued reform agenda is like to surprise on the upside and a stronger Yuan could emerge over the intermediate to longâ€term. Francoise Vappereau, Coâ€Portfolio Manager Eric Brock, Coâ€Portfolio Manager Sources: 1 BBG and Citics Secs : Mining dragged down the growth. 26 Sept 2015. 2 CICC China Consumer Sector. 6 Nov 2015, p.6. 3 Bernstein: Strategy Blast, Nov 13, 2015. 4 Nomura, Sept 7, 2015: China Movie. 5 Ministry of Industry and Information Technology. 6 Barclays: China, Fifth Plenum emphasizes social spending and green growth; two-child policy adopted. Oct 30, 2015 + Nomura Economics. Oct 29, 2015. 7 Morgan Stanley: China: How many Babies? Oct 30, 2015. Investments in international and emerging markets securities include exposure to risks such as currency fluctuations, foreign taxes and regulations, and the potential for illiquid markets and political instability. The views of the author and information discussed in this commentary are as of the date of publication, are subject to change, and may not reflect the writer's current views.
The views expressed are those of the author only, and represent an assessment of market conditions at a specific point in time, are opinions only and should not be relied upon as investment advice regarding a particular investment or markets in general. Such information does not constitute a recommendation to buy or sell specific securities or investment vehicles. It should not be assumed that any investment will be profitable or will equal the performance of the fund(s) or any securities or any sectors mentioned in this letter.
The subject matter contained in this letter has been derived from several sources believed to be reliable and accurate at the time of compilation. Neither ALPS, Advisors, Inc., Clough Capital Partners, LP, nor the Fund accepts any liability for losses either direct or consequential caused by the use of this information. 105 | October 31, 2015 . Clough China Fund Performance Update October 31, 2015 (Unaudited) Performance of $10,000 Initial Investment (as of October 31, 2015) Comparison of change in value of a $10,000 investment (includes maximum sales charges of 5.50%) $40k $35k Clough China Fund Class A (NAV) - $29,379 Clough China Fund Class A (MOP) - $27,769 MSCI China Index - $27,493 $30k $25k $20k $15k $10k 10/31/15 10/31/14 10/31/13 10/31/12 10/31/11 10/31/10 10/31/09 10/31/08 10/31/07 10/31/06 12/30/05^ $5k The chart above represents historical performance of a hypothetical investment of $10,000 in the Fund since inception. Past performance does not guarantee future results. This chart does not reflect the deduction of taxes that a shareholder would pay on Fund distributions or the redemption of Fund shares. Average Annual Total Returns (as of October 31, 2015) 6 Month 1 Year 3 Year 5 Year Since Inception^ Total Expense Ratio What You Pay* Class A (NAV) â€20.89% â€3.49% 7.01% 2.22% 11.58% Class A (MOP) â€25.24% â€8.80% 5.00% 1.07% 10.94% 2.06% 1.95% Class C (NAV) â€21.19% â€4.25% 6.21% 1.45% 10.75% Class C (CDSC) â€21.97% â€5.16% 6.21% 1.45% 10.75% 2.87% 2.70% Class I 1 â€20.57% â€2.99% 7.43% 2.55% 12.06% MSCI China Index2 â€23.38% â€0.70% 4.91% 0.98% 10.83% 1.82% 1.70% Performance data quoted represents past performance. Past performance does not guarantee future results.
Investment return and principal value of an investment will fluctuate so that an investor’s shares, when sold or redeemed, may be worth more or less than the original cost. Current performance data may be higher or lower than actual data quoted. For the most current month-end performance data, please call 1-866-759-5679. Maximum Offering Price (MOP) for Class A shares includes the Fund’s maximum sales charge of 5.50%. Performance shown at NAV does not include these sales charges and would have been lower had it been taken into account.
If you invest $1 million or more, either as a lump sum or through the Fund’s accumulation or letter of intent programs, you can purchase Class A shares without an initial sales charge (load). A Contingent Deferred Sales Charge (“CDSC”) of 1.00% may apply to Class C shares redeemed within the first 12 months after a purchase, and on Class A shares redeemed within the first 18 months after a purchase in excess of $1 million. The Fund imposes a 2.00% redemption fee on shares held for less than 30 days. Performance less than 1 year is cumulative. The performance shown for the Clough China Fund for periods prior to January 15, 2010, reflects the performance of the Old Mutual China Fund, a series of Old Mutual Funds I (as a result of a prior reorganization of the Old Mutual China Fund into the Clough China Fund). 1 Prior to close of business on January 15, 2010, Class I was known as Institutional Class of the Old Mutual China Fund. 106 | October 31, 2015 .
Clough China Fund Performance Update October 31, 2015 (Unaudited) 2 The Morgan Stanley Capital International (“MSCI”) China Index is constructed according to the MSCI Global Investable Market Index (GIMI) family. The MSCI China Index is part of the MSCI Emerging Markets Index. The index is not actively managed and does not reflect any deduction for fees, expenses or taxes. An investor may not invest directly in an index. ^ Fund Inception date of December 30, 2005. * What You Pay reflects the Advisor’s decision to contractually limit expenses through February 29, 2016.
Please see the prospectus for additional information. The table does not reflect the deduction of taxes that a shareholder would pay on Fund distributions or the redemption of Fund shares. This Fund is not suitable for all investors and is subject to investment risks, including possible loss of the principal amount invested. There is no guarantee that the Fund will continue to hold any one particular security or stay invested in any one particular company. The composition of the Fund's top holdings is subject to change. Performance figures are historical and reflect the change in share price, reinvested distributions, changes in net asset value, sales charges and capital gains distributions, if any. Not FDIC Insured – No Bank Guarantee – May Lose Value Investing in China, Hong Kong and Taiwan involves risk and considerations not present when investing in more established securities markets.
The Fund may be more susceptible to the economic, market, political and local risks of these regions than a fund that is more geographically diversified. Top Ten Holdings (as a % of Net Assets) † Industry Sector Allocation (as a % of Net Assets) China Mobile, Ltd. Tencent Holdings, Ltd. China Construction Bank Corp., Class H Ping An Insurance Group Co. of China, Ltd., Class H Industrial & Commercial Bank of China, Ltd., Class H Bank of China, Ltd., Class H Byd Co., Ltd., Class H Sinopharm Group Co., Ltd., Class H China Petroleum & Chemical Corp., Class H Pacific Textile Holdings, Ltd. Top Ten Holdings Financials - 28.29% Consumer, Cyclical - 19.13% Communications - 14.48% Technology - 12.12% Industrials - 8.84% Consumer, Non-cyclical - 4.97% Energy - 3.79% Utilities - 0.87% Consumer Discretionary - 0.72% Cash, Cash Equivalents & Other Net Assets - 6.79% 10.14% 10.14% 7.12% 5.26% 4.92% 4.51% 2.47% 2.42% 2.36% 2.34% 51.68% † Holdings are subject to change, and may not reflect the current or future position of the portfolio. Table presents indicative values only. Excludes cash & cash equivalents. 107 | October 31, 2015 .
Clough China Fund Statement of Investments October 31, 2015 Value (Note 2) Shares COMMON STOCKS (89.42%) Communications (14.48%) Internet (1.19%) Alibaba Group Holding, Ltd., Sponsored ADR(a) Telecommunications (13.29%) China Mobile, Ltd. 621,000 China Telecom Corp., Ltd., Class H 1,758,000 China Unicom Hong Kong, Ltd. 644,000 ZTE Corp., Class H 255,800 871,832 7,445,725 917,012 784,835 615,990 9,763,562 TOTAL COMMUNICATIONS 10,635,394 TOTAL CONSUMER DISCRETIONARY 750,000 12,418,964 461,500 520,240 Consumer, Nonâ€Cyclical (4.17%) Biotechnology (0.71%) 3SBio, Inc.(a)(b) Food (0.40%) China Mengniu Dairy Co., Ltd. 80,000 China Modern Dairy Holdings, Ltd. 462,000 531,433 531,433 722,412 Auto Manufacturers (4.50%) BAIC Motor Corp., Ltd., Class (b) H Brilliance China Automotive Holdings, Ltd. Byd Co., Ltd., Class H(a) Great Wall Motor Co., Ltd., Class H Retail (4.52%) Baoxin Auto Group, Ltd. Giordano International, Ltd. (a) Li Ning Co., Ltd. 21,500 138,970 293,930 232,166 Pharmaceuticals (2.42%) Sinopharm Group Co., Ltd., Class H 154,960 236,467 432,000 1,780,322 3,063,125 TOTAL CONSUMER, NONâ€CYCLICAL Household Products & Wares (0.32%) Biostime International Holdings, Ltd. 106,500 Apparel (1.83%) Best Pacific International Holdings, Ltd. 370,000 158,014 Shenzhou International Group 170,000 837,755 Holdings, Ltd. Texhong Textile Group, Ltd. 470,500 348,966 1,344,735 439,500 387,406 214,000 292,000 296,742 1,815,571 660,500 802,087 3,301,806 701,500 1,412,000 1,642,500 Energy (3.79%) Oil & Gas (3.79%) China Petroleum & Chemical Corp., Class H PetroChina Co., Ltd., Class H 2,400,120 1,730,112 1,344,000 1,052,223 2,782,335 TOTAL ENERGY 2,782,335 Auto Parts & Equipment (0.68%) Fuyao Glass Industry Group Co., Ltd., Class H(a)(b) 232,800 Healthcare Products (0.32%) Hengan International Group Co., Ltd. Consumer, Cyclical (16.91%) Airlines (0.98%) Air China, Ltd., Class H 377,000 1,054,593 1,202,000 1,715,855 476,000 463,234 3,233,682 TOTAL CONSUMER, CYCLICAL Consumer Discretionary (0.72%) Specialty Retail (0.72%) China ZhengTong Auto Services 1,187,500 Holdings, Ltd. Textiles (4.40%) Anta Sports Products, Ltd. Pacific Textile Holdings, Ltd. Texwinca Holdings, Ltd. 1,239,112 $ 1,415,526 3,318,644 Retail (continued) Man Wah Holdings, Ltd. 10,400 $ Value (Note 2) Shares 497,685 289,631 757,690 855,797 Financials (28.29%) Banks (17.97%) Bank of China, Ltd., Class H 7,030,437 China Construction Bank Corp., Class H 7,216,080 China Merchants Bank Co., Ltd., Class H 396,000 108 | October 31, 2015 3,315,283 5,229,897 1,033,923 . Clough China Fund Statement of Investments October 31, 2015 Value (Note 2) Shares Banks (continued) Industrial & Commercial Bank of China, Ltd., Class H 5,698,967 $ 3,614,888 13,193,991 Real Estate (2.90%) China Overseas Land & Investment, Ltd. China Resources Land, Ltd. 332,000 1,072,316 408,000 1,060,224 2,132,540 Industrials (8.07%) Building Materials (1.17%) Anhui Conch Cement Co., Ltd., Class H 281,500 20,777,931 1,009,222 Engineering & Construction (3.28%) China Communications Construction Co., Ltd., 559,000 771,525 Class H China Railway Construction Corp., Ltd., Class H 1,097,000 1,639,780 2,411,305 287,305 Electrical Components & Equipment (1.38%) Xinjiang Goldwind Science & Technology Co., Ltd. 537,400 858,941 Construction & Engineering (0.39%) China Railway Group, Ltd., Class H 305,000 Transportation Infrastructure (1.85%) Cosco International Holdings, Ltd. 1,382,000 795,257 Sinotrans, Ltd., Class H 1,037,000 563,100 1,358,357 5,925,130 784,000 Technology (12.12%) Computers (1.40%) PAX Global Technology, Ltd. 7,443,620 431,181 8,900,007 Utilities (0.87%) Electric (0.87%) China Power International Development, Ltd. 1,011,000 635,345 TOTAL TECHNOLOGY 635,345 65,669,664 TOTAL COMMON STOCKS (Cost $56,988,470) PARTICIPATION NOTES (3.79%) Consumer, Cyclical (2.22%) Auto Manufacturers (2.22%) Chongqing Changan Automobile Co., Ltd., Class A (Loan Participation Notes issued by Morgan Stanley Asia Products), expiring (a)(b) 02/04/16 234,700 571,750 Zhengzhou Yutong Bus Co., Ltd., Class A (Loan Participation Notes issued by Morgan Stanley Asia Products), (a)(b) 305,635 1,060,470 expiring 10/27/17 1,632,220 1,632,220 70,600 TOTAL CONSUMER, CYCLICAL 587,262 587,262 Consumer, Nonâ€Cyclical (0.80%) Pharmaceuticals (0.80%) Jiangsu Hengrui Medicine Co., Ltd., Class A (Loan Participation Notes issued by Morgan Stanley Asia Products), expiring (a)(b) 03/16/17 TOTAL CONSUMER, NONâ€CYCLICAL Internet Software & Services (0.59%) Baidu, Inc., Sponsored ADR(a) 2,300 1,025,206 TOTAL INDUSTRIALS 394,900 $ TOTAL UTILITIES TOTAL FINANCIALS Internet (10.13%) Tencent Holdings, Ltd. Insurance (7.42%) China Life Insurance Co., Ltd., Class H 440,000 1,586,677 Ping An Insurance Group Co. of China, Ltd., Class H 688,500 3,864,723 5,451,400 Value (Note 2) Shares 109 | October 31, 2015 . Clough China Fund Statement of Investments October 31, 2015 Shares Industrials (0.77%) Engineering & Construction (0.77%) Shanghai International Airport Co., Ltd., Class A (Loan Participation Notes issued by Morgan Stanley Asia Products), expiring 11/18/15(a)(b) 118,665 $ Value (Note 2) 567,639 TOTAL INDUSTRIALS 567,639 Common Abbreviations: ADR - American Depositary Receipt. Ltd. - Limited. For Fund compliance purposes, the Fund's industry classifications refer to any one or more of the industry sub-classifications used by one or more widely recognized market indexes or ratings group indexes, and/or as defined by Fund management. This definition may not apply for purposes of this report, which may combine industry sub-classifications for reporting ease. Industries are shown as a percent of net assets. See Notes to Financial Statements. TOTAL PARTICIPATION NOTES (Cost $2,086,714) 7-Day Yield 2,787,121 Value (Note 2) Shares SHORT TERM INVESTMENTS (0.23%) Money Market Fund (0.23%) Morgan Stanley Institutional Liquidity Funds †Prime Portfolio 0.096% 170,634 TOTAL SHORT TERM INVESTMENTS (Cost $170,634) TOTAL INVESTMENTS (93.44%) (Cost $59,245,818) Other Assets In Excess Of Liabilities (6.56%) NET ASSETS (100.00%) 170,634 170,634 $ 68,627,419 4,816,068 $ 73,443,487 (a) (b) Non-Income Producing Security. Security exempt from registration under Rule 144A of the Securities Act of 1933.
This security may be resold in transactions exempt from registration, normally to qualified institutional buyers. As of October 31, 2015, the aggregate market value of those securities was $4,192,452, representing 5.71% of net assets. 110 | October 31, 2015 . Clough China Fund Statement of Assets and Liabilities October 31, 2015 ASSETS Investments, at value Foreign currency, at value (Cost $4,053,719) Receivable for investments sold Receivable for shares sold Dividends receivable Prepaid expenses and other assets Total Assets $ 68,627,419 4,053,438 4,365,047 45,565 5,450 15,666 77,112,585 $ 3,489,203 24,104 69,536 15,874 14,193 26,737 29,451 3,669,098 73,443,487 $ $ 66,982,750 1,041,894 (3,962,411) 9,381,254 73,443,487 LIABILITIES Payable for investments purchased Payable for shares redeemed Investment advisory fees payable Administration and transfer agency fees payable Distribution and services fees payable Professional fees payable Accrued expenses and other liabilities Total Liabilities NET ASSETS NET ASSETS CONSIST OF Paidâ€in capital Accumulated net investment income Accumulated net realized loss on investments and foreign currency transactions Net unrealized appreciation on investments and translation of assets and liabilities denominated in foreign currencies NET ASSETS INVESTMENTS, AT COST PRICING OF SHARES $ 59,245,818 Class A: Net Asset Value, offering and redemption price per share Net Assets Shares of beneficial interest outstanding (unlimited number of shares, no par value common stock authorized) Maximum offering price per share ((NAV/0.9450), based on maximum sales charge of 5.50% of the offering price) Class C: (a) Net Asset Value, offering and redemption price per share Net Assets Shares of beneficial interest outstanding (unlimited number of shares, no par value common stock authorized) Class I: Net Asset Value, offering and redemption price per share Net Assets Shares of beneficial interest outstanding (unlimited number of shares, no par value common stock authorized) $ $ $ $ 20.72 $ 10,395,052 501,691 (a) 21.74 25,276,032 1,162,817 23.01 $ 22.28 $ 37,772,403 1,695,228 Redemption price per share may be reduced for any applicable contingent deferred sales charge. For a description of a possible sales charge, please see the Fund's Prospectus. See Notes to Financial Statements. 111 | October 31, 2015 . Clough China Fund Statement of Operations For the Year Ended October 31, 2015 INVESTMENT INCOME Dividends Foreign taxes withheld on dividends Total Investment Income $ 2,460,152 (182,064) 2,278,088 EXPENSES Investment advisory fees Administrative fees Transfer agency fees Distribution and service fees Class A Class C Professional fees Networking fees Class A Class C Class I Reports to shareholders and printing fees State registration fees Insurance fees Custody fees Trustees' fees and expenses Miscellaneous expenses Total Expenses Less fees waived/reimbursed by investment advisor (Note 8) Class A Class C Class I Net Expenses Net Investment Income Net realized loss on investments Net realized loss on foreign currency transactions Net change in unrealized depreciation on investments Net change in unrealized depreciation on translation of assets and liabilities denominated in foreign currencies See Notes to Financial Statements. 112 | October 31, 2015 8,953 8,443 30,077 14,899 41,307 984 48,940 2,068 13,617 1,759,906 $ (10,535) (9,198) (30,012) 1,710,161 567,927 (1,783,943) (2,052) (5,134,658) (3,357) (6,924,010) (6,356,083) 77,090 120,646 37,960 NET REALIZED AND UNREALIZED LOSS ON INVESTMENTS NET DECREASE IN NET ASSETS RESULTING FROM OPERATIONS 1,201,044 149,602 4,276 . Clough China Fund Statements of Changes in Net Assets For the Year Ended October 31, 2015 For the Fiscal Period Ended October 31, 2014(a) For the Year Ended April 30, 2014 OPERATIONS Net investment income Net realized gain/(loss) on investments and foreign currency transactions Net change in unrealized appreciation/(depreciation) on investments and translation of assets and liabilities denominated in foreign currencies Net Increase/(Decrease) in Net Assets Resulting from Operations $ 567,927 $ (1,785,995) 1,526,148 $ 2,049,534 (5,138,015) (6,356,083) 6,054,295 9,629,977 500,278 2,061,432 (5,382,680) (2,820,970) DISTRIBUTIONS Dividends to shareholders from net investment income Class A Class C Class I Dividends to shareholders from net realized gains Class A Class C Class I Net Decrease in Net Assets from Distributions (646,687) (212,498) (889,808) (599,361) (236,066) (777,420) (3,361,840) – – – – – – – (300,642) (39,515) (359,841) – – – (699,998) BENEFICIAL INTEREST TRANSACTIONS (NOTE 6) Shares sold Class A Class C Class I Dividends reinvested Class A Class C Class I Shares redeemed, net of redemption fees Class A Class C Class I Net Increase/(Decrease) in Net Assets Derived from Beneficial Interest Transactions Net increase/(decrease) in net assets NET ASSETS Beginning of year End of year * *Including accumulated net investment income of: (a) 9,834,811 4,114,019 39,761,433 858,834 247,634 1,031,976 (13,529,955) (4,280,998) (36,894,860) 1,142,894 (8,575,029) 82,018,516 $ 73,443,487 $ 1,041,894 $ $ 3,360,623 896,076 8,345,000 – – – (7,865,957) (1,541,832) (6,269,825) (3,075,915) 6,554,062 75,464,454 82,018,516 1,699,179 Effective May 1, 2014, the Board approved changing the fiscal year-end of the Funds from April 30 to October 31. See Notes to Financial Statements. 113 | October 31, 2015 13,818,283 4,109,696 17,778,504 401,410 21,934 167,997 (14,337,423) (4,986,624) (8,919,474) 8,054,303 4,533,335 70,931,119 $ 75,464,454 $ 173,708 . Clough China Fund – Class A Financial Highlights Selected data for a share of beneficial interest outstanding throughout the periods indicated: For the Year Ended October 31, 2015 $23.50 For the Year Ended April 30, 2014 $21.45 For the Year Ended April 30, 2013 $18.43 For the Year Ended April 30, 2012 $21.02 For the Year Ended April 30, 2011 $18.21 0.12 (0.92) (0.80) (0.50) (0.46) (0.96) 0.45 2.33 2.78 – – – 0.12 (0.69) (0.57) (0.17) – (0.17) 0.15 2.90 3.05 (0.03) – (0.03) 0.02 (2.61) (2.59) – – – (0.04) 2.94 2.90 (0.09) – (0.09) 0.00(c) (1.76) $21.74 0.00(c) 2.78 $23.50 0.01 (0.73) $20.72 0.00(c) 3.02 $21.45 0.00(c) (2.59) $18.43 0.00(b)(c) 2.81 $21.02 (3.49)% 13.42% (2.69)% 16.54% (12.32)% 16.00% $25,276 Net asset value, beginning of period For the Fiscal Period Ended October 31, 2014(a) $20.72 $30,526 $31,164 $32,709 $30,542 $44,616 INCOME/(LOSS) FROM INVESTMENT OPERATIONS: Net investment income/(loss)(b) Net realized and unrealized gain/(loss) Total from investment operations DISTRIBUTIONS: From net investment income From net realized gains Total distributions REDEMPTION FEES ADDED TO PAIDâ€IN CAPITAL (NOTE 6) Net increase/(decrease) in net asset value Net asset value, end of year TOTAL RETURN(d) RATIOS/SUPPLEMENTAL DATA: Net assets, end of year (000s) Ratio of expenses to average net assets excluding fee waivers and reimbursements Ratio of expenses to average net assets including fee waivers and reimbursements Ratio of net investment income/(loss) to average net assets Portfolio turnover rate(g) (c) (d) (b) (e) (g) (f) 2.06% (e) 2.06% 2.14% 2.08% 1.95% (a) 1.98% (e) 1.95% 1.95% 1.95% 1.95% 1.89%(f) 0.50% 193% (e) 3.96% 76% 0.55% 232% 0.78% 221% 0.13% 174% (0.22)% 170% 2.07% Effective May 1, 2014, the Board approved changing the fiscal year-end of the Funds from April 30 to October 31. Calculated using the average shares method. Less than $0.005 per share. Total returns are for the period indicated and have not been annualized. Total returns would have been lower had certain expenses not been waived during the period. Returns shown do not reflect the deduction of taxes that a shareholder would pay on Fund distributions or the redemption of Fund shares. Returns shown exclude any applicable sales charges. Annualized. Contractual expense limitation changed from 1.85% to 1.95% effective January 1, 2011. Portfolio turnover rate for periods less than one full year have not been annualized. See Notes to Financial Statements. 114 | October 31, 2015 .
Clough China Fund – Class C Financial Highlights Selected data for a share of beneficial interest outstanding throughout the periods indicated: For the Year Ended October 31, 2015 $22.53 For the Year Ended April 30, 2014 $20.71 For the Year Ended April 30, 2013 $17.90 For the Year Ended April 30, 2012 $20.58 For the Year Ended April 30, 2011 $17.89 (0.04) (0.89) (0.93) (0.42) (0.46) (0.88) 0.33 2.26 2.59 – – – (0.02) (0.68) (0.70) (0.07) – (0.07) 0.01 2.80 2.81 – – – (0.11) (2.57) (2.68) – – – (0.21) 2.90 2.69 (c) (0.00) – (0.00)(c) 0.00(c) (1.81) $20.72 0.00(c) 2.59 $22.53 0.00(c) (0.77) $19.94 0.00(c) 2.81 $20.71 0.00(c) (2.68) $17.90 0.00(c) 2.69 $20.58 (4.25)% 12.99% (3.43)% 15.70% (13.02)% 15.13% $10,395 Net asset value, beginning of period For the Fiscal Period Ended October 31, 2014(a) $19.94 $11,575 $10,866 $12,251 $11,674 $16,848 INCOME/(LOSS) FROM INVESTMENT OPERATIONS: Net investment income/(loss)(b) Net realized and unrealized gain/(loss) Total from investment operations DISTRIBUTIONS: From net investment income From net realized gains Total distributions REDEMPTION FEES ADDED TO PAIDâ€IN CAPITAL (NOTE 6) Net increase/(decrease) in net asset value Net asset value, end of year TOTAL RETURN(d) RATIOS/SUPPLEMENTAL DATA: Net assets, end of year (000s) Ratio of expenses to average net assets excluding fee waivers and reimbursements Ratio of expenses to average net assets including fee waivers and reimbursements Ratio of net investment income/(loss) to average net assets (f) Portfolio turnover rate 2.78% (a) (c) (d) (b) (e) (f) 2.86% 2.94% 2.88% 2.86% 2.70% 2.87% (e) 2.70%(e) 2.70% 2.70% 2.70% 2.70% (0.18)% 193% (e) 3.08% 76% (0.09)% 232% 0.07% 221% (0.62)% 174% (1.10)% 170% Effective May 1, 2014, the Board approved changing the fiscal year-end of the Funds from April 30 to October 31. Calculated using the average shares method. Less than $0.005 and ($0.005) per share. Total returns are for the period indicated and have not been annualized. Total returns would have been lower had certain expenses not been waived during the period. Returns shown do not reflect the deduction of taxes that a shareholder would pay on Fund distributions or the redemption of Fund shares. Returns shown exclude any applicable sales charges. Annualized. Portfolio turnover rate for periods less than one full year have not been annualized. See Notes to Financial Statements. 115 | October 31, 2015 .
Clough China Fund – Class I Financial Highlights Selected data for a share of beneficial interest outstanding throughout the periods indicated: For the Year Ended October 31, 2015 $23.97 For the Year Ended April 30, 2014 $21.82 For the Year Ended April 30, 2013 $18.71 For the Year Ended April 30, 2012 $21.30 For the Year Ended April 30, 2011 $18.41 0.23 (1.00) (0.77) (0.53) (0.46) (0.99) 0.45 2.41 2.86 – – – 0.19 (0.69) (0.50) (0.21) – (0.21) 0.13 3.02 3.15 (0.06) – (0.06) 0.06 (2.65) (2.59) – – – (0.01) 3.03 3.02 (0.13) – (0.13) 0.07 (1.69) $22.28 0.00(c) 2.86 $23.97 0.00(c) (0.71) $21.11 0.02 3.11 $21.82 0.00(c) (2.59) $18.71 0.00(c) 2.89 $21.30 (2.99)% 13.55% (2.41)% 16.95% (12.16)% 16.45% $37,772 Net asset value, beginning of period For the Fiscal Period Ended October 31, 2014(a) $21.11 $39,917 $33,435 $25,972 $28,868 $41,054 INCOME/(LOSS) FROM INVESTMENT OPERATIONS: Net investment income/(loss)(b) Net realized and unrealized gain/(loss) Total from investment operations DISTRIBUTIONS: From net investment income From net realized gains Total distributions REDEMPTION FEES ADDED TO PAIDâ€IN CAPITAL (NOTE 6) Net increase/(decrease) in net asset value Net asset value, end of year TOTAL RETURN(d) RATIOS/SUPPLEMENTAL DATA: Net assets, end of year (000s) Ratio of expenses to average net assets excluding fee waivers and reimbursements Ratio of expenses to average net assets including fee waivers and reimbursements Ratio of net investment income/(loss) to average net assets (g) Portfolio turnover rate (c) (d) (b) (e) (g) (f) 1.82% (e) 1.81% 1.94% 1.85% 1.70% (a) 1.77% 1.70%(e) 1.70% 1.70% 1.70% 1.53%(f) 0.95% 193% (e) 3.89% 76% 0.83% 232% 0.69% 221% 0.33% 174% (0.03)% 170% 1.85% Effective May 1, 2014, the Board approved changing the fiscal year-end of the Funds from April 30 to October 31. Calculated using the average shares method. Less than $0.005 per share. Total returns are for the period indicated and have not been annualized. Total returns would have been lower had certain expenses not been waived during the period. Returns shown do not reflect the deduction of taxes that a shareholder would pay on Fund distributions or the redemption of Fund shares. Annualized. Contractual expense limitation changed from 1.40% to 1.70% effective January 1, 2011. Portfolio turnover rate for periods less than one full year have not been annualized. See Notes to Financial Statements. 116 | October 31, 2015 . RiverFront Global Allocation Series Management Commentary October 31, 2015 (Unaudited) Year in Review for RiverFront Funds: The past twelve months ended October 31, 2015 have proved volatile for our strategy positioning. At the end of 2014, we saw oil prices plunge, high yield spreads widen, and Treasury yields fall to lows of the year while Europe continued to struggle with deflation pressures. As we transitioned into 2015, the first several months became the first act of a currency story as the European Central Bank (ECB) began its Quantitative Easing (QE) policy, the Federal Reserve (Fed) stated its intent to raise interest rates, and the Bank of Japan (BOJ) slowed the rate of yen depreciation. The ECB's announcement of a €60 billion per month purchase program of covered bonds, sovereign debt, and asset backed securities caused the euro to depreciate relative to the dollar. The US economy showed signs of strength, with a falling unemployment rate and the Fed removing "patient" from its commentary; the resulting expectation of higher interest rates caused further dollar strength. RiverFront responded to the ECB’s announcement by making a currencyâ€hedged investment in Europe; this move enabled our US investors to experience the return of the local European market without experiencing the effect of the depreciating euro in dollar terms. Additionally, we continued to hold hedged investments in Japan. Following the unsettling August/September decline in stocks around the world, the recovery in October was rewarding for those who held their nerve. However, even with October’s rebound, uncertainty continues to loom. The fact remains that investor confidence is shaken, and skepticism remains high. China, interest rates in the US, oil prices, and earnings (both in the US and abroad) all continue to dominate headlines and raise valid questions about growth as we move into 2016. As we look back over the past several months, there have been plenty of reasons for uncertainty. The announcement that the Chinese government had devalued the yuan prompted another round of fears of a global slowdown. Further concerns mounted after the Federal Open Market Committee failed to raise interest rates for the first time in 9 years. The market went into riskâ€off mode in both instances, and the yen and euro rallied versus the dollar over the quarter. These developments negatively impacted our fund performance for a period because we had a proâ€dollar investment thesis, whereby we invested in Europe and Japan on a currencyâ€hedged basis. Additionally, the riskâ€off sentiment in the market helped investors that had invested in longer duration Treasuries. However, our funds have avoided making long duration investments due to our anticipation of the Fed starting liftoff in 2015, and thus our funds did not participate in the Treasury rally. Going into the fourth quarter of calendar 2015, we no longer believe that the Fed will initiate a rate increase prior to yearâ€end. However, we believe that Europe and Japan will continue to benefit from Quantitative Easing, which in turn should cause their currencies to depreciate. Given our thesis for the remainder of the year, we will monitor U.S. economic data closely to determine whether adjustments need to be made to the current strategy positioning. The portfolios will continue to be overweight developed international at the expense of domestic U.S. equities. Additionally, we believe the slowdown in China will continue to have a profound effect on emerging markets, as these economies struggle with slowing demand for commodities, depreciating currencies, and repaying dollarâ€denominated debt. We believe that when the Fed raises rates in the US, emerging markets economies will experience even greater capital outflows. Hence, we will continue to avoid owning emerging markets in the funds because we do not foresee a catalyst to create growth in this asset class in the near term. Performance Discussion for the Balanced Funds (RiverFront Conservative Income Builder Fund, RiverFront Moderate Growth & Income Fund): In discussing the performance of the RiverFront funds, it is important to keep in mind their global allocation mandate. All of the RiverFront offerings have exposure to multiâ€cap, global equities; our balanced funds have the addition of fixed income. The table below illustrates the disparity of returns across the major indices during the most recent quarter, which resulted in varying degrees of relative performance when compared to the traditional single index, mutual fund benchmark. Twelve months ended 10/31/2015 Returns** Benchmark Indexes* S&P 500 Total Return S&P 1000 Total Return MSCI EAFE (Net) MSCI Emerging Markets (Net) MSCI All Country World Index (Net) Barclays US Aggregate Barclays US Treasury Index Barclays US Short Treasury Index (1â€3M) 5.20% 3.26% â€0.07% â€14.53% â€0.03% 1.96% 2.39% 0.01% Data as of 10/31/2015 * ** For index definitions see footnotes at the end of the Management Commentary and below the performance data on the following pages. For a complete presentation of RiverFront Mutual Fund and relevant benchmark performance, please refer to the Performance Update on the following pages. The RiverFront balanced funds underperformed their benchmarks over the trailing twelve month period, largely due to the fact that these funds were overweight developed international equity relative to US equity. Additionally, these funds were underweight fixed income, given our preference for equity over fixed income. Contributors: ï‚· Despite the allocation drag from being overweight in developed international, positive selection helped keep the category positive with positions in both Europe and Japan that hedged out the respective currencies. 117 | October 31, 2015 . RiverFront Global Allocation Series Management Commentary ï‚· ï‚· October 31, 2015 (Unaudited) Core US equity contributed positively as a result of both allocation and selection. Positive sectors included exposure to real estate investment trusts (REITs), food and drug retailing within consumer staples, and large pharmaceuticals within healthcare. Detractors: ï‚· ï‚· ï‚· ï‚· The underweight to traditional fixed income in favor of high yield impacted the portfolio negatively. Although our bias towards securities that hedge currency exposure helped keep developed international positive as a category, there were several country selections that had a negative impact on performance including Spain, Norway, and Germany. Within US equity, Master Limited Partnerships (MLPs) had a negative impact. Energy was one of the worst performing sectors over the period. We were neutral energy which impacted negatively from an allocation standpoint; however, there was also negative selection due to our exposure to the oil services sector. Performance Discussion for Growth Funds (RiverFront Global Growth Fund, RiverFront Dynamic Equity Income Fund, RiverFront Global Allocation Fund): The RiverFront growth funds outperformed their benchmarks over the trailing twelve month period, largely due to the positions that hedged currencies that are discussed above. The following points detail more specific contributors and detractors: Contributors: ï‚· ï‚· ï‚· ï‚· ï‚· ï‚· ï‚· The views of the author and information discussed in this commentary are as of the date of publication, are subject to change, and may not reflect the writer's current views. The views expressed are those of the author only, and represent an assessment of market conditions at a specific point in time, are opinions only and should not be relied upon as investment advice regarding a particular investment or markets in general. Such information does not constitute a recommendation to buy or sell specific securities or investment vehicles. It should not be assumed that any investment will be profitable or will equal the performance of the fund(s) or any securities or any sectors mentioned in this letter.
The subject matter contained in this letter has been derived from several sources believed to be reliable and accurate at the time of compilation. Neither ALPS Advisors, Inc., RiverFront Investment Group, LLC, nor the Funds accepts any liability for losses either direct or consequential caused by the use of this information. The S&P 1000® Index combines the S&P MidCap 400® and the S&P SmallCap 600® to form an investable benchmark for the mid- to small-cap segment of the U.S. equity market. The MSCI EAFE Index is recognized as the pre-eminent benchmark in the United States to measure international equity performance. It comprises the MSCI country indices that represent developed markets outside of North America: Europe, Australasia and the Far East. The MSCI Emerging Markets Index is a free float-adjusted market capitalization index that is designed to measure equity market performance in the global emerging markets. Selection within developed international markets outweighed the negative allocation impact – specifically the allocations to Europe and Japan (both on a currency hedged basis). Allocation to micro†and small†cap contributed positively. Within US equity, underweights to oil sensitive sectors such as energy and materials contributed positively. The Barclays U.S. Treasury Index includes public obligations of the U.S.
Treasury, excluding Treasury bills and certain special issues, such as state and local government series bonds (SLGs) and U.S. Treasury TIPS. The Barclays U.S. Short Treasury Index is composed of bonds of investment grade with a maturity between one and three years. An investor may not invest directly in an index. Detractors: ï‚· Past performance is no guarantee of future results. Dividends are not guaranteed and are subject to change or elimination.
Investments in international and emerging markets securities include exposure to risks such as currency fluctuations, foreign taxes and regulations, and the potential for illiquid markets and political instability. Diversification cannot guarantee gain or prevent losses. The overall underweight to US equity had a slightly negative allocation impact. Within US equity, Master Limited Partnerships (MLPs) impacted negatively. Our underweight to tech, specifically large cap tech names, negatively impacted returns. We also had negative impact from the underweight to consumer discretionary and negative selection impact within specialty retail. Within developed international, several country selections impacted performance negatively, including Spain, Norway, and Germany. 118 | October 31, 2015 . RiverFront Conservative Income Builder Fund Performance Update October 31, 2015 (Unaudited) Performance of $10,000 Initial Investment (as of October 31, 2015) Comparison of change in value of a $10,000 investment (includes maximum sales charges of 5.50%) $12k $11k 30% S&P 500®/ 70% Barclays U.S. Aggregate Bond - $11,949 RiverFront Conservative Income Builder Fund Class A (NAV) - $11,399 $10k RiverFront Conservative Income Builder Fund Class A (MOP) - $10,774 Barclays U.S. Aggregate Bond Index - $10,538 10/31/15 10/31/14 10/31/13 8/31/12^ $9k The chart above represents historical performance of a hypothetical investment of $10,000 in the Fund since inception. Past performance does not guarantee future results. This chart does not reflect the deduction of taxes that a shareholder would pay on Fund distributions or the redemption of Fund shares. Average Annual Total Returns (as of October 31, 2015) Class A (NAV) Class A (MOP) Class C (NAV) Class C (CDSC) Class I Barclays U.S. Aggregate 1 Bond Index 30% S&P 500® and 70% Barclays U.S. 1,2 Aggregate Bond 6 Month â€1.66% â€7.05% â€1.97% â€2.95% â€1.48% 1 Year 0.40% â€5.11% â€0.39% â€1.35% 0.60% 3 Years 4.29% 2.36% 3.52% 3.52% 4.53% Since Inception^ 4.22% 2.38% 3.46% 3.46% 4.48% â€0.10% 1.96% 1.65% 1.67% 0.29% 3.13% 5.95% 5.78% Total Expense Ratio What You Pay* 2.71% 1.47% 3.46% 2.22% 2.44% 1.22% Performance data quoted represents past performance. Past performance does not guarantee future results.
Investment return and principal value of an investment will fluctuate so that an investor's shares, when sold or redeemed, may be worth more or less than the original cost. Current performance data may be higher or lower than actual data quoted. For the most current month-end performance data, please call 1-866-759-5679. Maximum Offering Price (MOP) for Class A shares includes the Fund’s maximum sales charge of 5.50%.
Performance shown at NAV does not include these sales charges and would have been lower had it been taken into account. If you invest $1 million or more, either as a lump sum or through the Fund’s accumulation or letter of intent programs, you can purchase Class A shares without an initial sales charge (load). A Contingent Deferred Sales Charge (“CDSC”) of 1.00% may apply to Class C shares redeemed within the first 12 months after a purchase, and on Class A shares redeemed within the first 18 months after a purchase in excess of $1 million. Performance less than 1 year is cumulative. 119 | October 31, 2015 .
RiverFront Conservative Income Builder Fund Performance Update October 31, 2015 (Unaudited) 1 The Barclays U.S. Aggregate Bond Index is a broad-based benchmark that measures the investment grade, U.S. dollar-denominated, fixed-rate taxable bond market, including Treasuries, government-related and corporate securities, MBS (agency fixed-rate and hybrid ARM passthroughs), ABS, and CMBS. The index is not actively managed and does not reflect any deductions for fees, expenses or taxes.
An investor may not invest directly in an index. 2 The S&P 500® Index is the Standard & Poor's composite index of 500 stocks, a widely recognized, unmanaged index of common stock prices. ^ Fund inception date of August 31, 2012. * What You Pay reflects the Advisor's and Sub-Advisor's decision to contractually limit expenses through February 29, 2016 and Acquired Fund Fees and Expenses of 0.32%. Please see the prospectus for additional information. The table does not reflect the deduction of taxes that a shareholder would pay on Fund distributions or the redemption of Fund shares. This Fund is not suitable for all investors and is subject to investment risks, including possible loss of the principal amount invested. There is no guarantee that the Fund will continue to hold any one particular security or stay invested in any one particular company. The composition of the Fund's top holdings is subject to change.
Performance figures are historical and reflect the change in share price, reinvested distributions, changes in net asset value, sales charges and capital gains distributions, if any. Not FDIC Insured – No Bank Guarantee – May Lose Value Top Ten Holdings (as a % of Net Assets) † † RiverFront Strategic Income Fund Guggenheim BulletShares 2018 Corporate Bond ETF Guggenheim BulletShares 2017 Corporate Bond ETF Guggenheim BulletShares 2016 Corporate Bond ETF WisdomTree® Europe Hedged Equity Fund WisdomTree® LargeCap Dividend Fund iShares® MSCI Japan ETF iShares® Core S&P 500® ETF iShares® Barclays 1â€3 Year Credit Bond ETF PIMCO Enhanced Short Maturity Active ETF Top Ten Holdings Portfolio Composition (as a % of Net Assets) 9.82% Fixed Income - 54.88% 8.50% International Developed Equities - 20.88% Domestic Core Equities - 17.51% 8.49% Domestic MLPs - 0.03% 8.47% 6.23% 5.11% 4.95% 4.74% Domestic Small-Cap Equities - 0.02% Other - 0.02% Cash, Cash Equivalents & Other Net Assets - 6.66% 4.32% 3.39% 64.02% Holdings are subject to change, and may not reflect the current or future position of the portfolio. Table presents indicative values only. Excludes cash & cash equivalents. 120 | October 31, 2015 .
RiverFront Dynamic Equity Income Fund Performance Update October 31, 2015 (Unaudited) Performance of $10,000 Initial Investment (as of October 31, 2015) Comparison of change in value of a $10,000 investment (includes maximum sales charges of 5.50%) $17k $16k MSCI ACWI - $15,491 $15k RiverFront Dynamic Equity Income Fund Class A (NAV) - $14,649 70% MSCI ACWI/30% Barclays U.S. Aggregate Bond - $14,458 RiverFront Dynamic Equity Income Fund Class A (MOP) - $13,846 $14k $13k $12k $11k $10k 10/31/15 10/31/14 10/31/13 10/31/12 10/31/11 8/2/10^ $9k The chart above represents historical performance of a hypothetical investment of $10,000 in the Fund since inception. Past performance does not guarantee future results. This chart does not reflect the deduction of taxes that a shareholder would pay on Fund distributions or the redemption of Fund shares. Average Annual Total Returns (as of October 31, 2015) Class A (NAV) Class A (MOP) Class C (NAV) Class C (CDSC) Class I 1 MSCI All Country World Index 70% MSCI ACWI and 30% Barclays U.S. Aggregate Bond1,2 6 Month â€4.03% â€9.30% â€4.41% â€5.36% â€3.91% â€4.77% 1 Year 1.64% â€3.94% 0.86% â€0.10% 1.83% â€0.03% 3 Years 8.18% 6.18% 7.36% 7.36% 8.45% 9.92% 5 Years 6.64% 5.44% 5.84% 5.84% 6.91% 7.68% Since Inception^ 7.55% 6.40% 6.74% 6.74% 7.81% 8.70% â€3.26% 0.77% 7.51% 6.48% 7.28% Total Expense Ratio What You Pay* 1.78% 1.54% 2.54% 2.29% 1.54% 1.29% Performance data quoted represents past performance.
Past performance does not guarantee future results. Investment return and principal value of an investment will fluctuate so that an investor's shares, when sold or redeemed, may be worth more or less than the original cost. Current performance data may be higher or lower than actual data quoted.
For the most current month-end performance data, please call 1-866-759-5679. Maximum Offering Price (MOP) for Class A shares includes the Fund’s maximum sales charge of 5.50%. Performance shown at NAV does not include these sales charges and would have been lower had it been taken into account. If you invest $1 million or more, either as a lump sum or through the Fund’s accumulation or letter of intent programs, you can purchase Class A shares without an initial sales charge (load).
A Contingent Deferred Sales Charge (“CDSC”) of 1.00% may apply to Class C shares redeemed within the first 12 months after a purchase, and on Class A shares redeemed within the first 18 months after a purchase in excess of $1 million. Performance less than 1 year is cumulative. 121 | October 31, 2015 . RiverFront Dynamic Equity Income Fund Performance Update October 31, 2015 (Unaudited) 1 The MSCI ACWI (All Country World Index) is a free float-adjusted market capitalization weighted index that is designed to measure the equity market performance of developed and emerging markets. The MSCI ACWI consists of 45 country indices comprising 24 developed and 21 emerging market country indices. The index includes reinvestment of dividends, net of foreign withholding taxes. The index is not actively managed and does not reflect any deductions for fees, expenses or taxes.
An investor may not invest directly in an index. 2 The Barclays U.S. Aggregate Bond Index is a broad-based benchmark that measures the investment grade, U.S. dollar-denominated, fixed-rate taxable bond market, including Treasuries, government-related and corporate securities, MBS (agency fixed-rate and hybrid ARM passthroughs), ABS, and CMBS.
The index is not actively managed and does not reflect any deductions for fees, expenses or taxes. An investor may not invest directly in an index. ^ Fund inception date of August 2, 2010. * What You Pay reflects the Advisor's and Sub-Advisor's decision to contractually limit expenses through February 29, 2016 and Acquired Fund Fees and Expenses of 0.39%. Please see the prospectus for additional information. The table does not reflect the deduction of taxes that a shareholder would pay on Fund distributions or the redemption of Fund shares. This Fund is not suitable for all investors and is subject to investment risks, including possible loss of the principal amount invested. There is no guarantee that the Fund will continue to hold any one particular security or stay invested in any one particular company.
The composition of the Fund's top holdings is subject to change. Performance figures are historical and reflect the change in share price, reinvested distributions, changes in net asset value, sales charges and capital gains distributions, if any. Not FDIC Insured – No Bank Guarantee – May Lose Value Top Ten Holdings (as a % of Net Assets) † Portfolio Composition (as a % of Net Assets) † WisdomTree® Europe Hedged Equity Fund iShares® MSCI Japan ETF RiverFront Strategic Income Fund PowerShares® S&P 500® High Dividend Portfolio iShares® Currency Hedged MSCI Germany ETF WisdomTree® Japan Hedged Equity Fund SPDR® Barclays Short Term High Yield Bond ETF SPDR® Morgan Stanley Technology ETF Market Vectors® Oil Service ETF PowerShares® KBW Bank Portfolio Top Ten Holdings International Developed Equities - 49.44% 19.47% 7.94% 6.87% Domestic Core Equities - 36.24% Fixed Income - 10.90% Domestic Small-Cap Equities - 0.46% 6.52% Other - 0.04% Domestic MLPs - 0.02% 6.16% Cash, Cash Equivalents & Other Net Assets - 2.90% 4.24% 4.17% 3.66% 3.66% 3.34% 66.03% Holdings are subject to change, and may not reflect the current or future position of the portfolio. Table presents indicative values only.
Excludes cash & cash equivalents. 122 | October 31, 2015 . RiverFront Global Allocation Fund Performance Update October 31, 2015 (Unaudited) Performance of $10,000 Initial Investment (as of October 31, 2015) Comparison of change in value of a $10,000 investment (includes maximum sales charges of 5.50%) $17k $16k MSCI ACWI - $15,491 80% MSCI ACWI/20% Barclays U.S. Aggregate Bond - $14,811 RiverFront Global Allocation Fund Class A (NAV) - $14,109 RiverFront Global Allocation Fund Class A (MOP) - $13,335 $15k $14k $13k $12k $11k $10k $9k 10/31/15 10/31/14 10/31/13 10/31/12 10/31/11 8/2/10^ $8k The chart above represents historical performance of a hypothetical investment of $10,000 in the Fund since inception. Past performance does not guarantee future results. This chart does not reflect the deduction of taxes that a shareholder would pay on Fund distributions or the redemption of Fund shares. Average Annual Total Returns (as of October 31, 2015) Class A (NAV) Class A (MOP) Class C (NAV) Class C (CDSC) Class I MSCI All Country 1 World Index 80% MSCI ACWI and 20% Barclays U.S. Aggregate Bond1,2 6 Month â€4.91% â€10.16% â€5.30% â€6.24% â€4.77% 1 Year 1.23% â€4.31% 0.46% â€0.46% 1.49% 3 Years 8.39% 6.36% 7.59% 7.59% 8.66% 5 Years 5.95% 4.74% 5.14% 5.14% 6.18% Since Inception^ 6.78% 5.64% 5.99% 5.99% 7.02% â€4.77% â€0.03% 9.92% 7.68% 8.70% â€3.75% 0.52% 8.32% 6.90% 7.77% Total Expense Ratio What You Pay* 1.89% 1.54% 2.64% 2.29% 1.65% 1.29% Performance data quoted represents past performance.
Past performance does not guarantee future results. Investment return and principal value of an investment will fluctuate so that an investor's shares, when sold or redeemed, may be worth more or less than the original cost. Current performance data may be higher or lower than actual data quoted.
For the most current month-end performance data, please call 1-866-759-5679. Maximum Offering Price (MOP) for Class A shares includes the Fund’s maximum sales charge of 5.50%. Performance shown at NAV does not include these sales charges and would have been lower had it been taken into account. If you invest $1 million or more, either as a lump sum or through the Fund’s accumulation or letter of intent programs, you can purchase Class A shares without an initial sales charge (load).
A Contingent Deferred Sales Charge (“CDSC”) of 1.00% may apply to Class C shares redeemed within the first 12 months after a purchase, and on Class A shares redeemed within the first 18 months after a purchase in excess of $1 million. Performance less than 1 year is cumulative. 123 | October 31, 2015 . RiverFront Global Allocation Fund Performance Update October 31, 2015 (Unaudited) 1 The MSCI ACWI (All Country World Index) is a free float-adjusted market capitalization weighted index that is designed to measure the equity market performance of developed and emerging markets. The MSCI ACWI consists of 45 country indices comprising 24 developed and 21 emerging market country indices. The index includes reinvestment of dividends, net of foreign withholding taxes. The index is not actively managed and does not reflect any deductions for fees, expenses or taxes.
An investor may not invest directly in an index. 2 The Barclays U.S. Aggregate Bond Index is a broad-based benchmark that measures the investment grade, U.S. dollar-denominated, fixed-rate taxable bond market, including Treasuries, government-related and corporate securities, MBS (agency fixed-rate and hybrid ARM passthroughs), ABS, and CMBS.
The index is not actively managed and does not reflect any deductions for fees, expenses or taxes. An investor may not invest directly in an index. ^ Fund inception date of August 2, 2010. * What You Pay reflects the Advisor's and Sub-Advisor’s decision to contractually limit expenses through February 29, 2016 and Acquired Fund Fees and Expenses of 0.39%. Please see the prospectus for additional information. The table does not reflect the deduction of taxes that a shareholder would pay on Fund distributions or the redemption of Fund shares. This Fund is not suitable for all investors and is subject to investment risks, including possible loss of the principal amount invested. There is no guarantee that the Fund will continue to hold any one particular security or stay invested in any one particular company.
The composition of the Fund's top holdings is subject to change. Performance figures are historical and reflect the change in share price, reinvested distributions, changes in net asset value, sales charges and capital gains distributions, if any. Not FDIC Insured – No Bank Guarantee – May Lose Value Top Ten Holdings (as a % of Net Assets) † Portfolio Composition (as a % of Net Assets) † WisdomTree® Europe Hedged Equity Fund iShares® MSCI Japan ETF iShares® Currency Hedged MSCI Germany ETF SPDR® Morgan Stanley Technology ETF WisdomTree® Japan Hedged Equity Fund Deutsche Xâ€trackers MSCI EAFE Hedged Equity ETF Vanguard® FTSE Developed Markets ETF Market Vectors® Oil Service ETF iShares® U.S. Consumer Goods ETF Vanguard® FTSE Europe ETF Top Ten Holdings International Developed Equities - 58.48% Domestic Core Equities - 32.89% 20.87% 8.57% Fixed Income - 2.06% Domestic Small-Cap Equities - 0.47% 6.56% 5.34% International Emerging Market Equities - 0.14% Other - 0.06% 4.74% Domestic MLPs - 0.02% Cash, Cash Equivalents & Other Net Assets - 5.88% 3.64% 3.54% 3.43% 3.18% 2.89% 62.76% Holdings are subject to change, and may not reflect the current or future position of the portfolio. Table presents indicative values only.
Excludes cash & cash equivalents. 124 | October 31, 2015 . RiverFront Global Growth Fund Performance Update October 31, 2015 (Unaudited) Performance of $10,000 Initial Investment (as of October 31, 2015) Comparison of change in value of a $10,000 investment (includes maximum sales charges of 5.50%) $22k S&P 500® Total Return Index - $20,269 $20k $18k $16k MSCI ACWI - $15,026 RiverFront Global Growth Fund Class A (NAV) - $14,220 RiverFront Global Growth Fund Class A (MOP) - $13,434 $14k $12k $10k 10/31/15 10/31/14 10/31/13 10/31/12 9/27/10 10/31/11 $8k The chart above represents historical performance of a hypothetical investment of $10,000 in the Fund since inception. Past performance does not guarantee future results. This chart does not reflect the deduction of taxes that a shareholder would pay on Fund distributions or the redemption of Fund shares. Average Annual Total Returns (as of October 31, 2015) Class A (NAV) Class A (MOP) Class C (NAV) Class C (CDSC) Class I 1 Class L Investor Class MSCI All Country World Index2 S&P 500® Total Return Index3 6 Month â€5.42% â€10.63% â€5.79% â€6.73% â€5.33% 1 Year 1.34% â€4.24% 0.59% â€0.31% 1.51% 3 Years 9.38% 7.35% 8.56% 8.56% 9.62% 5 Years 6.50% 5.29% 5.73% 5.73% 6.78% Since Inception^ 10.12% 10.12% 9.31% 9.31% 10.39% â€5.34% â€5.45% â€4.77% 0.77% 1.59% 1.28% â€0.03% 5.20% 9.66% 9.36% 9.92% 16.20% 6.78% 6.52% 7.68% 14.33% 10.39% 10.10% 11.85% 14.45% Total Expense Ratio What You Pay* 1.78% 1.55% 2.53% 2.30% 1.76% 1.30% 1.42% 1.78% 1.30% 1.55% Performance data quoted represents past performance. Past performance does not guarantee future results.
Investment return and principal value of an investment will fluctuate so that an investor's shares, when sold or redeemed, may be worth more or less than the original cost. Current performance data may be higher or lower than actual data quoted. For the most current month-end performance data, please call 1-866-759-5679. Maximum Offering Price (MOP) for Class A shares includes the Fund’s maximum sales charge of 5.50%.
Performance shown at NAV does not include these sales charges and would have been lower had it been taken into account. If you invest $1 million or more, either as a lump sum or through the Fund’s accumulation or letter of intent programs, you can purchase Class A shares without an initial sales charge (load). A Contingent Deferred Sales Charge (“CDSC”) of 1.00% may apply to Class C shares redeemed within the first 12 months after a purchase, and on Class A shares redeemed within the first 18 months after a purchase in excess of $1 million. Performance less than 1 year is cumulative. 125 | October 31, 2015 .
RiverFront Global Growth Fund Performance Update October 31, 2015 (Unaudited) 1 Prior to close of business on September 24, 2010, Class L was known as Institutional Class of the Baird Funds, Inc. - RiverFront Long-Term Growth Fund. 2 The MSCI ACWI (All Country World Index) is a free float-adjusted market capitalization weighted index that is designed to measure the equity market performance of developed and emerging markets. The MSCI ACWI consists of 45 country indices comprising 24 developed and 21 emerging market country indices. The index includes reinvestment of dividends, net of foreign withholding taxes.
The index is not actively managed and does not reflect any deductions for fees, expenses or taxes. An investor may not invest directly in an index. 3 S&P 500® Total Return Index is the Standard & Poor's composite index of 500 stocks, a widely recognized, unmanaged index of common stock prices. The index is not actively managed and does not reflect any deduction for fees, expenses or taxes.Cash, Cash Equivalents invest directly in An investor may not & Other Net Assets an index. ^ Fund inception date of October 28, 2008. Other * What You Pay reflects the Advisor's and Sub-Advisor's decision to contractually limit expenses through February 29, 2016 and Acquired Fund Fees and Expenses of 0.40%.
Please see the prospectus for additional information. International Emerging Market Equities The Class A, C, I and L shares performance shown for periods prior to September 27, 2010 reflects the performance of the Baird Funds, Domestic Small-Cap Equities Inc. – RiverFront Long-Term Growth Fund’s Institutional Class shares (as result of the reorganization of the Baird Funds, Inc. – RiverFront Long-Term Growth Fund into the Fund). Domestic Core Equities The Investor Class performance shown for periods prior to September 27, 2010 reflects the performance of the Baird Funds, Inc.
– RiverFront Long-Term Growth Fund’s Investor Class shares (as result of the reorganization of the Baird Funds, Inc. – RiverFront Long-Term Growth Fund International Developed Equities into the Fund). The table does not reflect the deduction of taxes that a shareholder would pay on Fund distributions or the redemption of Fund shares. This Fund is not suitable for all investors and is subject to investment risks, including possible loss of the principal amount invested. There is no guarantee that the Fund will continue to hold any one particular security or stay invested in any one particular company. The composition of the Fund's top holdings is subject to change.
Performance figures are historical and reflect the change in share price, reinvested distributions, changes in net asset value, sales charges and capital gains distributions, if any. Not FDIC Insured – No Bank Guarantee – May Lose Value Top Ten Holdings (as a % of Net Assets) † Portfolio Composition (as a % of Net Assets) WisdomTree® Europe Hedged Equity Fund iShares® MSCI Japan ETF iShares® Currency Hedged MSCI Germany ETF Deutsche Xâ€trackers MSCI EAFE Hedged Equity ETF WisdomTree® Japan Hedged Equity Fund SPDR® Morgan Stanley Technology ETF Market Vectors® Oil Service ETF Vanguard® FTSE Developed Markets ETF Vanguard® FTSE Europe ETF PowerShares® KBW Bank Portfolio Top Ten Holdings † International Developed Equities - 64.09% 22.10% 9.80% Domestic Core Equities - 31.92% Domestic Small-Cap Equities - 0.54% 6.62% International Emerging Market Equities - 0.16% 6.10% Other - 0.08% Cash, Cash Equivalents & Other Net Assets - 3.21% 5.38% 5.36% 3.89% 3.83% 2.95% 2.76% 68.79% Holdings are subject to change, and may not reflect the current or future position of the portfolio. Table presents indicative values only. Excludes cash & cash equivalents. 126 | October 31, 2015 .
RiverFront Moderate Growth & Income Fund Performance Update October 31, 2015 (Unaudited) Performance of $10,000 Initial Investment (as of October 31, 2015) Comparison of change in value of a $10,000 investment (includes maximum sales charges of 5.50%) $22k S&P 500® Total Return Index - $20,638 $20k $18k $16k 50% S&P 500®/50% Barclays U.S. Aggregate Bond - $15,821 $14k RiverFront Moderate Growth & Income Fund Class A (NAV) - $13,777 RiverFront Moderate Growth & Income Fund Class A (MOP) - $13,022 $12k $10k 10/31/15 10/31/14 10/31/13 10/31/12 10/31/11 8/2/10^ $8k The chart above represents historical performance of a hypothetical investment of $10,000 in the Fund since inception. Past performance does not guarantee future results. This chart does not reflect the deduction of taxes that a shareholder would pay on Fund distributions or the redemption of Fund shares. Average Annual Total Returns (as of October 31, 2015) Class A (NAV) Class A (MOP) Class C (NAV) Class C (CDSC) Class I S&P 500® Total 1 Return Index 50% S&P 500® and 50% Barclays U.S. Aggregate Bond1,2 6 Month â€2.27% â€7.67% â€2.72% â€3.69% â€2.30% 1 Year 1.33% â€4.26% 0.52% â€0.42% 1.50% 3 Years 6.83% 4.83% 6.00% 6.00% 7.04% 5 Years 5.85% 4.66% 5.03% 5.03% 6.09% Since Inception^ 6.30% 5.16% 5.50% 5.50% 6.55% Total Expense Ratio What You Pay* 1.66% 1.50% 2.42% 2.25% 1.42% 1.25% 0.77% 5.20% 16.20% 14.33% 14.81% 0.48% 3.82% 8.86% 8.76% 9.14% Performance data quoted represents past performance.
Past performance does not guarantee future results. Investment return and principal value of an investment will fluctuate so that an investor's shares, when sold or redeemed, may be worth more or less than the original cost. Current performance data may be higher or lower than actual data quoted.
For the most current month-end performance data, please call 1-866-759-5679. Maximum Offering Price (MOP) for Class A shares includes the Fund’s maximum sales charge of 5.50%. Performance shown at NAV does not include these sales charges and would have been lower had it been taken into account. If you invest $1 million or more, either as a lump sum or through the Fund’s accumulation or letter of intent programs, you can purchase Class A shares without an initial sales charge (load).
A Contingent Deferred Sales Charge (“CDSC”) of 1.00% may apply to Class C shares redeemed within the first 12 months after a purchase, and on Class A shares redeemed within the first 18 months after a purchase in excess of $1 million. Performance less than 1 year is cumulative. 127 | October 31, 2015 . RiverFront Moderate Growth & Income Fund Performance Update October 31, 2015 (Unaudited) 1 S&P 500® Total Return Index is the Standard & Poor's composite index of 500 stocks, a widely recognized, unmanaged index of common stock prices. The index is not actively managed and does not reflect any deduction for fees, expenses or taxes. An investor may not invest directly in an index. 2 The Barclays U.S. Aggregate Bond Index is a broad-based benchmark that measures the investment grade, U.S.
dollar-denominated, fixed-rate taxable bond market, including Treasuries, government-related and corporate securities, MBS (agency fixed-rate and hybrid ARM passthroughs), ABS, and CMBS. The index is not actively managed and does not reflect any deductions for fees, expenses or taxes. An investor may not invest directly in an index. ^ Fund inception date of August 2, 2010. * What You Pay reflects the Advisor's and Sub-Advisor’s decision to contractually limit expenses through February 29, 2016 and Acquired Fund Fees and Expenses of 0.35%.
Please see the prospectus for additional information. The table does not reflect the deduction of taxes that a shareholder would pay on Fund distributions or the redemption of Fund shares. This Fund is not suitable for all investors and is subject to investment risks, including possible loss of the principal amount invested. There is no guarantee that the Fund will continue to hold any one particular security or stay invested in any one particular company. The composition of the Fund's top holdings is subject to change. Performance figures are historical and reflect the change in share price, reinvested distributions, changes in net asset value, sales charges and capital gains distributions, if any. Not FDIC Insured – No Bank Guarantee – May Lose Value Top Ten Holdings (as a % of Net Assets) † Portfolio Composition (as a % of Net Assets) † WisdomTree® Europe Hedged Equity Fund RiverFront Strategic Income Fund iShares® MSCI Japan ETF PowerShares® Europe Currency Hedged Low Volatility Portfolio PIMCO Enhanced Short Maturity Active ETF Market Vectors® Oil Service ETF SPDR® Morgan Stanley Technology ETF iShares® Core S&P 500® ETF PIMCO 0â€5 Year High Yield Corporate Bond Index ETF Consumer Staples Select Sector SPDR® Fund Top Ten Holdings 11.86% 9.79% 6.09% Fixed Income - 35.23% Domestic Core Equities - 31.08% International Developed Equities - 30.63% Domestic Small-Cap Equities - 0.42% 3.63% Domestic MLPs - 0.02% Other - 0.02% 3.63% 3.58% 3.48% 3.40% Cash, Cash Equivalents & Other Net Assets - 2.60% 3.16% 3.12% 51.74% Holdings are subject to change, and may not reflect the current or future position of the portfolio.
Table presents indicative values only. Excludes cash & cash equivalents. 128 | October 31, 2015 . RiverFront Conservative Income Builder Fund Statement of Investments October 31, 2015 Value (Note 2) Shares Equity (continued) WisdomTree® Japan Hedged Equity Fund 5,458 $ 290,857 WisdomTree® Japan SmallCap Dividend Fund 1,633 91,546 WisdomTree® LargeCap Dividend Fund 8,318 603,720 4,743,902 EXCHANGE TRADED FUNDS (97.37%) Debt (57.23%) Guggenheim BulletShares 2016 Corporate Bond ETF 45,121 Guggenheim BulletShares 2017 44,118 Corporate Bond ETF Guggenheim BulletShares 2018 Corporate Bond ETF 47,381 iShares® 0â€5 Year High Yield Corporate Bond ETF 5,930 iShares® 1â€3 Year Treasury Bond ETF 3,384 iShares® Barclays 1â€3 Year Credit Bond ETF 4,854 PIMCO 0â€5 Year High Yield 3,629 Corporate Bond Index ETF PIMCO Enhanced Short Maturity Active ETF 3,967 (a) RiverFront Strategic Income Fund 47,086 SPDR® Barclays Short Term Corporate Bond ETF 12,466 SPDR® Barclays Short Term High Yield Bond ETF 14,223 Equity (40.14%) Consumer Staples Select Sector 2,415 SPDR® Fund Deutsche Xâ€trackers MSCI EAFE Hedged Equity ETF 11,566 iShares® Core S&P 500® ETF 2,681 iShares® Currency Hedged MSCI Germany ETF 8,936 iShares® Currency Hedged MSCI (b) 7,567 Italy ETF iShares® MSCI Japan ETF 47,472 iShares® U.S. Consumer Goods ETF 1,514 Market Vectors® Oil Service ETF 3,113 PowerShares® Aerospace & Defense Portfolio 2,360 PowerShares® Europe Currency Hedged Low Volatility Portfolio 6,800 PowerShares® KBW Bank Portfolio 3,910 PowerShares® S&P 500® Exâ€Rate Sensitive Low Volatility 4,762 Portfolio PowerShares® S&P 500® High Dividend Portfolio 3,454 SPDR® Morgan Stanley Technology ETF 2,309 WisdomTree® Europe Hedged Equity Fund 12,122 $ 1,000,784 1,003,243 1,004,477 276,694 287,065 510,932 351,686 400,191 1,160,199 381,085 388,288 6,764,644 120,460 322,460 560,463 Value (Note 2) Shares TOTAL EXCHANGE TRADED FUNDS (Cost $11,417,697) 11,508,546 7-Day Value Yield Shares (Note 2) SHORT TERM INVESTMENTS (6.80%) Money Market Fund (6.80%) Morgan Stanley Institutional Liquidity Fund †Prime Portfolio 0.097% 804,170 TOTAL SHORT TERM INVESTMENTS (Cost $804,170) TOTAL INVESTMENTS (104.17%) (Cost $12,221,867) Liabilities In Excess Of Other Assets (â€4.17%) NET ASSETS (100.00%) 804,170 804,170 $ 12,312,716 (492,624) $ 11,820,092 225,009 182,092 584,855 165,798 95,164 84,370 171,428 146,430 120,957 114,846 126,672 (a) (b) Affiliated Company. See Note 7 in Notes to Financial Statements. Non-Income Producing Security. Common Abbreviations: EAFE - Europe, Australia, and Far East. ETF - Exchange Traded Fund. KBW- Keefe, Bruyette, & Woods. MSCI - Morgan Stanley Capital International. PIMCO - Pacific Investment Management Company. S&P - Standard and Poor's. SPDR - Standard and Poor's Depositary Receipt. For Fund compliance purposes, the Fund's industry classifications refer to any one or more of the industry sub-classifications used by one or more widely recognized market indexes or ratings group indexes, and/or as defined by Fund management. This definition may not apply for purposes of this report, which may combine industry sub-classifications for reporting ease.
Industries are shown as a percent of net assets. See Notes to Financial Statements. 736,775 129 | October 31, 2015 . RiverFront Dynamic Equity Income Fund Statement of Investments October 31, 2015 Value (Note 2) Shares COMMON STOCKS (4.68%) Consumer, Cyclical (0.78%) Retail (0.78%) Costco Wholesale Corp. 3,796 TOTAL CONSUMER, CYCLICAL Consumer, Nonâ€Cyclical (2.31%) Beverages (0.50%) PepsiCo, Inc. 3,742 Pharmaceuticals (1.81%) Bristolâ€Myers Squibb Co. 11,907 Pfizer, Inc. 18,223 TOTAL CONSUMER, NONâ€CYCLICAL Industrial (1.10%) Machinery, Construction & Mining (0.50%) Caterpillar, Inc. 5,365 Miscellaneous Manufacturers (0.60%) 3M Co. 2,944 TOTAL INDUSTRIAL Technology (0.49%) Software (0.49%) Paychex, Inc. 7,418 TOTAL TECHNOLOGY TOTAL COMMON STOCKS (Cost $3,373,821) $ 600,224 600,224 382,395 785,266 616,302 1,401,568 1,783,963 391,592 462,826 854,418 382,620 382,620 3,621,225 EXCHANGE TRADED FUNDS (92.51%) Debt (11.05%) RiverFront Strategic Income (a) 215,714 5,315,193 Fund SPDR® Barclays Short Term High Yield Bond ETF 118,235 3,227,815 8,543,008 Equity (81.46%) Consumer Staples Select Sector SPDR® Fund 49,964 2,492,204 Deutsche Xâ€trackers MSCI EAFE Hedged Equity ETF 80,974 2,257,555 Global X FTSE Nordic Region ETF 14,623 325,069 iShares® Core S&P 500® ETF 10,764 2,250,214 Value (Note 2) Shares Equity (continued) iShares® Currency Hedged MSCI Germany ETF iShares® Currency Hedged MSCI Italy ETF(b) iShares® MSCI Japan ETF iShares® MSCI United Kingdom ETF iShares® U.S. Home Construction ETF Market Vectors® Oil Service ETF PowerShares® Aerospace & Defense Portfolio PowerShares® Europe Currency Hedged Low Volatility Portfolio PowerShares® KBW Bank Portfolio PowerShares® S&P 500® Ex†Rate Sensitive Low Volatility Portfolio PowerShares® S&P 500® High Dividend Portfolio SPDR® Morgan Stanley Technology ETF Vanguard® FTSE Europe ETF Vanguard® Information Technology ETF Vanguard® Telecommunication Services ETF WisdomTree® Europe Hedged Equity Fund WisdomTree® Japan Hedged Equity Fund WisdomTree® Japan SmallCap Dividend Fund WisdomTree® LargeCap Dividend Fund TOTAL EXCHANGE TRADED FUNDS (Cost $69,870,044) 130 | October 31, 2015 188,991 $ 4,758,793 48,243 497,997 1,160,920 6,135,323 53,784 939,606 28,614 92,605 778,015 2,830,935 22,076 789,217 68,209 1,719,549 69,039 2,585,511 58,994 1,498,477 151,724 5,044,823 51,617 42,681 2,831,709 2,222,826 3,716 410,469 16,020 1,372,433 247,643 15,051,742 61,495 3,277,069 13,408 751,653 20,584 1,493,987 62,978,099 71,521,107 . RiverFront Dynamic Equity Income Fund Statement of Investments October 31, 2015 7-Day Yield Value (Note 2) Shares SHORT TERM INVESTMENTS (2.51%) Money Market Fund (2.51%) Morgan Stanley Institutional Liquidity Fund †Prime Portfolio 0.097% 1,939,710 $ TOTAL SHORT TERM INVESTMENTS (Cost $1,939,710) TOTAL INVESTMENTS (99.70%) (Cost $75,183,575) Other Assets In Excess Of Liabilities (0.30%) NET ASSETS (100.00%) 1,939,710 1,939,710 $ 77,082,042 233,478 $ 77,315,520 Common Abbreviations: EAFE - Europe, Australia, and Far East. ETF - Exchange Traded Fund. FTSE - Financial Times and the London Stock Exchange. KBW- Keefe, Bruyette, & Woods. MSCI - Morgan Stanley Capital International. S&P - Standard and Poor's. SPDR - Standard and Poor's Depositary Receipt. For Fund compliance purposes, the Fund's industry classifications refer to any one or more of the industry sub-classifications used by one or more widely recognized market indexes or ratings group indexes, and/or as defined by Fund management. This definition may not apply for purposes of this report, which may combine industry sub-classifications for reporting ease. Industries are shown as a percent of net assets. See Notes to Financial Statements. (a) (b) Affiliated Company. See Note 7 in Notes to Financial Statements. Non-Income Producing Security. 131 | October 31, 2015 .
RiverFront Global Allocation Fund Statement of Investments October 31, 2015 Value (Note 2) Shares COMMON STOCKS (4.67%) Consumer, Cyclical (0.79%) Retail (0.79%) Costco Wholesale Corp. 2,214 TOTAL CONSUMER, CYCLICAL Consumer, Nonâ€Cyclical (2.27%) Beverages (0.50%) PepsiCo, Inc. 2,160 Pharmaceuticals (1.77%) Bristolâ€Myers Squibb Co. 6,520 Pfizer, Inc. 10,520 TOTAL CONSUMER, NONâ€CYCLICAL Industrial (1.11%) Machinery, Construction & Mining (0.51%) Caterpillar, Inc. 3,092 Miscellaneous Manufacturers (0.60%) 3M Co. 1,685 TOTAL INDUSTRIAL Technology (0.50%) Software (0.50%) Paychex, Inc. 4,255 TOTAL TECHNOLOGY TOTAL COMMON STOCKS (Cost $1,941,181) $ 350,077 350,077 220,730 429,994 355,787 785,781 1,006,511 225,685 264,899 490,584 219,473 219,473 2,066,645 EXCHANGE TRADED FUNDS (92.95%) Debt (2.19%) RiverFront Strategic Income (a) 39,386 Fund Equity (90.76%) Deutsche Xâ€trackers MSCI EAFE Hedged Equity ETF 57,838 Financial Select Sector SPDR® Fund 43,321 First Trust NYSE Arca Biotechnology Index Fund 5,088 Global X FTSE Nordic Region ETF 8,511 iShares® Core S&P 500® ETF 5,485 iShares® Currency Hedged MSCI Germany ETF 115,372 970,471 1,612,523 TOTAL EXCHANGE TRADED FUNDS (Cost $39,830,443) 530,780 189,200 1,146,639 Equity (continued) iShares® Currency Hedged MSCI Italy ETF(b) 27,659 $ 665,586 iShares® MSCI EAFE ETF 9,210 562,823 iShares® MSCI Japan ETF 308,144 3,796,334 iShares® MSCI Switzerland Capped ETF 13,475 428,101 iShares® MSCI United Kingdom 71,223 1,244,266 ETF iShares® U.S. Consumer Goods ETF 12,860 1,408,299 iShares® U.S. Home Construction ETF 33,893 921,551 Market Vectors® Oil Service ETF 49,671 1,518,442 PowerShares® Aerospace & Defense Portfolio 11,200 400,400 PowerShares® Europe Currency Hedged Low Volatility 46,738 1,178,265 Portfolio PowerShares® KBW Bank Portfolio 24,750 926,887 PowerShares® S&P 500® Ex†Rate Sensitive Low Volatility Portfolio 34,121 866,690 SPDR® Morgan Stanley Technology ETF 43,102 2,364,576 Vanguard® FTSE Developed 41,156 1,565,574 Markets ETF 24,548 1,278,460 Vanguard® FTSE Europe ETF Vanguard® Telecommunication Services ETF 7,483 641,069 WisdomTree® Europe Hedged Equity Fund 152,080 9,243,422 WisdomTree® Japan Hedged Equity Fund 39,422 2,100,798 WisdomTree® Japan SmallCap Dividend Fund 7,711 432,279 WisdomTree® LargeCap Dividend Fund 16,789 1,218,546 40,189,747 1,043,170 Value (Note 2) Shares 2,905,067 132 | October 31, 2015 41,160,218 . RiverFront Global Allocation Fund Statement of Investments October 31, 2015 7-Day Yield Value (Note 2) Shares SHORT TERM INVESTMENTS (5.48%) Money Market Fund (5.48%) Morgan Stanley Institutional Liquidity Fund †Prime Portfolio 0.097% 2,428,247 $ TOTAL SHORT TERM INVESTMENTS (Cost $2,428,247) TOTAL INVESTMENTS (103.10%) (Cost $44,199,871) Liabilities In Excess Of Other Assets (â€3.10%) NET ASSETS (100.00%) 2,428,247 2,428,247 $ 45,655,110 (1,371,141) $ 44,283,969 Common Abbreviations: EAFE - Europe, Australia, and Far East. ETF - Exchange Traded Fund. FTSE - Financial Times and the London Stock Exchange. KBW- Keefe, Bruyette, & Woods. MSCI - Morgan Stanley Capital International. NYSE - New York Stock Exchange S&P - Standard and Poor's. SPDR - Standard and Poor's Depositary Receipt. For Fund compliance purposes, the Fund's industry classifications refer to any one or more of the industry sub-classifications used by one or more widely recognized market indexes or ratings group indexes, and/or as defined by Fund management. This definition may not apply for purposes of this report, which may combine industry sub-classifications for reporting ease. Industries are shown as a percent of net assets. See Notes to Financial Statements. (a) (b) Affiliated Company. See Note 7 in Notes to Financial Statements. Non-Income Producing Security. 133 | October 31, 2015 .
RiverFront Global Growth Fund Statement of Investments October 31, 2015 Value (Note 2) Shares COMMON STOCKS (4.81%) Consumer, Cyclical (0.80%) Retail (0.80%) Costco Wholesale Corp. 4,085 TOTAL CONSUMER, CYCLICAL Consumer, Nonâ€Cyclical (2.40%) Beverages (0.50%) PepsiCo, Inc. 3,948 Pharmaceuticals (1.90%) Bristolâ€Myers Squibb Co. 13,245 Pfizer, Inc. 19,440 TOTAL CONSUMER, NONâ€CYCLICAL Industrial (1.11%) Machinery, Construction & Mining (0.51%) Caterpillar, Inc. 5,661 Miscellaneous Manufacturers (0.60%) 3M Co. 3,089 TOTAL INDUSTRIAL Technology (0.50%) Software (0.50%) Paychex, Inc. 7,781 TOTAL TECHNOLOGY TOTAL COMMON STOCKS (Cost $3,600,785) $ 645,920 645,920 403,446 873,508 657,461 1,530,969 1,934,415 413,196 485,622 898,818 401,344 401,344 3,880,497 EXCHANGE TRADED FUNDS (92.61%) Equity (92.61%) Consumer Staples Select Sector SPDR® Fund 11,833 Deutsche Xâ€trackers MSCI EAFE Hedged Equity ETF 176,432 Financial Select Sector SPDR® Fund 62,736 First Trust NYSE Arca Biotechnology Index Fund 10,635 Global X FTSE Nordic Region ETF 15,827 iShares® Core S&P 500® ETF 5,841 iShares® Currency Hedged MSCI 212,207 Germany ETF iShares® Currency Hedged MSCI (a) 51,066 Italy ETF 590,230 Value (Note 2) Shares Equity (continued) iShares® MSCI Japan ETF iShares® MSCI Pacific ex Japan ETF iShares® MSCI United Kingdom ETF iShares® U.S. Consumer Goods ETF iShares® U.S. Home Construction ETF Market Vectors® Oil Service ETF PowerShares® Aerospace & Defense Portfolio PowerShares® Europe Currency Hedged Low Volatility Portfolio PowerShares® KBW Bank Portfolio PowerShares® S&P 500® Ex†Rate Sensitive Low Volatility Portfolio SPDR® Morgan Stanley Technology ETF Vanguard® FTSE Developed Markets ETF Vanguard® FTSE Europe ETF Vanguard® Information Technology ETF Vanguard® Telecommunication Services ETF WisdomTree® Europe Hedged Equity Fund WisdomTree® Japan Hedged Equity Fund WisdomTree® Japan SmallCap Dividend Fund TOTAL EXCHANGE TRADED FUNDS (Cost $70,831,203) 4,918,924 1,510,683 1,109,443 351,834 1,221,061 5,343,372 1,228,852 134 | October 31, 2015 641,759 $ 7,906,471 16,868 659,033 102,410 1,789,103 13,993 1,532,373 66,416 102,627 1,805,851 3,137,307 27,747 991,955 79,280 1,998,649 59,362 2,223,107 63,678 1,617,453 78,872 4,326,918 81,212 45,688 3,089,305 2,379,431 6,387 705,508 15,350 1,315,035 293,310 17,827,382 81,492 4,342,709 13,951 782,093 74,704,082 74,704,082 . RiverFront Global Growth Fund Statement of Investments October 31, 2015 7-Day Yield Value (Note 2) Shares SHORT TERM INVESTMENTS (2.84%) Money Market Fund (2.84%) Morgan Stanley Institutional Liquidity Fund †Prime Portfolio 0.097% 2,288,635 $ TOTAL SHORT TERM INVESTMENTS (Cost $2,288,635) TOTAL INVESTMENTS (100.26%) (Cost $76,720,623) Liabilities In Excess Of Other Assets (â€0.26%) NET ASSETS (100.00%) 2,288,635 2,288,635 $ 80,873,214 (212,330) $ 80,660,884 Common Abbreviations: EAFE - Europe, Australia, and Far East. ETF - Exchange Traded Fund. FTSE - Financial Times and the London Stock Exchange. KBW- Keefe, Bruyette, & Woods. MSCI - Morgan Stanley Capital International. NYSE - New York Stock Exchange. S&P - Standard and Poor's. SPDR - Standard and Poor's Depositary Receipt. For Fund compliance purposes, the Fund's industry classifications refer to any one or more of the industry sub-classifications used by one or more widely recognized market indexes or ratings group indexes, and/or as defined by Fund management. This definition may not apply for purposes of this report, which may combine industry sub-classifications for reporting ease. Industries are shown as a percent of net assets. See Notes to Financial Statements. (a) Non-Income Producing Security. 135 | October 31, 2015 .
RiverFront Moderate Growth & Income Fund Statement of Investments October 31, 2015 Value (Note 2) Shares Shares COMMON STOCKS (4.56%) Consumer, Cyclical (0.77%) Retail (0.77%) Costco Wholesale Corp. 6,893 TOTAL CONSUMER, CYCLICAL Consumer, Nonâ€Cyclical (2.18%) Beverages (0.50%) PepsiCo, Inc. 6,904 Pharmaceuticals (1.68%) Bristolâ€Myers Squibb Co. 21,053 Pfizer, Inc. 29,420 TOTAL CONSUMER, NONâ€CYCLICAL Industrial (1.11%) Machinery, Construction & Mining (0.51%) Caterpillar, Inc. 9,899 Miscellaneous Manufacturers (0.60%) 3M Co. 5,427 TOTAL INDUSTRIAL Technology (0.50%) Software (0.50%) Paychex, Inc. 13,672 TOTAL TECHNOLOGY TOTAL COMMON STOCKS (Cost $5,987,068) $ 1,089,921 1,089,921 705,520 1,388,445 994,984 2,383,429 3,088,949 722,528 853,179 1,575,707 705,202 705,202 6,459,779 EXCHANGE TRADED FUNDS (92.83%) Debt (35.15%) Guggenheim BulletShares 2016 Corporate Bond ETF 165,990 Guggenheim BulletShares 2017 Corporate Bond ETF 162,267 Guggenheim BulletShares 2018 Corporate Bond ETF 174,054 iShares® 0â€5 Year High Yield Corporate Bond ETF 76,041 iShares® 1â€3 Year Treasury Bond ETF 48,562 iShares® Barclays 1â€3 Year 10,832 Credit Bond ETF PIMCO 0â€5 Year High Yield Corporate Bond Index ETF 46,181 3,681,658 3,689,952 3,689,945 3,548,073 Debt (continued) PIMCO Enhanced Short Maturity Active ETF RiverFront Strategic Income Fund(a) SPDR® Barclays Short Term Corporate Bond ETF SPDR® Barclays Short Term High Yield Bond ETF Equity (57.68%) Consumer Staples Select Sector SPDR® Fund Deutsche Xâ€trackers MSCI EAFE Hedged Equity ETF iShares® Core S&P 500® ETF iShares® Currency Hedged MSCI Germany ETF iShares® Currency Hedged MSCI Italy ETF(b) iShares® MSCI Japan ETF iShares® U.S. Home Construction ETF Market Vectors® Oil Service ETF PowerShares® Aerospace & Defense Portfolio PowerShares® Europe Currency Hedged Low Volatility Portfolio PowerShares® KBW Bank Portfolio PowerShares® S&P 500® Ex†Rate Sensitive Low Volatility Portfolio PowerShares® S&P 500® High Dividend Portfolio SPDR® Morgan Stanley Technology ETF Vanguard® Telecommunication Services ETF WisdomTree® Europe Hedged Equity Fund WisdomTree® Japan Hedged Equity Fund WisdomTree® Japan SmallCap Dividend Fund 4,119,514 1,140,176 4,475,401 136 | October 31, 2015 Value (Note 2) 50,887 $ 5,133,481 562,358 13,856,501 78,678 2,405,186 146,509 3,999,696 49,739,583 88,626 4,420,665 123,129 22,988 3,432,837 4,805,641 106,845 2,690,357 88,989 699,557 2,141,431 8,618,542 42,893 165,641 1,166,261 5,063,645 33,013 1,180,215 203,650 5,134,017 105,140 3,937,493 98,210 2,494,583 112,629 3,744,914 89,784 4,925,550 27,607 2,365,092 276,109 16,781,905 73,610 3,922,677 18,717 1,049,275 . RiverFront Moderate Growth & Income Fund Statement of Investments October 31, 2015 Value (Note 2) Shares Equity (continued) WisdomTree® LargeCap Dividend Fund 51,773 $ 3,757,684 81,632,784 TOTAL EXCHANGE TRADED FUNDS (Cost $128,809,380) 131,372,367 7-Day Value Yield Shares (Note 2) SHORT TERM INVESTMENTS (2.81%) Money Market Fund (2.81%) Morgan Stanley Institutional Liquidity Fund †Prime Portfolio 0.097% 3,970,144 TOTAL SHORT TERM INVESTMENTS (Cost $3,970,144) TOTAL INVESTMENTS (100.20%) (Cost $138,766,592) Liabilities In Excess Of Other Assets (â€0.20%) NET ASSETS (100.00%) Common Abbreviations: EAFE - Europe, Australia, and Far East. ETF - Exchange Traded Fund. KBW- Keefe, Bruyette, & Woods. MSCI - Morgan Stanley Capital International. PIMCO - Pacific Investment Management Company. S&P - Standard and Poor's. SPDR - Standard and Poor's Depositary Receipt. For Fund compliance purposes, the Fund's industry classifications refer to any one or more of the industry sub-classifications used by one or more widely recognized market indexes or ratings group indexes, and/or as defined by Fund management. This definition may not apply for purposes of this report, which may combine industry sub-classifications for reporting ease. Industries are shown as a percent of net assets. 3,970,144 See Notes to Financial Statements.
3,970,144 $ 141,802,290 (279,056) $ 141,523,234 (a) (b) Affiliated Company. See Note 7 in Notes to Financial Statements. Non-Income Producing Security. 137 | October 31, 2015 . RiverFront Global Allocation Series Statements of Assets and Liabilities October 31, 2015 RiverFront Conservative Income Builder Fund ASSETS Investments, at value Investments in affiliates, at value Receivable for shares sold Dividends and interest receivable Prepaid expenses and other assets Total Assets RiverFront Dynamic Equity Income Fund RiverFront Global Allocation Fund $ 11,152,517 $ 71,766,849 $ 44,684,639 1,160,199 5,315,193 970,471 – 288,823 122,618 59 10,409 5,570 25,705 27,741 25,608 12,338,480 77,409,015 45,808,906 RiverFront Moderate Growth & Income Fund RiverFront Global Growth Fund $ 80,873,214 $ 127,945,789 – 13,856,501 45,577 79,679 11,448 19,005 39,650 36,206 80,969,889 141,937,180 LIABILITIES Payable for investments purchased Payable for shares redeemed Investment advisory fees payable Administration and transfer agency fees payable Distribution and services fees payable Professional fees payable Custody fees payable Printing fees payable Accrued expenses and other liabilities Total Liabilities NET ASSETS NET ASSETS CONSIST OF Paidâ€in capital Accumulated net investment income Accumulated net realized gain/(loss) on investments Net unrealized appreciation in value on investments NET ASSETS INVESTMENTS, AT COST INVESTMENTS IN AFFILIATES, AT COST 503,873 – 364 1,946 6,701 3,503 781 358 862 518,388 $ 11,820,092 $ – 50 40,444 8,813 32,512 4,007 1,096 3,693 2,880 93,495 77,315,520 $ 1,462,516 11,788 20,040 5,553 15,881 3,744 930 2,158 2,327 1,524,937 44,283,969 – 235,524 35,367 9,571 15,995 4,049 995 4,153 3,351 309,005 $ 80,660,884 $ – 235,169 82,949 15,214 63,728 4,605 1,419 6,652 4,210 413,946 141,523,234 $ 11,741,051 $ 73,728,146 $ 42,468,604 $ 75,330,241 $ 135,145,049 7,336 92,674 200,285 463,691 206,858 (19,144) 1,596,233 159,841 714,361 3,135,629 90,849 1,898,467 1,455,239 4,152,591 3,035,698 $ 11,820,092 $ 77,315,520 $ 44,283,969 $ 80,660,884 $ 141,523,234 $ 11,049,593 $ 69,776,840 $ 43,218,055 $ 76,720,623 $ 124,648,429 $ 1,172,274 $ 5,406,735 $ 981,816 $ – $ 14,118,163 See Notes to Financial Statements. 138 | October 31, 2015 . RiverFront Global Allocation Series Statements of Assets and Liabilities (continued) RiverFront Conservative Income Builder Fund October 31, 2015 RiverFront Dynamic Equity Income Fund RiverFront Global Allocation Fund RiverFront Moderate Growth & Income Fund RiverFront Global Growth Fund PRICING OF SHARES Class A: Net Asset Value, offering and redemption price per share Net Assets Shares of beneficial interest outstanding (unlimited number of shares, no par value common stock authorized) Maximum offering price per share ((NAV/0.9450), based on maximum sales charge of 5.50% of the offering price) Class C: Net Asset Value, offering and redemption price per share(a) Net Assets Shares of beneficial interest outstanding (unlimited number of shares, no par value common stock authorized) Class I: Net Asset Value, offering and redemption price per share Net Assets Shares of beneficial interest outstanding (unlimited number of shares, no par value common stock authorized) Class L: Net Asset Value, offering and redemption price per share Net Assets Shares of beneficial interest outstanding (unlimited number of shares, no par value common stock authorized) Investor Class: Net Asset Value, offering and redemption price per share Net Assets Shares of beneficial interest outstanding (unlimited number of shares, no par value common stock authorized) $ $ $ $ $ (a) 99,265 11.07 $ 1,565,429 $ $ 693,306 13.37 $ 12.91 $ 10.37 $ 12.44 $ 11.98 8,610,383 $ 34,766,471 $ 17,089,385 830,464 2,795,628 1,312,776 2,126,560 14.76 $ 12.15 13.67 $ 11.39 $ $ 12,907,768 $ 70,770,665 1,426,451 944,172 6,212,065 10.30 $ 12.56 $ 11.99 $ 14.03 $ 11.47 2,171,225 $ 22,780,107 $ 18,738,956 $ 16,411,902 $ 46,350,137 210,881 1,813,902 N/A N/A N/A N/A N/A N/A N/A 1,169,862 N/A N/A $ N/A $ 13.87 6,924,249 N/A N/A 1,863,673 N/A N/A 4,039,603 N/A $ 14.01 N/A $ 26,108,513 N/A N/A 1,562,833 12.20 $ 13.95 $ 11.48 8,455,628 $ 18,308,452 $ 24,402,432 10.46 $ 12.63 $ 1,038,484 $ 19,768,942 $ N/A N/A N/A N/A N/A 499,084 N/A Redemption price per share may be reduced for any applicable contingent deferred sales charge. For a description of a possible sales charge, please see the Fund's Prospectus. See Notes to Financial Statements. 139 | October 31, 2015 . RiverFront Global Allocation Series Statements of Operations For the Year Ended October 31, 2015 RiverFront Conservative Income Builder Fund INVESTMENT INCOME Dividends Dividends from affiliated securities Total Investment Income $ (10,923) (47,971) (20,408) – – 134,508 108,661 (49,727) 337,579 42,328 3,731 21,782 158,029 – 18,409 6,944 42,208 437 5,083 880 11,933 649,343 617,344 75,739 5,826 (24,491) (44,563) (43,041) – – 537,248 575,330 (79,726) (40,534) (29,002) (36,381) (60,547) (17,309) 894,807 1,290,107 109,174 2,184,914 $ – 2,184,914 3,812,380 495,767 4,308,147 669,233 82,236 5,201 1,196,494 145,269 8,804 67,008 685,345 – 23,676 20,549 48,019 1,642 8,387 3,096 20,710 2,228,999 (39,744) (102,129) (67,897) – – 2,019,229 2,288,918 2,496,740 45,519 326,033 – 19,945 12,447 45,023 844 5,858 1,602 14,278 1,170,458 (36,445) (65,254) (43,549) – – 1,025,210 1,229,120 1,166,295 (7,360) (30,319) (33,482) – (38,996) 42,226 506,364 277,874 640,999 678,016 (58,335) (2,136,654) (750,472) (1,412,507) (4,017,171) (73,196) (585,806) (881,411) 734,806 $ (10,476) $ 627,773 $ 1,407,507 NET REALIZED AND UNREALIZED LOSS ON INVESTMENTS NET INCREASE/(DECREASE) IN NET ASSETS RESULTING FROM OPERATIONS 2,997 52,835 – 17,007 1,634 41,255 109 4,154 195 8,062 213,810 $ 74,304 10,247 1,011 1,061,571 51,007 1,112,578 RiverFront Moderate Growth & Income Fund RiverFront Global Growth Fund 2,072,430 $ 181,900 2,254,330 Investment advisory fees Administrative fees Transfer agency fees Distribution and service fees Class A Class C Investor Class Professional fees Reports to shareholders and printing fees State registration fees Insurance fees Custody fees Trustees' fees and expenses Miscellaneous expenses Total Expenses Less fees waived/reimbursed by investment advisor (Note 8) Class A Class C Class I Class L Investor Class Net Expenses Net Investment Income Net realized gain/(loss) on investments Net realized loss on investments †affiliated securities Net realized gain distributions from other investment companies Net change in unrealized depreciation on investments RiverFront Global Allocation Fund 210,970 $ 32,199 243,169 EXPENSES RiverFront Dynamic Equity Income Fund $ 35,465 $ (494,314) See Notes to Financial Statements. 140 | October 31, 2015 43,481 123,978 18,749 25,222 15,433 66,938 893 6,397 1,730 19,089 1,078,580 (662,334) . RiverFront Conservative Income Builder Fund Statements of Changes in Net Assets For the Fiscal Period Ended October 31, 2014(a) For the Year Ended October 31, 2015 For the Year Ended April 30, 2014 OPERATIONS Net investment income Net realized gain/(loss) on investments Net realized loss on investments †affiliated securities Net realized gain distributions from other investment companies Net change in unrealized appreciation/(depreciation) on investments Net Increase in Net Assets Resulting from Operations $ 108,661 $ (49,727) (7,360) 42,226 (58,335) 35,465 29,975 $ 110,437 (42) – (67,675) 72,695 44,780 173,828 (270) 1,636 107,775 327,749 DISTRIBUTIONS Dividends to shareholders from net investment income Class A Class C Class I Dividends to shareholders from net realized gains Class A Class C Class I Net Decrease in Net Assets from Distributions (18,043) (50,246) (34,644) (33,682) (128,451) (53,269) (318,335) (7,517) (14,233) (13,957) – – – (35,707) (7,713) (26,587) (11,868) (16,067) (47,172) (27,911) (137,318) BENEFICIAL INTEREST TRANSACTIONS (NOTE 6) Shares sold Class A Class C Class I Dividends reinvested Class A Class C Class I Shares redeemed Class A Class C Class I Net Increase in Net Assets Derived from Beneficial Interest Transactions Net increase in net assets NET ASSETS Beginning of year End of year * *Including accumulated net investment income of: (a) $ $ 724,894 5,025,196 1,756,806 23,644 152,720 77,128 (750,894) (1,445,157) (2,401,248) 3,163,089 2,880,219 8,939,873 11,820,092 $ 7,336 $ 224,208 546,840 1,216,347 2,524,709 1,817,467 1,927,846 3,697 8,715 12,819 68,221 13,270 39,779 (244,851) (92,120) (336,045) (825,324) (392,394) (1,387,092) 2,314,518 2,811,574 2,351,506 3,002,005 6,588,367 3,586,362 8,939,873 $ 6,588,367 1,621 $ 7,353 Effective May 1, 2014, the Board approved changing the fiscal year-end of the Funds from April 30 to October 31. See Notes to Financial Statements. 141 | October 31, 2015 . RiverFront Dynamic Equity Income Fund Statements of Changes in Net Assets For the Fiscal Period Ended October 31, 2014(a) For the Year Ended October 31, 2015 For the Year Ended April 30, 2014 OPERATIONS Net investment income Net realized gain on investments Net realized loss on investments †affiliated securities Net realized gain distributions from other investment companies Net change in unrealized appreciation/(depreciation) on investments Net Increase in Net Assets Resulting from Operations $ 1,229,120 $ 1,166,295 (30,319) 506,364 (2,136,654) 734,806 354,835 $ 495,747 (2,968) – 59,792 907,406 501,040 2,992,680 – 14,904 1,272,714 4,781,338 DISTRIBUTIONS Dividends to shareholders from net investment income Class A Class C Class I Dividends to shareholders from net realized gains Class A Class C Class I Net Decrease in Net Assets from Distributions (311,063) (447,108) (392,630) (621,663) (1,102,933) (746,196) (3,621,593) (111,022) (86,202) (158,721) – – – (355,945) (135,855) (134,304) (236,905) (365,030) (742,929) (549,797) (2,164,820) 3,938,297 7,076,964 3,502,112 102,697 79,328 138,648 (2,263,648) (3,022,626) (1,075,996) 8,475,776 9,027,237 59,414,303 68,441,540 $ 14,068 $ 7,646,945 10,756,383 9,923,982 464,335 824,340 679,588 (1,433,618) (3,025,374) (3,656,006) 22,180,575 24,797,093 34,617,210 59,414,303 15,178 BENEFICIAL INTEREST TRANSACTIONS (NOTE 6) Shares sold Class A Class C Class I Dividends reinvested Class A Class C Class I Shares redeemed Class A Class C Class I Net Increase in Net Assets Derived from Beneficial Interest Transactions Net increase in net assets NET ASSETS Beginning of year End of year * *Including accumulated net investment income of: (a) 6,311,410 11,151,002 8,108,354 877,483 1,445,580 1,008,028 (3,907,536) (6,667,665) (6,565,889) 11,760,767 8,873,980 68,441,540 $ 77,315,520 $ 92,674 $ $ Effective May 1, 2014, the Board approved changing the fiscal year-end of the Funds from April 30 to October 31. See Notes to Financial Statements. 142 | October 31, 2015 . RiverFront Global Allocation Fund Statements of Changes in Net Assets For the Fiscal Period Ended October 31, 2014(a) For the Year Ended October 31, 2015 For the Year Ended April 30, 2014 OPERATIONS Net investment income Net realized gain/(loss) on investments Net realized loss on investments †affiliated securities Net realized gain distributions from other investment companies Net change in unrealized appreciation/(depreciation) on investments Net Increase/(Decrease) in Net Assets Resulting from Operations $ 575,330 $ (79,726) (33,482) 277,874 (750,472) (10,476) 166,583 $ 1,047,052 (14,540) – (814,242) 384,853 170,637 2,148,570 – 9,169 958,395 3,286,771 DISTRIBUTIONS Dividends to shareholders from net investment income Class A Class C Class I Dividends to shareholders from net realized gains Class A Class C Class I Net Decrease in Net Assets from Distributions (135,563) (171,705) (234,337) (560,595) (1,028,926) (892,615) (3,023,741) (60,721) (29,814) (77,225) (225,948) (315,722) (241,798) (951,228) 704,281 1,706,825 3,218,570 – – – (1,557,221) (1,700,105) (975,931) 1,396,419 1,781,272 34,243,504 36,024,776 $ 166,583 $ 1,828,903 5,733,154 4,414,127 278,213 333,197 312,410 (1,969,635) (2,060,625) (1,566,346) 7,303,398 9,638,941 24,604,563 34,243,504 – – – – – – – – BENEFICIAL INTEREST TRANSACTIONS (NOTE 6) Shares sold Class A Class C Class I Dividends reinvested Class A Class C Class I Shares redeemed Class A Class C Class I Net Increase in Net Assets Derived from Beneficial Interest Transactions Net increase in net assets NET ASSETS Beginning of year End of year * *Including accumulated net investment income of: (a) $ $ 2,396,224 5,539,210 9,024,905 673,030 1,146,839 1,105,082 (2,319,283) (3,108,530) (3,164,067) 11,293,410 8,259,193 36,024,776 44,283,969 $ 200,285 $ Effective May 1, 2014, the Board approved changing the fiscal year-end of the Funds from April 30 to October 31. See Notes to Financial Statements. 143 | October 31, 2015 . RiverFront Global Growth Fund Statements of Changes in Net Assets For the Fiscal Period Ended October 31, 2014(a) For the Year Ended October 31, 2015 For the Year Ended April 30, 2014 OPERATIONS Net investment income Net realized gain on investments Net realized gain distributions from other investment companies Net change in unrealized appreciation/(depreciation) on investments Net Increase in Net Assets Resulting from Operations $ 1,290,107 $ 422,375 $ 109,174 3,579,076 640,999 – (1,412,507) (3,270,391) 627,773 731,060 549,575 6,157,817 24,369 1,314,672 8,046,433 DISTRIBUTIONS Dividends to shareholders from net investment income Class A Class C Class I Class L Investor Class Dividends to shareholders from net realized gains Class A Class C Class I Class L Investor Class Net Decrease in Net Assets from Distributions (284,353) (141,119) (243,129) (453,248) (133,236) (1,555,258) (1,077,170) (1,217,027) (2,207,236) (716,298) (8,028,074) – – – – – – – – – – – (87,390) (28,977) (101,824) (216,395) (65,366) (1,086,883) (878,168) (1,050,842) (2,201,623) (797,894) (6,515,362) 4,307,345 1,088,318 2,214,171 1,420,447 66,568 – – – – – (4,115,225) (1,282,840) (852,301) (2,447,309) (760,465) (361,291) 369,769 73,248,621 73,618,390 $ 424,637 $ 10,986,353 5,045,220 4,759,222 3,180,517 270,199 1,095,779 892,977 1,130,451 2,347,791 782,525 (4,352,368) (1,765,523) (2,075,170) (4,553,986) (2,130,007) 15,613,980 17,145,051 56,103,570 73,248,621 2,262 BENEFICIAL INTEREST TRANSACTIONS (NOTE 6) Shares sold Class A Class C Class I Class L Investor Class Dividends reinvested Class A Class C Class I Class L Investor Class Shares redeemed Class A Class C Class I Class L Investor Class Net Increase/(Decrease) in Net Assets Derived from Beneficial Interest Transactions Net increase in net assets NET ASSETS Beginning of year End of year * *Including accumulated net investment income of: (a) $ $ 6,592,837 4,246,346 7,804,363 5,499,526 265,259 1,781,624 1,189,292 1,360,312 2,618,006 762,580 (5,222,204) (2,728,617) (4,622,386) (3,969,239) (1,134,904) 14,442,795 7,042,494 73,618,390 80,660,884 $ 463,691 $ Effective May 1, 2014, the Board approved changing the fiscal year-end of the Funds from April 30 to October 31. See Notes to Financial Statements. 144 | October 31, 2015 . RiverFront Moderate Growth & Income Fund Statements of Changes in Net Assets For the Fiscal Period Ended October 31, 2014(a) For the Year Ended October 31, 2015 For the Year Ended April 30, 2014 OPERATIONS Net investment income Net realized gain on investments Net realized loss on investments †affiliated securities Net realized gain distributions from other investment companies Net change in unrealized appreciation/(depreciation) on investments Net Increase in Net Assets Resulting from Operations $ 2,288,918 $ 849,869 $ 1,294,023 2,496,740 3,635,670 7,624,458 (38,996) – – 678,016 – 33,187 (4,017,171) (1,889,311) 1,671,672 1,407,507 2,596,228 10,623,340 DISTRIBUTIONS Dividends to shareholders from net investment income Class A Class C Class I Dividends to shareholders from net realized gains Class A Class C Class I Net Decrease in Net Assets from Distributions (416,464) (361,379) (539,349) (1,461,687) (2,693,789) (1,636,155) (7,108,823) 4,319,229 4,201,326 17,073,579 7,712,589 14,370,768 6,525,980 1,734,135 187,752 3,832,260 220,912 2,896,869 325,977 (7,673,351) (8,283,862) (12,583,566) (5,318,273) (10,528,810) (3,079,334) 13,441,113 2,493,067 5,398,727 4,228,331 136,124,507 131,896,176 $ 141,523,234 $ 136,124,507 $ 206,858 $ 49,688 $ $ 11,020,034 18,772,301 16,516,197 1,531,756 2,692,375 2,004,990 (11,453,882) (12,685,999) (7,559,841) 20,837,931 24,352,448 107,543,728 131,896,176 60,631 (463,745) (831,484) (836,519) (1,452,046) (3,504,594) (2,361,505) (9,449,893) (220,828) (267,118) (373,018) – – – (860,964) BENEFICIAL INTEREST TRANSACTIONS (NOTE 6) Shares sold Class A Class C Class I Dividends reinvested Class A Class C Class I Shares redeemed Class A Class C Class I Net Increase in Net Assets Derived from Beneficial Interest Transactions Net increase in net assets NET ASSETS Beginning of year End of year * *Including accumulated net investment income of: (a) Effective May 1, 2014, the Board approved changing the fiscal year-end of the Funds from April 30 to October 31. See Notes to Financial Statements. 145 | October 31, 2015 . RiverFront Conservative Income Builder Fund – Class A Financial Highlights Selected data for a share of beneficial interest outstanding throughout the periods indicated: For the Year Ended October 31, 2015 $10.86 DISTRIBUTIONS: From net investment income From net realized gains Total distributions Net increase/(decrease) in net asset value Net asset value, end of year TOTAL RETURN(c) 0.07 0.04 0.11 (0.08) – (0.08) 0.03 $10.86 0.13 0.53 0.66 (0.12) (0.19) (0.31) 0.35 $10.83 0.09 0.48 0.57 (0.09) – (0.09) 0.48 $10.48 0.40% Net investment income(b) Net realized and unrealized gain/(loss) Total from investment operations For the Year Ended April 30, 2014 $10.48 0.18 (0.14) 0.04 (0.15) (0.29) (0.44) (0.40) $10.46 Net asset value, beginning of period INCOME FROM INVESTMENT OPERATIONS: For the Fiscal Period Ended October 31, 2014(a) $10.83 For the Period September 4, 2012 (Commencement) to April 30, 2013 $10.00 0.98% 6.35% 5.72% $1,038 $1,089 $1,101 $607 RATIOS/SUPPLEMENTAL DATA: (a) (c) (b) (d) (f) (e) Net assets, end of year (000s) Ratio of expenses to average net assets excluding fee waivers and reimbursements Ratio of expenses to average net assets including fee waivers and reimbursements Ratio of net investment income to average net assets Portfolio turnover rate(f) 2.06% 2.39% (d) 2.94% 5.65% (d)(e) 1.15% 1.74% 186% 1.15% (d) 1.22% (d) 34% 1.15% 1.27% 125% 1.15% (d)(e) 1.37% (d)(e) 73% Effective May 1, 2014, the Board approved changing the fiscal year-end of the Funds from April 30 to October 31. Calculated using the average shares method. Total returns are for the period indicated and have not been annualized. Total returns would have been lower had certain expenses not been waived during the period. Returns shown do not reflect the deduction of taxes that a shareholder would pay on Fund distributions or the redemption of Fund shares. Returns shown exclude any applicable sales charges. Annualized. Expense ratios before reductions for startup periods may not be representative of longer term operating periods. Portfolio turnover rate for periods less than one full year have not been annualized. See Notes to Financial Statements. 146 | October 31, 2015 .
RiverFront Conservative Income Builder Fund – Class C Financial Highlights Selected data for a share of beneficial interest outstanding throughout the periods indicated: For the Year Ended October 31, 2015 $10.81 DISTRIBUTIONS: From net investment income From net realized gains Total distributions Net increase/(decrease) in net asset value Net asset value, end of year TOTAL RETURN(c) 0.03 0.04 0.07 (0.03) – (0.03) 0.04 $10.81 0.06 0.51 0.57 (0.12) (0.19) (0.31) 0.26 $10.77 0.06 0.47 0.53 (0.02) – (0.02) 0.51 $10.51 (0.39)% Net investment income(b) Net realized and unrealized gain/(loss) Total from investment operations For the Year Ended April 30, 2014 $10.51 0.09 (0.13) (0.04) (0.11) (0.29) (0.40) (0.44) $10.37 Net asset value, beginning of period INCOME FROM INVESTMENT OPERATIONS: For the Fiscal Period Ended October 31, 2014(a) $10.77 For the Period September 4, 2012 (Commencement) to April 30, 2013 $10.00 0.68% 5.49% 5.29% $8,610 $5,021 $4,106 $2,264 RATIOS/SUPPLEMENTAL DATA: (a) (c) (b) (d) (f) (e) Net assets, end of year (000s) Ratio of expenses to average net assets excluding fee waivers and reimbursements Ratio of expenses to average net assets including fee waivers and reimbursements Ratio of net investment income to average net assets Portfolio turnover rate(f) 2.81% 3.14% (d) 3.73% 6.53% (d)(e) 1.90% 0.88% 186% 1.90% (d) 0.47% (d) 34% 1.90% 0.53% 125% 1.90% (d)(e) 0.90% (d)(e) 73% Effective May 1, 2014, the Board approved changing the fiscal year-end of the Funds from April 30 to October 31. Calculated using the average shares method. Total returns are for the period indicated and have not been annualized. Total returns would have been lower had certain expenses not been waived during the period. Returns shown do not reflect the deduction of taxes that a shareholder would pay on Fund distributions or the redemption of Fund shares. Returns shown exclude any applicable sales charges. Annualized. Expense ratios before reductions for startup periods may not be representative of longer term operating periods. Portfolio turnover rate for periods less than one full year have not been annualized. See Notes to Financial Statements. 147 | October 31, 2015 .
RiverFront Conservative Income Builder Fund – Class I Financial Highlights Selected data for a share of beneficial interest outstanding throughout the periods indicated: For the Year Ended October 31, 2015 $10.70 DISTRIBUTIONS: From net investment income From net realized gains Total distributions Net increase/(decrease) in net asset value Net asset value, end of year TOTAL RETURN(c) 0.07 0.06 0.13 (0.09) – (0.09) 0.04 $10.70 0.15 0.51 0.66 (0.10) (0.19) (0.29) 0.37 $10.66 0.12 0.46 0.58 (0.29) – (0.29) 0.29 $10.29 0.60% Net investment income(b) Net realized and unrealized gain/(loss) Total from investment operations For the Year Ended April 30, 2014 $10.29 0.19 (0.13) 0.06 (0.17) (0.29) (0.46) (0.40) $10.30 Net asset value, beginning of period INCOME FROM INVESTMENT OPERATIONS: For the Fiscal Period Ended October 31, 2014(a) $10.66 For the Period September 4, 2012 (Commencement) to April 30, 2013 $10.00 1.19% 6.53% 5.95% $2,171 $2,830 $1,381 $715 RATIOS/SUPPLEMENTAL DATA: (a) (c) (b) (d) (f) (e) Net assets, end of year (000s) Ratio of expenses to average net assets excluding fee waivers and reimbursements Ratio of expenses to average net assets including fee waivers and reimbursements Ratio of net investment income to average net assets Portfolio turnover rate(f) 1.80% 2.12% (d) 2.66% 7.74% (d)(e) 0.90% 1.84% 186% 0.90% (d) 1.34% (d) 34% 0.90% 1.49% 125% 0.90% (d)(e) 1.84% (d)(e) 73% Effective May 1, 2014, the Board approved changing the fiscal year-end of the Funds from April 30 to October 31. Calculated using the average shares method. Total returns are for the period indicated and have not been annualized. Total returns would have been lower had certain expenses not been waived during the period. Returns shown do not reflect the deduction of taxes that a shareholder would pay on Fund distributions or the redemption of Fund shares. Annualized. Expense ratios before reductions for startup periods may not be representative of longer term operating periods. Portfolio turnover rate for periods less than one full year have not been annualized. See Notes to Financial Statements. 148 | October 31, 2015 . RiverFront Dynamic Equity Income Fund – Class A Financial Highlights Selected data for a share of beneficial interest outstanding throughout the periods indicated: For the Year Ended October 31, 2015 $13.10 For the Year Ended April 30, 2014 $12.24 For the Year Ended April 30, 2013 $11.24 For the Year Ended April 30, 2012(b) $11.73 For the Period August 2, 2010 (Inception) to April 30, 2011 $10.00 0.25 (0.04) 0.21 (0.22) (0.46) – (0.68) (0.47) $12.63 0.09 0.13 0.22 (0.09) – – (0.09) 0.13 $13.10 0.17 1.17 1.34 (0.17) (0.44) – (0.61) 0.73 $12.97 0.25 0.99 1.24 (0.24) – – (0.24) 1.00 $12.24 0.16 (0.49) (0.33) (0.15) – (0.01) (0.16) (0.49) $11.24 0.12 1.67 1.79 (0.06) (d) (0.00) (0.00)(d) (0.06) 1.73 $11.73 1.64% Net asset value, beginning of period For the Fiscal Period Ended October 31, 2014(a) $12.97 1.66% 11.15% 11.22% (2.80)% 17.99% $17,275 $15,374 $8,087 $7,114 $5,723 INCOME/(LOSS) FROM INVESTMENT OPERATIONS: Net investment income(c) Net realized and unrealized gain/(loss) Total from investment operations DISTRIBUTIONS: From net investment income From net realized gains Tax return of capital Total distributions Net increase/(decrease) in net asset value Net asset value, end of year TOTAL RETURN(e) RATIOS/SUPPLEMENTAL DATA: (a) (c) (d) (e) (b) (f) (h) (g) Net assets, end of year (000s) $19,769 Ratio of expenses to average net assets excluding fee waivers and reimbursements 1.35% Ratio of expenses to average net assets including fee waivers and reimbursements 1.15% Ratio of net investment income to average net assets 1.98% (h) 75% Portfolio turnover rate 1.39% (f) 1.15%(f) 1.42% 1.15% 1.33%(f) 45% 1.38% 99% 1.73% 2.17% (f) 1.20%(g) 1.30% 1.30%(f) 2.17% 136% 1.50% 133% 1.48%(f) 66% 1.58% Effective May 1, 2014, the Board approved changing the fiscal year-end of the Funds from April 30 to October 31. Prior to January 1, 2012, the RiverFront Dynamic Equity Income Fund was known as the RiverFront Long-Term Growth & Income Fund. Calculated using the average shares method. Less than ($0.005) per share. Total returns are for the period indicated and have not been annualized. Total returns would have been lower had certain expenses not been waived during the period. Returns shown do not reflect the deduction of taxes that a shareholder would pay on Fund distributions or the redemption of Fund shares. Returns shown exclude any applicable sales charges. Annualized. Contractual expense limitation change from 1.30% to 1.15% effective September 1, 2012. Portfolio turnover rate for periods less than one full year have not been annualized. See Notes to Financial Statements. 149 | October 31, 2015 .
RiverFront Dynamic Equity Income Fund – Class C Financial Highlights Selected data for a share of beneficial interest outstanding throughout the periods indicated: For the Year Ended October 31, 2015 $12.97 For the Year Ended April 30, 2014 $12.13 For the Year Ended April 30, 2013 $11.14 For the Year Ended April 30, 2012(b) $11.67 For the Period August 2, 2010 (Inception) to April 30, 2011 $10.00 0.15 (0.04) 0.11 (0.18) (0.46) – (0.64) (0.53) $12.44 0.04 0.13 0.17 (0.04) – – (0.04) 0.13 $12.97 0.08 1.15 1.23 (0.08) (0.44) – (0.52) 0.71 $12.84 0.16 0.98 1.14 (0.15) – – (0.15) 0.99 $12.13 0.09 (0.51) (0.42) (0.10) – (0.01) (0.11) (0.53) $11.14 0.05 1.67 1.72 (0.05) (d) (0.00) (0.00)(d) (0.05) 1.67 $11.67 0.86% Net asset value, beginning of period For the Fiscal Period Ended October 31, 2014(a) $12.84 1.30% 10.34% 10.41% (3.60)% 17.32% $30,170 $25,787 $16,070 $13,729 $9,223 INCOME/(LOSS) FROM INVESTMENT OPERATIONS: Net investment income(c) Net realized and unrealized gain/(loss) Total from investment operations DISTRIBUTIONS: From net investment income From net realized gains Tax return of capital Total distributions Net increase/(decrease) in net asset value Net asset value, end of year TOTAL RETURN(e) RATIOS/SUPPLEMENTAL DATA: (a) (c) (d) (e) (b) (f) (h) (g) Net assets, end of year (000s) $34,766 Ratio of expenses to average net assets excluding fee waivers and reimbursements 2.10% Ratio of expenses to average net assets including fee waivers and reimbursements 1.90% Ratio of net investment income to average net assets 1.18% (h) 75% Portfolio turnover rate 2.15% (f) 1.90%(f) 2.18% 1.90% 0.60%(f) 45% 0.61% 99% 2.49% 3.10% (f) 1.95%(g) 2.05% 2.05%(f) 1.44% 136% 0.84% 133% 0.65%(f) 66% 2.33% Effective May 1, 2014, the Board approved changing the fiscal year-end of the Funds from April 30 to October 31. Prior to January 1, 2012, the RiverFront Dynamic Equity Income Fund was known as the RiverFront Long-Term Growth & Income Fund. Calculated using the average shares method. Less than ($0.005) per share. Total returns are for the period indicated and have not been annualized. Total returns would have been lower had certain expenses not been waived during the period. Returns shown do not reflect the deduction of taxes that a shareholder would pay on Fund distributions or the redemption of Fund shares. Returns shown exclude any applicable sales charges. Annualized. Contractual expense limitation change from 2.05% to 1.90% effective September 1, 2012. Portfolio turnover rate for periods less than one full year have not been annualized. See Notes to Financial Statements. 150 | October 31, 2015 .
RiverFront Dynamic Equity Income Fund – Class I Financial Highlights Selected data for a share of beneficial interest outstanding throughout the periods indicated: For the Year Ended October 31, 2015 $13.02 For the Year Ended April 30, 2014 $12.16 For the Year Ended April 30, 2013 $11.17 For the Year Ended April 30, 2012(b) $11.64 For the Period August 2, 2010 (Inception) to April 30, 2011 $10.00 0.28 (0.05) 0.23 (0.23) (0.46) – (0.69) (0.46) $12.56 0.10 0.14 0.24 (0.10) – – (0.10) 0.14 $13.02 0.20 1.16 1.36 (0.20) (0.44) – (0.64) 0.72 $12.88 0.27 0.99 1.26 (0.27) – – (0.27) 0.99 $12.16 0.20 (0.50) (0.30) (0.16) – (0.01) (0.17) (0.47) $11.17 0.12 1.68 1.80 (0.15) (d) (0.00) (0.01) (0.16) 1.64 $11.64 1.83% Net asset value, beginning of period For the Fiscal Period Ended October 31, 2014(a) $12.88 1.88% 11.40% 11.47% (2.58)% 18.21% $20,997 $18,254 $10,460 $6,897 $3,301 INCOME/(LOSS) FROM INVESTMENT OPERATIONS: Net investment income(c) Net realized and unrealized gain/(loss) Total from investment operations DISTRIBUTIONS: From net investment income From net realized gains Tax return of capital Total distributions Net increase/(decrease) in net asset value Net asset value, end of year TOTAL RETURN(e) RATIOS/SUPPLEMENTAL DATA: (a) (c) (d) (e) (b) (f) (h) (g) Net assets, end of year (000s) $22,780 Ratio of expenses to average net assets excluding fee waivers and reimbursements 1.10% Ratio of expenses to average net assets including fee waivers and reimbursements 0.90% Ratio of net investment income to average net assets 2.21% (h) 75% Portfolio turnover rate 1.15% (f) 0.90%(f) 1.17% 0.90% 1.57%(f) 45% 1.61% 99% 1.49% 2.44% (f) 0.95%(g) 1.05% 1.05%(f) 2.36% 136% 1.88% 133% 1.49%(f) 66% 1.33% Effective May 1, 2014, the Board approved changing the fiscal year-end of the Funds from April 30 to October 31. Prior to January 1, 2012, the RiverFront Dynamic Equity Income Fund was known as the RiverFront Long-Term Growth & Income Fund. Calculated using the average shares method. Less than ($0.005) per share. Total returns are for the period indicated and have not been annualized. Total returns would have been lower had certain expenses not been waived during the period. Returns shown do not reflect the deduction of taxes that a shareholder would pay on Fund distributions or the redemption of Fund shares. Annualized. Contractual expense limitation change from 1.05% to 0.90% effective September 1, 2012. Portfolio turnover rate for periods less than one full year have not been annualized. See Notes to Financial Statements. 151 | October 31, 2015 . RiverFront Global Allocation Fund – Class A Financial Highlights Selected data for a share of beneficial interest outstanding throughout the periods indicated: For the Year Ended October 31, 2015 $13.14 For the Fiscal Period Ended October 31, 2014(a) $12.97 For the Year Ended April 30, 2014 $11.93 For the Year Ended April 30, 2013 $10.86 For the Year Ended April 30, 2012(b) $11.66 For the Period August 2, 2010 (Inception) to April 30, 2011 $10.00 0.22 (0.06) 0.16 (0.21) (0.89) (1.10) (0.94) $12.20 0.08 0.09 0.17 – – – 0.17 $13.14 0.10 1.36 1.46 (0.09) (0.33) (0.42) 1.04 $12.97 0.15 1.08 1.23 (0.16) – (0.16) 1.07 $11.93 0.12 (0.84) (0.72) (0.07) (0.01) (0.08) (0.80) $10.86 0.10 1.61 1.71 (0.05) – (0.05) 1.66 $11.66 1.23% 1.31% 12.32% 11.47% (6.18)% 17.12% Net assets, end of year (000s) $8,456 Ratio of expenses to average net assets excluding fee waivers and reimbursements 1.43% Ratio of expenses to average net assets including fee waivers and reimbursements 1.15% Ratio of net investment income to average net assets 1.71% Portfolio turnover rate(g) 71% $8,372 $9,098 $8,244 $5,791 $4,686 Net asset value, beginning of period INCOME/(LOSS) FROM INVESTMENT OPERATIONS: Net investment income(c) Net realized and unrealized gain/(loss) Total from investment operations DISTRIBUTIONS: From net investment income From net realized gains Total distributions Net increase/(decrease) in net asset value Net asset value, end of year TOTAL RETURN(d) RATIOS/SUPPLEMENTAL DATA: (a) (c) (d) (b) (e) (g) (f) (e) 1.50% 1.15%(e) 1.51% 1.15% 1.21%(e) 47% 0.83% 95% 1.80% 3.00% (e) 1.19%(f) 1.30% 1.30%(e) 1.32% 113% 1.10% 163% 1.16%(e) 77% 1.68% Effective May 1, 2014, the Board approved changing the fiscal year-end of the Funds from April 30 to October 31. Prior to January 1, 2012, the RiverFront Global Allocation Fund was known as the RiverFront Moderate Growth Fund. Calculated using the average shares method. Total returns are for the period indicated and have not been annualized. Total returns would have been lower had certain expenses not been waived during the period. Returns shown do not reflect the deduction of taxes that a shareholder would pay on Fund distributions or the redemption of Fund shares. Returns shown exclude any applicable sales charges. Annualized. Contractual expense limitation change from 1.30% to 1.15% effective September 1, 2012. Portfolio turnover rate for periods less than one full year have not been annualized. See Notes to Financial Statements. 152 | October 31, 2015 .
RiverFront Global Allocation Fund – Class C Financial Highlights Selected data for a share of beneficial interest outstanding throughout the periods indicated: For the Year Ended October 31, 2015 $12.95 For the Year Ended April 30, 2014 $11.84 For the Year Ended April 30, 2013 $10.81 For the Year Ended April 30, 2012(b) $11.64 For the Period August 2, 2010 (Inception) to April 30, 2011 $10.00 0.12 (0.06) 0.06 (0.14) (0.89) (1.03) (0.97) $11.98 0.03 0.09 0.12 – – – 0.12 $12.95 0.01 1.34 1.35 (0.03) (0.33) (0.36) 0.99 $12.83 0.07 1.07 1.14 (0.11) – (0.11) 1.03 $11.84 0.02 (0.82) (0.80) (0.02) (0.01) (0.03) (0.83) $10.81 0.00(d) 1.65 1.65 (0.01) – (0.01) 1.64 $11.64 0.46% Net asset value, beginning of period For the Fiscal Period Ended October 31, 2014(a) $12.83 0.94% 11.48% 10.59% (6.86)% 16.52% $14,758 $14,624 $9,686 $9,891 $8,926 INCOME/(LOSS) FROM INVESTMENT OPERATIONS: Net investment income(c) Net realized and unrealized gain/(loss) Total from investment operations DISTRIBUTIONS: From net investment income From net realized gains Total distributions Net increase/(decrease) in net asset value Net asset value, end of year TOTAL RETURN(e) RATIOS/SUPPLEMENTAL DATA: (a) (c) (d) (e) (b) (f) (h) (g) Net assets, end of year (000s) $17,089 Ratio of expenses to average net assets excluding fee waivers and reimbursements 2.18% Ratio of expenses to average net assets including fee waivers and reimbursements 1.90% Ratio of net investment income to average net assets 0.94% Portfolio turnover rate(h) 71% (f) 2.25% 1.90%(f) 2.26% 1.90% 0.40%(f) 47% 0.05% 95% 2.58% 3.21% (f) 1.95%(g) 2.05% 2.05%(f) 0.66% 113% 0.17% 163% 0.04%(f) 77% 2.44% Effective May 1, 2014, the Board approved changing the fiscal year-end of the Funds from April 30 to October 31. Prior to January 1, 2012, the RiverFront Global Allocation Fund was known as the RiverFront Moderate Growth Fund. Calculated using the average shares method. Less than $0.005 per share. Total returns are for the period indicated and have not been annualized. Total returns would have been lower had certain expenses not been waived during the period. Returns shown do not reflect the deduction of taxes that a shareholder would pay on Fund distributions or the redemption of Fund shares. Returns shown exclude any applicable sales charges. Annualized. Contractual expense limitation change from 2.05% to 1.90% effective September 1, 2012. Portfolio turnover rate for periods less than one full year have not been annualized. See Notes to Financial Statements. 153 | October 31, 2015 .
RiverFront Global Allocation Fund – Class I Financial Highlights Selected data for a share of beneficial interest outstanding throughout the periods indicated: For the Year Ended October 31, 2015 $12.92 For the Year Ended April 30, 2014 $11.72 For the Year Ended April 30, 2013 $10.66 For the Year Ended April 30, 2012(b) $11.42 For the Period August 2, 2010 (Inception) to April 30, 2011 $10.00 0.22 (0.04) 0.18 (0.22) (0.89) (1.11) (0.93) $11.99 0.09 0.08 0.17 – – – 0.17 $12.92 0.13 1.34 1.47 (0.11) (0.33) (0.44) 1.03 $12.75 0.17 1.07 1.24 (0.18) – (0.18) 1.06 $11.72 0.13 (0.80) (0.67) (0.08) (0.01) (0.09) (0.76) $10.66 0.08 1.62 1.70 (0.28) – (0.28) 1.42 $11.42 1.49% Net asset value, beginning of period For the Fiscal Period Ended October 31, 2014(a) $12.75 1.33% 12.61% 11.73% (5.86)% 17.20% $12,895 $10,521 $6,675 $3,496 $1,905 INCOME/(LOSS) FROM INVESTMENT OPERATIONS: Net investment income(c) Net realized and unrealized gain/(loss) Total from investment operations DISTRIBUTIONS: From net investment income From net realized gains Total distributions Net increase/(decrease) in net asset value Net asset value, end of year TOTAL RETURN(d) RATIOS/SUPPLEMENTAL DATA: (a) (c) (d) (b) (e) (g) (f) Net assets, end of year (000s) $18,739 Ratio of expenses to average net assets excluding fee waivers and reimbursements 1.18% Ratio of expenses to average net assets including fee waivers and reimbursements 0.90% Ratio of net investment income to average net assets 1.83% Portfolio turnover rate(g) 71% (e) 1.26% 0.90%(e) 1.26% 0.90% 1.41%(e) 47% 1.07% 95% 1.55% 4.68% (e) 0.94%(f) 1.05% 1.05%(e) 1.52% 113% 1.28% 163% 0.98%(e) 77% 1.43% Effective May 1, 2014, the Board approved changing the fiscal year-end of the Funds from April 30 to October 31. Prior to January 1, 2012, the RiverFront Global Allocation Fund was known as the RiverFront Moderate Growth Fund. Calculated using the average shares method. Total returns are for the period indicated and have not been annualized. Total returns would have been lower had certain expenses not been waived during the period. Returns shown do not reflect the deduction of taxes that a shareholder would pay on Fund distributions or the redemption of Fund shares. Annualized. Contractual expense limitation change from 1.05% to 0.90% effective September 1, 2012. Portfolio turnover rate for periods less than one full year have not been annualized. See Notes to Financial Statements. 154 | October 31, 2015 . RiverFront Global Growth Fund – Class A Financial Highlights Selected data for a share of beneficial interest outstanding throughout the periods indicated: For the Year Ended October 31, 2015 $15.44 For the Year Ended April 30, 2014 $14.89 For the Year Ended April 30, 2013 $13.37 For the Year Ended April 30, 2012(b) $15.65 For the Fiscal Period Ended April 30, 2011(c) $14.66 0.24 (0.04) 0.20 (0.25) (1.44) (1.69) (1.49) $13.95 0.08 0.10 0.18 – – – 0.18 $15.44 0.12 1.88 2.00 (0.12) (1.51) (1.63) 0.37 $15.26 0.17 1.57 1.74 (0.22) – (0.22) 1.52 $14.89 0.14 (1.41) (1.27) (0.14) (0.87) (1.01) (2.28) $13.37 0.00(e) 0.99 0.99 – – – 0.99 $15.65 1.34% Net asset value, beginning of period For the Fiscal Period Ended October 31, 2014(a) $15.26 1.18% 13.66% 13.14% (7.51)% 6.75% $16,694 $16,440 $8,525 $5,241 $12,307 INCOME/(LOSS) FROM INVESTMENT OPERATIONS: Net investment income(d) Net realized and unrealized gain/(loss) Total from investment operations DISTRIBUTIONS: From net investment income From net realized gains Total distributions Net increase/(decrease) in net asset value Net asset value, end of year TOTAL RETURN(f) RATIOS/SUPPLEMENTAL DATA: (a) (c) (d) (e) (f) (b) (g) (i) (h) Net assets, end of year (000s) $18,308 Ratio of expenses to average net assets excluding fee waivers and 1.38% reimbursements Ratio of expenses to average net assets including fee waivers and reimbursements(h) 1.15% Ratio of net investment income to average net assets 1.67% (i) 71% Portfolio turnover rate 1.38% (g) 1.49% 1.52% 1.58% (g) 1.15%(g) 1.40% 1.15% 0.98% 0.92% 0.81%(g) 1.08%(g) 48% 0.76% 85% 1.23% 113% 0.99% 119% 0.06%(g) 34% Effective May 1, 2014, the Board approved changing the fiscal year-end of the Funds from April 30 to October 31. Prior to January 1, 2012, the RiverFront Global Growth Fund was known as the RiverFront Long-Term Growth Fund. Effective March 8, 2011, the Board approved changing the fiscal year-end of the Fund from December 31 to April 30. Calculated using the average shares method. Less than $0.005 per share. Total returns are for the period indicated and have not been annualized. Total returns would have been lower had certain expenses not been waived during the period. Returns shown do not reflect the deduction of taxes that a shareholder would pay on Fund distributions or the redemption of Fund shares. Returns shown exclude any applicable sales charges. Annualized. Prior to January 1, 2013, all acquired fund fees were reimbursed. Portfolio turnover rate for periods less than one full year have not been annualized. See Notes to Financial Statements. 155 | October 31, 2015 .
RiverFront Global Growth Fund – Class C Financial Highlights Selected data for a share of beneficial interest outstanding throughout the periods indicated: For the Year Ended October 31, 2015 $15.19 For the Year Ended April 30, 2014 $14.76 For the Year Ended April 30, 2013 $13.29 For the Year Ended April 30, 2012(b) $15.60 For the Fiscal Period Ended April 30, 2011(c) $14.63 0.13 (0.04) 0.09 (0.17) (1.44) (1.61) (1.52) $13.67 0.03 0.09 0.12 – – – 0.12 $15.19 0.01 1.86 1.87 (0.05) (1.51) (1.56) 0.31 $15.07 0.08 1.54 1.62 (0.15) – (0.15) 1.47 $14.76 0.05 (1.42) (1.37) (0.07) (0.87) (0.94) (2.31) $13.29 (0.04) 1.01 0.97 – – – 0.97 $15.60 0.59% 0.80% 12.84% 12.31% (8.22)% 6.63% $12,908 Net asset value, beginning of period For the Fiscal Period Ended October 31, 2014(a) $15.07 $11,420 $11,511 $7,182 $6,808 $6,156 INCOME/(LOSS) FROM INVESTMENT OPERATIONS: Net investment income/(loss)(d) Net realized and unrealized gain/(loss) Total from investment operations DISTRIBUTIONS: From net investment income From net realized gains Total distributions Net increase/(decrease) in net asset value Net asset value, end of year TOTAL RETURN(e) RATIOS/SUPPLEMENTAL DATA: Net assets, end of year (000s) Ratio of expenses to average net assets excluding fee waivers and reimbursements Ratio of expenses to average net assets including fee waivers and reimbursements(g) Ratio of net investment income/(loss) to average net assets (h) Portfolio turnover rate (c) (d) (e) (b) (f) (h) (g) 2.13% (f) 2.15% 2.25% 2.29% 2.33% (f) 1.90% (a) 2.13% 1.90%(f) 1.90% 1.73% 1.67% 1.55%(f) 0.88% 71% 0.38%(f) 48% 0.07% 85% 0.57% 113% 0.34% 119% (0.72)%(f) 34% Effective May 1, 2014, the Board approved changing the fiscal year-end of the Funds from April 30 to October 31. Prior to January 1, 2012, the RiverFront Global Growth Fund was known as the RiverFront Long-Term Growth Fund. Effective March 8, 2011, the Board approved changing the fiscal year-end of the Fund from December 31 to April 30. Calculated using the average shares method. Total returns are for the period indicated and have not been annualized. Total returns would have been lower had certain expenses not been waived during the period. Returns shown do not reflect the deduction of taxes that a shareholder would pay on Fund distributions or the redemption of Fund shares. Returns shown exclude any applicable sales charges. Annualized. Prior to January 1, 2013, all acquired fund fees were reimbursed. Portfolio turnover rate for periods less than one full year have not been annualized. See Notes to Financial Statements. 156 | October 31, 2015 .
RiverFront Global Growth Fund – Class I Financial Highlights Selected data for a share of beneficial interest outstanding throughout the periods indicated: For the Year Ended October 31, 2015 $15.52 For the Year Ended April 30, 2014 $14.92 For the Year Ended April 30, 2013 $13.40 For the Year Ended April 30, 2012(b) $15.67 For the Fiscal Period Ended April 30, 2011(c) $14.65 0.26 (0.03) 0.23 (0.28) (1.44) (1.72) (1.49) $14.03 0.10 0.10 0.20 – – – 0.20 $15.52 0.17 1.89 2.06 (0.15) (1.51) (1.66) 0.40 $15.32 0.20 1.57 1.77 (0.25) – (0.25) 1.52 $14.92 0.19 (1.51) (1.32) (0.16) (0.79) (0.95) (2.27) $13.40 0.01 1.01 1.02 – – – 1.02 $15.67 1.51% Net asset value, beginning of period For the Fiscal Period Ended October 31, 2014(a) $15.32 1.31% 14.01% 13.36% (7.31)% 7.04% $13,343 $11,845 $7,769 $6,022 $4,508 INCOME/(LOSS) FROM INVESTMENT OPERATIONS: Net investment income(d) Net realized and unrealized gain/(loss) Total from investment operations DISTRIBUTIONS: From net investment income From net realized gains Total distributions Net increase/(decrease) in net asset value Net asset value, end of year TOTAL RETURN(e) RATIOS/SUPPLEMENTAL DATA: (a) (c) (d) (e) (b) (f) (h) (g) Net assets, end of year (000s) $16,412 Ratio of expenses to average net assets excluding fee waivers and 1.29% reimbursements Ratio of expenses to average net assets including fee waivers and reimbursements(g) 0.90% Ratio of net investment income to average net assets 1.77% (h) 71% Portfolio turnover rate 1.36% (f) 1.25% 1.30% 1.30% (f) 0.90%(f) 1.16% 0.90% 0.73% 0.67% 0.61%(f) 1.32%(f) 48% 1.13% 85% 1.45% 113% 1.44% 119% 0.23%(f) 34% Effective May 1, 2014, the Board approved changing the fiscal year-end of the Funds from April 30 to October 31. Prior to January 1, 2012, the RiverFront Global Growth Fund was known as the RiverFront Long-Term Growth Fund. Effective March 8, 2011, the Board approved changing the fiscal year-end of the Fund from December 31 to April 30. Calculated using the average shares method. Total returns are for the period indicated and have not been annualized. Total returns would have been lower had certain expenses not been waived during the period. Returns shown do not reflect the deduction of taxes that a shareholder would pay on Fund distributions or the redemption of Fund shares. Annualized. Prior to January 1, 2013, all acquired fund fees were reimbursed. Portfolio turnover rate for periods less than one full year have not been annualized. See Notes to Financial Statements. 157 | October 31, 2015 . RiverFront Global Growth Fund – Class L Financial Highlights Selected data for a share of beneficial interest outstanding throughout the periods indicated: For the Year Ended October 31, 2015 $15.49 For the Year Ended April 30, 2014 $14.90 For the Year Ended April 30, 2013 $13.37 For the Year Ended April 30, 2012(b) $15.65 For the Fiscal Period Ended April 30, 2011(c) $14.63 0.27 (0.03) 0.24 (0.28) (1.44) (1.72) (1.48) $14.01 0.11 0.09 0.20 – – – 0.20 $15.49 0.17 1.88 2.05 (0.15) (1.51) (1.66) 0.39 $15.29 0.22 1.56 1.78 (0.25) – (0.25) 1.53 $14.90 0.17 (1.41) (1.24) (0.14) (0.87) (1.04) (2.28) $13.37 0.01 1.01 1.02 – – – 1.02 $15.65 1.59% Net asset value, beginning of period For the Fiscal Period Ended October 31, 2014(a) $15.29 1.31% 13.98% 13.43% (7.31)% 6.97% $24,400 $25,092 $23,454 $24,765 $42,977 INCOME/(LOSS) FROM INVESTMENT OPERATIONS: Net investment income(d) Net realized and unrealized gain/(loss) Total from investment operations DISTRIBUTIONS: From net investment income From net realized gains Total distributions Net increase/(decrease) in net asset value Net asset value, end of year TOTAL RETURN(e) RATIOS/SUPPLEMENTAL DATA: (a) (c) (d) (e) (b) (f) (h) (g) Net assets, end of year (000s) $26,109 Ratio of expenses to average net assets excluding fee waivers and 1.04% reimbursements Ratio of expenses to average net assets including fee waivers and reimbursements (includes acquired fund fee reimbursements)(g) 0.90% Ratio of expenses to average net assets including fee waivers and reimbursements (excludes acquired fund fee reimbursements) 0.90% Ratio of net investment income to average net assets 1.86% Portfolio turnover rate(h) 71% 1.02% (f) 1.08% 1.28% (f) 0.90% 0.73% 0.67% 0.64%(f) (f) 0.90% 1.25% 0.90%(f) 1.15% 0.90% 0.90% 0.90% 0.90%(f) (f) 1.37% 48% 1.11% 85% 1.59% 113% 1.26% 119% 0.19%(f) 34% Effective May 1, 2014, the Board approved changing the fiscal year-end of the Funds from April 30 to October 31. Prior to January 1, 2012, the RiverFront Global Growth Fund was known as the RiverFront Long-Term Growth Fund. Effective March 8, 2011, the Board approved changing the fiscal year-end of the Fund from December 31 to April 30. Calculated using the average shares method. Total returns are for the period indicated and have not been annualized. Total returns would have been lower had certain expenses not been waived during the period. Returns shown do not reflect the deduction of taxes that a shareholder would pay on Fund distributions or the redemption of Fund shares. Annualized. Prior to January 1, 2013, all acquired fund fees were reimbursed. Portfolio turnover rate for periods less than one full year have not been annualized. See Notes to Financial Statements. 158 | October 31, 2015 . RiverFront Global Growth Fund – Investor Class Financial Highlights Selected data for a share of beneficial interest outstanding throughout the periods indicated: For the Year Ended October 31, 2015 $15.37 For the Year Ended April 30, 2014 $14.82 For the Year Ended April 30, 2013 $13.32 For the Year Ended April 30, 2012(b) $15.59 For the Fiscal Period Ended April 30, 2011(c) $14.59 0.26 (0.07) 0.19 (0.25) (1.44) (1.69) (1.50) $13.87 0.09 0.09 0.18 – – – 0.18 $15.37 0.13 1.87 2.00 (0.12) (1.51) (1.63) 0.37 $15.19 0.18 1.54 1.72 (0.22) – (0.22) 1.50 $14.82 0.13 (1.39) (1.26) (0.14) (0.87) (1.01) (2.27) $13.32 0.00(e) 1.00 1.00 – – – 1.00 $15.59 1.28% 1.18% 13.73% 13.07% (7.47)% 6.79% $6,924 Net asset value, beginning of period For the Fiscal Period Ended October 31, 2014(a) $15.19 $7,762 $8,361 $9,174 $10,133 $21,270 INCOME/(LOSS) FROM INVESTMENT OPERATIONS: Net investment income(d) Net realized and unrealized gain/(loss) Total from investment operations DISTRIBUTIONS: From net investment income From net realized gains Total distributions Net increase/(decrease) in net asset value Net asset value, end of year TOTAL RETURN(f) RATIOS/SUPPLEMENTAL DATA: Net assets, end of year (000s) Ratio of expenses to average net assets excluding fee waivers and reimbursements Ratio of expenses to average net assets including fee waivers and reimbursements (includes acquired fund fee reimbursements)(h) Ratio of expenses to average net assets including fee waivers and reimbursements (excludes acquired fund fee reimbursements) Ratio of net investment income/(loss) to average net assets Portfolio turnover rate(i) (c) (d) (e) (f) (b) (g) (i) (h) 1.41% 1.50% 1.93% 1.53% (g) 1.15%(g) 1.15% 0.98% 0.92% 0.89%(g) 1.15% 1.38% (g) 1.15% (a) 1.38% (g) 1.15% 1.15% 1.15% 1.15% 1.15%(g) 1.78% 71% (g) 1.14% 48% 0.85% 85% 1.36% 113% 0.97% 119% (0.08)%(g) 34% Effective May 1, 2014, the Board approved changing the fiscal year-end of the Funds from April 30 to October 31. Prior to January 1, 2012, the RiverFront Global Growth Fund was known as the RiverFront Long-Term Growth Fund. Effective March 8, 2011, the Board approved changing the fiscal year-end of the Fund from December 31 to April 30. Calculated using the average shares method. Less than $0.005 per share. Total returns are for the period indicated and have not been annualized. Total returns would have been lower had certain expenses not been waived during the period. Returns shown do not reflect the deduction of taxes that a shareholder would pay on Fund distributions or the redemption of Fund shares. Annualized. Prior to January 1, 2013, all acquired fund fees were reimbursed. Portfolio turnover rate for periods less than one full year have not been annualized. See Notes to Financial Statements. 159 | October 31, 2015 . RiverFront Moderate Growth & Income Fund – Class A Financial Highlights Selected data for a share of beneficial interest outstanding throughout the periods indicated: For the Year Ended October 31, 2015 $12.15 For the Year Ended April 30, 2014 $11.66 For the Year Ended April 30, 2013 $10.96 For the Year Ended April 30, 2012 $11.08 For the Period August 2, 2010 (Inception) to April 30, 2011 $10.00 0.23 (0.06) 0.17 (0.20) (0.64) – (0.84) (0.67) $11.48 0.09 0.16 0.25 (0.09) – – (0.09) 0.16 $12.15 0.16 0.89 1.05 (0.16) (0.56) – (0.72) 0.33 $11.99 0.24 0.69 0.93 (0.23) – – (0.23) 0.70 $11.66 0.17 (0.12) 0.05 (0.17) – (0.00)(c) (0.17) (0.12) $10.96 0.15 1.01 1.16 (0.08) (c) (0.00) – (0.08) 1.08 $11.08 1.33% Net asset value, beginning of period For the Fiscal Period Ended October 31, 2014(a) $11.99 2.12% 9.16% 8.59% 0.55% 11.70% $27,598 $31,033 $29,066 $20,754 $12,148 INCOME/(LOSS) FROM INVESTMENT OPERATIONS: Net investment income(b) Net realized and unrealized gain/(loss) Total from investment operations DISTRIBUTIONS: From net investment income From net realized gains Tax return of capital Total distributions Net increase/(decrease) in net asset value Net asset value, end of year TOTAL RETURN(d) RATIOS/SUPPLEMENTAL DATA: (a) (c) (d) (b) (e) (g) (f) Net assets, end of year (000s) $24,402 Ratio of expenses to average net assets excluding fee waivers and reimbursements 1.30% Ratio of expenses to average net assets including fee waivers and reimbursements 1.15% Ratio of net investment income to average net assets 1.97% (g) 110% Portfolio turnover rate 1.31% (e) 1.15%(e) 1.32% 1.15% 1.54%(e) 42% 1.35% 98% 1.50% 1.64% (e) 1.19%(f) 1.30% 1.30%(e) 2.17% 108% 1.65% 128% 1.89%(e) 69% 1.40% Effective May 1, 2014, the Board approved changing the fiscal year-end of the Funds from April 30 to October 31. Calculated using the average shares method. Less than ($0.005) per share. Total returns are for the period indicated and have not been annualized. Total returns would have been lower had certain expenses not been waived during the period. Returns shown do not reflect the deduction of taxes that a shareholder would pay on Fund distributions or the redemption of Fund shares. Returns shown exclude any applicable sales charges. Annualized. Contractual expense limitation change from 1.30% to 1.15% effective September 1, 2012. Portfolio turnover rate for periods less than one full year have not been annualized. See Notes to Financial Statements. 160 | October 31, 2015 .
RiverFront Moderate Growth & Income Fund – Class C Financial Highlights Selected data for a share of beneficial interest outstanding throughout the periods indicated: For the Year Ended October 31, 2015 $12.10 For the Year Ended April 30, 2014 $11.62 For the Year Ended April 30, 2013 $10.92 For the Year Ended April 30, 2012 $11.06 For the Period August 2, 2010 (Inception) to April 30, 2011 $10.00 0.13 (0.06) 0.07 (0.14) (0.64) – (0.78) (0.71) $11.39 0.05 0.16 0.21 (0.05) – – (0.05) 0.16 $12.10 0.07 0.89 0.96 (0.08) (0.56) – (0.64) 0.32 $11.94 0.16 0.68 0.84 (0.14) – – (0.14) 0.70 $11.62 0.09 (0.13) (0.04) (0.10) – (0.00)(c) (0.10) (0.14) $10.92 0.10 1.02 1.12 (0.06) (c) (0.00) – (0.06) 1.06 $11.06 0.52% Net asset value, beginning of period For the Fiscal Period Ended October 31, 2014(a) $11.94 1.75% 8.33% 7.83% (0.37)% 11.24% $66,445 $63,031 $52,579 $39,015 $24,061 INCOME/(LOSS) FROM INVESTMENT OPERATIONS: Net investment income(b) Net realized and unrealized gain/(loss) Total from investment operations DISTRIBUTIONS: From net investment income From net realized gains Tax return of capital Total distributions Net increase/(decrease) in net asset value Net asset value, end of year TOTAL RETURN(d) RATIOS/SUPPLEMENTAL DATA: (a) (c) (d) (b) (e) (g) (f) Net assets, end of year (000s) $70,771 Ratio of expenses to average net assets excluding fee waivers and reimbursements 2.05% Ratio of expenses to average net assets including fee waivers and reimbursements 1.90% Ratio of net investment income to average net assets 1.14% (g) 110% Portfolio turnover rate 2.07% (e) 1.90%(e) 2.07% 1.90% 0.77%(e) 42% 0.59% 98% 2.25% 2.54% (e) 1.95%(f) 2.05% 2.05%(e) 1.43% 108% 0.88% 128% 1.22%(e) 69% 2.15% Effective May 1, 2014, the Board approved changing the fiscal year-end of the Funds from April 30 to October 31. Calculated using the average shares method. Less than ($0.005) per share. Total returns are for the period indicated and have not been annualized. Total returns would have been lower had certain expenses not been waived during the period. Returns shown do not reflect the deduction of taxes that a shareholder would pay on Fund distributions or the redemption of Fund shares. Returns shown exclude any applicable sales charges. Annualized. Contractual expense limitation change from 2.05% to 1.90% effective September 1, 2012. Portfolio turnover rate for periods less than one full year have not been annualized. See Notes to Financial Statements. 161 | October 31, 2015 .
RiverFront Moderate Growth & Income Fund – Class I Financial Highlights Selected data for a share of beneficial interest outstanding throughout the periods indicated: For the Year Ended October 31, 2015 $12.14 For the Year Ended April 30, 2014 $11.65 For the Year Ended April 30, 2013 $10.94 For the Year Ended April 30, 2012 $11.07 For the Period August 2, 2010 (Inception) to April 30, 2011 $10.00 0.25 (0.06) 0.19 (0.22) (0.64) – (0.86) (0.67) $11.47 0.11 0.16 0.27 (0.11) – – (0.11) 0.16 $12.14 0.19 0.89 1.08 (0.19) (0.56) – (0.75) 0.33 $11.98 0.26 0.70 0.96 (0.25) – – (0.25) 0.71 $11.65 0.20 (0.13) 0.07 (0.19) – (0.01) (0.20) (0.13) $10.94 0.17 1.01 1.18 (0.11) (c) (0.00) – (0.11) 1.07 $11.07 1.50% Net asset value, beginning of period For the Fiscal Period Ended October 31, 2014(a) $11.98 2.25% 9.43% 8.94% 0.71% 11.92% $42,081 $37,832 $25,898 $12,880 $7,535 INCOME/(LOSS) FROM INVESTMENT OPERATIONS: Net investment income(b) Net realized and unrealized gain/(loss) Total from investment operations DISTRIBUTIONS: From net investment income From net realized gains Tax return of capital Total distributions Net increase/(decrease) in net asset value Net asset value, end of year TOTAL RETURN(d) RATIOS/SUPPLEMENTAL DATA: (a) (c) (d) (b) (e) (g) (f) Net assets, end of year (000s) $46,350 Ratio of expenses to average net assets excluding fee waivers and reimbursements 1.05% Ratio of expenses to average net assets including fee waivers and reimbursements 0.90% Ratio of net investment income to average net assets 2.16% (g) 110% Portfolio turnover rate 1.07% (e) 0.90%(e) 1.07% 0.90% 1.77%(e) 42% 1.59% 98% 1.26% 1.55% (e) 0.94%(f) 1.05% 1.05%(e) 2.39% 108% 1.91% 128% 2.16%(e) 69% 1.15% Effective May 1, 2014, the Board approved changing the fiscal year-end of the Funds from April 30 to October 31. Calculated using the average shares method. Less than ($0.005) per share. Total returns are for the period indicated and have not been annualized. Total returns would have been lower had certain expenses not been waived during the period. Returns shown do not reflect the deduction of taxes that a shareholder would pay on Fund distributions or the redemption of Fund shares. Annualized. Contractual expense limitation change from 1.05% to 0.90% effective September 1, 2012. Portfolio turnover rate for periods less than one full year have not been annualized. See Notes to Financial Statements. 162 | October 31, 2015 . Notes to Financial Statements October 31, 2015 1. ORGANIZATION Financial Investors Trust (the “Trust”), a Delaware statutory trust, is an openâ€end management investment company registered under the Investment Company Act of 1940, as amended (“1940 Act”). As of October 31, 2015, the Trust had 34 registered funds. This annual report includes the financial statements and financial highlights of the following 13 funds: ALPS | Alerian MLP Infrastructure Index Fund, ALPS | CoreCommodity Management CompleteCommodities® Strategy Fund, ALPS | Kotak India Growth Fund, ALPS | Red Rocks Listed Private Equity Fund, ALPS | Sterling ETF Tactical Rotation Fund, ALPS | Westport Resources Hedged High Income Fund, ALPS | WMC Research Value Fund (formerly the ALPS|WMC Disciplined Value Fund), Clough China Fund, RiverFront Conservative Income Builder Fund, RiverFront Dynamic Equity Income Fund, RiverFront Global Allocation Fund, RiverFront Global Growth Fund and RiverFront Moderate Growth & Income Fund (each, a “Fund” and collectively, the “Funds”). ALPS | Alerian MLP Infrastructure Index Fund seeks investment results that correspond (before fees and expenses) generally to the price and yield performance of its underlying index, the Alerian MLP Infrastructure Index. The ALPS | CoreCommodity Management CompleteCommodities® Strategy Fund seeks to maximize real returns consistent with prudent investment management. ALPS | Kotak India Growth Fund’s investment goal is longâ€term capital appreciation. ALPS | Red Rocks Listed Private Equity Fund seeks to maximize total return, which consists of appreciation on its investments and a variable income stream. ALPS | Sterling ETF Tactical Rotation Fund seeks investment results that correspond (before fees and expenses) generally to the performance of the Sterling Tactical Rotation Index. ALPS | Westport Resources Hedged High Income Fund seeks to provide high current income. The Fund’s secondary investment objective is to seek capital preservation, with the potential for capital appreciation. ALPS | WMC Research Value Fund seeks longâ€term capital appreciation: dividend income may be a factor in portfolio selection but is secondary to the Fund’s principal objective. The Clough China Fund seeks to provide investors with longâ€term capital appreciation. The RiverFront Conservative Income Builder Fund seeks to provide current income and potential for that income to grow over time. The RiverFront Dynamic Equity Income Fund seeks to achieve longâ€term growth and income through a combination of capital appreciation and rising dividend payments that exceeds the average yield on global stocks generally. The RiverFront Global Allocation Fund seeks to provide high total investment return through a fully managed investment policy utilizing United States and foreign equity securities, debt and money market securities, the combination of which will be varied from time to time both with respect to types of securities and markets in response to changing market and economic trends. Total investment return means the combination of capital appreciation and investment income. The RiverFront Global Growth Fund seeks to achieve longâ€term capital appreciation through a fully managed investment policy utilizing United States and foreign equity securities, debt and money market securities, the combination of which will be varied from time to time both with respect to types of securities and markets in response to changing market and economic trends. The RiverFront Moderate Growth & Income Fund has two primary investment objectives: (1) seeks to provide a level of current income that exceeds the average yield on U.S. stocks in general and (2) to provide a growing stream of income over the years. The Funds secondary objective is to provide growth of capital. The classes of each Fund differ principally in the applicable distribution and shareholder service fees. Shareholders of each class also bear certain expenses that pertain to that particular class. All shareholders bear the common expenses of the Fund and earn income and realized gains/losses from the Fund pro rata based on the average daily net assets of each class, without distinction between share classes. Dividends to shareholders are determined separately for each class based on income and expenses allocable to each class. Realized gain distributions to shareholders are allocated to each class pro rata based on the shares outstanding of each class on the date of distribution. Differences in per share dividend rates generally result from differences in separate class expenses, including distribution and shareholder service fees, if applicable. Basis of Consolidation for the ALPS | CoreCommodity Management CompleteCommodities® Strategy Fund CoreCommodity Management Cayman Commodity Fund Ltd. (the “Subsidiary”), a Cayman Islands exempted company, was incorporated on April 23, 2010 and is a wholly owned subsidiary of the ALPS | CoreCommodity Management CompleteCommodities® Strategy Fund (the “CoreCommodity Fund”). The Subsidiary acts as an investment vehicle for the CoreCommodity Fund in order to effect certain commodityâ€related investments on behalf of the CoreCommodity Fund. CoreCommodity Fund is the sole shareholder of the Subsidiary pursuant to a subscription agreement dated as of June 14, 2010, and it is intended that the CoreCommodity Fund will remain the sole shareholder and will continue to wholly own and control the Subsidiary. Under the Articles of Association of the Subsidiary, shares issued by the Subsidiary confer upon a shareholder the right to vote at general meetings of the Subsidiary and certain rights in connection with any windingâ€up or repayment of capital, as well as the right to participate in the profits or assets of the Subsidiary. The CoreCommodity Fund may invest up to 25% of its total assets in shares of the Subsidiary. As a wholly owned subsidiary of the CoreCommodity Fund, the financial statements of the Subsidiary are included in the consolidated financial statements and financial highlights of the CoreCommodity Fund. All investments held by the Subsidiary are disclosed in the accounts of the CoreCommodity Fund. As of October 31, 2015, net assets of the CoreCommodity Fund were $400,809,447, of which $72,529,520 or 18.10%, represented the CoreCommodity Fund’s ownership of all issued shares and voting rights of the Subsidiary. Basis of Consolidation for the ALPS | Kotak India Growth Fund ALPS | Kotak India Growth Fund, (the “Kotak Fund”) invests in the equity securities of Indian companies through its wholly owned, collective investment vehicle, the India Premier Equity Portfolio (the “Portfolio”). The Portfolio is registered with and regulated by the Mauritius Financial Services Commission. The Portfolio was formed for the purpose of facilitating the Kotak Fund’s purchase of securities of a wide selection of Indian 163 | October 31, 2015 . Notes to Financial Statements October 31, 2015 companies, consistent with the Kotak Fund’s investment strategies. The Portfolio is a private company limited by shares incorporated under the Mauritius Companies Act 2001. As a wholly owned subsidiary of the Kotak Fund, financial statements of the Portfolio are included in the consolidated financial statements and financial highlights of the Kotak Fund. All investments held by the Portfolio are disclosed in the accounts of the Kotak Fund. The Portfolio established residency in Mauritius allowing the Kotak Fund to receive the beneficial tax treatment under the Treaty between India and Mauritius. If the benefits of the Treaty are denied or if the Portfolio is held to have a permanent establishment in India, gains derived by the Portfolio due to the sale of securities, may be subject to taxation in India. India’s Finance Act of 2012 had introduced legislation on General Anti†Avoidance Rules (“GAAR”) into the Act which contains treaty override provisions. The GAAR may be used by the Indian tax authorities to declare any arrangement whose main purpose or one of the main purposes is to obtain a tax benefit, as an “impermissible avoidance arrangement.” Originally, GAAR was to be effective from April 1, 2012; however, subsequent to the 2013 amendments introduced to the Finance Act, GAAR had been deferred until April 1, 2015. In the 2015 budget presentation, the Finance Minister (India) announced that the implementation of GAAR will be delayed by two years. 2. SIGNIFICANT ACCOUNTING POLICIES The following is a summary of significant accounting policies consistently followed by each Fund in the preparation of its financial statements. Each Fund is considered an investment company for financial reporting purposes, and the following policies are in conformity with accounting principles generally accepted in the United States of America for investment companies (“U.S. GAAP”).The preparation of financial statements in conformity with U.S. GAAP requires management to make certain estimates and assumptions that affect the reported amounts of assets and liabilities and disclosures of contingent assets and liabilities at the date of the financial statements and the reported amounts of revenue and expenses during the period. Actual results could differ from those estimates. The following is a summary of significant accounting policies consistently followed by the Funds and subsidiaries, as applicable, in preparation of their financial statements. Investment Valuation: The Funds generally value their securities based on market prices determined at the close of regular trading on the New York Stock Exchange (“NYSE”), normally 4:00 p.m. Eastern Time, on each day the NYSE is open for trading. For equity securities and mutual funds that are traded on an exchange, the market price is usually the closing sale or official closing price on that exchange. The market price for debt obligations is generally the price supplied by an independent thirdâ€party pricing service approved by the Board, which may use a matrix, formula or other objective method that takes into consideration quotations from dealers, market transactions in comparable investments, market indices and yield curves. If vendors are unable to supply a price, or if the price supplied is deemed to be unreliable, the market price may be determined using quotations received from one or more brokersâ€dealers that make a market in the security. Shortâ€term debt obligations that will mature in 60 days or less are valued at amortized cost; unless it is determined that using this method would not reflect an investment’s fair value. Investments in nonâ€exchange traded funds are fair valued at their respective net asset values. Futures contracts that are listed or traded on a national securities exchange, commodities exchange, contract market or comparable over the counter market, and that are freely transferable, are valued at their closing settlement price on the exchange on which they are primarily traded or based upon the current settlement price for a like instrument acquired on the day on which the instrument is being valued. A settlement price may not be used if the market makes a limit move with respect to a particular commodity. Overâ€theâ€counter swap contracts for which market quotations are readily available are valued based on quotes received from independent pricing services or one or more dealers that make markets in such securities. Equity securities that are primarily traded on foreign securities exchanges are valued at the closing values of such securities on their respective foreign exchanges, except when an event occurs subsequent to the close of the foreign exchange and the close of the NYSE that was likely to have changed such value. In such an event, the fair value of those securities are determined in good faith through consideration of other factors in accordance with procedures established by and under the general supervision of the Board. The Funds will use a fair valuation model provided by an independent pricing service, which is intended to reflect fair value when a security’s value or a meaningful portion of the Fund’s portfolio is believed to have been materially affected by an valuation event that has occurred between the close of the exchange or market on which the security is traded and the close of the regular trading day on the NYSE. Forward currency exchange contracts have a fair value determined by the prevailing foreign currency exchange daily rates and current foreign currency exchange forward rates. The foreign currency exchange forward rates are calculated using an automated system that estimates rates on the basis of the current day foreign currency exchange rates and forward foreign currency exchange rates supplied by a pricing service. Foreign exchange rates and forward foreign currency exchange rates may generally be obtained at the close of the NYSE, normally 4:00 p.m. Eastern Time. When such prices or quotations are not available, or when the Fund’s adviser or subâ€adviser, as applicable, believes that they are unreliable, securities may be priced using fair value procedures approved by the Board. 164 | October 31, 2015 . Notes to Financial Statements October 31, 2015 Fair Value Measurements: The Funds disclose the classification of their fair value measurements following a threeâ€tier hierarchy based on the inputs used to measure fair value. Inputs refer broadly to the assumptions that market participants would use in pricing the asset or liability, including assumptions about risk. Inputs may be observable or unobservable. Observable inputs reflect the assumptions market participants would use in pricing the asset or liability that are developed based on market data obtained from sources independent of the reporting entity. Unobservable inputs reflect the reporting entity’s own assumptions about the assumptions market participants would use in pricing the asset or liability that are developed based on the best information available. Various inputs are used in determining the value of each Fund’s investments as of the end of the reporting period. When inputs used fall into different levels of the fair value hierarchy, the level in the hierarchy within which the fair value measurement falls is determined based on the lowest level input that is significant to the fair value measurement in its entirety. The designated input levels are not necessarily an indication of the risk or liquidity associated with these investments. These inputs are categorized in the following hierarchy under applicable financial accounting standards: Level 1 – Unadjusted quoted prices in active markets for identical investments, unrestricted assets or liabilities that a Fund has the ability to access at the measurement date; Level 2 – Quoted prices which are not active, quoted prices for similar assets or liabilities in active markets or inputs other than quoted prices that are observable (either directly or indirectly) for substantially the full term of the asset or liability; and Level 3 – Significant unobservable prices or inputs (including the Fund’s own assumptions in determining the fair value of investments) where there is little or no market activity for the asset or liability at the measurement date. The following is a summary of each Fund’s investments/financial instruments in the fair value hierarchy as of October 31, 2015: Level 1 - Unadjusted Level 2 - Other Significant Level 3 - Significant Investments in Securities at Value Quoted Prices Observable Inputs Unobservable Inputs Total ALPS | Alerian MLP Infrastructure Index Fund Master Limited Partnerships(a) $ 26,696,934 $ – $ – $ 26,696,934 Total $ 26,696,934 $ – $ – $ 26,696,934 Level 1 - Unadjusted Level 2 - Other Significant Level 3 - Significant Investments in Securities at Value Quoted Prices Observable Inputs Unobservable Inputs Total ALPS | CoreCommodity Management CompleteCommodities® Strategy Fund Common Stocks(a) $ 140,152,427 $ – $ – $ 140,152,427 2,019,861 – – 2,019,861 Master Limited Partnerships(a) Government Bonds – 245,509,270 – 245,509,270 Purchased Options 7,250 – – 7,250 Short Term Investments 4,793,239 – – 4,793,239 Total $ 146,972,777 $ 245,509,270 $ – $ 392,482,047 Other Financial Instruments Assets Futures Contracts $ 804,065 $ – $ – $ 804,065 Total Return Swap Contracts – 3,728,584 – 3,728,584 Liabilities Written Options (2,468,252) – – (2,468,252) Futures Contracts (1,034,894) – – (1,034,894) Total Return Swap Contracts – (341,788) – (341,788) Total $ (2,699,081) $ 3,386,796 $ – $ 687,715 165 | October 31, 2015 . Notes to Financial Statements October 31, 2015 Investments in Securities at Value ALPS | Kotak India Growth Fund Common Stocks Consumer Discretionary Consumer Staples Energy Financials Health Care Industrials Information Technology Materials Telecommunication Services Short Term Investments Total Level 1 - Unadjusted Quoted Prices $ $ Level 2 - Other Significant Observable Inputs – $ – – – – 117,393 – 208,430 – 46,969 372,792 $ 1,794,367 1,559,720 620,160 4,584,484 1,193,294 1,870,621 2,144,536 1,941,456 249,119 – 15,957,757 Level 3 - Significant Unobservable Inputs $ $ – – – – – – – – – – – Total $ $ 1,794,367 1,559,720 620,160 4,584,484 1,193,294 1,988,014 2,144,536 2,149,886 249,119 46,969 16,330,549 Level 1 - Unadjusted Investments in Securities at Value Quoted Prices ALPS | Red Rocks Listed Private Equity Fund Closedâ€End Funds $ 65,065,185 Common Stocks(a) 429,355,844 Short Term Investments 9,262,230 Total $ 503,683,259 Level 1 - Unadjusted Investments in Securities at Value Quoted Prices ALPS | Sterling ETF Tactical Rotation Fund Exchange Traded Funds $ 34,730,210 Total $ 34,730,210 Level 1 - Unadjusted Investments in Securities at Value Quoted Prices ALPS | Westport Resources Hedged High Income Fund Exchange Traded Funds $ 234,179 (a) – Bank Loans Convertible Corporate Bonds(a) – Corporate Bonds(a) – Mortgage Backed Securities – Short Term Investments – Total $ 234,179 Other Financial Instruments Assets Futures Contracts $ 1,807 Forward Foreign Currency Contracts – Liabilities Futures Contracts (45,631) – Credit Default Swap Contracts Forward Foreign Currency Contracts – Total $ (43,824) Level 2 - Other Significant Observable Inputs $ $ – – – – Level 2 - Other Significant Observable Inputs $ $ Level 2 - Other Significant Observable Inputs $ $ $ $ – 6,512,959 1,036,366 9,999,923 2,039,840 79,899 19,668,987 166 | October 31, 2015 $ $ $ $ – $ – $ $ – – – – – – – 65,065,185 429,355,844 9,262,230 503,683,259 Total Level 3 - Significant Unobservable Inputs – $ 10,439 – (52,685) (879) (43,125) – – – – Total Level 3 - Significant Unobservable Inputs – $ – $ $ $ Level 3 - Significant Unobservable Inputs 34,730,210 34,730,210 Total $ $ 234,179 6,512,959 1,036,366 9,999,923 2,039,840 79,899 19,903,166 – $ – 1,807 10,439 – – – – $ (45,631) (52,685) (879) (86,949) . Notes to Financial Statements October 31, 2015 Investments in Securities at Value ALPS | WMC Research Value Fund Common Stocks(a) Short Term Investments Total Other Financial Instruments Assets Futures Contracts Total Level 1 - Unadjusted Quoted Prices Level 2 - Other Significant Observable Inputs Level 3 - Significant Unobservable Inputs Total $ $ 95,735,591 $ 1,643,620 97,379,211 $ – $ – – $ – $ – – $ 95,735,591 1,643,620 97,379,211 $ $ 55,456 $ 55,456 $ – $ – $ – $ – $ 55,456 55,456 Investments in Securities at Value Clough China Fund Common Stocks Communications Consumer Discretionary Consumer, Cyclical Consumer, Nonâ€Cyclical Energy Financials Industrials Technology Utilities Participation Notes(a) Short Term Investments Total Level 1 - Unadjusted Quoted Prices $ $ Level 2 - Other Significant Observable Inputs 871,832 $ – 158,014 236,467 – – – 431,181 – – 170,634 1,868,128 $ 9,763,562 531,433 12,260,950 2,826,658 2,782,335 20,777,931 5,925,130 8,468,826 635,345 2,787,121 – 66,759,291 Level 3 - Significant Unobservable Inputs $ $ – – – – – – – – – – – – Total $ $ 10,635,394 531,433 12,418,964 3,063,125 2,782,335 20,777,931 5,925,130 8,900,007 635,345 2,787,121 170,634 68,627,419 Level 1 - Unadjusted Investments in Securities at Value Quoted Prices RiverFront Conservative Income Builder Fund Exchange Traded Funds(a) $ 11,508,546 Short Term Investments 804,170 Total $ 12,312,716 Level 1 - Unadjusted Investments in Securities at Value Quoted Prices RiverFront Dynamic Equity Income Fund Common Stocks(a) $ 3,621,225 (a) 71,521,107 Exchange Traded Funds Short Term Investments 1,939,710 Total $ 77,082,042 Level 1 - Unadjusted Investments in Securities at Value Quoted Prices RiverFront Global Allocation Fund Common Stocks(a) $ 2,066,645 Exchange Traded Funds(a) 41,160,218 Short Term Investments 2,428,247 Total $ 45,655,110 Level 2 - Other Significant Observable Inputs $ $ – $ – – $ Level 2 - Other Significant Observable Inputs $ $ – – – – Level 2 - Other Significant Observable Inputs $ $ 167 | October 31, 2015 Level 3 - Significant Unobservable Inputs – – – – Total – $ – – $ Level 3 - Significant Unobservable Inputs $ $ – – – – Total $ $ Level 3 - Significant Unobservable Inputs $ $ – – – – 11,508,546 804,170 12,312,716 3,621,225 71,521,107 1,939,710 77,082,042 Total $ $ 2,066,645 41,160,218 2,428,247 45,655,110 . Notes to Financial Statements October 31, 2015 Investments in Securities at Value RiverFront Global Growth Fund Common Stocks(a) (a) Exchange Traded Funds Short Term Investments Total Level 1 - Unadjusted Quoted Prices $ $ Level 2 - Other Significant Observable Inputs 3,880,497 $ 74,704,082 2,288,635 80,873,214 $ – – – – Level 3 - Significant Unobservable Inputs $ $ – – – – Total $ $ 3,880,497 74,704,082 2,288,635 80,873,214 Level 1 - Unadjusted Level 2 - Other Significant Level 3 - Significant Investments in Securities at Value Quoted Prices Observable Inputs Unobservable Inputs Total RiverFront Moderate Growth & Income Fund Common Stocks(a) $ 6,459,779 $ – $ – $ 6,459,779 (a) 131,372,367 – – 131,372,367 Exchange Traded Funds Short Term Investments 3,970,144 – – 3,970,144 Total $ 141,802,290 $ – $ – $ 141,802,290 (a) For detailed descriptions of country, sector and/or industry, see the accompanying Statement of Investments or Consolidated Statement of Investments. The Funds recognize transfers between levels as of the end of the period. For the Fiscal Year Ended October 31, 2015, the Funds did not have any transfers between Level 1 and Level 2 securities, except the ALPS | Kotak India Growth Fund and the Clough China Fund. The ALPS | Kotak India Growth Fund and Clough China Fund utilize a fair value evaluation service with respect to international securities with an earlier market closing than the Funds’ net asset value computation cutoff. When events trigger the use of the fair value evaluation service on a reporting period date, it results in certain securities transferring from a Level 1 to a Level 2 classification. The transfer amounts disclosed in the tables below represent the value of the securities as of October 31, 2015 transferred in/(out) of Level 1 and Level 2 during the reporting period that were also held at October 31, 2014. The ALPS | Kotak India Growth Fund had the following transfers between Levels 1 and 2 at October 31, 2015: Level 1 - Quoted and Unadjusted Prices Level 2 - Other Significant Observable Inputs Transfers In Transfers (Out) Transfers In Transfers (Out) Common Stocks $ – $ (1,178,648) $ 1,178,648 $ – Total $ – $ (1,178,648) $ 1,178,648 $ – The Clough China Fund had the following transfers between Levels 1 and 2 at October 31, 2015: Level 1 - Quoted and Unadjusted Prices Level 2 - Other Significant Observable Inputs Transfers In Transfers (Out) Transfers In Transfers (Out) Common Stocks $ – $ (1,715,855) $ 1,715,855 $ – Total $ – $ (1,715,855) $ 1,715,855 $ – 168 | October 31, 2015 . Notes to Financial Statements October 31, 2015 The changes of the fair value of investments for which the Funds have used Level 3 inputs to determine the fair value are as follows: Net change in unrealized appreciation/ (depreciation) included in the Statements of Operations attributable to Level 3 investments held at Transfer Transfer Balance as out of of October October 31, into Level 3 Level 3 31, 2015 2015 Change in Unrealized Balance as Accrued Sales Investments of November discount/ Return of Realized Appreciation/ 1, 2014 in Securities premium Capital Gain/(Loss) (Depreciation) Purchases Proceeds Westport Resources Hedged High Income Fund Corporate Bonds $ 262,500 $ 13,424 $ – $ (44,093) $ 33,732 $ – $ (265,563) $ – $ – $ – $ – Total $ 262,500 $ 13,424 $ – $ (44,093) $ 33,732 $ – $ (265,653) $ – $ – $ – $ – Due to the short term nature of the payable due to custodian †overdraft, face value approximates fair value at October 31, 2015. This fair value is based on Level 2 inputs under the threeâ€tier fair valuation hierarchy described above. Offering Costs: The ALPS | Sterling ETF Tactical Rotation Fund and ALPS | Westport Resources Hedged High Income Fund incurred offering costs during their Fiscal Periods Ended October 31, 2014. These offering costs, including fees for printing initial prospectuses, legal, and registration fees, were amortized over the first twelve months from the inception date of each Fund. Amounts amortized through October 31, 2015 are shown on each Fund’s Statement of Operations. Fund and Class Expenses: Some expenses of the Trust can be directly attributed to a Fund or a specific share class of a Fund. Expenses which cannot be directly attributed are apportioned among all Funds in the Trust based on average net assets of each share class within a Fund. Federal Income Taxes: The Funds, except for ALPS | Alerian MLP Infrastructure Index Fund, comply with the requirements under Subchapter M of the Internal Revenue Code of 1986, as amended (the “Code”) applicable to regulated investment companies and intend to distribute substantially all of their net taxable income and net capital gains, if any, each year. Those Funds are not subject to income taxes to the extent such distributions are made. The ALPS | Alerian MLP Infrastructure Index Fund is taxed as a regular corporation (or soâ€called subchapter “C” corporation) for federal income tax purposes, and will be subject to tax on its taxable income at rates applicable to corporations. Currently, the maximum marginal regular federal income tax rate for a corporation is 35 percent, but the Fund expects to pay federal income tax at a rate of 34 percent. The ALPS | Alerian MLP Infrastructure Index Fund may be subject to a 20 percent federal alternative minimum tax on its federal alternative taxable income to the extent that its alternative minimum tax exceeds its regular federal income tax. This differs from most investment companies, which elect to be treated as “regulated investment companies” under the Code in order to avoid paying entity level income taxes. Under current law, the ALPS | Alerian MLP Infrastructure Index Fund is not eligible to elect treatment as a regulated investment company due to its investments, primarily in Master Limited Partnerships (“MLPs”) invested in energy assets. As a result, the ALPS | Alerian MLP Infrastructure Index Fund will be obligated to pay applicable federal and state corporate income taxes on its taxable income as opposed to most other investment companies which are not so obligated. As discussed below, the ALPS | Alerian MLP Infrastructure Index Fund expects that a portion of the distributions it receives from MLPs may be treated as a taxâ€deferred return of capital, thus reducing the Fund’s current tax liability. However, the amount of taxes currently paid by the ALPS | Alerian MLP Infrastructure Index Fund will vary depending on the amount of income and gains derived from investments and/or sales of MLP interests and such taxes will reduce the return from an investment in the Fund. See further disclosure regarding MLPs below. As of and during the Fiscal Year Ended October 31, 2015, the Funds, except the ALPS | Alerian MLP Infrastructure Index Fund, did not have a liability for any unrecognized tax benefits. The Funds file U.S. federal, state, and local tax returns as required. The Funds’ tax returns are subject to examination by the relevant tax authorities until expiration of the applicable statute of limitations which is generally three years after the filing of the tax return, but may extend to four years in certain jurisdictions. Tax returns for open years have incorporated no uncertain tax positions that require a provision for income taxes. 169 | October 31, 2015 . Notes to Financial Statements October 31, 2015 Distributions to Shareholders: Each Fund, except the ALPS | Alerian MLP Infrastructure Index Fund, ALPS | Westport Resources Hedged High Income Fund, RiverFront Conservative Income Builder Fund, RiverFront Dynamic Equity Income Fund, and RiverFront Moderate Growth & Income Fund normally pays dividends and distributes capital gains, if any, on an annual basis. The ALPS | Alerian MLP Infrastructure Index Fund, RiverFront Conservative Income Builder Fund, RiverFront Dynamic Equity Income Fund, and RiverFront Moderate Growth & Income Fund normally pay dividends, if any, on a quarterly basis and distribute capital gains annually. The ALPS | Westport Hedged High Income Fund normally pays dividends, if any, on a monthly basis and distributes capital gains annually. Income dividend distributions are derived from interest and other income each Fund receives from its investments, including distributions of shortâ€term capital gains. Capital gain distributions are derived from gains realized when the Fund sells a security it has owned for more than a year. Each Fund may make additional distributions and dividends at other times if its portfolio manager or managers believe doing so may be necessary for the Fund to avoid or reduce taxes. Distributions received from the ALPS | Alerian MLP Infrastructure Index Fund’s investments in MLPs generally are comprised of income and return of capital. The Fund records investment income and return of capital based on estimates made at the time such distributions are received. Such estimates are based on historical information available from each MLP and other industry sources. These estimates may subsequently be revised based on information received from MLPs after their tax reporting periods are concluded. Return of capital distributions are not taxable income to the shareholder, but reduce the investor’s tax basis in the investor’s Fund shares. Such a reduction in tax basis will result in larger taxable gains and/or lower tax losses on a subsequent sale of Fund shares. Shareholders who periodically receive the payment of dividends or other distributions consisting of a return of capital may be under the impression that they are receiving net profits from the Fund when, in fact, they are not. Shareholders should not assume that the source of the distributions is from the net profits of the Fund. Commodityâ€Linked Notes: The ALPS | CoreCommodity Management CompleteCommodities® Strategy Fund may invest in commodityâ€linked notes which are derivative instruments that have characteristics of a debt security and of a commodityâ€linked derivative. A commodityâ€linked note typically provides for interest payments and a principal payment at maturity linked to the price movement of the underlying commodity, commodity index or commodity futures or option contract. Commodityâ€linked notes may be principal protected, partially protected, or offer no principal protection. The value of these notes will rise and fall in response to changes in the underlying commodity or related index or investment. These notes are often leveraged, increasing the volatility of each note’s value relative to the change in the underlying linked index. Commodity indexâ€linked investments may be more volatile and less liquid than the underlying index and their value may be affected by the performance of the commodities as well as other factors, including liquidity, quality, maturity and other economic variables. Commodityâ€linked notes are typically issued by a bank or other financial institution and are sometimes referred to as structured notes because the terms of the notes may be structured by the issuer and the purchaser of the notes to accommodate the specific investment requirements of the purchaser. Investment Transactions and Investment Income: Investment transactions are accounted for on the date the investments are purchased or sold (trade date basis). Net realized gains and losses from investment transactions are reported on an identified cost basis. Interest income, which includes accretion of discounts and amortization of premiums, is accrued and recorded as earned. The character of distributions received from investments in limited partnerships is estimated based off the best available information at period end. Dividend income is recognized on the exâ€dividend date or for certain foreign securities, as soon as information is available to each Fund. Foreign Securities: Each Fund may directly purchase securities of foreign issuers. Investing in securities of foreign issuers involves special risks not typically associated with investing in securities of U.S. issuers. The risks include possible reevaluation of currencies, the inability to repatriate foreign currency, less complete financial information about companies and possible future adverse political and economic developments. Moreover, securities of many foreign issuers and their markets may be less liquid and their prices more volatile than those of securities of comparable U.S. issuers. Foreign Currency Translation: The books and records of the Funds are maintained in U.S. dollars. Investment valuations and other assets and liabilities initially expressed in foreign currencies are converted each business day into U.S. dollars based upon current exchange rates. The portion of realized and unrealized gains or losses on investments due to fluctuations in foreign currency exchange rates is not separately disclosed and is included in realized and unrealized gains or losses on investments, when applicable. Foreign Currency Spot Contracts: The Funds may enter into foreign currency spot contracts to facilitate transactions in foreign securities or to convert foreign currency receipts into U.S. dollars. A foreign currency spot contract is an agreement between two parties to buy and sell currencies at the current market rate, for settlement generally within two business days. The U.S. dollar value of the contracts is determined using current currency exchange rates supplied by a pricing service. The contract is markedâ€toâ€market daily for settlements beyond one day and any change in market value is recorded as an unrealized gain or loss. When the contract is closed, the Fund records a realized gain or loss equal to the difference between the value on the open and close date. Losses may arise from changes in the value of the foreign currency, or if the counterparties do not perform under the contract’s terms. The maximum potential loss from such contracts is the aggregate face value in U.S. dollars at the time the contract was opened. 170 | October 31, 2015 . Notes to Financial Statements October 31, 2015 Real Estate Investment Trusts (“REITs”): The Funds may invest a portion of their assets in REITs and are subject to certain risks associated with direct investment in REITs. REITs may be affected by changes in the value of their underlying properties and by defaults by borrowers or tenants. REITs depend generally on their ability to generate cash flow to make distributions to shareowners, and certain REITs have selfâ€liquidation provisions by which mortgages held may be paid in full and distributions of capital returns may be made at any time. In addition, the performance of a REIT may be affected by its failure to qualify for taxâ€free passâ€through of income under the Internal Revenue Code of 1986, as amended (the “Code”), or its failure to maintain exemption from registration under the 1940 Act. Treasury Inflation Protectedâ€Securities: The Funds may invest in treasury inflation protected securities (“TIPS”), including structured bonds in which the principal amount is adjusted daily to keep pace with inflation, as measured by the U.S. Consumer Pricing Index for Urban Consumers. The adjustments to principal due to inflation/deflation are reflected as increases/decreases to interest income with a corresponding adjustment to cost. Such adjustments may have a significant impact on a Fund’s distributions and may result in a return of capital to shareholders. The repayment of the original bond principal upon maturity is guaranteed by the full faith and credit of the U.S. Government. Loan Participations and Assignments: Certain Funds may invest in loan participations and assignments. The Fund considers loan participations and assignments to be investments in debt securities. Loan participations typically will result in the Fund having a contractual relationship only with the lender, not with the borrower. The Fund will have the right to receive payments of principal, interest and any fees to which it is entitled only from the lender selling the participation and only upon receipt by the lender of the payments from the borrower. Under a loan participation, the Fund generally will have no right to enforce compliance by the borrower with the terms of the loan agreement relating to the loan, nor any rights of setâ€off against the borrower, and the Fund may not benefit directly from any collateral supporting the loan in which it has purchased the participation. As a result, the Fund will assume the credit risk of both the borrower and the lender that is selling the participation. In the event of the insolvency of the lender selling a participation, the Fund may be treated as a general creditor of the lender and may not benefit from any setâ€off between the lender and the borrower. When the Fund purchases assignments of loans from lenders, the Fund will acquire direct rights against the borrower on the loan, except that under certain circumstances such rights may be more limited than those held by the assigning lender. Master Limited Partnerships: MLPs are publicly traded partnerships engaged in the transportation, storage and processing of minerals and natural resources. By confining their operations to these specific activities, their interests, or units, are able to trade on public securities exchanges exactly like the shares of a corporation, without entity level taxation. To qualify as a MLP and to not be taxed as a corporation, a partnership must receive at least 90% of its income from qualifying sources as set forth in Section 7704(d) of the Code. These qualifying sources include natural resource based activities such as the processing, transportation and storage of mineral or natural resources. MLPs generally have two classes of owners, the general partner and limited partners. The general partner of an MLP is typically owned by a major energy company, an investment fund, the direct management of the MLP, or is an entity owned by one or more of such parties. The general partner may be structured as a private or publicly traded corporation or other entity. The general partner typically controls the operations and management of the MLP through an up to 2% equity interest in the MLP plus, in many cases, ownership of common units and subordinated units. Limited partners typically own the remainder of the partnership, through ownership of common units, and have a limited role in the partnership’s operations and management. MLPs are typically structured such that common units and general partner interests have first priority to receive quarterly cash distributions up to an established minimum amount (“minimum quarterly distributions” or “MQD”). Common and general partner interests also accrue arrearages in distributions to the extent the MQD is not paid. Once common and general partner interests have been paid, subordinated units receive distributions of up to the MQD; however, subordinated units do not accrue arrearages. Distributable cash in excess of the MQD is paid to both common and subordinated units and is distributed to both common and subordinated units generally on a pro rata basis. The general partner is also eligible to receive incentive distributions if the general partner operates the business in a manner which results in distributions paid per common unit surpassing specified target levels. As the general partner increases cash distributions to the limited partners, the general partner receives an increasingly higher percentage of the incremental cash distributions. 3. DERIVATIVE INSTRUMENTS As a part of their investment strategy, the ALPS | CoreCommodity Management CompleteCommodities® Strategy Fund, ALPS | Kotak India Growth Fund and ALPS | Westport Resources Hedged High Income Fund are permitted to enter in various types of derivatives contracts. The other funds including ALPS | Alerian MLP Infrastructure Index Fund, ALPS | Red Rocks Listed Private Equity Fund, ALPS|Sterling ETF Tactical Rotation Fund, ALPS | WMC Research Value Fund, Clough China Fund, RiverFront Conservative Income Builder Fund, RiverFront Dynamic Equity Income Fund, RiverFront Global Allocation Fund, RiverFront Global Growth Fund and RiverFront Moderate Growth & Income Fund may invest to a lesser extent in derivatives contracts. In doing so, the Funds will employ strategies in differing combinations to permit them to increase, decrease, or change the level or types of exposure to market factors. Central to those strategies are features inherent in derivatives that make them more attractive for this purpose than equity or debt securities; they require little or no initial cash investment, they can focus exposure on only certain selected risk factors, and they may not require the ultimate receipt or delivery of the underlying security (or securities) to the contract. This may allow the Funds to pursue their objectives more quickly and efficiently than if they were to make direct purchases or sales of securities capable of affecting a similar response to market factors. 171 | October 31, 2015 . Notes to Financial Statements October 31, 2015 Cash collateral that has been pledged to cover derivative obligations of the Funds and cash collateral received from the counterparty, if any, is reported separately on the Statements of Assets and Liabilities as cash pledged as collateral and cash received as collateral, respectively. Nonâ€cash collateral pledged by the Funds, if any, is noted in the Statements of Investments. Risk of Investing in Derivatives: The Funds’ use of derivatives can result in losses due to unanticipated changes in the market risk factors and the overall market. In instances where the Funds are using derivatives to decrease, or hedge, exposures to market risk factors for securities held by the Funds, there are also risks that those derivatives may not perform as expected resulting in losses for the combined or hedged positions. Derivatives may have little or no initial cash investment relative to their market value exposure and therefore can produce significant gains or losses in excess of their cost. This use of embedded leverage allows the Fund to increase its market value exposure relative to its net assets and can substantially increase the volatility of the Funds’ performance. Additional associated risks from investing in derivatives also exist and potentially could have significant effects on the valuation of the derivative and the Funds. Typically, the associated risks are not the risks that the Funds are attempting to increase or decrease exposure to, per their investment objectives, but are the additional risks from investing in derivatives. Examples of these associated risks are liquidity risk, which is the risk that the Funds will not be able to sell or close out the derivative in a timely manner, and counterparty credit risk, which is the risk that the counterparty will not fulfill its obligation to the Funds. In addition, use of derivatives may increase or decrease exposure to the following risk factors: Equity Risk: Equity risk relates to the change in value of equity securities as they relate to increases or decreases in the general market. Associated risks can be different for each type of derivative and are discussed by each derivative type in the notes that follow. Commodity Risk: Exposure to the commodities markets may subject the Funds to greater volatility than investments in traditional securities. Prices of various commodities may also be affected by factors, such as drought, floods, weather, livestock disease, embargoes, tariffs and other regulatory developments, which are unpredictable. The prices of commodities can also fluctuate widely due to supply and demand disruptions in major producing or consuming regions. Foreign Currency Risk: Currency trading involves significant risks, including market risk, interest rate risk, country risk, counterparty credit risk and short sale risk. Market risk results from the price movement of foreign currency values in response to shifting market supply and demand. Interest rate risk arises whenever a country changes its stated interest rate target associated with its currency. Country risk arises because virtually every country has interfered with international transactions in its currency. Interest Rate Risk: Interest rate risk is the risk that fixed income securities will decline in value because of changes in interest rates. As nominal interest rates rise, the value of fixed income securities held by the Funds are likely to decrease. Securities with longer durations tend to be more sensitive to changes in interest rates, and are usually more volatile than securities. Swap Contracts: Each Fund may enter into swap transactions for hedging purposes or to seek to increase total return. At the present time, the CoreCommodity Fund primarily enters into swap transactions for the purpose of increasing total return and the ALPS Westport Hedged High Income Fund for hedging purposes. Swap agreements may be executed in a multilateral or other trade facility program, such as a registered exchange (“centrally cleared swaps”) or may be privately negotiated in the overâ€the counter market. The duration of a swap agreement typically ranges from a few weeks to more than one year. In a centrally cleared swap, immediately following execution of the swap agreement, the swap agreement is novated to a central counterparty (the “CCP”) and the Fund’s counterparty on the swap agreement becomes the CCP. Risks may arise as a result of the failure of the counterparty to the swap contract to comply with the terms of the swap contract. The loss incurred by the failure of a counterparty is generally limited to the net payment to be received by the Funds and/or the termination value at the end of the contract. Therefore, the Funds consider the creditworthiness of each counterparty to a contract in evaluating potential credit risk. Although centrally cleared swaps typically present less counterparty risk than nonâ€centrally cleared swaps, a Fund that has entered into centrally cleared swaps is subject to the risk of the failure of the CCP. Additionally, risks may arise from unanticipated movements in interest rates or in the value of the underlying reference asset or index. Entering into these agreements involves, to varying degrees, market risk, liquidity risk and elements of credit, legal and documentation risk that are not directly reflected in the amounts recognized in the Statements of Assets and Liabilities. The Funds may pay or receive cash as collateral on these contracts which may be recorded as an asset and/or liability. The Funds must set aside liquid assets, or engage in other appropriate measures, to cover its obligations under these contracts. Swaps are marked to market daily using either pricing vendor quotations, counterparty prices or model prices and the change in value, if any, is recorded as an unrealized gain or loss. 172 | October 31, 2015 . Notes to Financial Statements October 31, 2015 Upfront payments made and/or received by the Funds are recorded as an asset and/or liability and realized gains or losses are recognized ratably over the contract’s term/event, with the exception of forward starting interest rate swaps, whose realized gains or losses are recognized ratably from the effective start date. Periodic payments received or made on swap contracts are recorded as realized gains or losses. Gains or losses are realized upon termination of a swap contract and are recorded on the Statement of Operations. Total return swaps are agreements in which there is an exchange of cash flows whereby one party commits to make payments based on the total return (coupons plus capital gains/losses) of an underlying instrument in exchange for fixed or floating rate interest payments. To the extent the total return of the instrument or index underlying the transaction exceeds or falls short of the offsetting interest rate obligation, the Fund will receive a payment from or make a payment to the counterparty. Credit default swaps ("CDS") are typically twoâ€party financial contracts that transfer credit exposure between the two parties. Under a typical CDS, one party (the "seller") receives preâ€determined periodic payments from the other party (the "buyer"). The seller agrees to make compensating specific payments to the buyer if a negative credit event occurs, such as the bankruptcy or default by the issuer of the underlying debt instrument. Swap agreements held at October 31, 2015 are disclosed after the Statement of Investments. The average notional amount of the swap positions held in the ALPS | CoreCommodity Management CompleteCommodities® Strategy Fund and the ALPS | Westport Resources Hedged High Income Fund for the Fiscal Year Ended October 31, 2015 was $506,124 and $(1,409,583), respectively. Futures: Each Fund may invest in futures contracts in accordance with their investment objectives. Each Fund does so for a variety of reasons including for cash management, hedging or nonâ€hedging purposes in an attempt to achieve the Fund’s investment objective. A futures contract provides for the future sale by one party and purchase by another party of a specified quantity of the security or other financial instrument at a specified price and time. A futures contract on an index is an agreement pursuant to which two parties agree to take or make delivery of an amount of cash equal to the difference between the value of the index at the close of the last trading day of the contract and the price at which the index contract was originally written. Futures transactions may result in losses in excess of the amount invested in the futures contract. There can be no guarantee that there will be a correlation between price movements in the hedging vehicle and in the portfolio securities being hedged. An incorrect correlation could result in a loss on both the hedged securities in a Fund and the hedging vehicle so that the portfolio return might have been greater had hedging not been attempted. There can be no assurance that a liquid market will exist at a time when a Fund seeks to close out a futures contract or a futures option position. Lack of a liquid market for any reason may prevent a Fund from liquidating an unfavorable position, and the Fund would remain obligated to meet margin requirements until the position is closed. In addition, a Fund could be exposed to risk if the counterparties to the contracts are unable to meet the terms of their contracts. With exchange traded futures, there is minimal counterparty credit risk to the Funds since futures are exchange traded and the exchange’s clearinghouse, as counterparty to all exchange traded futures, guarantees the futures against default. When a purchase or sale of a futures contract is made by a Fund, the Fund is required to deposit with its custodian (or broker, if legally permitted) a specified amount of liquid assets (“initial margin”). The margin required for a futures contract is set by the exchange on which the contract is traded and may be modified during the term of the contract. The initial margin is in the nature of a performance bond or good faith deposit on the futures contract that is returned to a Fund upon termination of the contract, assuming all contractual obligations have been satisfied. Each day a Fund may pay or receive cash, called “variation margin,” equal to the daily change in value of the futures contract. Such payments or receipts are recorded for financial statement purposes as unrealized gains or losses by a Fund. Variation margin does not represent a borrowing or loan by a Fund but is instead a settlement between a Fund and the broker of the amount one would owe the other if the futures contract expired. When the contract is closed, a Fund records a realized gain or loss equal to the difference between the value of the contract at the time it was opened and the value at the time it was closed. The average number of futures contracts held in the ALPS | CoreCommodity Management CompleteCommodities® Strategy Fund, the ALPS | Westport Resources Hedged High Income Fund and the ALPS | WMC Research Value Fund for the Fiscal Year Ended October 31, 2015 was 246 contracts, 38 contacts and 4 contracts, respectively. Forward Foreign Currency Contracts: The ALPS | Westport Resources Hedged High Income Fund (the “Fund”) invests in foreign currency exchange contracts to reduce the risks of fluctuating exchange rates and to generate returns uncorrelated to the other strategies employed. A forward foreign currency exchange contract involves an obligation to purchase or sell a specific currency at a future date, which may be a fixed number of days from the date of the contract agreed upon by the parties, at a price set at the time of the contract. By entering into a forward foreign currency exchange contract, the Fund “locks in” the exchange rate between the currency it will deliver and the currency it will receive for the duration of the contract. As a result, the Fund reduces its exposure to changes in the value of the currency it will deliver and increases its exposure to changes in the value of the currency it will exchange into. The Fund may enter into these contracts for the purpose of hedging against foreign exchange risk arising from the Fund’s investment or anticipated investment in securities denominated in foreign currencies. The Fund also may enter into these contracts for purposes of increasing exposure to a foreign currency or to shift exposure to foreign currency fluctuations from one country to another. The Fund may use one currency (or a basket of currencies) to hedge against adverse changes in the value of another currency (or a basket of currencies) when exchange rates 173 | October 31, 2015 . Notes to Financial Statements October 31, 2015 between the two currencies are positively correlated. The unrealized appreciation/(depreciation) is reported in the Statement of Assets and Liabilities as receivable or payable and in the Statement of Operations within the change in unrealized appreciation/(depreciation). At contract close, the difference between the original cost of the contract and the value at the close date is recorded as a realized gain/(loss) in the Statement of Operations. As of October 31, 2015, the Fund held forward foreign currency contracts with net unrealized appreciation of $9,560. For the fiscal year the average exposure for the Fund was $(4,336). Option Contracts: Each Fund may enter into options transactions for hedging purposes and for nonâ€hedging purposes such as seeking to enhance return. Each Fund may write covered put and call options on any stocks or stock indices, currencies traded on domestic and foreign securities exchanges, or futures contracts on stock indices, interest rates and currencies traded on domestic and, to the extent permitted by the CFTC, foreign exchanges. A written call option on an asset by a Fund obligates the Fund to sell the specified asset to the holder (purchaser) at a stated price (the exercise price) if the option is exercised before a specified date (the expiration date). A written put option on an asset by a Fund obligates the Fund to buy the specified asset from the purchaser at the exercise price if the option is exercised before the expiration date. Premiums received when writing options are recorded as liabilities and are subsequently adjusted to the current value of the options written. Premiums received from writing options that expire are treated as realized gains. Premiums received from writing options, which are either exercised or closed, are offset against the proceeds received or amount paid on the transaction to determine realized gains or losses which are recorded on the Statement of Operations. The Funds had the following transactions in written covered call/put options during the Fiscal Year Ended October 31, 2015: Number of Contracts Premiums Received ALPS | CoreCommodity Management CompleteCommodities® Strategy Fund Options Outstanding, at the beginning of the period (536) $ 1,186,481 Options written (1,765) 3,157,224 Options closed 1023 (2,861,660) Options exercised 8 (9,999) Options expired 295 (329,997) Options Outstanding, at October 31, 2015 (975) $ 1,142,049 174 | October 31, 2015 . Notes to Financial Statements October 31, 2015 Derivatives Instruments: The following tables disclose the amounts related to each Fund’s use of derivative instruments. The effect of derivatives instruments on the Statement of Assets and Liabilities as of October 31, 2015: Risk Exposure Asset Location Fair Value Liability Location Fair Value ALPS | CoreCommodity Management CompleteCommodities® Strategy Fund(a) Equity Contracts (Purchased Options) Investments, at value 7,250 N/A N/A $ $ Equity Contracts (Written Options) N/A N/A Written options, at value 2,468,252 Unrealized depreciation Commodity Contracts Unrealized appreciation on (b) 804,065 on futures contracts (b) 1,034,894 (Futures Contracts) futures contracts Unrealized depreciation Commodity Contracts Unrealized appreciation on on total return swap (Total Return Swap Contracts) total return swap contracts 3,728,584 contracts 341,788 Total $ 4,539,899 $ 3,844,934 ALPS | Westport Resources Hedged High Income Fund Unrealized depreciation Interest Rate Contracts Unrealized appreciation on (c) $ 1,807 on futures contracts (c) $ (45,631) (Futures Contracts) futures contracts Unrealized depreciation Interest Rate Contracts on centrally cleared (Credit Default Swap Contracts) N/A N/A swap contracts (d) (52,685) Unrealized appreciation on Unrealized depreciation Foreign Exchange Rate Contracts forward foreign currency on forward foreign (Forward Foreign Currency Contracts) 10,439 (879) contracts currency contracts Total $ 12,246 $ (99,195) ALPS | WMC Research Value Fund Equity Contracts Unrealized depreciation (Futures Contracts) N/A $ – on futures contracts (c) $ 55,456 Total – 55,456 $ $ (a) The ALPS | CoreCommodity Management CompleteCommodities® Strategy Fund consolidates the statements of assets and liabilities. (b) Represents cumulative appreciation (depreciation) of futures contracts as reported in the Consolidated Statement of Investments. Only the current day's net variation margin is reported within the Consolidated Statement of Assets and Liabilities. (c) Represents cumulative appreciation (depreciation) of futures contracts as reported in the Statement of Investments. Only the current day's net variation margin is reported within the Statement of Assets and Liabilities. (d) Represents cumulative appreciation (depreciation) of credit default swap contracts as reported in the Statement of Investments. Only the current day's net variation margin is reported within the Statement of Assets and Liabilities. 175 | October 31, 2015 .
Notes to Financial Statements October 31, 2015 The effect of derivatives instruments on the Statement of Operations for the Fiscal Year Ended October 31, 2015: Realized Gain/(Loss) Change in Unrealized on Derivatives Appreciation/(Depreciation) on Derivatives Recognized in Recognized Risk Exposure Statement of Operations Location in Income Income ALPS | CoreCommodity Management CompleteCommodities® Strategy Fund(a) Equity Contracts Net realized loss on investments/Net change in (Purchased Options) unrealized appreciation on investments (1,219,808) $ (956,683) $ Equity Contracts Net realized gain on written options/Net change (Written Options) in unrealized (depreciation) on written 1,666,342 (1,573,724) options Commodity and Equity Contracts Net realized loss on futures contracts/Net (Futures Contracts) change in unrealized appreciation on futures contracts (2,057,904) 926,594 Commodity Contracts Net realized loss on total return swap (Total Return Swap Contracts) contracts/Net change in unrealized appreciation on total return swap contracts (88,888,724) 9,468,760 Total $ (90,500,094) $ 7,864,947 ALPS | Westport Resources Hedged High Income Fund Interest Rate Contracts Net realized loss on futures contracts/Net (Futures Contracts) change in unrealized depreciation on futures contracts (149,102) $ (15,041) $ Interest Rate Contracts Net realized gain on credit default swap (Credit Default Swap Contracts) contracts/Net change in unrealized depreciation on credit default swap 6,183 (42,011) contracts Foreign Exchange Rate Contracts Net realized gain on foreign currency (Forward Foreign Currency transactions/Net change in unrealized Contracts) depreciation on translation of assets and liabilities denominated in foreign currencies 9,560 and forward foreign currency contracts 16,934 Total $ (125,985) $ (47,492) ALPS | WMC Research Value Fund Equity Contracts Net realized loss on futures contracts/Net (Futures Contracts) change in unrealized depreciation on futures contracts 103,218 $ 55,456 $ Total 103,218 $ 55,456 $ (a) The ALPS | CoreCommodity Management CompleteCommodities® Strategy Fund consolidates the statements of operations. 176 | October 31, 2015 . Notes to Financial Statements October 31, 2015 Certain derivative contracts are executed under either standardized netting agreements or, for exchangeâ€traded derivatives, the relevant contracts for a particular exchange which contain enforceable netting provisions. A derivative netting arrangement creates an enforceable right of setâ€off that becomes effective, and affects the realization of settlement on individual assets, liabilities and collateral amounts, only following a specified event of default or early termination. Default events may include the failure to make payments or deliver securities timely, material adverse changes in financial condition or insolvency, the breach of minimum regulatory capital requirements, or loss of license, charter or other legal authorization necessary to perform under the contract. The following table presents financial instruments that are subject to enforceable netting arrangements or other similar agreements as of October 31, 2015: Offsetting of Derivatives Asset October 31, 2015 Gross Amounts Net Amounts Offset in the Statement of Presented in the Statement of Assets Assets and Gross Amounts of Financial Liabilities Description Recognized Assets and Liabilities Instruments(a) ALPS | CoreCommodity Management CompleteCommodities® Strategy Fund Total Return Swap Contracts $ 3,728,584 $ – $ 3,728,584 $ (341,788) Total $ 3,728,584 $ – $ 3,728,584 $ (341,788) Offsetting of Derivatives Liability October 31, 2015 Gross Amounts Net Amounts Offset in the Statement of Gross Amounts of Presented in the Statement of Assets Assets and Recognized Financial Liabilities Liabilities Description and Liabilities Instruments(a) ALPS | CoreCommodity Management CompleteCommodities® Strategy Fund Total Return Swap Contracts $ 341,788 $ – $ 341,788 $ (341,788) Total $ 341,788 $ – $ 341,788 $ (341,788) (a) Cash Collateral Received(a) $ $ Net Amount – $ – $ 3,386,796 3,386,796 Gross Amounts Not Offset in the Statement of Financial Position Offset in the Statement of Financial Position Gross Amounts Not Cash Collateral Pledged(a) $ $ Net Amount – $ – $ – – These amounts are limited to the derivative asset/liability balance and, accordingly, do not include excess collateral received/pledged. 4. TAX BASIS INFORMATION Tax Basis of Distributions to Shareholders: The character of distributions made during the year from net investment income or net realized gains may differ from its ultimate characterization for federal income tax purposes. Also, due to the timing of dividend distributions, the fiscal year in which amounts are distributed may differ from the fiscal year in which the income or realized gain were recorded by a Fund. The amounts and characteristics of tax basis distributions and composition of distributable earnings/(accumulated losses) are finalized at fiscal yearâ€end. 177 | October 31, 2015 . Notes to Financial Statements October 31, 2015 The tax character of distributions paid by the Funds for the Fiscal Year Ended October 31, 2015 were as follows: Fund Ordinary Income Long-Term Capital Gain ALPS | Alerian MLP Infrastructure Index Fund $ 8,391 $ – ALPS | CoreCommodity Management CompleteCommodities® Strategy Fund – 1,912,471 ALPS | Kotak India Growth Fund 422,790 245,199 ALPS | Red Rocks Listed Private Equity Fund 15,572,410 1,431,943 ALPS | Sterling ETF Tactical Rotation Fund – 126,929 ALPS | Westport Resources Hedged High Income Fund – 1,387,817 ALPS | WMC Research Value Fund 2,088,939 8,298,461 Clough China Fund 1,612,835 1,749,005 RiverFront Conservative Income Builder Fund 95,413 222,922 RiverFront Dynamic Equity Income Fund 1,736,888 1,884,705 RiverFront Global Allocation Fund 2,042,515 981,226 RiverFront Global Growth Fund 5,687,960 2,340,114 RiverFront Moderate Growth & Income Fund 4,753,671 4,696,222 $ Return of Capital 2,346,444 – – – – 14,119 – – – – – – – The tax character of distributions paid by the Funds for the Fiscal Periods Ended October 31, 2014 were as follows: Fund Ordinary Income Long-Term Capital Gain Return of Capital ALPS | Alerian MLP Infrastructure Index Fund $ 94,908 $ – $ 828,416 ALPS | Westport Resources Hedged High Income Fund 833,792 – – RiverFront Conservative Income Builder Fund – – 35,707 RiverFront Dynamic Equity Income Fund – – 355,945 RiverFront Moderate Growth & Income Fund 860,964 – – Components of Distributable Earnings on a Tax Basis: At October 31, 2015, permanent differences in book and tax accounting were reclassified. These differences had no effect on net assets and were primarily attributed to differences in the treatment of commodity related exchangeâ€traded funds, the differing tax treatment of foreign currency, investments in partnerships, Passive Foreign Investment Companies (“PFICs”) and certain other investments. For the year ended October 31, 2015, the following reclassifications, which had no impact on results of operations or net assets, were recorded to reflect tax character: Accumulated Net Accumulated Net Realized Fund Paid-in Capital Investment Income/(Loss) Gain/(Loss) on Investments ALPS | CoreCommodity Management CompleteCommodities® Strategy Fund $ (96,036,033) $ 1,735,772 $ 94,300,261 ALPS | Kotak India Growth Fund – 213,003 (213,003) ALPS | Red Rocks Listed Private Equity Fund (100) 14,788,722 (14,788,622) ALPS | Sterling ETF Tactical Rotation Fund 35,673 (1) (35,672) ALPS | Westport Resources Hedged High Income Fund 25,481 1,089 (26,570) ALPS | WMC Research Value Fund – (352,423) 352,423 Clough China Fund – 523,781 (523,781) RiverFront Conservative Income Builder Fund – (13) 13 RiverFront Dynamic Equity Income Fund – 287 (287) RiverFront Global Allocation Fund – (23) 23 RiverFront Global Growth Fund – 4,032 (4,032) 178 | October 31, 2015 . Notes to Financial Statements October 31, 2015 Included in the amounts reclassified was a net operating loss offset to Paidâ€in Capital as follows: Fund Amount ALPS | CoreCommodity Management CompleteCommodities® Strategy Fund $ 724,239 As of October 31, 2015, the components of distributable earnings on a tax basis were as follows: Accumulated net Other cumulative Net unrealized Undistributed net realized gain/(loss) effect of timing appreciation/(depreciation) Total investment income on investments differences on investments ALPS | CoreCommodity Management CompleteCommodities® Strategy Fund $ – $ (26,174,543) $ (1,597,295) $ (32,259,627) $ (60,031,465) ALPS | Kotak India Growth Fund 431,005 1,657,266 – 274,190 2,362,461 ALPS | Red Rocks Listed Private Equity Fund 17,032,280 20,597,219 (945,622) 18,168,137 54,852,014 ALPS | Sterling ETF Tactical Rotation Fund 124,311 (1,844,820) – (33,839) (1,754,348) ALPS | Westport Resources Hedged High Income Fund – (387,189) 86,951 (1,842,736) (2,142,974) ALPS | WMC Research Value Fund – 25,731,923 (55,456) 6,664,673 32,341,140 Clough China Fund 1,041,894 (1,879,455) – 7,298,298 6,460,737 RiverFront Conservative Income Builder Fund 30,131 – 41,574 79,041 7,336 92,674 1,629,180 – 1,865,520 3,587,374 RiverFront Dynamic Equity Income Fund RiverFront Global Allocation Fund 200,285 163,694 – 1,451,386 1,815,365 RiverFront Global Growth Fund 463,691 736,972 – 4,129,980 5,330,643 RiverFront Moderate Growth & Income Fund 386,905 2,955,582 – 3,035,698 6,378,185 Capital Losses: As of October 31, 2015 the following Funds had capital loss carryforwards which may reduce the Funds’ taxable income arising from future net realized gains on investments, if any, to the extent permitted by the Code and thus may reduce the amount of the distributions to shareholders which would otherwise be necessary to relieve the Funds of any liability for federal tax. Under the recently enacted Regulated Investment Company Modernization Act of 2010, capital losses incurred by each fund in tax years beginning after December 22, 2010 will not be subject to expiration. In addition, such losses must be utilized prior to the losses incurred in the years preceding enactment. Capital loss carryovers utilized during the Fiscal Year Ended October 31, 2015, were: Fund Amount ALPS | Red Rocks Listed Private Equity Fund $ 238,740 Postâ€Enactment Capital Losses*: Capital losses deferred to next tax year were as follows: Fund Short-Term Long-Term ALPS | CoreCommodity Management CompleteCommodities® Strategy Fund $ 15,065,672 $ 11,108,871 ALPS | Sterling ETF Tactical Rotation Fund – 1,844,820 ALPS | Westport Resources Hedged High Income Fund 195,569 191,620 Clough China Fund – 1,879,455 * Post-Enactment Capital Losses arise in fiscal years beginning after December 22, 2010, and exclude any election for late year capital loss (during the period November 1st to December 31st) deferred for the current fiscal year. As a result of the enactment of the Regulated Investment Company Act of 2010, pre-enactment capital loss carryforwards may be more likely to expire unused. Additionally, post-enactment capital losses that are carried forward will retain their character as either short-term or long-term losses rather than being considered all short-term as under previous law. 179 | October 31, 2015 . Notes to Financial Statements October 31, 2015 ALPS | CoreCommodity Management CompleteCommodities® Strategy Fund elected to defer to the period ending October 30, 2016, late year ordinary losses in the amount of $1,479,156. Unrealized Appreciation and Depreciation on Investments: As of October 31, 2015, the costs of investments for federal income tax purposes and accumulated net unrealized appreciation/(depreciation) on investments were as follows: Gross Cost of Net Appreciation Investments for Appreciation Gross Depreciation of Foreign Income Tax (excess of value (excess of tax cost Currency and Net Unrealized over value) over tax cost) Purposes Derivatives Appreciation/(Depreciation) Fund ALPS | Alerian MLP Infrastructure Index Fund $ 11,060 $ (6,368,130) $ ALPS | CoreCommodity Management CompleteCommodities® Strategy Fund 7,331,351 (41,414,781) ALPS | Kotak India Growth Fund 1,705,497 (1,430,230) ALPS | Red Rocks Listed Private Equity Fund 43,772,950 (25,574,426) ALPS | Sterling ETF Tactical Rotation Fund – (33,839) ALPS | Westport Resources Hedged High 190,564 (1,946,192) Income Fund ALPS | WMC Research Value Fund 10,970,611 (4,361,394) Clough China Fund 9,421,116 (2,122,471) RiverFront Conservative Income Builder Fund 169,726 (128,152) RiverFront Dynamic Equity Income Fund 3,242,813 (1,377,293) RiverFront Global Allocation Fund 2,186,787 (735,401) RiverFront Global Growth Fund 5,333,055 (1,203,075) RiverFront Moderate Growth & Income Fund 4,801,817 (1,766,119) – $ 1,823,803 (1,076) (30,387) – (32,259,627) 274,190 18,168,137 (33,839) (87,108) 55,456 (347) (1,842,736) 6,664,673 7,298,298 – – – – – (6,357,070) 41,574 1,865,520 1,451,386 4,129,980 3,035,698 $ 33,054,004 426,565,477 16,055,283 485,484,735 34,764,049 21,658,794 90,769,994 61,328,774 12,271,142 75,216,522 44,203,724 76,743,234 138,766,592 Deferred Tax Asset/Liability for ALPS | Alerian MLP Infrastructure Index Fund Since the ALPS | Alerian MLP Infrastructure Index Fund (the “Fund” for purposes of this section) will be subject to taxation on its taxable income, the NAV of Fund shares will also be reduced by the accrual of any deferred tax liabilities. The Index however is calculated without any adjustments for taxes. As a result, the Fund’s after tax performance could differ significantly from the Index even if the pretax performance of the Fund and the performance of the Index are closely correlated. Cash distributions from MLPs to the ALPS | Alerian MLP Infrastructure Index Fund that exceed such Fund’s allocable share of such MLP’s net taxable income are considered a taxâ€deferred return of capital that will reduce the Fund’s adjusted tax basis in the equity securities of the MLP. These reductions in such Fund’s adjusted tax basis in the MLP equity securities will increase the amount of gain (or decrease the amount of loss) recognized by the Fund on a subsequent sale of the securities. The Fund will accrue deferred income taxes for any future tax liability associated with (i) that portion of MLP distributions considered to be a taxâ€deferred return of capital as well as (ii) capital appreciation of its investments. Upon the sale of an MLP security, the Fund may be liable for previously deferred taxes. The Fund will rely to some extent on information provided by the MLPs, which is not necessarily timely, to estimate deferred tax liability for purposes of financial statement reporting and determining the NAV. From time to time, ALPS Advisors, Inc. will modify the estimates or assumptions related to the Fund’s deferred tax liability as new information becomes available. The Fund will generally compute deferred income taxes based on the marginal regular federal income tax rate applicable to corporations and an assumed rate attributable to state taxes. The Fund’s income tax expense/(benefit) consists of the following: October 31, 2015 Current Deferred Total Federal $ $ (3,631,518) $ (3,637,172) (5,654) State 510 (213,335) (212,825) Valuation Allowance – 2,724,889 2,724,889 Total tax expense $ (1,119,964) $ (1,125,108) (5,144) $ 180 | October 31, 2015 . Notes to Financial Statements October 31, 2015 October 31, 2014 Federal State Total tax expense $ $ Current 6,396 262 6,658 $ $ Deferred 421,789 19,945 441,734 $ $ Total 428,185 20,207 448,392 Deferred income taxes reflect the net tax effect of temporary differences between the carrying amounts of assets and liabilities for financial reporting and tax purposes. Components of the Fund’s deferred tax assets and liabilities are as follows: As of October 31, 2015 Nonâ€current Deferred tax assets: Net unrealized loss on investment securities $ 2,288,555 Net Operating Loss Carryforward 435,186 Other 1,147 Less Valuation Allowance (2,724,888) Net Deferred tax asset $ – As of October 31, 2014 Nonâ€current Deferred tax liabilities: Net unrealized gain on investment securities $ (1,121,336) Other 1,370 Net Deferred tax liability $ (1,119,966) The net operating loss carryforward is available to offset future taxable income. The net operating loss can be carried forward for 20 years and, accordingly, would begin to expire as of October 31, 2035. The Fund has net operating loss carryforwards for federal income tax purposes as follows: Year-Ended Amount Expiration 10/31/2015 $1,208,851 10/31/2035 The Fund reviews the recoverability of its deferred tax assets based upon the weight of available evidence. When assessing the recoverability of its deferred tax assets, significant weight was given to the effects of potential future realized and unrealized gains on investments and the period over which these deferred tax assets can be realized. Any capital losses that may be generated by the Fund are eligible to be carried back up to three years and can be carried forward for five years to offset capital gains recognized by the fund in those years. Net operating losses that may be generated by the Fund are eligible to be carried back up to two years and can be carried forward for 20 years to offset income generated by the Fund in those years. Currently, the Fund intends to waive its carry back period for any net operating loss generated for the year ended October 31, 2015. To the extent the Fund has a deferred tax asset, consideration is given to whether or not a valuation allowance, which would offset the value of some or all of the deferred tax asset balance, is required. A valuation allowance is required if based on the evaluation criterion provided by Accounting Standards Codification (“ASC”) 740, Income Taxes (ASC 740) it is more likely than not that some portion, or all, of the deferred tax asset will not be realized. The factors considered in assessing the Fund’s valuation allowance include: the nature, frequency and severity of current and cumulative losses, the duration of the statutory carryforward periods and the associated risks that operating and capital loss carryforwards may expire unutilized. From time to time, as new information becomes available, the Fund will modify its estimates or assumptions regarding the deferred tax liability or asset. As of the balance sheet date, Fund Management has assessed that it is not more likely than not that a portion of the deferred tax assets will be realized through future taxable income of the appropriate character. Accordingly, a valuation allowance has been established for that portion of the Fund’s deferred tax assets. The Fund will continue to assess the need for a valuation allowance in the future. Significant increases in the fair value of its portfolio of investments or other factors may change the Fund’s assessment of the recoverability of these assets and may result in the removal of the valuation allowance against all or a portion of the Fund’s gross deferred tax assets. 181 | October 31, 2015 . Notes to Financial Statements October 31, 2015 Total income tax benefit (current and deferred) differs from the amount computed by applying the federal statutory income tax rate of 34% to net investment and realized and unrealized gain/(losses) on investment before taxes as follows: For the Year Ended October 31, 2015 Income tax expense at statutory rate $ (3,631,596) State income taxes (net of federal benefit) (213,624) Permanent differences, net (4,388) Change in estimated state referral rate 285 Other (674) Valuation Allowance 2,724,888 Net income tax expense/(benefit) $ (1,125,109) For the Fiscal Period Ended October 31, 2014 Income tax expense at statutory rate $ 431,788 State income taxes (net of federal benefit) 24,966 Change in estimated state referral rate (5,005) Other (3,357) Net income tax expense/(benefit) $ 448,392 The following is a tabular reconciliation of the total amounts of unrecognized tax benefits: October 31, 2015 Unrecognized tax benefit †Beginning $ – Gross increases †tax positions in prior period – Gross decreases †tax positions in prior period – Gross increases †tax positions in current period – Settlement – Lapse of statute of limitations – Net income tax expense $ – October 31, 2014 Unrecognized tax benefit †Beginning $ – Gross increases †tax positions in prior period – Gross decreases †tax positions in prior period – Gross increases †tax positions in current period – Settlement – Lapse of statute of limitations – Net income tax expense – $ The Fund recognizes interest accrued related to unrecognized tax benefits and penalties as income tax expense. The Fund had no accrued penalties or interest for the Fiscal Year Ended October 31, 2015. The Fund recognizes the tax benefits of uncertain tax positions only where the position is “more likely than not” to be sustained assuming examination by tax authorities. Management has analyzed the Fund’s tax positions, and has concluded that no liability for unrecognized tax benefits should be recorded related to uncertain tax positions taken on U.S. tax returns and state tax returns filed since inception of the fund. No U.S. federal or state income tax returns are currently under examination. Due to the nature of the Fund’s investments, the Fund may be required to file income tax returns in several states. The Fund is not aware of any tax positions for which it is reasonably possible that the total amounts of unrecognized tax benefits will change materially in the next 12 months. 182 | October 31, 2015 . Notes to Financial Statements October 31, 2015 5. SECURITIES TRANSACTIONS Purchases and sales of securities, excluding shortâ€term securities and U.S. Government Obligations during the Fiscal Year Ended October 31, 2015 were as follows: Proceeds from Sales of Fund Purchases of Securities Securities ALPS | Alerian MLP Infrastructure Index Fund $ 29,315,988 $ 15,177,835 ALPS | CoreCommodity Management CompleteCommodities® Strategy Fund(a) 148,152,892 122,993,502 ALPS | Kotak India Growth Fund(b) 11,516,335 10,267,459 ALPS | Red Rocks Listed Private Equity Fund 189,945,677 181,664,686 ALPS | Sterling ETF Tactical Rotation Fund 147,057,748 123,285,846 ALPS | Westport Resources Hedged High Income Fund 18,143,515 20,347,517 114,981,842 123,026,768 ALPS | WMC Research Value Fund Clough China Fund 157,962,270 157,184,149 RiverFront Conservative Income Builder Fund 18,931,891 15,803,880 RiverFront Dynamic Equity Income Fund 61,736,089 52,180,237 RiverFront Global Allocation Fund 36,107,303 27,345,706 RiverFront Global Growth Fund 60,097,665 53,819,814 RiverFront Moderate Growth & Income Fund 154,258,601 150,026,561 Purchases and sales of U.S. Government Obligations during the Fiscal Year Ended October 31, 2015 were as follows: Proceeds from Sales of Fund Purchases of Securities Securities ALPS | CoreCommodity Management CompleteCommodities® Strategy Fund $ 106,275,664 $ 72,269,360 ALPS | Westport Resources Hedged High Income Fund 9,575 9,971 (a) Purchases and sales for ALPS | CoreCommodity Management CompleteCommodities® Strategy Fund are consolidated and include the balances of CoreCommodity Management Cayman Commodity Fund, Ltd. (wholly owned subsidiary). (b) Purchases and sales for ALPS | Kotak India Growth Fund are consolidated and include the balances of Kotak Mauritius Portfolio (wholly owned subsidiary). 6. BENEFICIAL INTEREST TRANSACTIONS Shares redeemed within 90 days of purchase for ALPS | Red Rocks Listed Private Equity Fund and 30 days of purchase for ALPS | CoreCommodity Management CompleteCommodities® Strategy Fund, ALPS | Kotak India Growth Fund, and Clough China Fund, may incur a 2% shortâ€term redemption fee deducted from the redemption amount. In addition, shares redeemed within 30 days of purchase for the ALPS | Sterling ETF Tactical Rotation Fund may incur a 1% shortâ€term redemption fee. The ALPS | Alerian MLP Infrastructure Index Fund, ALPS | Westport Resources Hedged High Income Fund, ALPS | WMC Research Value Fund, RiverFront Conservative Income Builder Fund, RiverFront Dynamic Equity Income Fund, RiverFront Global Allocation Fund, RiverFront Global Growth Fund, and RiverFront Moderate Growth & Income Fund shares do not incur redemption fees. 183 | October 31, 2015 . Notes to Financial Statements October 31, 2015 For the Fiscal Year Ended October 31, 2015, the amounts listed below were retained by the Funds. These amounts are reflected in “Shares redeemed” in the Statements of Changes in Net Assets. Redemption Fee Retained For the Fiscal For the Year Ended Periods Ended For the Year Ended Fund October 31, 2015 October 31, 2014 April 30, 2014 ALPS | CoreCommodity Management CompleteCommodities® Strategy Fund †Class A $ 8,433 $ 2,815 $ 28,999 ALPS | CoreCommodity Management CompleteCommodities® Strategy Fund †Class C 106 19 55 ALPS | CoreCommodity Management CompleteCommodities® Strategy Fund †Class I 77,754 5,450 15,328 ALPS | Kotak India Growth Fund †Class A 684 346 1,100 ALPS | Kotak India Growth Fund †Class C – 142 – ALPS | Kotak India Growth Fund †Class I 10,529 402 – ALPS | Red Rocks Listed Private Equity Fund †Class A 28,724 23,046 15,705 ALPS | Red Rocks Listed Private Equity Fund †Class C 5,076 1,464 472 ALPS | Red Rocks Listed Private Equity Fund †Class I 54,952 37,095 46,273 ALPS | Red Rocks Listed Private Equity Fund †Class R 60 1,022 – 98 – ALPS | Sterling ETF Tactical Rotation Fund †Class A 401 ALPS | Sterling ETF Tactical Rotation Fund †Class I 348 – – Clough China Fund †Class A 2,852 1,558 9,336 Clough China Fund †Class C 56 12 145 Clough China Fund †Class I 138,993 905 7,776 Transactions in shares of capital stock were as follows: ALPS | Alerian MLP Infrastructure Index Fund For the For the For the Fiscal Year Ended Year Ended Period Ended April 30, 2014 October 31, 2015 October 31, 2014(a) Class A Shares sold 1,259,572 288,018 840,863 Dividends reinvested 123,898 37,693 22,014 Shares redeemed (427,258) (119,831) (214,096) Net increase in shares outstanding 956,212 205,880 648,781 Class C Shares sold 818,801 301,736 307,622 Dividends reinvested 80,720 15,834 5,355 Shares redeemed (402,241) (21,671) (56,783) Net increase in shares outstanding 497,280 295,899 256,194 Class I Shares sold 735,624 448,719 149,751 Dividends reinvested 48,740 19,256 10,785 Shares redeemed (786,515) (15,903) (229,611) Net increase/(decrease) in shares outstanding (2,151) 452,072 (69,075) 184 | October 31, 2015 . Notes to Financial Statements October 31, 2015 Class A Shares sold Dividends reinvested Shares redeemed Net increase/(decrease) in shares outstanding Class C Shares sold Dividends reinvested Shares redeemed Net increase/(decrease) in shares outstanding Class I Shares sold Dividends reinvested Shares redeemed Net increase in shares outstanding Class A Shares sold Dividends reinvested Shares redeemed Net increase/(decrease) in shares outstanding Class C Shares sold Dividends reinvested Shares redeemed Net increase/(decrease) in shares outstanding Class I Shares sold Dividends reinvested Shares redeemed Net increase/(decrease) in shares outstanding ALPS | CoreCommodity Management CompleteCommodities® Strategy Fund For the For the For the Fiscal Year Ended Year Ended Period Ended April 30, 2014 October 31, 2015 October 31, 2014(a) 2,262,826 2,009,784 7,651,538 – – – (2,238,826) (8,184,764) (7,315,182) 336,356 24,000 (6,174,980) 518,739 325,208 566,736 – – – (659,903) (297,385) (1,145,365) (141,164) (578,629) 27,823 38,810,785 21,543,668 22,908,918 209,271 – – (29,430,269) (4,926,582) (16,450,540) 9,589,787 16,617,086 6,458,378 ALPS | Kotak India Growth Fund For the For the For the Fiscal Year Ended Year Ended Period Ended April 30, 2014 October 31, 2015 October 31, 2014(a) 275,925 237,553 276,089 – – 17,640 (242,799) (339,968) (248,518) (102,415) 50,766 27,571 81,887 46,251 41,102 – – 4,439 (41,866) (19,484) (50,514) (9,412) 44,460 26,767 356,462 526,457 36,244 – 26,939 964 (385,524) (46,610) (68,589) (2,123) 479,847 (31,381) 185 | October 31, 2015 . Notes to Financial Statements October 31, 2015 Class A Shares sold Dividends reinvested Shares redeemed Net increase/(decrease) in shares outstanding Class C Shares sold Dividends reinvested Shares redeemed Net increase in shares outstanding Class I Shares sold Dividends reinvested Shares redeemed Net increase in shares outstanding Class R Shares sold Dividends reinvested Shares redeemed Net increase in shares outstanding ALPS | Red Rocks Listed Private Equity Fund For the For the For the Fiscal Year Ended Year Ended Period Ended October 31, 2015 October 31, 2014(a) April 30, 2014 10,981,499 8,719,848 15,978,340 1,033,219 – 1,603,325 (14,218,098) (7,255,050) (5,633,930) (2,203,380) 1,464,798 11,947,735 870,902 1,066,330 1,074,269 – 64,156 55,528 (655,615) (179,224) (88,700) 279,443 887,106 1,041,097 18,816,997 14,082,200 14,171,110 659,785 – 657,933 (14,723,024) (5,365,813) (8,859,864) 4,753,758 8,716,387 5,969,179 439,998 75,154 56,083 – 7,077 3,972 (80,417) (13,616) (8,484) 366,658 61,538 51,570 Class A Shares sold Dividends reinvested Shares redeemed Net increase in shares outstanding Class C Shares sold Dividends reinvested Shares redeemed Net increase in shares outstanding Class I Shares sold Dividends reinvested Shares redeemed Net increase in shares outstanding 186 | October 31, 2015 ALPS | Sterling ETF Tactical Rotation Fund For the Period For the July 1, 2014 Year Ended (Commencement) to October 31, 2015 October 31, 2014 1,594,176 536,342 – 4,852 (633,557) (8,719) 965,471 527,623 248,835 54,102 336 – (35,100) (816) 214,071 53,286 1,466,642 747,556 – 5,410 (323,715) (816) 1,148,337 735,136 . Notes to Financial Statements October 31, 2015 Class A Shares sold Dividends reinvested Shares redeemed Net increase/(decrease) in shares outstanding Class C Shares sold Dividends reinvested Shares redeemed Net increase/(decrease) in shares outstanding Class I Shares sold Dividends reinvested Shares redeemed Net increase in shares outstanding Class A Shares sold Dividends reinvested Shares redeemed Net increase/(decrease) in shares outstanding Class C Shares sold Dividends reinvested Shares redeemed Net increase in shares outstanding Class I Shares sold Dividends reinvested Shares redeemed Net increase/(decrease) in shares outstanding ALPS | Westport Resources Hedged High Income Fund For the Period For the January 1, 2014 Year Ended (Commencement) to October 31, 2015 October 31, 2014 64,145 434,199 18,525 8,382 (170,579) (17,428) (87,909) 425,153 – 171,830 6,413 3,301 (88,926) (14,038) (82,513) 161,093 1,999,490 703,861 119,016 44,725 (697,239) (124,519) 1,919,696 125,638 ALPS | WMC Research Value Fund For the For the For the Fiscal Year Ended Year Ended Period Ended April 30, 2014 October 31, 2015 October 31, 2014(a) 155,776 222,748 12,637 485,238 – 100,951 (590,531) (212,255) (381,282) (199,618) (57,583) 50,483 142,521 9,584 2,541 1,762 – 187 (88,229) – (1,585) 56,054 9,584 1,143 278,507 139,366 475,904 380,975 – 85,611 (605,101) (423,706) (751,779) (284,340) (190,264) 54,381 187 | October 31, 2015 . Notes to Financial Statements October 31, 2015 Class A Shares sold Dividends reinvested Shares redeemed Net decrease in shares outstanding Class C Shares sold Dividends reinvested Shares redeemed Net decrease in shares outstanding Class I Shares sold Dividends reinvested Shares redeemed Net increase in shares outstanding Class A Shares sold Dividends reinvested Shares redeemed Net increase/(decrease) in shares outstanding Class C Shares sold Dividends reinvested Shares redeemed Net increase in shares outstanding Class I Shares sold Dividends reinvested Shares redeemed Net increase/(decrease) in shares outstanding For the Year Ended October 31, 2015 388,837 38,495 (563,454) (136,122) 170,382 11,566 (194,090) (12,142) 1,506,104 45,342 (1,521,537) 29,909 Clough China Fund For the Fiscal Period Ended October 31, 2014(a) 146,054 – (351,151) (205,097) 40,370 – (71,486) (31,116) 356,849 – (275,489) 81,360 For the Year Ended April 30, 2014 620,113 17,364 (658,438) (20,961) 192,333 983 (239,921) (46,605) 791,750 7,137 (404,998) 393,889 RiverFront Conservative Income Builder Fund For the For the For the Fiscal Year Ended Year Ended Period Ended October 31, 2015 October 31, 2014(a) April 30, 2014 68,088 20,788 51,708 2,235 339 827 (71,287) (22,586) (8,730) (1,459) (964) 43,805 487,979 113,010 237,894 14,535 1,180 6,490 (136,754) (30,896) (78,476) 365,760 165,908 83,294 168,227 170,292 188,828 7,413 1,236 3,830 (229,291) (36,589) (132,582) (53,651) 134,939 60,076 188 | October 31, 2015 . Notes to Financial Statements October 31, 2015 Class A Shares sold Dividends reinvested Shares redeemed Net increase in shares outstanding Class C Shares sold Dividends reinvested Shares redeemed Net increase in shares outstanding Class I Shares sold Dividends reinvested Shares redeemed Net increase in shares outstanding Class A Shares sold Dividends reinvested Shares redeemed Net increase/(decrease) in shares outstanding Class C Shares sold Dividends reinvested Shares redeemed Net increase in shares outstanding Class I Shares sold Dividends reinvested Shares redeemed Net increase in shares outstanding RiverFront Dynamic Equity Income Fund For the For the For the Fiscal Year Ended Year Ended Period Ended October 31, 2015 October 31, 2014(a) April 30, 2014 486,948 298,200 601,943 68,595 7,788 36,711 (308,287) (173,465) (113,937) 247,256 132,523 524,717 878,269 543,597 859,238 114,440 6,068 65,716 (522,786) (232,754) (241,047) 469,923 316,911 683,907 639,114 268,460 794,021 79,298 10,588 54,114 (517,459) (83,369) (291,301) 200,953 195,679 556,834 RiverFront Global Allocation Fund For the For the For the Fiscal Year Ended Year Ended Period Ended October 31, 2015 October 31, 2014(a) April 30, 2014 187,353 145,922 53,535 – 54,813 21,838 (186,115) (117,670) (157,419) (64,135) 56,051 10,341 445,383 131,314 460,035 – 94,535 26,360 (253,151) (131,094) (164,939) 286,767 321,456 220 732,674 247,340 357,419 – 91,727 24,973 (259,448) (74,901) (126,577) 564,953 172,439 255,815 189 | October 31, 2015 . Notes to Financial Statements October 31, 2015 Class A Shares sold Dividends reinvested Shares redeemed Net increase in shares outstanding Class C Shares sold Dividends reinvested Shares redeemed Net increase/(decrease) in shares outstanding Class I Shares sold Dividends reinvested Shares redeemed Net increase in shares outstanding Class L Shares sold Dividends reinvested Shares redeemed Net increase/(decrease) in shares outstanding Investor Class Shares sold Dividends reinvested Shares redeemed Net decrease in shares outstanding Class A Shares sold Dividends reinvested Shares redeemed Net increase/(decrease) in shares outstanding Class C Shares sold Dividends reinvested Shares redeemed Net increase in shares outstanding Class I Shares sold Dividends reinvested Shares redeemed Net increase in shares outstanding RiverFront Global Growth Fund For the For the For the Fiscal Year Ended Year Ended Period Ended October 31, 2015 October 31, 2014(a) April 30, 2014 461,853 274,216 711,148 126,977 – 73,149 (357,314) (270,395) (279,502) 231,516 504,795 3,821 299,191 332,183 71,276 – 86,034 60,174 (193,028) (83,298) (114,858) 192,197 (12,022) 277,499 539,263 141,152 312,894 – 96,480 75,213 (325,705) (54,618) (135,371) 310,038 252,736 86,534 381,064 208,438 91,284 186,091 – 156,519 (278,706) (157,229) (297,731) 288,449 (65,945) 67,226 18,530 4,306 17,783 – 54,628 52,483 (79,199) (49,732) (138,604) (6,041) (45,426) (68,338) RiverFront Moderate Growth & Income Fund For the For the For the Fiscal Year Ended Year Ended Period Ended October 31, 2015 October 31, 2014(a) April 30, 2014 366,429 346,863 929,036 148,964 131,056 15,435 (660,624) (679,187) (964,205) (145,231) (316,889) 95,887 1,473,735 637,442 1,598,320 331,196 231,095 18,215 (1,084,631) (442,477) (1,075,044) 720,300 213,180 754,371 1,228,437 536,778 1,406,353 248,980 171,628 26,841 (905,092) (255,089) (642,198) 572,325 308,530 935,783 (a) Effective May 1, 2014, the Board approved changing the fiscal year-end of the Funds from April 30 to October 31. 190 | October 31, 2015 . Notes to Financial Statements October 31, 2015 7. AFFILIATED COMPANIES Funds may invest in certain securities that are considered securities issued by affiliated companies. As defined by the Investment Company Act of 1940, an affiliated person, including an affiliated company, is one in which a Fund owns 5% or more of the outstanding voting securities, or a company which is under common ownership or control with the Fund. The purchases, sales, dividend income, capital gains, return of capital distributions received, shares and value of investments in affiliated companies for the Fiscal Year Ended October 31, 2015 were as follows: RiverFront Conservative Income Builder Fund Security Name RiverFront Strategic Income Fund Share Balance November 1, 2014 34,106 Market Value Dividend Realized October 31, Income Loss 2015 $ 32,199 $ (7,360) $ 1,160,199 $ 32,199 $ (7,360) $ 1,160,199 Share Balance October 31, 2015 215,714 Market Value Dividend Realized October 31, Income Loss 2015 $ 181,900 $ (30,319) $ 5,315,193 $ 181,900 $ (30,319) $ 5,315,193 Sales 60,966 Share Balance October 31, 2015 39,386 Market Value Dividend Realized October 31, Income Loss 2015 $ 51,007 $ (33,482) $ 970,471 $ 51,007 $ (33,482) $ 970,471 Sales 48,502 Purchases 24,800 Share Balance October 31, 2015 47,086 Share Balance October 31, 2015 562,358 Market Value Dividend Realized October 31, Income Loss 2015 $ 495,767 $ (38,996) $13,856,501 $ 495,767 $ (38,996) $13,856,501 Sales 11,820 RiverFront Dynamic Equity Income Fund Security Name RiverFront Strategic Income Fund Share Balance November 1, 2014 142,382 Purchases 122,185 Sales 48,853 RiverFront Global Allocation Fund Security Name RiverFront Strategic Income Fund Share Balance November 1, 2014 18,764 Purchases 81,588 RiverFront Moderate Growth & Income Fund Security Name RiverFront Strategic Income Fund Share Balance November 1, 2014 489,954 Purchases 120,906 191 | October 31, 2015 . Notes to Financial Statements October 31, 2015 8. MANAGEMENT AND RELATEDâ€PARTY TRANSACTIONS ALPS Advisors, Inc. (“AAI”), subject to the authority of the Board, is responsible for the overall management of the Funds listed below. AAI has delegated daily management of the Funds listed below to the corresponding Subâ€Advisor(s) listed in the table below. Each Subâ€Advisor manages the investments of the Fund in accordance with its investment objective, policies and limitations and investment guidelines established jointly by AAI and the Board. Fund ALPS | CoreCommodity Management CompleteCommodities® Strategy Fund ALPS | Kotak India Growth Fund ALPS | Red Rocks Listed Private Equity Fund ALPS | Sterling ETF Tactical Rotation Fund ALPS | WMC Research Value Fund Clough China Fund RiverFront Conservative Income Builder Fund RiverFront Dynamic Equity Income Fund RiverFront Global Allocation Fund RiverFront Global Growth Fund RiverFront Moderate Growth & Income Fund Sub-Advisor(s) CoreCommodity Management, LLC Kotak Mahindra (UK) Limited Red Rocks Capital LLC(a) Sterling Global Strategies LLC Wellington Management Company, LLP Clough Capital Partners, LP RiverFront Investment Group, LLC RiverFront Investment Group, LLC RiverFront Investment Group, LLC RiverFront Investment Group, LLC RiverFront Investment Group, LLC (a) On July 31, 2015, Red Rocks Capital LLC was acquired by ALPS Advisers, Inc. AAI and Westport Resources Management, Inc. (“Westport Resources”) (“collectively the “Westport Coâ€Advisors”), subject to the authority of the Board, serve as coâ€investment advisors for the ALPS | Westport Resources Hedged High Income Fund (the “Westport Fund”). AAI provides fund administration services and other portfolio support services and compliance monitoring for the Westport Fund. Westport Resources manages the Fund’s investment program and selects, subject to the approval of the Board, subâ€advisors to the Fund. Westport Resources and the Trust have entered into subâ€advisory agreements with respect to the Fund with three Subâ€Advisors (the “Westport Subâ€Advisors”), Concise Capital Management, LP, Amundi Smith Breeden LLC, and Sound Point Capital Management, L.P., to manage a portion of the Fund’s assets. Pursuant to the Investment Advisory Agreement (the “Advisory Agreement”), the Funds listed below pay AAI an annual management fee which is based on each Fund’s average daily net assets. The management fee is paid on a monthly basis. The following table reflects the Funds’ contractual management fee rates (expressed as an annual rate). Fund ALPS | Alerian MLP Infrastructure Index Fund ALPS | CoreCommodity Management CompleteCommodities® Strategy Fund ALPS | Kotak India Growth Fund ALPS | Red Rocks Listed Private Equity Fund ALPS | Sterling ETF Tactical Rotation Fund ALPS | WMC Research Value Fund Clough China Fund RiverFront Conservative Income Builder Fund RiverFront Dynamic Equity Income Fund RiverFront Global Allocation Fund RiverFront Global Growth Fund RiverFront Moderate Growth & Income Fund Contractual Management Fee 0.70% 0.85% 1.25% 0.85% 0.95% 0.95%(a) 1.35% 0.85% 0.85% 0.85% 0.85% 0.85% (a) The contractual management fee is 0.95% for the first $250 million of net assets, 0.85% for the next $250 million of net assets, and 0.75% for net assets in excess of $500 million. Pursuant to the Investment Advisory Agreement between the Westport Fund and AAI, the Westport Fund pays AAI an annual management fee of the greater of (i) 0.20%, based on the Westport Fund’s average daily net assets, or (ii) $150,000. Effective as of July 1, 2015, AAI has agreed voluntarily to waive the $150,000 minimum portion of its annual management fee for the Fund. Pursuant to the Investment Advisory Agreement between the Westport Fund and Westport Resources, the Westport Fund pays Westport Resources an annual management fee of 1.50% based on 192 | October 31, 2015 . Notes to Financial Statements October 31, 2015 the Westport Fund’s average daily net assets. The management fee for each Advisory Agreement is paid on a monthly basis. The Westport Sub†Advisors will be engaged to manage the investments of the Westport Fund according to the its investment objective, policies and limitations and any investment guidelines established by the Westport Coâ€Advisors and the Board. Westport Resources will pay the Westport Subâ€Advisors out of the advisory fee paid to it pursuant to the Westport Resources Advisory Agreement. Pursuant to an Investment Subâ€advisory Agreement, AAI pays the Subâ€Advisors of the Funds listed below an annual subâ€advisory management fee which is based on each Fund’s average daily assets. AAI is required to pay all fees due to each Subâ€Advisor out of the management fee AAI receives from each Fund listed below. The following table reflects the Funds’ contractual subâ€advisory fee rates. Fund ALPS | CoreCommodity Management CompleteCommodities® Strategy Fund ALPS | Kotak India Growth Fund ALPS | Red Rocks Listed Private Equity Fund ALPS | Sterling ETF Tactical Rotation Fund ALPS | WMC Research Value Fund Clough China Fund RiverFront Conservative Income Builder Fund RiverFront Dynamic Equity Income Fund RiverFront Global Allocation Fund RiverFront Global Growth Fund RiverFront Moderate Growth & Income Fund Average Daily Net Assets of the Fund All Asset Levels First $50 Million Over $50 Million All Asset Levels All Asset Levels First $250 Million $250 Million †$500 Million Over $500 Million All Asset Levels All Asset Levels All Asset Levels All Asset Levels All Asset Levels All Asset Levels Contractual Sub-Advisory Fee 0.75% 1.15% 1.05% 0.57% 0.60% 0.50% 0.40% 0.30% 0.90% 0.60% 0.60% 0.60% 0.60% 0.60% The Advisor(s) and each Subâ€Advisor have contractually agreed to limit the amount of each Fund’s total annual expenses, exclusive of distribution and service (12bâ€1) fees (except Clough China Class A and Class C shares), shareholder service fees (except Clough China Class A shares and Class C shares), acquired fund fees and expenses, brokerage expenses, interest expense, taxes and extraordinary expenses, that exceed the following annual rates below. These agreements are reevaluated on an annual basis based on the terms disclosed below. The ALPS | CoreCommodity Management CompleteCommodities® Strategy Fund has entered into a separate advisory agreement (the “Subsidiary Advisory Agreement”) with its subsidiary, the Subsidiary’s investment adviser and the Fund’s investment adviser, for the management of the Subsidiary’s portfolio pursuant to which the Subsidiary is obligated to pay the Adviser a management fee at the same rate that the Fund pays the Adviser for investment advisory services provided to the Fund. The Adviser has agreed to waive the advisory fee it receives from the Fund in an amount equal to the management fee paid by the Subsidiary. This waiver may not be terminated or modified without the consent of the Board. For the period ending 10.31.15 this amount equaled 668,490. Term of Expense Fund Class A Class C Class I Class Inv Class L Class R Limit Agreement 8/27/2014 – 8/31/2015 & ALPS | Alerian MLP Infrastructure Index Fund 0.85% 0.85% 0.85% N/A N/A N/A 12/9/2014 – 2/29/2016 ALPS | CoreCommodity Management 9/11/2013 – 9/11/2015 & CompleteCommodities® Strategy Fund 1.05% 1.05% 1.15% N/A N/A N/A 2/28/2015 – 2/29/2016 9/1/2014 – 8/31/2015 & ALPS | Kotak India Growth Fund 1.60% 1.60% 1.60% N/A N/A N/A 2/28/2015 – 2/29/2016 9/1/2014 – 8/31/2015 & ALPS | Red Rocks Listed Private Equity Fund 1.25% 1.25% 1.25% N/A N/A 1.25% 7/31/2015 – 2/28/2017 ALPS | Sterling ETF Tactical Rotation Fund 1.15% 1.15% 1.15% N/A N/A N/A 6/30/2014 – 2/29/2016 ALPS | Westport Resources Hedged High 12/19/2013 – 8/31/2015 & Income Fund 1.99% 1.99% 1.99% N/A N/A N/A 2/28/2015 – 2/29/2016 9/1/2014 – 8/31/2015 & ALPS | WMC Research Value Fund 1.15% 1.15% 1.15% N/A N/A N/A 2/28/2015 – 2/29/2016 9/1/2014 – 8/31/2015 & Clough China Fund 1.95% 2.70% 1.70% N/A N/A N/A 2/28/2015 – 2/29/2016 193 | October 31, 2015 . Notes to Financial Statements October 31, 2015 Fund Class A Class C Class I Class Inv Class L Class R RiverFront Conservative Income Builder Fund 0.90% 0.90% 0.90% N/A N/A N/A RiverFront Dynamic Equity Income Fund 0.90% 0.90% 0.90% N/A N/A N/A RiverFront Global Allocation Fund 0.90% 0.90% 0.90% N/A N/A N/A RiverFront Global Growth Fund 0.90% 0.90% 0.90% 0.90% 0.90% N/A Term of Expense Limit Agreement 9/1/2014 – 8/31/2015 & 2/28/2015 – 2/29/2016 9/1/2014 – 8/31/2015 & 2/28/2015 – 2/29/2016 9/1/2014 – 8/31/2015 & 2/28/2015 – 2/29/2016 9/1/2014 – 8/31/2015 & 2/28/2015 – 2/29/2016 9/1/2014 – 8/31/2015 & 2/28/2015 – 2/29/2016 RiverFront Moderate Growth & Income Fund 0.90% 0.90% 0.90% N/A N/A N/A The Advisor(s) and each Subâ€Advisor are permitted to recover expenses they have waived or reimbursed, on a classâ€byâ€class basis, through the agreements described above to the extent that expenses in later periods fall below the annual limits set forth in these agreements. Clough China Fund is not obligated to pay any such waived or reimbursed fees and expenses more than one year after the end of the fiscal year in which the fees or expenses were waived or reimbursed. The ALPS | Alerian MLP Infrastructure Index Fund, ALPS | CoreCommodity Management CompleteCommodities® Strategy Fund, ALPS | Kotak India Growth Fund, ALPS | Red Rocks Listed Private Equity Fund, ALPS | Sterling ETF Tactical Rotation Fund, ALPS | Westport Resources Hedged High Income, ALPS | WMC Research Value Fund, RiverFront Conservative Income Builder Fund, RiverFront Global Growth Fund, RiverFront Dynamic Equity Income Fund, RiverFront Global Allocation Fund and RiverFront Moderate Growth & Income Fund are not obligated to pay any such waived or reimbursed fees and expenses more than three years after the end of the fiscal year in which the fees or expenses were waived or reimbursed. At October 31, 2015, the Advisor(s) and Subâ€Advisor may seek reimbursement of previously waived and reimbursed fees as follows: Expires Fund 4/30/16 ALPS | Alerian MLP Infrastructure Index Fund †Class A $ 9,499 ALPS | Alerian MLP Infrastructure Index Fund †Class C 9,045 ALPS | Alerian MLP Infrastructure Index Fund †Class I 36,196 ALPS | CoreCommodity Management CompleteCommodities® Strategy Fund †Class A 91,338 ALPS | CoreCommodity Management CompleteCommodities® Strategy Fund †Class C 17,117 ALPS | CoreCommodity Management 21,636 CompleteCommodities® Strategy Fund †Class I ALPS | Kotak India Growth Fund †Class A 188,194 ALPS | Kotak India Growth Fund †Class C 37,562 ALPS | Kotak India Growth Fund †Class I 121,202 ALPS | Red Rocks Listed Private Equity Fund †Class A N/A ALPS | Red Rocks Listed Private Equity Fund †Class C N/A ALPS | Red Rocks Listed Private Equity Fund †Class I N/A ALPS | Red Rocks Listed Private Equity Fund †Class R N/A ALPS | Sterling ETF Tactical Rotation Fund †Class A N/A ALPS | Sterling ETF Tactical Rotation Fund †Class C N/A ALPS | Sterling ETF Tactical Rotation N/A Fund †Class I Expires 10/31/16 $ Expires 4/30/17 Expires 10/31/17 N/A $ 95,994 $ 48,763 N/A 28,674 24,506 48,448 110,673 N/A 38,321 23,256 34,028 131,801 N/A 55,147 5,093 6,800 158,378 N/A 9,066 1,738 1,837 29,758 N/A N/A N/A N/A 30,311 198,350 38,130 87,957 11,487 81,178 16,958 78,795 86,129 95,360 29,402 150,329 149,563 563,082 122,052 438,283 N/A N/A N/A N/A N/A N/A N/A N/A N/A N/A N/A N/A N/A N/A N/A N/A N/A N/A N/A N/A N/A N/A 15,562 78,926 94,488 N/A N/A 7,752 8,258 16,010 N/A N/A 53,715 86,740 140,455 194 | October 31, 2015 Expires 10/31/18 Total $ 74,027 $ 228,283 . Notes to Financial Statements October 31, 2015 Expires Expires Expires Expires Expires Fund 4/30/16 10/31/16 4/30/17 10/31/17 10/31/18 Total ALPS | Westport Resources Hedged High Income Fund †Class A $ N/A $ N/A $ N/A $ 33,823 $ 34,235 $ 68,058 ALPS | Westport Resources Hedged High Income Fund †Class C N/A N/A N/A 14,345 11,798 26,143 ALPS | Westport Resources Hedged High Income Fund †Class I N/A N/A N/A 188,185 191,137 379,322 ALPS | WMC Research Value Fund †Class A 50,013 N/A 39,957 25,559 51,771 167,300 ALPS | WMC Research Value Fund †Class C 90 N/A 81 74 1,084 1,329 ALPS | WMC Research Value Fund †Class I 36,903 N/A 31,790 18,931 38,056 125,680 Clough China Fund †Class A N/A 10,534 N/A N/A N/A 10,534 Clough China Fund †Class C N/A 9,198 N/A N/A N/A 9,198 Clough China Fund †Class I N/A 30,012 N/A N/A N/A 30,012 RiverFront Conservative Income Builder Fund †Class A 6,224 N/A 14,608 6,814 10,173 37,819 RiverFront Conservative Income Builder 38,763 N/A 50,536 28,317 44,843 162,459 Fund †Class C RiverFront Conservative Income Builder Fund †Class I 21,584 N/A 23,541 11,336 19,129 75,590 RiverFront Dynamic Equity Income Fund †Class A 25,434 N/A 28,302 20,436 36,445 110,617 RiverFront Dynamic Equity Income Fund †Class C 54,152 N/A 55,724 35,936 65,254 211,066 RiverFront Dynamic Equity Income Fund †Class I 29,280 N/A 39,925 24,440 43,549 137,194 RiverFront Global Allocation Fund †Class A 32,881 N/A 31,141 15,480 24,491 103,993 RiverFront Global Allocation Fund †Class C 44,218 N/A 41,816 26,510 44,562 157,106 RiverFront Global Allocation Fund †Class I 21,009 N/A 30,843 21,125 43,041 116,018 RiverFront Global Growth Fund †Class A 22,444 N/A 28,381 20,675 40,534 112,034 RiverFront Global Growth Fund †Class C 23,097 N/A 22,962 13,878 29,002 88,939 RiverFront Global Growth Fund †Class I 18,595 N/A 27,339 29,599 36,381 111,914 RiverFront Global Growth Fund †Class L 78,131 N/A 60,282 15,078 60,547 214,038 RiverFront Global Growth Fund †Investor Class 31,778 N/A 22,272 9,650 17,309 81,009 RiverFront Moderate Growth & Income Fund 49,603 N/A 52,042 25,024 39,744 166,413 RiverFront Moderate Growth & Income Fund 92,197 N/A 96,176 54,689 102,129 345,191 RiverFront Moderate Growth & Income Fund 38,570 N/A 55,830 33,901 67,897 196,198 ALPS Portfolio Solutions Distributor, Inc. (the “Distributor”) acts as the distributor of the Funds’ shares pursuant to a Distribution Agreement with the Trust. Shares are sold on a continuous basis by the Distributor, as agent for the Funds, and the Distributor has agreed to use its best efforts to solicit orders for the sale of Funds’ shares, although it is not obliged to sell any particular amount of shares. The Distributor is not entitled to any compensation for its services. The Distributor is registered as a brokerâ€dealer with the Securities and Exchange Commission. The Funds’ Distributor is also the distributor of the Select Sector SPDR exchange traded funds (the “Underlying Sector ETFs”). As required by exemptive relief obtained by the Underlying Sector ETFs, the Advisor(s) will reimburse any applicable Fund an amount equal to the distribution fee received by the Distributor from the Underlying Sector ETFs attributable to such Fund’s investment in the Underlying Sector ETFs, for so long as the Distributor acts as distributor to such Fund and the Underlying Sector ETFs. Each Fund has adopted a Distribution and Services Plan (the “Plan”) pursuant to Rule 12bâ€1 of the 1940 Act for the Class A, Class C, Class R (ALPS | Red Rocks Listed Private Equity Fund only), and Investor Class (RiverFront Global Growth Fund only) shares. The Plan allows a Fund to use Class A, Class C, Class R and Investor Class assets to pay fees in connection with the distribution and marketing of Class A, Class C, Class R and Investor Class shares and/or the provision of shareholder services to Class A, Class C, Class R and Investor Class shareholders. The Plan permits payment for services in connection with the administration of plans or programs that use Class A, Class C, Class R and Investor Class shares of a Fund, if any, as their funding medium and for related expenses. The Plan permits a Fund to make total payments at an annual rate of up to 0.25% of a Fund’s average daily net assets attributable to its Class A and Investor Class shares, 0.75% of a Fund’s average daily net assets attributable to its Class C shares and 0.50% of the ALPS | Red Rocks Listed Private Equity Fund’s average daily net assets attributable to its Class R shares. 195 | October 31, 2015 . Notes to Financial Statements October 31, 2015 Because these fees are paid out of a Fund’s Class A, Class C, Class R and Investor Class assets, if any, on an ongoing basis, over time they will increase the cost of an investment in Class A, Class C, Class R and Investor Class shares, if any, and Plan fees may cost an investor more than other types of sales charges. The ALPS | Alerian MLP Infrastructure Index Fund Class A and Class C shares, ALPS | Kotak India Growth Fund Class A and Class C shares, ALPS | Red Rocks Listed Private Equity Fund Class A and Class C shares, ALPS | Sterling ETF Tactical Rotation Fund Class A and Class C shares, ALPS | Westport Resources Hedged High Income Fund Class A and Class C shares, ALPS | WMC Research Value Fund Class C shares, Clough China Fund Class C shares, ALPS | CoreCommodity Management CompleteCommodities® Strategy Fund Class A and Class C shares, RiverFront Conservative Income Builder Fund Class C shares, RiverFront Dynamic Equity Income Fund Class C shares, RiverFront Global Allocation Fund Class C shares, RiverFront Global Growth Fund Class C Shares, and the RiverFront Moderate Growth & Income Fund Class C shares have adopted a shareholder services plan (“Shareholder Services Plan”). Under the Shareholder Services Plan for each Fund, the Funds are authorized to pay banks and their affiliates and other institutions, including brokerâ€dealers and Fund affiliates (“Participating Organizations”), an aggregate fee in an amount not to exceed on an annual basis 0.15% for ALPS | Alerian MLP Infrastructure Index Fund Class A shares, ALPS | CoreCommodity Management CompleteCommodities® Strategy Fund Class A shares, ALPS | Kotak India Growth Fund Class A shares, ALPS | Red Rocks Listed Private Equity Fund Class A shares, ALPS | Sterling ETF Tactical Rotation Fund Class A shares, and ALPS | Westport Resources Hedged High Income Fund Class A shares, and not to exceed 0.25% for each Fund’s Class C shares of the average daily net asset value of the Class A shares and Class C shares, respectively, attributable to or held in the name of a Participating Organization for its clients as compensation for providing shareholder service activities, which do not include distribution services, pursuant to an agreement with a Participating Organization. Shareholder Services plan fees are included with distribution and service fees on the Statements of Operations. Certain intermediaries may charge networking, omnibus account or other administrative fees with respect to transactions in shares of each Fund. Transactions may be processed through the National Securities Clearing Corporation or similar systems or processed on a manual basis. These fees generally are paid by the Fund to the Distributor, which uses such fees to reimburse intermediaries. In the event an intermediary receiving payments from the Distributor on behalf of the Fund converts from a networking structure to an omnibus account structure or otherwise experiences increased costs, fees borne by the Fund may increase. Networking fees are shown in the Statements of Operations, if applicable to the Fund. ALPS Fund Services, Inc. (“ALPS”) serves as administrator to the Funds and the Funds have agreed to pay expenses incurred in connection with their administrative activities. Pursuant to an Administrative Agreement, ALPS provides operational services to the Funds including, but not limited to, fund accounting and fund administration and generally assists in the Funds’ operations. Officers of the Trust are employees of ALPS. The Funds’ administration fee is accrued on a daily basis and paid monthly. Administration fees paid by the Funds for the Fiscal Year Ended October 31, 2015 are disclosed in the Statement of Operations. ALPS is reimbursed by the Funds for certain outâ€ofâ€pocket expenses. ALPS | WMC Research Value Fund engaged in cross trades with an affiliate during the Fiscal Year Ended October 31, 2015 pursuant to Rule 17aâ€7 under the 1940 Act. Generally, cross trading is the buying or selling of portfolio securities between funds to which the Adviser serves as the investment adviser. The Board of Trustees previously adopted procedures that apply to transactions between the Funds and its affiliates pursuant to Rule 17aâ€7. At its regularly scheduled meetings, the Board of Trustees reviews such transactions as of the most current calendar quarter for compliance with the requirements set forth by Rule 17aâ€7 and the Funds’ procedures. The Funds’ procedures require that the transactions be a purchase or sale for no consideration other than cash payment against prompt delivery of a security for which market quotations are readily available, and be consistent with the investment policies of each Fund. ALPS | WMC Research Value Fund sold securities to other funds for which the Subâ€Adviser is the investment adviser in the amount of $378 with a realized loss of $14. 9. INDEMNIFICATIONS Under the Trust’s organizational documents, its officers and Trustees are indemnified against certain liability arising out of the performance of their duties to the Trust. Additionally, in the normal course of business, the Trust enters into contracts with service providers that may contain general indemnification clauses which may permit indemnification to the extent permissible under applicable law. The Trust’s maximum exposure under these arrangements is unknown, as this would involve future claims that may be made against the Trust that have not yet occurred. 196 | October 31, 2015 . Report of Independent Registered Public Accounting Firm To the Shareholders and Board of Trustees of Financial Investors Trust: We have audited the accompanying statements of assets and liabilities, including the statements of investments, of ALPS | Alerian MLP Infrastructure Index Fund, ALPS | Red Rocks Listed Private Equity Fund, ALPS | Sterling ETF Tactical Rotation Fund, ALPS | Westport Resources Hedged High Income Fund, ALPS | WMC Research Value Fund (formerly known as ALPS | WMC Disciplined Value Fund), Clough China Fund, RiverFront Conservative Income Builder Fund, RiverFront Global Growth Fund, RiverFront Dynamic Equity Income Fund, RiverFront Global Allocation Fund, RiverFront Moderate Growth & Income Fund, eleven of the funds of Financial Investors Trust (the “Trust”), as of October 31, 2015, the related statements of operations for the year then ended, and the statements of changes in net assets and the financial highlights for the periods presented. We have also audited the accompanying consolidated statements of assets and liabilities, including the consolidated statements of investments, of ALPS | Kotak India Growth Fund and ALPS | CoreCommodity Management CompleteCommodities® Strategy Fund, two of the funds of the Trust, as of October 31, 2015, the related consolidated statements of operations for the year then ended, and the consolidated statements of changes in net assets and the consolidated financial highlights for each of the periods presented. These financial statements and financial highlights for these thirteen funds are the responsibility of the Trust’s management. Our responsibility is to express an opinion on these financial statements and financial highlights based on our audits. We conducted our audits in accordance with the standards of the Public Company Accounting Oversight Board (United States). Those standards require that we plan and perform the audit to obtain reasonable assurance about whether the financial statements and financial highlights are free of material misstatement. The Trust is not required to have, nor were we engaged to perform, an audit of its internal control over financial reporting. Our audits included consideration of internal control over financial reporting as a basis for designing audit procedures that are appropriate in the circumstances, but not for the purpose of expressing an opinion on the effectiveness of the Trust’s internal control over financial reporting. Accordingly, we express no such opinion. An audit also includes examining, on a test basis, evidence supporting the amounts and disclosures in the financial statements, assessing the accounting principles used and significant estimates made by management, as well as evaluating the overall financial statement presentation. Our procedures included confirmation of securities owned as of October 31, 2015, by correspondence with the custodian, agent banks and brokers; where replies were not received from agent banks and brokers, we performed other auditing procedures. We believe that our audits provide a reasonable basis for our opinion. In our opinion, the financial statements and financial highlights referred to above present fairly, in all material respects, the financial position of each of the thirteen funds constituting Financial Investors Trust as of October 31, 2015, and the results of their operations, the changes in their net assets and the financial highlights for the periods presented, in conformity with accounting principles generally accepted in the United States of America. DELOITTE & TOUCHE LLP Denver, Colorado December 21, 2015 197 | October 31, 2015 . Additional Information October 31, 2015 (Unaudited) 1. FUND HOLDINGS The Funds file their complete schedule of portfolio holdings with the Securities and Exchange Commission (the “SEC”) for the first and third quarters of each fiscal year on Form Nâ€Q within 60 days after the end of the period. Copies of the Funds’ Form Nâ€Q are available without charge on the SEC website at http:// www.sec.gov. You may also review and copy the Form Nâ€Q at the SEC’s Public Reference Room in Washington, D.C. For more information about the operation of the Public Reference Room, please call the SEC at 1â€800â€SECâ€0330. 2. FUND PROXY VOTING POLICIES, PROCEDURES AND SUMMARIES Fund policies and procedures used in determining how to vote proxies and information regarding how each of the Funds voted proxies relating to portfolio securities during the most recent prior 12â€month period ending June 30 are available without charge, (1) upon request, by calling (tollâ€free) (866) 759â€5679 and (2) on the SEC’s website at http://www.sec.gov. 3. TAX DESIGNATIONS Of the distributions paid by the Funds from ordinary income for the calendar year ended December 31, 2014, the following percentages met the requirements to be treated as qualifying for the corporate dividends received deduction and qualified dividend income: QDI DRD ALPS | CoreCommodity Management CompleteCommodities® Strategy Fund 9.55% 9.55% ALPS | Kotak India Growth Fund 32.23% 0.00% ALPS | Red Rocks Listed Private Equity Fund 18.71% 1.23% ALPS | Sterling ETF Tactical Rotation Fund 35.99% 39.74% ALPS | Westport Resources Hedged High Income Fund 0.00% 0.00% ALPS | WMC Research Value Fund 30.28% 29.68% Clough China Fund 64.50% 0.00% RiverFront Conservative Income Builder Fund 21.49% 10.02% RiverFront Dynamic Equity Income Fund 49.83% 20.36% RiverFront Global Allocation Fund 59.25% 2.98% RiverFront Global Growth Fund 54.75% 3.01% RiverFront Moderate Growth & Income Fund 34.16% 17.77% In early 2015, if applicable, shareholders of record received this information for the distribution paid to them by the Funds during the calendar year 2014 via Form 1099. The Funds will notify shareholders in early 2016 of amounts paid to them by the Funds, if any, during the calendar year 2015. Pursuant to Section 852(b)(3) of the Internal Revenue Code the Funds that designated longâ€term capital gain dividends are: ALPS | CoreCommodity Management CompleteCommodities® Strategy Fund $ – ALPS | Kotak India Growth Fund $ 245,199 ALPS | Red Rocks Listed Private Equity Fund $ 1,431,943 ALPS | Sterling ETF Tactical Rotation Fund $ – ALPS | Westport Resources Hedged High Income Fund $ – ALPS | WMC Research Value Fund $ 8,298,461 Clough China Fund $ 1,612,835 RiverFront Conservative Income Builder Fund $ 95,413 RiverFront Dynamic Equity Income Fund $ 1,736,888 RiverFront Global Allocation Fund $ 2,042,515 RiverFront Global Growth Fund $ 5,687,960 RiverFront Moderate Growth & Income Fund $ 4,753,671 Pursuant to Section 853(c) of the Internal Revenue Code, the following Funds designate the amounts listed below as foreign taxes paid and foreign source income during the current fiscal year: Foreign Taxes Paid Foreign Source Income Clough China Fund $ 149,681 $ 2,479,086 198 | October 31, 2015 . Additional Information October 31, 2015 (Unaudited) 4. DISCLOSURE REGARDING APPROVAL OF FUND ADVISORY AND SUBâ€ADVISORY AGREEMENTS Clough China Fund On June 9â€10, 2015, the Trustees met in person to discuss, among other things, the approval of the investment advisory agreement between Financial Investors Trust (the “Trust”) and ALPS Advisors, Inc. (“ALPS Advisors”) (the “Investment Advisory Agreement”), and the subâ€advisory agreement with Clough Capital Partners, LLC (“Clough Capital”) (the “Subâ€Advisory Agreement”), in accordance with Section 15(c) of the 1940 Act. The Independent Trustees met with independent legal counsel during executive session and discussed the Investment Advisory Agreement, the Subâ€Advisory Agreement and other related materials. In renewing and approving the Investment Advisory Agreement with ALPS Advisors and the Subâ€Advisory Agreement with Clough Capital, the Trustees, including the Independent Trustees, considered the following factors with respect to the Clough China Fund (the “China Fund”): Investment Advisory Fee Rate: The Trustees reviewed and considered the contractual annual advisory fee to be paid by (a) the Trust, on behalf of the China Fund, to ALPS Advisors of 1.35% of the China Fund’s daily average net assets and (b) ALPS Advisors to Clough Capital of 0.90% of the China Fund’s daily average net assets, in light of the extent and quality of the advisory services provided by the ALPS Advisors and Clough Capital to the China Fund. The Board received and considered information including a comparison of the China Fund’s contractual and actual advisory fees and overall expenses with those of funds in the relevant peer expense group of funds provided by an independent provider of investment company data (the “Data Provider”). The Trustees also considered information regarding compensation to be paid to affiliates of ALPS Advisors under other agreements, such as the Fund Accounting and Administration Agreement with ALPS. The Trustees noted that the investment advisory fee rate was above the median expense group fee and the median expense universe fee, but within a reasonable range of such medians when considered in light of particular services provided to the China Fund. Total Expense Ratios: Based on such information, the Trustees further reviewed and considered the total expense ratios (after waivers, subject to certain exclusions) of 1.95%, 2.70% and 1.70% for Class A, Class C and Class I, respectively, of the China Fund, taking into account the contractual fee waivers in place through February 29, 2016. The Trustees noted that the total expense ratios (after waivers) were above the median expense group fee and the median expense universe fee, but within a reasonable range of such medians when considered in light of particular services provided to the China Fund. Nature, Extent and Quality of the Services under the Investment Advisory Agreement and the Subâ€Advisory Agreement: The Trustees received and considered information regarding the nature, extent and quality of services provided to the China Fund under the Investment Advisory Agreement and the Subâ€Advisory Agreement. The Trustees reviewed certain background materials supplied by ALPS Advisors and Clough Capital in each of their presentations, including their Forms ADV and compliance policies and procedures. The Trustees reviewed and considered ALPS Advisors’ and Clough Capital’s investment advisory personnel, their history as asset managers, their performance and the amount of assets currently under management by ALPS Advisors and Clough Capital. The Trustees also reviewed the research and decisionâ€making processes utilized by ALPS Advisors and Clough Capital, including the methods adopted to seek to achieve compliance with the investment objectives, policies and restrictions of the China Fund. The Trustees considered the background and experience of ALPS Advisors’ and Clough Capital’s management in connection with the China Fund, including reviewing the qualifications, backgrounds and responsibilities of the management team primarily responsible for the dayâ€toâ€day portfolio management of the China Fund and the extent of the resources devoted to research and analysis of actual and potential investments. The Trustees also reviewed the accompanying complianceâ€related materials and noted that they have received reports on these services and compliance issues from ALPS Advisors and Clough Capital at each regular Board meeting throughout the year related to the services rendered by ALPS Advisors and Clough Capital with respect to the China Fund. Performance: The Trustees reviewed performance information for the China Fund and the predecessor fund of the China Fund (December 30, 2005 inception date) for the 1â€year, 2â€year, 3â€year, 4â€year and 5â€year periods ended March 31, 2014. That review included a comparison of the China Fund’s performance to the performance of a group of comparable funds selected by Lipper. The Trustees noted the China Fund’s generally favorable longerâ€term performance over such periods ended March 31, 2014, compared against peer funds identified by Lipper. The Trustees also considered Clough Capital’s performance and reputation generally and its investment techniques, risk management controls and decisionâ€making processes, as well as Clough Capital’s overview of the China market, the economic outlook for investing in China and the potential effects of certain political and economic issues on trading in Chinese stocks. 199 | October 31, 2015 . Additional Information October 31, 2015 (Unaudited) Comparable Accounts: The Trustees considered information provided by Clough Capital regarding fees charged to its closedâ€end investment company and private fund clients, noting Clough Capital’s statements regarding differences in trading strategies, activity levels and use of short sales and options. Profitability: The Trustees received and considered a projected profitability analyses prepared by ALPS Advisors and by Clough Capital based on the fees payable under the Investment Advisory Agreement and Subâ€Advisory Agreement, respectively. The Trustees considered that the China Fund was currently profitable to ALPS Advisors without the inclusion of distributionâ€related expenses, as well as the losses realized by Clough Capital in connection with the operation of the China Fund. The Trustees also considered Clough Capital’s statements regarding its continuing commitment to the China Fund despite these losses. The Board then reviewed ALPS Advisors’ and Clough Capital’s financial statements in order to analyze the financial condition and stability and profitability of each adviser. Economies of Scale: The Trustees considered whether economies of scale in the provision of services to the China Fund were being passed along to the shareholders. The Trustees considered whether any economies of scale, fallâ€out benefits or any other direct or indirect benefits would accrue to ALPS Advisors or Clough Capital from their relationship with the Trust. Other Benefits to the Advisers: The Trustees reviewed and considered any other benefits derived or to be derived by ALPS Advisors and Clough Capital from their relationship with the China Fund, including whether softâ€dollar arrangements were used. The Board summarized its deliberations with respect to the Investment Advisory Agreement with ALPS Advisors and the Subâ€Advisory Agreement with Clough Capital. In selecting ALPS Advisors and Clough Capital and approving the investment advisory and subâ€advisory agreements and fees under such agreements, the Trustees concluded that no single factor reviewed by the Trustees was identified by the Trustees to be determinative as the principal factor in whether to approve the investment advisory and subâ€advisory agreements. Further, the Independent Trustees were advised by independent legal counsel throughout the process. Moreover, each Trustee may have afforded different weight to the various factors in reaching his or her conclusions with respect to each agreement. The Trustees, including all of the Independent Trustees, concluded that: • the investment advisory fee rate was above the median expense group fee and the median expense universe fee, but within a reasonable range of such medians when considered in light of particular services provided to the China Fund; • the total expense ratios (after waivers) were above the median expense group fee and the median expense universe fee, but within a reasonable range of such medians when considered in light of particular services provided to the China Fund; • the nature, extent and quality of services rendered by ALPS Advisors under the Investment Advisory Agreement and by Clough Capital under the Subâ€Advisory Agreement were adequate; • the performance of the China Fund was generally comparable to, or in some cases more favorable than, the longerâ€term performance of the funds in its performance peer universe; • bearing in mind the limitations of comparing different types of managed accounts and the different levels of service typically associated with such accounts, the fee structures applicable to Clough Capital’s other clients employing a comparable strategy were not indicative of any unreasonableness with respect to the subâ€advisory fees proposed to be payable to Clough Capital by the Adviser; • the profit, if any, realized by ALPS Advisors and by Clough Capital in connection with the operation of the China Fund is not unreasonable, especially in light of the fee waiver agreement between the Trust and ALPS Advisors, and to the extent currently unprofitable, each of ALPS Advisors and by Clough Capital remains committed to the China Fund; and • there were no material economies of scale or other benefits accruing to either ALPS Advisors or Clough Capital in connection with its relationship with the China Fund. Based on the Trustees’ deliberations and their evaluation of the information described above, all of the Trustees, including all of the Independent Trustees in person at the Meeting, concluded that ALPS Advisors’ and Clough Capital’s compensation for investment advisory services is consistent with the best interests of the China Fund and its shareholders. ALPS | Red Rocks Listed Private Equity Fund On April 22, 2015, the Trustees met in person to discuss, among other things, the approval, in accordance with Section 15(c) of the 1940 Act, of (i) the new investment subâ€advisory agreement among the Trust, ALPS Advisors and Red Rocks Capital, LLC (“Red Rocks”) (the “New Subâ€Advisory Agreement”), for consideration and approval by the shareholders of the ALPS | Red Rocks Listed Private Equity Fund (the “LPE Fund”) in connection with the acquisition of Red Rocks by ALPS Advisors (the “Transaction”), and (ii) the existing investment subâ€advisory agreement among the Trust, ALPS Advisors and Red Rocks (the “Existing Subâ€Advisory Agreement”). The Independent Trustees met with independent legal counsel during executive session and discussed the New Subâ€Advisory Agreement, the Existing Subâ€Advisory Agreement and other related materials. 200 | October 31, 2015 . Additional Information October 31, 2015 (Unaudited) Approval of the New Subâ€Advisory Agreement with Red Rocks In voting to approve the New Subâ€Advisory Agreement, the Board did not identify any single factor as allâ€important or controlling. The Board considered whether the New Subâ€Advisory would be in the best interests of the LPE Fund and its shareholders, based on: (i) the nature, extent and quality of the services to be provided under the New Subâ€Advisory Agreement; (ii) the investment performance of the LPE Fund; (iii) the expenses borne by the LPE Fund (including management fees and other expenses), the fees indirectly charged by Red Rocks to the LPE Fund and to its other clients, and projected profits to be realized by Red Rocks and its affiliates from their relationships with the LPE Fund; (iv) the fact that economies of scale may be realized as the LPE Fund grows and whether fee levels will reflect economies of scale for the benefit of shareholders; (v) potential fallâ€out benefits to Red Rocks from its relationships with the LPE Fund; and (vi) other general information about Red Rocks. The following is a summary of the Board’s consideration and conclusions regarding these matters. Nature, Extent and Quality of the Services Provided. The Board received and considered information regarding the nature, extent and quality of services provided to the LPE Fund under the New Subâ€Advisory Agreement. The Trustees reviewed certain background materials supplied by Red Rocks, including its Form ADV. The Board reviewed and considered Red Rocks’ investment advisory personnel, its history as an asset manager, its performance and the amount of assets currently under management by Red Rocks and reviewed the qualifications, backgrounds and responsibilities of the management team primarily responsible for the dayâ€toâ€day portfolio management of the LPE Fund and the extent of the resources devoted to research and analysis of actual and potential investments. The Board also reviewed the research and decisionâ€making processes utilized by Red Rocks, including the methods adopted to seek to achieve compliance with the investment objectives, policies and restrictions of the LPE Fund. The Board also reviewed certain complianceâ€related materials and noted that they have received reports on advisory services and compliance matters from Red Rocks at each regular Board meeting throughout the year. Investment Performance. The Board reviewed performance information for the LPE Fund for the 1â€year, 3â€year and 5â€year periods ended March 31, 2015. The review included a comparison of the LPE Fund’s performance to the performance of a group of comparable funds selected by an independent provider of research data. The Trustees noted that the LPE Fund had favorable performance for each of these periods when compared against its peer universe average as identified by the independent provider of research data. The Board also considered Red Rocks’ performance and reputation generally and its investment techniques, risk management controls and decisionâ€making processes. Fees and Expenses. The Board reviewed and considered (a) the contractual annual advisory fee rate to be paid by the Trust, on behalf of the LPE Fund, to ALPS Advisors and (b) the contractual subâ€advisory fee rate to be paid by ALPS Advisors to Red Rocks, in light of the extent and quality of the advisory services provided by ALPS Advisors and Red Rocks to the LPE Fund. The Board also considered fees charged by Red Rocks to comparable accounts, including other registered investment companies, noting the types of services offered by Red Rocks to those other accounts and Red Rocks’ cost considerations in managing such accounts. Based on such information, the Board further determined that the contractual annual advisory fees, inclusive of the subâ€advisory fees to be paid by ALPS Advisors to Red Rocks, and taking into account the contractual fee waivers in place, are generally lower than the peer universe median or within an acceptable range of the peer universe median. The Board also determined that the LPE Fund’s total expenses, on a classâ€byâ€class basis, were generally lower than the peer universe median, or within an acceptable range thereof. Projected Profitability and Costs of Services to Red Rocks. The Trustees received and considered a projected profitability analysis prepared by Red Rocks based on the fees payable under the New Subâ€Advisory Agreement and on Red Rocks’ estimates of its operating expenses, and also considered information regarding the financial condition of Red Rocks. The Trustees also received information from ALPS Advisors regarding the anticipated effects of the Transaction on its projected profitability. In assessing the projected profitability analysis, the Board noted that the LPE Fund’s total fees and expenses were within an acceptable range of the median expenses of comparable funds identified by the independent provider of investment company data. Extent of Economies of Scale as the LPE Fund Grows and Whether Fee Levels Reflect Economies of Scale. The Trustees considered whether economies of scale in the provision of services to the LPE Fund were being passed along to the shareholders. The Trustees also considered whether any fallâ€out benefits or any other direct or indirect benefits would accrue to Red Rocks from its relationship with the LPE Fund. The Board also reviewed and considered any other benefits derived or to be derived by Red Rocks from its relationship with the LPE Fund, including soft dollar arrangements. Based on its evaluation of the aforementioned considerations, the Board unanimously voted to approve the New Subâ€Advisory Agreement, and to recommend to the shareholders of the LPE Fund that they approve the New Subâ€Advisory Agreement. 201 | October 31, 2015 . Additional Information October 31, 2015 (Unaudited) Renewal of the Existing Subâ€Advisory Agreement with Red Rocks In renewing and approving the Existing Subâ€Advisory Agreement with Red Rocks, the Trustees, including the Independent Trustees, considered the following factors with respect to the LPE Fund: In voting to approve the Existing Subâ€Advisory Agreement, the Board did not identify any single factor to be determinative. The Board considered whether the Existing Subâ€Advisory Agreement would be in the best interests of the LPE Fund and its shareholders, based on: (i) the nature, extent and quality of the services to be provided under the Existing Subâ€Advisory Agreement; (ii) the investment performance of the LPE Fund; (iii) the expenses borne by the LPE Fund (including management fees and other expenses), the fees indirectly charged by Red Rocks to the LPE Fund and to its other clients, and projected profits to be realized by Red Rocks and its affiliates from their relationships with the LPE Fund; (iv) the fact that economies of scale may be realized as the LPE Fund grows and whether fee levels will reflect economies of scale for the benefit of shareholders; (v) potential fallâ€out benefits to Red Rocks from its relationships with the LPE Fund; and (vi) other general information about Red Rocks. The following is a summary of the Board’s consideration and conclusions regarding these matters. Nature, Extent and Quality of the Services Provided. The Board received and considered information regarding the nature, extent and quality of services provided to the LPE Fund under the Existing Subâ€Advisory Agreement. The Trustees reviewed certain background materials supplied by Red Rocks, including its Form ADV. The Board reviewed and considered Red Rocks’ investment advisory personnel, its history as an asset manager, its performance and the amount of assets currently under management by Red Rocks, and reviewed the qualifications, backgrounds and responsibilities of the management team primarily responsible for the dayâ€toâ€day portfolio management of the LPE Fund and the extent of the resources devoted to research and analysis of actual and potential investments. The Board also reviewed the research and decisionâ€making processes utilized by Red Rocks, including the methods adopted to seek to achieve compliance with the investment objectives, policies and restrictions of the LPE Fund. The Board also reviewed certain complianceâ€related materials and noted that they have received reports on advisory services and compliance matters from Red Rocks at each regular Board meeting throughout the year. Investment Performance. The Board reviewed performance information for the LPE Fund for the 1â€year, 3â€year and 5â€year periods ended March 31, 2015. The review included a comparison of the LPE Fund’s performance to the performance of a group of comparable funds selected by an independent provider of research data. The Trustees noted that the LPE Fund had favorable performance for each of these periods when compared against its peer universe average as identified by the independent provider of research data. The Board also considered Red Rocks’ performance and reputation generally and its investment techniques, risk management controls and decisionâ€making processes. Fees and Expenses. The Board reviewed and considered (a) the contractual annual advisory fee rate to be paid by the Trust, on behalf of the LPE Fund, to ALPS Advisors and (b) the contractual subâ€advisory fee rate to be paid by ALPS Advisors to Red Rocks, in light of the extent and quality of the advisory services provided by ALPS Advisors and Red Rocks to the LPE Fund. The Board also considered fees charged by Red Rocks to comparable accounts, including other registered investment companies, noting the types of services offered by Red Rocks to those other accounts and Red Rocks’ cost considerations in managing such accounts. Based on such information, the Board further determined that the contractual annual advisory fees, inclusive of the subâ€advisory fees to be paid by ALPS Advisors to Red Rocks, and taking into account the contractual fee waivers in place, are generally lower than the peer universe median or within an acceptable range of the peer universe median. The Board also determined that the LPE Fund’s total expenses, on a classâ€byâ€class basis, were generally lower than the peer universe median, or within an acceptable range thereof. Projected Profitability and Costs of Services to Red Rocks. The Trustees received and considered a historical, current and projected profitability analysis prepared by Red Rocks based on the fees payable under the Existing Subâ€Advisory Agreement and on Red Rocks’ estimates of its operating expenses, and also considered information regarding the financial condition of Red Rocks. In assessing the profitability analysis, the Board noted that the LPE Fund’s total fees and expenses were within an acceptable range of the median expenses of comparable funds identified by the independent provider of investment company data. Extent of Economies of Scale as the LPE Fund Grows and Whether Fee Levels Reflect Economies of Scale. The Trustees considered whether economies of scale in the provision of services to the LPE Fund were being passed along to the shareholders. The Trustees also considered whether any fallâ€out benefits or any other direct or indirect benefits would accrue to Red Rocks from its relationship with the LPE Fund. The Board also reviewed and considered any other benefits derived or to be derived by Red Rocks from its relationship with the LPE Fund, including soft dollar arrangements. Based on its evaluation of the aforementioned considerations, the Board unanimously voted to approve the Existing Investment Subâ€Advisory Agreement. 202 | October 31, 2015 . Additional Information October 31, 2015 (Unaudited) Approval of the Existing Investment Advisory Agreement with ALPS Advisors On June 9â€10, 2015, the Trustees met in person to discuss, among other things, the approval of the investment advisory agreement between the Trust and ALPS Advisors (the “Investment Advisory Agreement”), in accordance with Section 15(c) of the 1940 Act. The Trustees noted that the existing investment subâ€advisory agreement with Red Rocks Capital was not subject to review at this time as it had been renewed at the Board’s April 22, 2015 meeting. The Independent Trustees met with independent legal counsel during executive session and discussed the Investment Advisory Agreement and other related materials. In renewing and approving the Investment Advisory Agreement with ALPS Advisors, the Trustees, including the Independent Trustees, considered the following factors with respect to the LPE Fund: Investment Advisory Fee Rate: The Trustees reviewed and considered the contractual annual advisory fee to be paid by the Trust, on behalf of the LPE Fund, to ALPS Advisors of 0.85% of the LPE Fund’s daily average net assets, in light of the extent and quality of the advisory services provided by ALPS Advisors to the LPE Fund. The Board received and considered information including a comparison of the LPE Fund’s contractual and actual advisory fees and overall expenses with those of funds in the relevant peer expense group of funds provided by an independent provider of investment company data. The Trustees also considered information regarding compensation to be paid to affiliates of ALPS Advisors under other agreements, such as the Fund Accounting and Administration Agreement with ALPS. The Trustees noted that the investment advisory fee rate was above the median expense group fee and the median expense universe fee, but within a reasonable range of such medians when considered in light of particular services provided to the LPE Fund. Total Expense Ratios: Based on such information, the Trustees further reviewed and considered the total expense ratio (after waivers, subject to certain exclusions) of 1.25% for all classes of the LPE Fund, taking into account the contractual fee waivers in place through February 29, 2016. The Trustees noted that the total expense ratios (after waivers) were above the median expense group fee and the median expense universe fee, but within a reasonable range of such medians when considered in light of particular services provided to the LPE Fund. Nature, Extent and Quality of the Services under the Investment Advisory Agreement: The Trustees received and considered information regarding the nature, extent and quality of services provided to the LPE Fund under the Investment Advisory Agreement. The Trustees reviewed certain background materials supplied by ALPS Advisors in their presentations, including its Form ADV and compliance policies and procedures. The Trustees reviewed and considered ALPS Advisors’ investment advisory personnel, its history as asset managers, its performance and the amount of assets currently under management by ALPS Advisors. The Trustees also reviewed the research and decisionâ€making processes utilized by ALPS Advisors, including the methods adopted to seek to achieve compliance with the investment objectives, policies and restrictions of the LPE Fund. The Trustees considered the background and experience of ALPS Advisors’ management in connection with the LPE Fund, including reviewing the qualifications, backgrounds and responsibilities of the management team primarily responsible for the management of the LPE Fund and the extent of the resources devoted to research and analysis of actual and potential investments. The Trustees also reviewed the accompanying complianceâ€related materials and further noted that they have received reports on these services and compliance issues from ALPS Advisors at each regular Board meeting throughout the year related to the services rendered by ALPS Advisors with respect to the LPE Fund. Performance: The Trustees reviewed performance information for the LPE Fund for the 1â€year, 2â€year, 3â€year, 4â€year and 5â€year periods ended March 31, 2015. That review included a comparison of the LPE Fund’s performance to the performance of a universe of comparable funds selected by an independent provider of investment company data. The Trustees noted the generally favorable performance of the LPE Fund over more recent periods compared with the applicable performance peer universe of funds identified by an independent provider of investment company data. Comparable Accounts: The Trustees noted that for the purposes of reviewing comparable accounts, the focus has been on the comparable accounts of the subâ€adviser, and that the existing subâ€advisory agreement with Red Rocks was not being presented to the Trustees at this time. Profitability: The Trustees received and considered a profitability analysis prepared by ALPS Advisors based on the fees payable under the Investment Advisory Agreement. The Trustees considered the statements by ALPS Advisors that the LPE Fund was currently profitable to ALPS Advisors. The Board then reviewed and discussed ALPS Advisors’ financial statements in order to analyze the financial condition and stability of the adviser. 203 | October 31, 2015 . Additional Information October 31, 2015 (Unaudited) Economies of Scale: The Trustees considered whether economies of scale in the provision of services to the LPE Fund were being passed along to the shareholders. The Trustees considered whether any economies of scale, fallâ€out benefits or any other direct or indirect benefits would accrue to ALPS Advisors from its relationship with the Trust. Other Benefits to the Advisers: The Trustees reviewed and considered any other benefits derived or to be derived by ALPS Advisors from its relationship with the LPE Fund, including whether softâ€dollar arrangements were used. The Board summarized its deliberations with respect to the Investment Advisory Agreement with ALPS Advisors. In selecting ALPS Advisors and approving the Investment Advisory Agreement and fees under such agreement, the Trustees concluded that no single factor reviewed by the Trustees was identified by the Trustees to be determinative as the principal factor in whether to approve the investment advisory agreement. Further, the Independent Trustees were advised by separate independent legal counsel throughout the process. The Trustees, including all of the Independent Trustees, concluded that: • the investment advisory fee rate was above the median expense group fee and the median expense universe fee, but within a reasonable range of such medians; • the total expense ratios (after waivers) were above the median expense group fee and the median expense universe fee, but within a reasonable range of such medians; • the nature, extent and quality of services rendered by ALPS Advisors under the Investment Advisory Agreement were adequate; • the performance of the LPE Fund was generally comparable to, or in some cases more favorable than, the longerâ€term performance of the funds in its performance peer universe; • for the purposes of reviewing comparable accounts, the focus has been on the comparable accounts of the subâ€adviser, and that the existing subâ€advisory agreement with Red Rocks was not being presented to the Trustees at this time; • the profit realized by ALPS Advisors in connection with the operation of the LPE Fund is not unreasonable, especially in light of the fee waiver agreement among the Trust, ALPS Advisors and Red Rocks; and • there were no material economies of scale or other benefits accruing to ALPS Advisors in connection with its relationship with the LPE Fund. Based on the Trustees’ deliberations and their evaluation of the information described above, all of the Trustees, including all of the Independent Trustees in person at the meeting, concluded that ALPS Advisors’ compensation for investment advisory services is consistent with the best interests of the LPE Fund and its shareholders. ALPS | WMC Research Value Fund On June 9â€10, 2015, the Trustees met in person to discuss, among other things, the approval of the investment advisory agreement between the Trust and ALPS Advisors, Inc. (“ALPS Advisors”) (the “Investment Advisory Agreement”), and the subâ€advisory agreement with Wellington Management Company LLP (“Wellington”) (the “Subâ€Advisory Agreement”), in accordance with Section 15(c) of the 1940 Act. The Independent Trustees met with independent legal counsel during executive session and discussed the Investment Advisory Agreement, the Subâ€Advisory Agreement and other related materials. In renewing and approving the Investment Advisory Agreement with ALPS Advisors and the Subâ€Advisory Agreement with Wellington, the Trustees, including the Independent Trustees, considered the following factors with respect to the ALPS | WMC Research Value Fund (the “WMC Fund”): Investment Advisory Fee Rate: The Trustees reviewed and considered the tiered contractual annual advisory fee to be paid by (a) the Trust, on behalf of the WMC Fund, to ALPS Advisors of (i) 0.95% of the WMC Fund’s daily average net assets of $0â€$250M; (ii) 0.85% of the WMC Fund’s daily average net assets between $250Mâ€$500M ; and (iii) 0.75% of the WMC Fund’s daily average net assets over $500M and (b) by ALPS Advisors to Wellington of (i) 0.50% of the WMC Fund’s daily average net assets of $0â€$250M; (ii) 0.40% of the WMC Fund’s daily average net assets between $250Mâ€$500M; and (iii) 0.30% of the WMC Fund’s daily average net assets over $500M, in light of the extent and quality of the advisory services provided by the ALPS Advisors and Wellington to the WMC Fund. The Board received and considered information including a comparison of the WMC Fund’s contractual and actual advisory fees and overall expenses with those of funds in the relevant peer expense group of funds provided by an independent provider of investment company data. The Trustees also considered information regarding compensation to be paid to affiliates of ALPS Advisors under other agreements, such as the Fund Accounting and Administration Agreement with ALPS. The Trustees noted that the investment advisory fee rate was above the median expense group fee and the median expense universe fee, but within a reasonable range of such medians when considered in light of particular services provided to the WMC Fund. Total Expense Ratios: Based on such information, the Trustees further reviewed and considered total expense ratio (after waivers, subject to certain exclusions) of 1.15% for the WMC Fund’s, taking into account the contractual fee waiver in place until February 29, 2016. The Trustees 204 | October 31, 2015 . Additional Information October 31, 2015 (Unaudited) noted that the total expense ratios (after waivers) were slightly above the median expense group fee and the median expense universe fee, but within a reasonable range of such medians when considered in light of particular services provided to the WMC Fund. Nature, Extent and Quality of the Services under the Investment Advisory Agreement and the Subâ€Advisory Agreement: The Trustees received and considered information regarding the nature, extent and quality of services provided to the WMC Fund under the Investment Advisory Agreement and the Subâ€Advisory Agreement. The Trustees reviewed certain background materials supplied by ALPS Advisors and Wellington in each of their presentations, including their Forms ADV and compliance policies and procedures. The Trustees reviewed and considered ALPS Advisors’ and Wellington’s investment advisory personnel, their history as asset managers, their performance and the amount of assets currently under management by ALPS Advisors and Wellington. The Trustees also reviewed the research and decisionâ€making processes utilized by ALPS Advisors and Wellington, including the methods adopted to seek to achieve compliance with the investment objectives, policies and restrictions of the WMC Fund. The Trustees considered the background and experience of ALPS Advisors’ and Wellington’s management in connection with the WMC Fund, including reviewing the qualifications, backgrounds and responsibilities of the management team primarily responsible for the dayâ€toâ€day portfolio management of the WMC Fund and the extent of the resources devoted to research and analysis of actual and potential investments. The Trustees also reviewed the accompanying complianceâ€related materials and noted that they have received reports on these services and compliance issues from ALPS Advisors and Wellington at each regular Board meeting throughout the year related to the services rendered by ALPS Advisors and Wellington with respect to the WMC Fund. Performance: The Trustees reviewed performance information for the WMC Fund and the predecessor fund of the WMC Fund (December 31, 1999 inception) for the 1â€year, 2â€year, 3â€year, 4â€year, 5â€year and 10â€year periods ended March 31, 2015. That review included a comparison of the WMC Fund’s performance to the performance of a universe of comparable funds selected by an independent provider of investment company data. The Trustees noted the generally favorable performance of the WMC Fund over much of those periods compared against funds identified by an independent provider of investment company data. The Trustees also considered Wellington’s discussion of the WMC Fund’s performance contributors and detractors and its portfolio position and outlook, as well as Wellington’s performance and reputation generally and its investment techniques, risk management controls and decisionâ€making processes. Comparable Accounts: The Trustees considered information provided by Wellington regarding their institutional fee schedule for comparable strategies. Profitability: The Trustees received and considered a projected profitability analysis prepared by ALPS Advisors and by Wellington based on the fees payable under the Investment Advisory Agreement and the Subâ€Advisory Agreement, respectively. The Trustees considered that the WMC Fund was currently profitable to ALPS Advisors without the inclusion of distributionâ€related expenses. The Trustees also considered the advisers’ statements regarding their continuing commitment to the WMC Fund despite these losses. The Board then reviewed ALPS Advisors’ and Wellington’s financial statements in order to analyze the financial condition and stability and profitability of each adviser. Economies of Scale: The Trustees considered whether economies of scale in the provision of services to the WMC Fund were being passed along to the shareholders. The Trustees considered whether any economies of scale, fallâ€out benefits or any other direct or indirect benefits would accrue to ALPS Advisors or Wellington from their relationship with the Trust. Other Benefits to the Advisers: The Trustees reviewed and considered any other benefits derived or to be derived by ALPS Advisors and Wellington from their relationship with the WMC Fund, including whether softâ€dollar arrangements were used. The Board summarized its deliberations with respect to the Investment Advisory Agreement with ALPS Advisors and the Subâ€Advisory Agreement with Wellington. In selecting ALPS Advisors and Wellington and approving the Investment Advisory Agreement and the Subâ€Advisory Agreement and fees under such agreements, the Trustees concluded that no single factor reviewed by the Trustees was identified by the Trustees to be determinative as the principal factor in whether to approve the Investment Advisory Agreement and the Subâ€Advisory Agreement. Further, the Independent Trustees were advised by separate independent legal counsel throughout the process. The Trustees, including all of the Independent Trustees, concluded that: • the investment advisory fee rate was slightly above the median expense group fee and the median expense universe fee, but within a reasonable range of such medians when considered in light of particular services provided to the WMC Fund; • the total expense ratios (after waivers) were slightly above the median expense group fee and the median expense universe fee, but within a reasonable range of such medians when considered in light of particular services provided to the WMC Fund; 205 | October 31, 2015 . Additional Information October 31, 2015 (Unaudited) • • • • • the nature, extent and quality of services rendered by ALPS Advisors under the Investment Advisory Agreement and by Wellington under the Subâ€Advisory Agreement were adequate; the performance of the WMC Fund was generally comparable to, or in some cases more favorable than, the performance of the funds in its performance peer universe; bearing in mind the limitations of comparing different types of managed accounts and the different levels of service typically associated with such accounts, the fee structures applicable to Wellington’s other clients employing a comparable strategy were not indicative of any unreasonableness with respect to the subâ€advisory fees proposed to be payable to Wellington by ALPS Advisors; the profit realized by ALPS Advisors and by Wellington in connection with the operation of the WMC Fund is not unreasonable, especially in light of the fee waiver agreement between the Trust and ALPS Advisors, and to the extent currently unprofitable or profitable, each remains committed to the WMC Fund; and there were no material economies of scale or other benefits accruing to either ALPS Advisors or Wellington in connection with its relationship with the WMC Fund. Based on the Trustees’ deliberations and their evaluation of the information described above, all of the Trustees, including all of the Independent Trustees in person at the Meeting, concluded that ALPS Advisors’ and Wellington’s compensation for investment advisory services is consistent with the best interests of the WMC Fund and its shareholders. ALPS | CoreCommodity Management CompleteCommodities® Strategy Fund On June 9â€10, 2015, the Trustees met in person to discuss, among other things, the approval of the investment advisory agreement between the Trust and ALPS Advisors, Inc. (“ALPS Advisors”) (the “Investment Advisory Agreement”), and the subâ€advisory agreement with CoreCommodity Management LLC (“CoreCommodity”) (the “Subâ€Advisory Agreement”), in accordance with Section 15(c) of the 1940 Act. The Independent Trustees met with independent legal counsel during executive session and discussed the Investment Advisory Agreement, the Subâ€Advisory Agreement and other related materials. In renewing and approving the Investment Advisory Agreement with ALPS Advisors and the Subâ€Advisory Agreement with CoreCommodity, the Trustees, including the Independent Trustees, considered the following factors with respect to the ALPS | CoreCommodity Management CompleteCommodities® Strategy Fund (the “CoreCommodity Fund”): Investment Advisory Fee Rate: The Trustees reviewed and considered the contractual annual advisory fee to be paid by (a) the Trust, on behalf of the CoreCommodity Fund, to ALPS Advisors of 0.85% of the CoreCommodity Fund’s daily average net assets and (b) by ALPS Advisors to CoreCommodity of 0.75% of the CoreCommodity Fund’s daily average net assets, in light of the extent and quality of the advisory services provided by the ALPS Advisors and CoreCommodity to the CoreCommodity Fund. The Board received and considered information including a comparison of the CoreCommodity Fund’s contractual and actual advisory fees and overall expenses with those of funds in the relevant peer expense group of funds provided by an independent provider of investment company data. The Trustees also considered information regarding compensation to be paid to affiliates of ALPS Advisors under other agreements, such as the Fund Accounting and Administration Agreement with ALPS. The Trustees noted that the investment advisory fee rate was generally above the median expense group fee and the median expense universe fee, but within a reasonable range of such medians when considered in light of particular services provided to the CoreCommodity Fund. Total Expense Ratios: Based on such information, the Trustees further reviewed and considered the total expense ratio (after waivers, subject to certain exclusions) of 1.05% for Class A shares, 1.05% for Class C shares, and 1.15% for Class I shares of the CoreCommodity Fund, taking into account the contractual fee waiver in place until February 29, 2016. The Trustees noted that the total expense ratios (after waivers) were within a reasonable range of the median expense group ratio and the median expense universe ratio when considered in light of particular services provided to the Core Commodity Fund. Nature, Extent and Quality of the Services under the Investment Advisory Agreement: The Trustees received and considered information regarding the nature, extent and quality of services provided to the CoreCommodity Fund under the Investment Advisory Agreement. The Trustees reviewed certain background materials supplied by ALPS Advisors in its presentations, including its Form ADV. The Trustees reviewed and considered ALPS Advisors’ investment advisory personnel, its history as an asset manager, its performance and the amount of assets currently under management by ALPS Advisors. The Trustees also reviewed the research and decisionâ€making processes utilized by ALPS Advisors, including the methods adopted to seek to achieve compliance with the investment objectives, policies and restrictions of the CoreCommodity Fund. The Trustees considered the background and experience of ALPS Advisors’ management in connection with the CoreCommodity Fund. 206 | October 31, 2015 . Additional Information October 31, 2015 (Unaudited) The Trustees also reviewed the accompanying complianceâ€related materials and noted that they have received reports on these services and compliance issues from ALPS Advisors and CoreCommodity at each regular Board meeting throughout the year related to the services rendered by ALPS Advisors and CoreCommodity with respect to the CoreCommodity Fund. Performance: The Trustees reviewed performance information for the CoreCommodity Fund for the 1â€year, 2â€year, 3â€year, and 4â€year periods ended March 31, 2015. The review included a comparison of the CoreCommodity Fund’s performance to the performance of a universe of comparable funds selected by Lipper. The Trustees noted that the CoreCommodity Fund had generally near median and favorable long term performance when compared against comparable funds identified by Lipper. The Trustees also considered ALPS Advisors’ CoreCommodity’s performance and reputation generally and their investment techniques, risk management controls and decisionâ€making processes. Comparable Accounts: The Trustees considered information provided by CoreCommodity indicating that there were no comparable accounts managed by CoreCommodity. Profitability: The Trustees received and considered a projected profitability analyses prepared by ALPS Advisors and by CoreCommodity based on the fees payable under the Investment Advisory Agreement and the Subâ€Advisory Agreement, respectively. The Trustees considered that the CoreCommodity Fund was currently profitable to ALPS Advisors without the inclusion of distributionâ€related expenses, and currently profitable to CoreCommodity both before and after distribution expenses. The Board then reviewed ALPS Advisors’ and CoreCommodity’s financial statements in order to analyze the financial condition and stability and profitability of each adviser. Economies of Scale: The Trustees considered whether economies of scale in the provision of services to the CoreCommodity Fund were being passed along to the shareholders. The Trustees considered whether any economies of scale, fallâ€out benefits or any other direct or indirect benefits would accrue to ALPS Advisors or CoreCommodity from their relationship with the Trust. Other Benefits to the Adviser: The Trustees reviewed and considered any other benefits derived or to be derived by ALPS Advisors and CoreCommodity from their relationship with the CoreCommodity Fund, including whether soft dollar arrangements were used. The Board summarized its deliberations with respect to the Investment Advisory Agreement with ALPS Advisors and the Subâ€Advisory Agreement with CoreCommodity Management. In selecting ALPS Advisors and CoreCommodity Management and approving the Investment Advisory Agreement and the Subâ€Advisory Agreement and fees under such agreements, the Trustees concluded that no single factor reviewed by the Trustees was identified by the Trustees to be determinative as the principal factor in whether to approve the investment advisory and subâ€advisory agreements. Further, the Independent Trustees were advised by separate independent legal counsel throughout the process. The Trustees, including all of the Independent Trustees, concluded that: • the investment advisory fee rate was above the median expense group fee and the median expense universe fee, but within a reasonable range of such medians when considered in light of particular services provided to the CoreCommodity Fund; • the total expense ratios (after waivers) were near the median expense group fee and the median expense universe fee, and within a reasonable range of such medians when considered in light of particular services provided to the CoreCommodity Fund; • the nature, extent and quality of services rendered by ALPS Advisors under the Investment Advisory Agreement and by CoreCommodity under the Subâ€Advisory Agreement were adequate; • the performance of the CoreCommodity Fund was near median and generally favorable compared with the longâ€term performance of the funds in its performance peer universe; • there were no comparable accounts managed by CoreCommodity; • the profit realized by ALPS Advisors and CoreCommodity in connection with the operation of the CoreCommodity Fund is not unreasonable, especially in light of the fee waiver agreement between the Trust and CoreCommodity; and to the extent currently unprofitable, ALPS Advisors remains committed to the CoreCommodity Fund; and • there were no material economies of scale or other benefits accruing to ALPS Advisors in connection with its relationship with the CoreCommodity Fund. Based on the Trustees’ deliberations and their evaluation of the information described above, all of the Trustees, including all of the Independent Trustees in person at the meeting, concluded that ALPS Advisors’ and CoreCommodity’s compensation for investment advisory services is consistent with the best interests of the CoreCommodity Fund and its shareholders. The Trustees applied the same analysis to the advisory arrangements between ALPS Advisors, CoreCommodity and the wholly owned Cayman Island subsidiary of the CoreCommodity Fund. 207 | October 31, 2015 . Additional Information October 31, 2015 (Unaudited) RiverFront Global Allocation Series On June 9â€10, 2015, the Trustees met in person to discuss, among other things, the approval of the investment advisory agreement between the Trust and ALPS Advisors, Inc. (“ALPS Advisors”) (the “Investment Advisory Agreement”), and the subâ€advisory agreement with RiverFront Investment Group, LLC (“RiverFront”) (the “Subâ€Advisory Agreement”), in accordance with Section 15(c) of the 1940 Act. The Independent Trustees met with independent legal counsel during executive session and discussed the Investment Advisory Agreement, the Subâ€Advisory Agreement and other related materials. In renewing and approving the Investment Advisory Agreement with ALPS Advisors and the Subâ€Advisory Agreement with RiverFront, the Trustees, including the Independent Trustees, considered the following factors with respect to the RiverFront Global Allocation Series (the “RiverFront Funds”): Investment Advisory Fee Rate: The Trustees reviewed and considered the contractual annual advisory fee to be paid by (a) the Trust, on behalf of the RiverFront Funds, to ALPS Advisors of 0.85% of each RiverFront Fund’s daily average net assets and (b) by ALPS Advisors to RiverFront of 0.60% of each of the RiverFront Fund’s daily average net assets, in light of the extent and quality of the advisory services provided by the ALPS Advisors and RiverFront to the RiverFront Funds. The Board received and considered information including a comparison of each RiverFront Fund’s contractual and actual advisory fees and overall expenses with those of funds in the relevant peer expense group of funds provided by an independent provider of investment company data. The Trustees also considered information regarding compensation to be paid to affiliates of ALPS Advisors under other agreements, such as the Fund Accounting and Administration Agreement with ALPS. The Trustees noted that the investment advisory fee rate was generally above the median expense group fee and the median expense universe fee, but within a reasonable range of such medians when considered in light of particular services provided to each RiverFront Fund. Total Expense Ratios: Based on such information, the Trustees further reviewed and considered the total expense ratios (after waivers, subject to certain exclusions), of 0.90% for Class A, Class C, Class I, Class L and Investor Class shares of each of the RiverFront Funds, if applicable, taking into account the contractual fee waiver in place until February 29, 2016. The Trustees noted that the total expense ratios (after waivers) were within a reasonable range of, and sometimes below, the median expense group ratio and the median expense universe ratio when considered in light of particular services provided to the RiverFront Funds. Nature, Extent and Quality of the Services under the Investment Advisory Agreement and the Subâ€Advisory Agreement: The Trustees received and considered information regarding the nature, extent and quality of services provided to the RiverFront Funds under the Investment Advisory Agreement and the Subâ€Advisory Agreement. The Trustees reviewed certain background materials supplied by ALPS Advisors and RiverFront in each of their presentations, including their Forms ADV and compliance policies and procedures. The Trustees reviewed and considered ALPS Advisors’ and RiverFront’s investment advisory personnel, their history as asset managers, their performance and the amount of assets currently under management by ALPS Advisors and RiverFront. The Trustees also reviewed the research and decisionâ€making processes utilized by ALPS Advisors and RiverFront, including the methods adopted to seek to achieve compliance with the investment objectives, policies and restrictions of the RiverFront Funds. The Trustees considered the background and experience of ALPS Advisors’ and RiverFront’s management in connection with the RiverFront Funds, including reviewing the qualifications, backgrounds and responsibilities of the management team primarily responsible for the dayâ€toâ€day portfolio management of the RiverFront Funds and the extent of the resources devoted to research and analysis of actual and potential investments. The Trustees also reviewed the accompanying complianceâ€related materials and noted that they have received reports on these services and compliance issues from ALPS Advisors and RiverFront at each regular Board meeting throughout the year related to the services rendered by ALPS Advisors and RiverFront with respect to the RiverFront Funds. Performance: The Trustees reviewed performance information for each RiverFront Fund for the 1â€year, 2â€year, 3â€year and 4â€year periods ended March 31, 2015, as applicable. The review included a comparison of each of the RiverFront Fund’s performance to the performance of a universe of comparable funds selected by an independent provider of investment company data. The Trustees noted that, with the exception of the RiverFront Global Growth Fund, the net total return performance for each RiverFront Fund was generally below the respective performance universe average. The Trustees also considered RiverFront’s performance and reputation generally and its investment techniques, risk management controls and decisionâ€making processes. Comparable Accounts: The Trustees noted certain information provided by RiverFront regarding its typical fee ranges for UMA and SMA accounts. 208 | October 31, 2015 . Additional Information October 31, 2015 (Unaudited) Profitability: The Trustees received and considered a profitability analysis prepared by ALPS Advisors and by RiverFront based on the fees payable under the Investment Advisory Agreement and the Subâ€Advisory Agreement, respectively. The Trustees considered that certain of the RiverFront Funds were profitable to ALPS Advisors without the inclusion of distributionâ€related expenses, and that all of the RiverFront Funds were currently profitable to RiverFront excluding the RiverFront Conservative Income Builder Fund. The Trustees also considered ALPS Advisors’ and RiverFront’s statements regarding their continuing commitment to the RiverFront Funds despite any losses with respect to certain of the Funds. The Board then reviewed and discussed ALPS Advisors’ and RiverFront’s financial statements in order to analyze the financial condition and stability and profitability of each adviser. Economies of Scale: The Trustees considered whether economies of scale in the provision of services to the RiverFront Funds were being passed along to the shareholders. The Trustees considered whether any economies of scale, fallâ€out benefits or any other direct or indirect benefits would accrue to ALPS Advisors or RiverFront from their relationship with the Trust. Other Benefits to the Advisers: The Trustees reviewed and considered any other benefits derived or to be derived by ALPS Advisors and RiverFront from their relationship with the RiverFront Funds, including whether soft dollar arrangements were used. The Board summarized its deliberations with respect to the Investment Advisory Agreement with ALPS Advisors and the Subâ€Advisory Agreement with RiverFront. In selecting ALPS Advisors and RiverFront and approving the Investment Advisory Agreement and the Subâ€Advisory Agreement and fees under such agreements, the Trustees concluded that no single factor reviewed by the Trustees was identified by the Trustees to be determinative as the principal factor in whether to approve the Investment Advisory Agreement and the Subâ€Advisory Agreement. Further, the Independent Trustees were advised by separate independent legal counsel throughout the process. The Trustees, including all of the Independent Trustees, concluded that: • the investment advisory fee rate was generally above the median expense group fee and the median expense universe fee, but within a reasonable range of such medians when considered in light of particular services provided to each RiverFront Fund; • the total expense ratios (after waivers) were near, and sometimes below, the median expense group fee and the median expense universe fee, and within a reasonable range of such medians when considered in light of particular services provided to each RiverFront Fund; • the nature, extent and quality of services rendered by ALPS Advisors under the Investment Advisory Agreement and by RiverFront under the Subâ€Advisory Agreement were adequate; • the performance of each of the RiverFront Funds was generally below the respective performance universe average; • bearing in mind the limitations of comparing different types of managed accounts and the different levels of service typically associated with such accounts, the fee structures applicable to RiverFront’s other clients employing a comparable strategy were not indicative of any unreasonableness with respect to the advisory fees proposed to be payable by the RiverFront Funds; • the profit, if any, anticipated to be realized by ALPS Advisors and by RiverFront in connection with the operation of each RiverFront Fund is not unreasonable, especially in light of the fee waiver agreement among the Trust, ALPS Advisors and RiverFront, and to the extent currently unprofitable, ALPS Advisors and RiverFront remain committed to each of the RiverFront Funds; and • there were no material economies of scale or other benefits accruing to either ALPS Advisors or RiverFront in connection with its relationship with any RiverFront Fund. Based on the Trustees’ deliberations and their evaluation of the information described above, the Trustees, including all of the Independent Trustees, concluded that ALPS Advisors’ and RiverFront’s compensation for investment advisory services is consistent with the best interests of each of the RiverFront Funds and its shareholders. ALPS | Kotak India Growth Fund On June 9â€10, 2015, the Trustees met in person to discuss, among other things, the approval of the investment advisory agreement between the Trust and ALPS Advisors, Inc. (“ALPS Advisors”) (the “Investment Advisory Agreement”), and the subâ€advisory agreement with Kotak Mahindra (UK) Limited (“Kotak”) (the “Subâ€Advisory Agreement”), in accordance with Section 15(c) of the 1940 Act. The Independent Trustees met with independent legal counsel during executive session and discussed the Investment Advisory Agreement, the Subâ€Advisory Agreement and other related materials. In renewing and approving the Investment Advisory Agreement with ALPS Advisors and the Subâ€Advisory Agreement with Kotak, the Trustees, including the Independent Trustees, considered the following factors with respect to the ALPS | Kotak India Growth Fund (the “India Fund”): Investment Advisory Fee Rate: The Trustees reviewed and considered the contractual annual advisory fee to be paid by (a) the Trust, on behalf of the India Fund, to ALPS Advisors of 1.25% of the India Fund’s daily average net assets and (b) by ALPS Advisors to Kotak of (i) 1.15% of the India Fund’s daily average net assets on the first $50 million and 1.05% of the India Fund’s daily average net assets over $50 million, in light of the extent 209 | October 31, 2015 . Additional Information October 31, 2015 (Unaudited) and quality of the advisory services provided by the ALPS Advisors and Kotak to the India Fund. The Board received and considered information including a comparison of the India Fund’s contractual and actual advisory fees and overall expenses with those of funds in the relevant peer expense group of funds provided by an independent provider of investment company data. The Trustees also considered information regarding compensation to be paid to affiliates of ALPS Advisors under other agreements, such as the Fund Accounting and Administration Agreement with ALPS. The Trustees noted that the investment advisory fee rate was near the median expense group fee and the median expense universe fee, and within a reasonable range of such medians when considered in light of particular services provided to the India Fund. Total Expense Ratios: Based on such information, the Trustees further reviewed and considered the total expense ratio (net of waivers, subject to certain exclusions) of 1.60% for Class A shares, Class C shares and Class I shares, taking into account the contractual fee waiver in place until February 29, 2016. The Trustees noted that the total expense ratios (after waivers) were above the median expense group fee and the median expense universe fee, but within a reasonable range of such medians when considered in light of particular services provided to the India Fund. Nature, Extent and Quality of the Services under the Investment Advisory Agreement and the Subâ€Advisory Agreement: The Trustees received and considered information regarding the nature, extent and quality of services provided to the India Fund under the Investment Advisory Agreement and the Subâ€Advisory Agreement. The Trustees reviewed certain background materials supplied by ALPS Advisors and Kotak in each of their presentations, including their Forms ADV and compliance policies and procedures. The Trustees reviewed and considered ALPS Advisors’ and Kotak’s investment advisory personnel, their history as asset managers, their performance and the amount of assets currently under management by ALPS Advisors and Kotak. The Trustees also reviewed the research and decisionâ€making processes utilized by ALPS Advisors and Kotak, including the methods adopted to seek to achieve compliance with the investment objectives, policies and restrictions of the India Fund. The Trustees considered the background and experience of ALPS Advisors’ and Kotak’s management in connection with the India Fund, including reviewing the qualifications, backgrounds and responsibilities of the management team primarily responsible for the dayâ€toâ€day portfolio management of the India Fund and the extent of the resources devoted to research and analysis of actual and potential investments. The Trustees also reviewed the accompanying complianceâ€related materials and noted that they have received reports on these services and compliance issues from ALPS Advisors and Kotak at each regular Board meeting through the year related to the services rendered by ALPS Advisors and Kotak with respect to the India Fund. Performance: The Trustees reviewed performance information for the India Fund for the 1â€year, 2â€year, 3â€year, and 4â€year periods ended March 31, 2015. The review included a comparison of the India Fund’s performance to the performance of a group of comparable funds selected by an independent provider of investment company data. The Trustees noted that the India Fund had generally favorable performance when compared against comparable funds identified by an independent provider of investment company data. The Trustees also considered Kotak’s performance and reputation generally and its investment techniques, risk management controls and decisionâ€making processes. Comparable Accounts: The Trustees considered information provided by Kotak regarding fee schedules applicable to certain collective investment vehicles managed by Kotak and marketed outside the United States and certain other institutional clients. Profitability: The Trustees received and considered a profitability analysis prepared by ALPS Advisors and by Kotak based on the fees payable under the Investment Advisory Agreement and the Subâ€Advisory Agreement, respectively. The Trustees considered the losses realized by ALPS Advisors and by Kotak in connection with the operation of the India Fund. The Trustees also considered the advisers’ statements regarding their continuing commitment to the India Fund despite these losses. The Board then reviewed and discussed ALPS Advisors’ and Kotak’s financial statements in order to analyze the financial condition and stability and profitability of each adviser. Economies of Scale: The Trustees considered whether economies of scale in the provision of services to the India Fund were being passed along to the shareholders. The Trustees considered whether any economies of scale, fallâ€out benefits or any other direct or indirect benefits would accrue to ALPS Advisors or Kotak from their relationship with the Trust. Other Benefits to the Adviser: The Trustees reviewed and considered any other benefits derived or to be derived by ALPS Advisors and Kotak from their relationship with the India Fund, including whether soft dollar arrangements were used. The Board summarized its deliberations with respect to the Investment Advisory Agreement with ALPS Advisors and the Subâ€Advisory Agreement with Kotak. In selecting ALPS Advisors and Kotak and approving the Investment Advisory Agreement and the Subâ€Advisory Agreement and fees under such agreements, the Trustees concluded that no single factor reviewed by the Trustees was identified by the Trustees to be determinative 210 | October 31, 2015 . Additional Information October 31, 2015 (Unaudited) as the principal factor in whether to approve the Investment Advisory Agreement and the Subâ€Advisory Agreement. Further, the Independent Trustees were advised by separate independent legal counsel throughout the process. The Trustees, including all of the Independent Trustees, concluded that: • the investment advisory fee rate was generally near the median expense group fee and the median expense universe fee, and within a reasonable range of such medians when considered in light of particular services provided to the India Fund; • the total expense ratios (after waivers) were above the median expense group fee and the median expense universe fee, and within a reasonable range of such medians when considered in light of particular services provided to the India Fund; • the nature, extent and quality of services rendered by ALPS Advisors under the Investment Advisory Agreement and by Kotak under the Subâ€Advisory Agreement were adequate; • the performance of the India Fund was generally favorable to the performance of the funds in its performance peer universe over more recent periods; • bearing in mind the limitations of comparing different types of managed accounts and the different levels of service typically associated with such accounts, the fee structures applicable to Kotak’s other clients employing a comparable strategy were not indicative of any unreasonableness with respect to the advisory fees proposed to be payable by the India Fund; • the India Fund is currently unprofitable to ALPS Advisors and Kotak, and each remains committed to the India Fund; and • there were no material economies of scale or other benefits accruing to ALPS Advisors or Kotak in connection with its relationship with the India Fund. Based on the Trustees’ deliberations and their evaluation of the information described above, the Trustees, including all of the Independent Trustees, concluded that ALPS Advisors’ and Kotak’s compensation for investment advisory services is consistent with the best interests of the India Fund and its shareholders. ALPS | Alerian MLP Infrastructure Index Fund On June 9â€10, 2015, the Trustees met in person to discuss, among other things, the approval of the investment advisory agreement between the Trust and ALPS Advisors, Inc. (“ALPS Advisors”) (the “Investment Advisory Agreement”), in accordance with Section 15(c) of the 1940 Act. The Independent Trustees met with independent legal counsel during executive session and discussed the Investment Advisory Agreement and other related materials. In renewing and approving the Investment Advisory Agreement with ALPS Advisors, the Trustees, including the Independent Trustees, considered the following factors with respect to the ALPS | Alerian MLP Infrastructure Index Fund (the “Alerian Fund”): Investment Advisory Fee Rate: The Trustees reviewed and considered the contractual annual advisory fee to be paid by the Trust, on behalf of the Alerian Fund, to ALPS Advisors of 0.70% of the Fund’s average daily net assets, in light of the extent and quality of the advisory services to be provided by ALPS Advisors to the Alerian Fund. The Board received and considered information including a comparison of the Alerian Fund’s contractual and actual advisory fees and overall expenses with those of funds in the relevant peer expense group of funds provided by an independent provider of investment company data. The Trustees also considered information regarding compensation to be paid to affiliates of ALPS Advisors under other agreements, such as the Fund Accounting and Administration Agreement with ALPS. The Trustees noted that the investment advisory fee rate was less than the median expense group fee and the median expense universe fee. Total Expense Ratios: Based on such information, the Trustees further reviewed and considered the total expense ratio (net of waivers, subject to certain adjustments) of 0.85% for Class C, Class A and Class I shares of the Fund, taking into account the contractual fee waiver in place until February 29, 2016. The Trustees noted that the total expense ratio (after waivers) was less than the median expense group ratio and the median expense universe ratio. Nature, Extent and Quality of the Services under the Investment Advisory Agreement: The Trustees received and considered information regarding the nature, extent and quality of services provided to the Alerian Fund under the Investment Advisory Agreement. The Trustees reviewed certain background materials supplied by ALPS Advisors in its presentation, including its Form ADV. The Trustees reviewed and considered ALPS Advisors’ investment advisory personnel, its history as an asset manager and its performance and the amount of assets currently under management by ALPS Advisors and its affiliated entities. The Trustees also reviewed the research and decision†making processes utilized by ALPS Advisors, including the methods adopted to seek to achieve compliance with the investment objectives, policies and restrictions of the Alerian Fund. 211 | October 31, 2015 . Additional Information October 31, 2015 (Unaudited) The Trustees considered the background and experience of ALPS Advisors’ management in connection with the Alerian Fund, including reviewing the qualifications, backgrounds and responsibilities of the management team primarily responsible for the dayâ€toâ€day portfolio management of the Alerian Fund and the extent of the resources devoted to research and analysis of actual and potential investments. The Trustees also reviewed, among other things, ALPS Advisors’ Code of Ethics. Performance: The Trustees reviewed performance information for the Alerian Fund for the 1â€year and 2â€year periods ended March 31, 2015. The review included a comparison of the Alerian Fund’s performance to the performance of a universe of comparable funds selected by an independent provider of investment company data. The Trustees considered that, unlike many of its competitors, the Alerian Fund was based on a passive, indexâ€tracking strategy and was not actively managed. The Trustees also considered ALPS Advisors’ performance and reputation generally and its investment techniques, risk management controls and decisionâ€making processes. Comparable Accounts: The Trustees also considered information provided by ALPS Advisors regarding the fee rate applicable to a different investment company utilizing a similar strategy, noting ALPS Advisors’ statements regarding differences in competitive markets and operational structures. Profitability: The Trustees received and considered a profitability analysis prepared by ALPS Advisors based on the fees payable under the Investment Advisory Agreement. The Trustees considered the losses realized by ALPS Advisors in connection with the operation of the Alerian Fund. The Trustees also considered ALPS Advisors’ statements regarding its continuing commitment to the Alerian Fund despite these losses. The Board then reviewed and discussed ALPS Advisors’ financial statements in order to analyze the financial condition and stability and profitability of the adviser. Economies of Scale: The Trustees considered whether economies of scale in the provision of services to the Alerian Fund would be passed along to the shareholders. Other Benefits to the Adviser: The Trustees reviewed and considered any other incidental benefits derived or to be derived by ALPS Advisors from its relationship with the Alerian Fund, including whether soft dollar arrangements were used. In selecting ALPS Advisors as the Alerian Fund’s investment adviser and approving the Investment Advisory Agreement and the fees charged under the Investment Advisory Agreement, the Trustees concluded that no single factor reviewed by the Trustees was identified by the Trustees to be determinative as the principal factor in whether to approve the Investment Advisory Agreement. Further, the Independent Trustees were advised by independent legal counsel throughout the process. The Trustees, including all of the Independent Trustees, concluded that: • the investment advisory fee rate was generally below the median expense group fee and the median expense universe fee; • the total expense ratio (after waivers) were below the median expense group fee and the median expense universe fee, and within a reasonable range of such medians when considered in light of particular services provided to the Alerian Fund; • the nature, extent and quality of services rendered by ALPS Advisors under the Investment Advisory Agreement were adequate; • the performance history of the Alerian Fund, including the fact that its performance was within a reasonable range of those funds in its peer performance universe, and the fact that unlike many funds in the peer universe it did not follow an active management investment strategy; • bearing in mind the limitations of comparing different types of managed accounts and the different levels of service typically associated with such accounts, the fee structures applicable to ALPS Advisors’ other clients employing a comparable strategy were not indicative of any unreasonableness with respect to the advisory fees proposed to be payable by the Alerian Fund; • the profit, if any, realized by ALPS Advisors in connection with the operation of the Alerian Fund is not unreasonable to the Alerian Fund, and to the extent currently unprofitable to ALPS Advisors, ALPS Advisors remains committed to the Alerian Fund; and • there were no material economies of scale or other incidental benefits accruing to ALPS Advisors in connection with its relationship with the Alerian Fund at this time. Based on the Trustees’ deliberations and their evaluation of the information described above, the Trustees, including all of the Independent Trustees, concluded that ALPS Advisors’ compensation for investment advisory services is consistent with the best interests of the Alerian Fund and its shareholders. ALPS | Westport Resources Hedged High Income Fund On June 9â€10, 2015, the Trustees met in person to discuss, among other things, the approval of the investment advisory agreement between the Trust and ALPS Advisors, Inc. (“ALPS Advisors”) (the “Investment Advisory Agreement”), the coâ€investment advisory agreement among the Trust, ALPS Advisors and Westport Resources Management, Inc. (“Westport”) (the “Coâ€Investment Advisory Agreement”), and the subâ€advisory 212 | October 31, 2015 . Additional Information October 31, 2015 (Unaudited) agreements with each of Sound Point Capital Management, L.P. (“Sound Point”), Concise Capital Management, LP (“Concise Capital”) and Amundi Smith Breeden LLC (“Amundi Smith Breeden”) (the “Subâ€Advisory Agreements”), in accordance with Section 15(c) of the 1940 Act. The Independent Trustees met with independent legal counsel during executive session and discussed the Investment Advisory Agreement, the Coâ€Investment Advisory Agreement, the Subâ€Advisory Agreements and other related materials. In renewing and approving the Investment Advisory Agreement with ALPS Advisors, the Coâ€Investment Advisory Agreement with Westport and the Subâ€Advisory Agreements with Sound Point, Concise Capital and Amundi Smith Breeden, the Trustees, including the Independent Trustees, considered the following factors with respect to the ALPS | Westport Resources Hedged High Income Fund (the “Westport Resources Fund”): Investment Advisory Fee Rate: The Trustees reviewed and considered the contractual annual advisory fee rate paid by: • the Trust, on behalf of the Westport Resources Fund, to ALPS Advisors, the greater of (i) 0.20%, based on Fund’s average daily net assets, or (ii) $150,000; • the Trust, on behalf of the Westport Resources Fund, to Westport Resources of 1.50% of the Funds daily net assets; • Westport Resources to Sound Point of 1.00% of the Westport Fund’s daily average net assets allocated to Sound Point up to $50 million, and 0.80% of each of the Westport Fund’s daily average net assets allocated to Sound Point above $50 million; • Westport Resources to Concise Capital of 0.75% of the Westport Resources Fund’s daily average net assets allocated to Concise Capital; and • Westport Resources to Amundi Smith Breeden of 1.00% of the Westport Resources Fund’s daily average net assets allocated to Amundi Smith Breeden, each in light of the extent and quality of the advisory services to be provided by it to the Westport Resources Fund. The Board received and considered information including a comparison of the Westport Resources Fund’s contractual and actual advisory fees and overall expenses with those of funds in the relevant peer expense group of funds provided by an independent provider of investment company data. The Trustees also considered information regarding compensation to be paid to affiliates of ALPS Advisors under other agreements, such as the Fund Accounting and Administration Agreement with ALPS. The Trustees noted that the investment advisory fee rate was generally above the median expense group fee and the median expense universe fee, but within a reasonable range of such medians when considered in light of particular services provided to the Westport Resources Fund. The Trustees noted that the investment advisory fee rate was above the median expense group fee and the median expense universe fee, but within a reasonable range of such medians when considered in light of particular services provided to the Westport Fund. Total Expense Ratios: Based on such information, the Trustees further reviewed and considered the total expense ratios (net of waivers, subject to certain adjustments) of 1.99% for the Class A, Class C and Class I Shares of the Westport Resources Fund, taking into account the contractual fee waiver in place until February 29, 2016. The Trustees noted that the total expense ratios (after waivers) were above the median expense group fee and the median expense universe fee, but within a reasonable range of such medians when considered in light of particular services provided to the Westport Fund. Nature, Extent and Quality of the Services under the Advisory Agreements: The Trustees received and considered information regarding the nature, extent and quality of services to be provided to the Westport Resources Fund under the Investment Advisory Agreement with ALPS Advisors, the Coâ€Investment Advisory Agreement with Westport and the Subâ€Advisory Agreements with Sound Point, Concise Capital and Amundi Smith Breeden. The Trustees reviewed certain background materials supplied by each of ALPS Advisors, Westport, Sound Point, Concise Capital and Amundi Smith Breeden in its presentation, including its Form ADV. The Trustees reviewed and considered each entity’s investment advisory personnel, its history as asset managers and its performance and the amount of assets currently under management by it. The Trustees also reviewed the research and decisionâ€making processes utilized by each entity, including the methods adopted to seek to achieve compliance with the investment objectives, policies and restrictions of the portion of the Westport Resources Fund for which it was responsible. The Trustees considered the background and experience of each entity’s management in connection with the Westport Resources Fund, including reviewing the qualifications, backgrounds and responsibilities of the management team primarily responsible for the dayâ€toâ€day portfolio management of the Westport Resources Fund assets allocated to it and the extent of the resources devoted to research and analysis of actual and potential investments. The Trustees also reviewed, among other things, each entity’s Code of Ethics. Performance: The Trustees reviewed performance information for the Westport Resources Fund for the 1â€year period ended March 31, 2015. The review included a comparison of the Westport Resources Fund’s performance to the performance universe of comparable funds selected by an 213 | October 31, 2015 . Additional Information October 31, 2015 (Unaudited) independent provider of investment company data. The Trustees noted that the Westport Resources Fund’s performance was lower than the median for comparable funds, but reflected a very short period of time. Comparable Accounts. The Trustees also considered information provided by Sound Point, Concise Capital and Amundi Smith Breeden regarding the fee rates applicable to other comparable accounts managed by such subâ€adviser. Profitability: The Trustees received and considered a profitability analysis prepared by each entity based on the fees payable to such entity under the various agreements. The Trustees further considered the profits and losses realized by each entity in connection with the operation of the Westport Resources Fund, noting that the Westport Resources Fund was unprofitable to Westport and Amundi Smith Breeden, and Westport’s statements regarding its continuing commitment to the Westport Resources Fund despite its losses. Economies of Scale: The Trustees considered whether economies of scale in the provision of services to the Westport Resources Fund will be passed along to the shareholders under the proposed agreement. Other Benefits to the Adviser: The Trustees reviewed and considered any other incidental benefits derived or to be derived by any of the entities from its relationship with the Westport Resources Fund, including soft dollar arrangements. The Board summarized its deliberations with respect to the Investment Advisory Agreement with ALPS Advisors, the Coâ€Investment Advisory Agreement with Westport, and the Subâ€Advisory Agreements with Sound Point, Concise Capital and Amundi Smith Breeden. In selecting each entity and the fees charged under the agreements, the Trustees concluded that no single factor reviewed by the Trustees was identified by the Trustees to be determinative as the principal factor in whether to approve each of the agreements. Further, the Independent Trustees were advised by separate independent legal counsel throughout the process. The Trustees, including all of the Independent Trustees, concluded that: • the investment advisory fee rate was generally above the median expense group fee and the median expense universe fee, but within a reasonable range of such medians when considered in light of particular services provided to the Westport Resources Fund; • the total expense ratio (after waivers) were above the median expense group fee and the median expense universe fee, but within a reasonable range of such medians when considered in light of particular services provided to the Westport Resources Fund; • the nature, extent and quality of services rendered by each entity under its applicable agreement were adequate; • the performance of the Westport Resources Fund was generally lower than the median for comparable funds in its performance peer universe, but reflected a very short period of time; • bearing in mind the limitations of comparing different types of managed accounts and the different levels of service typically associated with such accounts, the fee structures applicable to each subâ€adviser’s other clients employing a comparable strategy were not indicative of any unreasonableness with respect to the advisory fees proposed to be payable by the Westport Resources Fund; • the profit, if any, anticipated to be realized by any entity in connection with the operation of the Westport Resources Fund is not unreasonable, and to the extent currently unprofitable, Westport remains committed to the Westport Resources Fund; and • there were no material economies of scale or other incidental benefits accruing to any entity in connection with its relationship with the Westport Resources Fund at this time. Based on the Trustees’ deliberations and their evaluation of the information described above, the Trustees, including all of the Independent Trustees, concluded that each entity’s compensation for investment advisory services is consistent with the best interests of the Westport Resources Fund and its shareholders. 214 | October 31, 2015 . Trustees and Officers October 31, 2015 (Unaudited) Additional information regarding the Funds’ trustees is included in the Statement of Additional Information, which can be obtained without charge by calling (tollâ€free) (866) 759â€5679. INDEPENDENT TRUSTEES Name, Address* & Year of Birth Number of Funds in Fund Complex Overseen by Trustee**** Position(s) Held with Fund Term of Office and Length of Time Served** Mary K. Anstine, 1940 Trustee Ms. Anstine was elected at a special meeting of shareholders held on March 21, 1997 and reâ€elected at a special meeting of shareholders held on August 7, 2009. Ms. Anstine was President/Chief Executive Officer of HealthONE Alliance, Denver, Colorado, and former Executive Vice President of First Interstate Bank of Denver. Ms. Anstine is also Trustee/Director of AV Hunter Trust and Colorado Uplift Board. Ms. Anstine was formerly a Director of the Trust Bank of Colorado (later purchased and now known as Northern Trust Bank) and a member of the American Bankers Association Trust Executive Committee. 63 Ms. Anstine is a Trustee of ALPS ETF Trust (21 funds); ALPS Variable Investment Trust (9 funds); Reaves Utility Income Fund (1 fund); and Westcore Trust (12 funds). John R. Moran, Jr., 1930 Trustee Mr. Moran was elected at a special meeting of shareholders held on March 21, 1997 and reâ€elected at a special meeting of shareholders held on August 7, 2009. Mr. Moran is formerly President and CEO of The Colorado Trust, a private foundation serving the health and hospital community in the state of Colorado. Currently, Mr. Moran is a member of the Treasurer’s Investment Advisory Committee for the University of Colorado. 34 None. Jeremy W. Deems, 1976 Trustee Mr. Deems was appointed as a Trustee at the March 11, 2008 meeting of the Board of Trustees and elected at a special meeting of shareholders held on August 7, 2009. Mr. Deems is the Coâ€Founder, Chief Operations Officer and Chief Financial Officer of Green Alpha Advisors, LLC. Mr. Deems is Coâ€Portfolio Manager of the Shelton Green Alpha Fund. Prior to joining Green Alpha Advisors, Mr. Deems was CFO and Treasurer of Forward Management, LLC, ReFlow Management Co., LLC, ReFlow Fund, LLC, a private investment fund, and Sutton Place Management, LLC, an administrative services company, from 2004 to June 2007. 65 Mr. Deems is a Trustee of ALPS ETF Trust (21 funds); ALPS Variable Investment Trust (9 funds); Reaves Utility Income Fund (1 fund); and Clough Funds Trust (1 fund). Principal Occupation(s) During Past 5 Years*** * ** Other Directorships Held by Trustee All communications to Trustees and Officers may be directed to Financial Investors Trust c/o 1290 Broadway, Suite 1100, Denver, CO 80203. This is the period for which the Trustee or Officer began serving the Trust. Each Trustee and/or Officer serves an indefinite term, until his successor is elected. *** Except as otherwise indicated, each individual has held the office shown or other offices in the same company for the last five years. **** The Fund Complex includes all series of the Trust, currently 34, and any other investment companies for which any Trustee serves as Trustee for and which ALPS Advisors, Red Rocks, Wellington Management, Clough Capital, RiverFront, Kotak, RREEF America, Westport Resources, Concise Capital Management, LP, Amundi Smith Breeden LLC, Sound Point Capital Management, L.P. or Sterling Global Strategies LLC provides investment advisory services (currently 38 funds, 0 funds, 0 funds, 4 funds, 1 fund, 0 funds, 0 funds, 0 funds, 0 funds, 0 funds, 0 funds and 0 funds, respectively). 215 | October 31, 2015 . Trustees and Officers October 31, 2015 (Unaudited) INDEPENDENT TRUSTEES Name, Address* & Year of Birth Number of Funds in Fund Complex Overseen by Trustee**** Position(s) Held with Fund Term of Office and Length of Time Served** Jerry G. Rutledge, 1944 Trustee Mr. Rutledge was elected at a special meeting of shareholders held on August 7, 2009. Mr. Rutledge is the President and owner of Rutledge’s Inc., a retail clothing business. He was from 1994 to 2007 a Regent of the University of Colorado. 38 Mr. Rutledge is a Trustee of Principal Real Estate Income Fund (1 fund), Clough Global Allocation Fund (1 fund), Clough Global Equity Fund (1 fund) and Clough Global Opportunities Fund (1 fund). Michael “Ross” Shell, 1970 Trustee Mr. Shell was elected at a special meeting of shareholders held on August 7, 2009. Mr. Shell is Founder and CEO of Red Idea, LLC, a strategic consulting/early stage venture firm (since June 2008). From 1999 to 2009, he was a part†owner and Director of Tesser, Inc., a brand agency. From December 2005 to May 2008, he was Director, Marketing and Investor Relations, of Woodbourne, a REIT/real estate hedge fund and private equity firm. Prior to this, from May 2004 to November 2005, he worked as a business strategy consultant; from June 2003 to April 2004, he was on the Global Client Services team of IDEO, a product design/innovation firm; and from 1999 to 2003, he was President of Tesser, Inc. Mr. Shell graduated with honors from Stanford University with a degree in Political Science. 34 None. Principal Occupation(s) During Past 5 Years*** * ** Other Directorships Held by Trustee All communications to Trustees and Officers may be directed to Financial Investors Trust c/o 1290 Broadway, Suite 1100, Denver, CO 80203. This is the period for which the Trustee or Officer began serving the Trust. Each Trustee and/or Officer serves an indefinite term, until his successor is elected. *** Except as otherwise indicated, each individual has held the office shown or other offices in the same company for the last five years. **** The Fund Complex includes all series of the Trust, currently 34, and any other investment companies for which any Trustee serves as Trustee for and which ALPS Advisors, Red Rocks, Wellington Management, Clough Capital, RiverFront, Kotak, RREEF America, Westport Resources, Concise Capital Management, LP, Amundi Smith Breeden LLC, Sound Point Capital Management, L.P. or Sterling Global Strategies LLC provides investment advisory services (currently 38 funds, 0 funds, 0 funds, 4 funds, 1 fund, 0 funds, 0 funds, 0 funds, 0 funds, 0 funds, 0 funds and 0 funds, respectively). 216 | October 31, 2015 . Trustees and Officers October 31, 2015 (Unaudited) INTERESTED TRUSTEE Name, Address* & Year of Birth Edmund J. Burke, 1961 * ** *** **** Position(s) Held with Fund Term of Office and Length of Time Served** Trustee, Chairman and President Mr. Burke was elected as Chairman at the August 28, 2009 meeting of the Board of Trustees. Mr. Burke was elected as Trustee at a special meeting of shareholders held on August 7, 2009. Mr. Burke was elected President of the Trust at the December 17, 2002 meeting of the Board of Trustees. Principal Occupation(s) During Past 5 Years*** Mr. Burke is President and a Director of ALPS Holdings, Inc. (“AHI”) (since 2005) and Director of Boston Financial Data Services, Inc. (“BFDS”), ALPS Advisors, Inc. (“AAI”), ALPS Distributors, Inc. (“ADI”), ALPS Fund Services, Inc. (“AFS”) and ALPS Portfolio Solutions Distributor, Inc. (“APSD”) and from 2001â€2008, was President of AAI, ADI, AFS and APSD. Because of his positions with AHI, BFDS, AAI, ADI, AFS and APSD, Mr. Burke is deemed an affiliate of the Trust as defined under the 1940 Act. Mr. Burke is Trustee and President of the Clough Global Allocation Fund (Trustee since 2006; President since 2004); Trustee and President of the Clough Global Equity Fund (Trustee since 2006; President since 2005); Trustee and President of the Clough Global Opportunities Fund (since 2006); Trustee of the Liberty Allâ€Star Equity Fund; and Director of the Liberty Allâ€Star Growth Fund, Inc. Number of Funds in Fund Complex Overseen by Trustee**** 40 Other Directorships Held by Trustee Mr. Burke is a Trustee of Clough Global Allocation Fund (1 fund); Clough Global Equity Fund (1 fund); Clough Global Opportunities Fund (1 fund); Clough Funds Trust (1 fund); Trustee of the Liberty Allâ€Star Equity Fund (1 fund); and Director of the Liberty Allâ€Star Growth Fund, Inc. (1 fund). All communications to Trustees and Officers may be directed to Financial Investors Trust c/o 1290 Broadway, Suite 1100, Denver, CO 80203. This is the period for which the Trustee began serving the Trust. Each Trustee serves an indefinite term, until his successor is elected. Except as otherwise indicated, each individual has held the office shown or other offices in the same company for the last five years. The Fund Complex includes all series of the Trust, currently 34, and any other investment companies for which any Trustee serves as Trustee for and which ALPS Advisors, Red Rocks, Wellington Management, Clough Capital, RiverFront, Kotak, RREEF America, Westport Resources, Concise Capital Management, LP, Amundi Smith Breeden LLC, Sound Point Capital Management, L.P. or Sterling Global Strategies LLC provides investment advisory services (currently 38 funds, 0 funds, 0 funds, 4 funds, 1 fund, 0 funds, 0 funds, 0 funds, 0 funds, 0 funds, 0 funds and 0 funds, respectively). 217 | October 31, 2015 . Trustees and Officers October 31, 2015 (Unaudited) OFFICERS Name, Address* & Year of Birth Position(s) Held with Fund Term of Office and Length of Time Served** Principal Occupation(s) During Past 5 Years*** Kimberly R. Storms, 1972 Treasurer Ms. Storms was elected Treasurer of the Trust at the March 12, 2013 meeting of the Board of Trustees. Ms. Storms is Senior Vice President †Director of Fund Administration of ALPS. Ms. Storms joined ALPS in 1998 as Assistant Controller. Because of her position with ALPS, Ms. Storms is deemed an affiliate of the Trust as defined under the 1940 Act. Ms. Storms is also Treasurer of BPV Family of Funds and ALPS Series Trust; Assistant Treasurer of Liberty Allâ€Star Equity Fund and Liberty Allâ€Star Growth Fund, Inc.; Assistant Treasurer of Tilson Funds; and Chief Financial Officer of The Arbitrage Funds. JoEllen L. Legg, 1961 Secretary Ms. Legg was elected Secretary of the Trust at the September 15, 2015 meeting of the Board of Trustees. Ms. Legg joined ALPS in October 2007 and is currently Vice President, Assistant General Counsel of ALPS. Prior to joining ALPS, Ms. Legg served as Senior Counsel †Law (Corporate & Securities) for Adelphia Communications Corporation (February 2005 †March 2007). Prior to this, Ms. Legg held associate positions at Fried Frank Harris Shriver & Jacobson LLP (1998 †2004) and at Patton Boggs LLP (2004 †2005). Because of her position with ALPS, Ms. Legg is deemed an affiliate of the Trust as defined under the 1940 Act. Ms. Legg is also the Secretary of ALPS Series Trust and Reaves Utility Income Fund and Assistant Secretary of Griffin Institutional Access Real Estate Fund. Mr. Uhl was appointed CCO of the Trust at the June 8, 2010 meeting of the Board of Trustees. Mr. Uhl joined ALPS in October 2006, and is currently Deputy Compliance Officer of ALPS. Prior to his current role, Mr. Uhl served as Senior Risk Manager for ALPS from October 2006 until June 2010. Before joining ALPS, Mr. Uhl served a Sr. Analyst with Enenbach and Associates (RIA), and a Sr. Financial Analyst at Sprint. Because of his position with ALPS, Mr. Uhl is deemed an affiliate of the Trust as defined under the 1940 Act. Mr. Uhl is also CCO of the Clough Global Funds, Reaves Utility Income Fund, Drexel Hamilton Funds and Transparent Value Trust. Ted Uhl, 1974 Chief Compliance Officer (“CCO”) * All communications to Trustees and Officers may be directed to Financial Investors Trust c/o 1290 Broadway, Suite 1100, Denver, CO 80203. ** This is the period for which the Trustee began serving the Trust. Each Trustee serves an indefinite term, until his successor is elected. *** Except as otherwise indicated, each individual has held the office shown or other offices in the same company for the last five years. 218 | October 31, 2015 . Trustees and Officers October 31, 2015 (Unaudited) OFFICERS (continued) Name, Address* & Year of Birth Position(s) Held with Fund Term of Office and Length of Time Served** Principal Occupation(s) During Past 5 Years*** Jennell Panella, 1974 Assistant Treasurer Ms. Panella was elected Assistant Treasurer of the Trust at the September 15, 2015 meeting of the Board of Trustees. Ms. Panella joined ALPS in June 2012 and is currently Fund Controller of ALPS Fund Services, Inc. Prior to joining ALPS, Ms. Panella served as Financial Reporting Manager for Parker Global Strategies, LLC (2009â€2012). Because of her position with ALPS, Ms. Panella is deemed an affiliate of the Trust as defined under the 1940 Act. Ms. Panella also serves as Assistant Treasurer of James Advantage Funds. Nate Mandeville, 1977 Assistant Treasurer Mr. Mandeville was elected Assistant Treasurer of the Trust at the September 15, 2015 meeting of the Board of Trustees. Mr. Mandeville joined ALPS in December 2013 and is Fund Controller for ALPS. Prior to joining ALPS, Mr. Mandeville worked for Greatâ€West Financial (2011â€2013), Virtuoso Sourcing Group (2008â€2011) and Janus Capital Group (2000â€2008). Because of his position with ALPS, Mr. Mandeville is deemed an affiliate of the Trust as defined under the 1940 Act. Mr. Mandeville also serves as Assistant Treasurer of ALPS Series Trust. Sharon Akselrod, 1974 Assistant Secretary Ms. Akselrod was elected Assistant Secretary of the Trust at the September 15, 2015 meeting of the Board of Trustees. Ms. Akselrod joined ALPS in August 2014 and is currently Senior Investment Company Act Paralegal of ALPS Fund Services, Inc. Prior to joining ALPS, Ms. Akselrod served as Corporate Governance and Regulatory Associate for Nordstrom fsb (2013†2014) and Senior Legal Assistant – Legal Manager for AXA Equitable Life Insurance Company (2008â€2013). Because of her position with ALPS, Ms. Akselrod is deemed an affiliate of the Trust as defined under the 1940 Act. * All communications to Trustees and Officers may be directed to Financial Investors Trust c/o 1290 Broadway, Suite 1100, Denver, CO 80203. ** This is the period for which the Trustee began serving the Trust. Each Trustee serves an indefinite term, until his successor is elected. *** Except as otherwise indicated, each individual has held the office shown or other offices in the same company for the last five years. 219 | October 31, 2015 . . . ANNUAL REPORT | October 31, 2015 The Management Commentaries included in this shareholder report contain certain forward-looking statements about the factors that may affect the performance of the Funds in the future. These statements are based on Fund management’s predictions and expectations concerning certain future events and their expected impact on the Funds, such as performance of the economy as a whole and of specific industry sectors, changes in the levels of interest rates, the impact of developing world events, and other factors that may influence the future performance of the Funds. Management believes these forward-looking statements to be reasonable, although they are inherently uncertain and difficult to predict. Actual events may cause adjustments in portfolio management strategies from those currently expected to be employed. Must be accompanied or preceded by a prospectus.
Investors are reminded to read the prospectus carefully before investing. ALPS Portfolio Solutions Distributor, Inc., distributor. ALP000903 .


