


Description
Class A, C & I Fund Update | December 31, 2015
Description
Fund Facts
ƒƒ
Symbols & CUSIPS
The ALPS | Red Rocks Listed Private Equity Fund is an open-end mutual fund that
provides investors with exposure to private businesses by investing in publicly-traded
private equity companies that trade on global exchanges. These listed private equity
companies have direct ownership, control and influence over the privately held
businesses in their portfolios. The Fund assembles approximately 30-50 holdings
and is diversified by stage of investment, geography, industry, and capital structure.
Investors enjoy daily liquidity and valuation, and the primary mission of the Fund is
to maximize total return.
Role in Portfolio
The ALPS | Red Rocks Listed Private Equity Fund may be used to potentially reduce risk and
generate alpha in a diversified portfolio. A Ibbotson study suggests a typical allocation range
from 0-10%, according to risk tolerance, with a market neutral allocation of roughly 3%.1
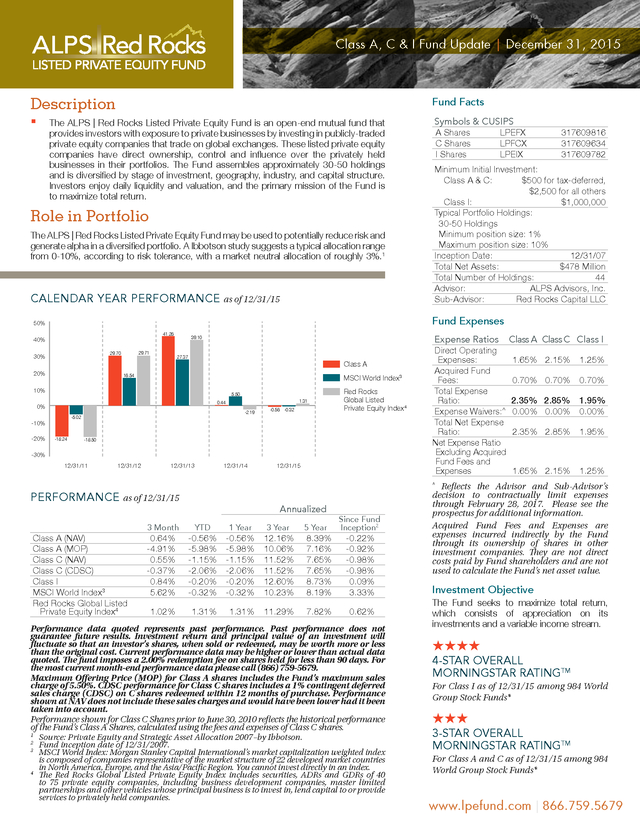
CALENDAR YEAR PERFORMANCE as of 12/31/15
LPEFX
LPFCX
LPEIX
317609816
317609634
317609782
Minimum Initial Investment:
Class A & C:
$500 for tax-deferred,
$2,500 for all others
Class I:
$1,000,000
Typical Portfolio Holdings:
30-50 Holdings
Minimum position size: 1%
Maximum position size: 10%
Inception Date:
12/31/07
Total Net Assets:
$478 Million
Total Number of Holdings:
44
Advisor:
ALPS Advisors, Inc.
Sub-Advisor:
Red Rocks Capital LLC
Fund Expenses
50%
41.26
40%
29.71
29.70
30%
Expense Ratios
39.10
27.37
Class A
20%
16.54
MSCI World Index3
10%
5.50
1.31
0.44
0%
-2.19
-5.02
-10%
-20%
A Shares
C Shares
I Shares
-18.24
-0.56 -0.32
Red Rocks
Global Listed
Private Equity Index4
-18.50
-30%
12/31/11
12/31/12
12/31/13
12/31/14
12/31/15
Direct Operating
Expenses:
Acquired Fund
Fees:
Total Expense
Ratio:
Expense Waivers:^
Total Net Expense
Ratio:
Net Expense Ratio
Excluding Acquired
Fund Fees and
Expenses
Class A Class C Class I
1.65% 2.15%
1.25%
0.70% 0.70%
0.70%
2.35% 2.85%
0.00% 0.00%
1.95%
0.00%
2.35% 2.85%
1.95%
1.65% 2.15%
1.25%
Reflects the Advisor and Sub-Advisor’s
decision to contractually limit expenses
through February 28, 2017. Please see the
prospectus for additional information.
Acquired Fund Fees and Expenses are
expenses incurred indirectly by the Fund
through its ownership of shares in other
investment companies. They are not direct
costs paid by Fund shareholders and are not
used to calculate the Fund’s net asset value.
^
PERFORMANCE as of 12/31/15
Annualized
Class A (NAV)
Class A (MOP)
Class C (NAV)
Class C (CDSC)
Class I
MSCI World Index3
Red Rocks Global Listed
Private Equity Index4
5 Year
Since Fund
Inception2
3 Month
YTD
1 Year
3 Year
0.64%
-4.91%
0.55%
-0.37%
0.84%
5.62%
-0.56%
-5.98%
-1.15%
-2.06%
-0.20%
-0.32%
-0.56%
-5.98%
-1.15%
-2.06%
-0.20%
-0.32%
12.16%
10.06%
11.52%
11.52%
12.60%
10.23%
8.39%
7.16%
7.65%
7.65%
8.73%
8.19%
-0.22%
-0.92%
-0.98%
-0.98%
0.09%
3.33%
1.02%
1.31%
1.31%
11.29%
7.82%
0.62%
Performance data quoted represents past performance.
Past performance does not guarantee future results. Investment return and principal value of an investment will fluctuate so that an investor’s shares, when sold or redeemed, may be worth more or less than the original cost. Current performance-18.85 may be higher or lower than actual data data quoted.
The fund imposes a 2.00% redemption fee on shares held for less than 90 days. For the most current month-end performance data please call (866) 759-5679. Maximum Offering Price (MOP) for Class A shares includes the Fund’s maximum sales charge of 5.50%. CDSC performance for Class C shares includes a 1% contingent deferred sales charge (CDSC) on C shares redeemed within 12 months of purchase.
Performance shown at NAV does not include these sales charges and would have been lower had it been taken into account. Performance shown for Class C Shares prior to June 30, 2010 reflects the historical performance of the Fund’s Class A Shares, calculated using the fees and expenses of Class C shares. Source: Private Equity and Strategic Asset Allocation 2007–by Ibbotson. Fund inception date of 12/31/2007. MSCI World Index: Morgan Stanley Capital International’s market capitalization weighted index is composed of companies representative of the market structure of 22 developed market countries in North America, Europe, and the Asia/Pacific Region. You cannot invest directly in an index. 4 The Red Rocks Global Listed Private Equity Index includes securities, ADRs and GDRs of 40 to 75 private equity companies, including business development companies, master limited partnerships and other vehicles whose principal business is to invest in, lend capital to or provide services to privately held companies. 1 2 3 Investment Objective The Fund seeks to maximize total return, which consists of appreciation on its investments and a variable income stream. HHHH 4-STAR OVERALL MORNINGSTAR RATINGTM For Class I as of 12/31/15 among 984 World Group Stock Funds* HHH 3-STAR OVERALL MORNINGSTAR RATINGTM For Class A and C as of 12/31/15 among 984 World Group Stock Funds* www.lpefund.com | 866.759.5679 . Other-Geography Consumer Staples Far East/Asia & Japan N Amer & Canada ALPS | RED ROCKS LISTED PRIVATE EQUITY FUND Other-Industry Class A, C & I Fund Update | December 31, 2015 Utilities 0.6% Materials Europe PORTFOLIO DIVERSIFICATION OF UNDERLYING HOLDINGS Utilities Materials 2.3% Other-Industry 2.4% Consumer Staples TOP 10 HOLDINGS^ Aurelius AG Geographic Allocation 3.7% 5.3% Energy 6.28% 5.5% Telecomm HarbourVest Global Private Equity, Ltd. IT Brookfield Asset Management, Inc., Healthcare Class A Consumer Discretionary Financial Services 3i Group PLC Industrials The Blackstone Group LP Other-Industry Energy 4.14% 3.88% Wendel SA Consumer Staples Telecomm 4.30% SVG Capital PLC Materials Utilities 4.56% Onex Corp. Industry 4.58% Ackermans & van Haaren N.V. Europe - 53.8% North America & Canada - 33.2% Far East/Asia & Japan - 5.6% Other-Geography - 4.5% Australia & New Zealand - 1.5% South America - 1.4% 5.56% 3.84% Eurazeo SA 1.1% 1.3% 3.83% 45.66% Top Ten Holdings 44 Total Number of Holdings 3.1% 3.5% ^ 5.4% 10.8% Healthcare Future holdings are subject to change. Stage of Investment 5.8% IT 10.9% 60.3% 17.1% Consumer Discretionary 18.5% Financial Services 29.7% 22.6% Industrials Vintage Year 1 2014 2013 2012 2011 2010 2009 2008 2007 2006 2005 2004 2003 Cash 4.69% 10.0% 3.5% 6.9% 6.9% 5.9% 10.5% 9.0% Early Mid Late Early Mid Capital Structure 5.5% 10.2% Late 14.1% Debt 8% 7.9% 4.2% 15.8% 10.1% The year in which the first allocation of investment capital is delivered by a private equity company to a project or portfolio company. Data presented is as of 12/31/15. Debt Source: Listed Private Equity company financial information/filings, portfolio company estimates and Red Rocks Capital LLC analysis. Equity 1 IMPORTANT DISCLOSURES & DEFINITIONS An investor should consider investment objectives, risks, charges and expenses carefully before investing. To obtain a prospectus, which contains this and other information, please contact your investment professional. Read the prospectus carefully before investing. Certain of the Fund’s investments may be exposed to liquidity risk due to low trading volume, lack of a market maker or legal restrictions limiting the ability of the Fund to sell particular securities at an advantageous price and/or time. As a result these securities may be more difficult to value.
Foreign investing involves special risks such as currency fluctuations and political uncertainty. The Fund invests in derivatives and is subject to the risk that the value of those derivative investments will fall because of pricing difficulties or lack of correlation with the underlying investment. There are inherent risks in investing in private equity companies, which encompass financial institutions or vehicles whose principal business is to invest in and lend capital to privately – held companies. Generally, little public information exists for private and thinly traded companies, and there is a risk that investors may not be able to make a fully informed investment decision. Listed Private Equity Companies may have relatively concentrated investment portfolios, consisting of a relatively small number of holdings.
A consequence of this limited number of investments is that the aggregate returns realized may be adversely impacted by the poor performance of a small number of investments, or even a single investment, particularly if a company experiences the need to write down the value of an investment. * For each fund with at least a three-year history, Morningstar calculates a Morningstar RatingTM based on a Morningstar Risk-Adjusted Return measure that accounts for variation in a fund’s monthly performance (including the effects 92% Equity lpefund@alpsinc.com | 866.759.5679 of sales charges, loads, and redemption fees), placing more emphasis on downward variations and rewarding consistent performance. The Overall Morningstar RatingTM for a fund is derived from a weighted average of the performance figures associated with its three-, five- and ten-year (if applicable) Morningstar RatingTM metrics. The top 10% of funds in each category receive 5 stars, the next 22.5% receive 4 stars, the next 35% receive 3 stars, the next 22.5% receive 2 stars and the bottom 10% receive 1 star.
(Each share class is counted as a fraction of one fund within this scale and rated separately, which may cause slight variations in the distribution percentages.) As of 12/31/2015 The ALPS | Red Rocks Listed Private Equity Fund Class C and A were rated against 781 and 984 World Stock funds over the 5- and 3-year periods and received 3 and 4 stars, respectively. The ALPS | Red Rocks Listed Private Equity Fund Class I was rated against 781 and 984 World Stock funds over the 5- and 3-year periods and received 4 and 5 stars, respectively. Other classes may have different performance characteristics.
©2015 Morningstar, Inc. All Rights Reserved. The information contained herein: (1) is proprietary to Morningstar; (2) may not be copied or distributed; and (3) is not warranted to be accurate, complete or timely.
Neither Morningstar nor its content providers are responsible for any damages or losses arising from any use of this information. Past performance is no guarantee of future results. Alpha: A measure of performance on a risk-adjusted Market Neutral Allocation: An investment strategy that aims to produce almost the same profit regardless of market circumstances. Not FDIC Insured • No Bank Guarantee • May Lose Value ALPS | Red Rocks Listed Private Equity Fund is a series of Financial Investors Trust. ALPS Portfolio Solutions Distributor, Inc., distributor for the ALPS | Red Rocks Listed Private Equity Fund. RRC000524 4/30/16 ML15-005416 11/6/2016 9.4 .


