


Description
U.S. Equity Indices | December 2015
KEY HIGHLIGHTS
•
•
•
•
The S&P 500® decreased 1.75% in December, bringing its YTD return to -0.73%.
The Dow Jones Industrial Average® returned -1.66% this month and was off 2.23% YTD.
The S&P MidCap 400® was down 4.33% for the month and 3.71% YTD.
The S&P SmallCap 600® returned -4.95% in December, bringing its YTD return to -3.36%.
Exhibit 1: Index Returns
Index
1-Month (%)
YTD (%)
2-Year (%)
S&P 500
-1.75
-0.73
10.58
Dow Jones Industrial Average
-1.66
-2.23
5.12
S&P MidCap 400
-4.33
-3.71
4.17
S&P SmallCap 600
-4.95
-3.36
0.93
Source: S&P Dow Jones Indices LLC. Data as of Dec. 31, 2015.
Past performance is no guarantee of future results. Table is provided for illustrative purposes. Returns shown are price returns. MARKET SNAPSHOT 2015 is in the history books, and as the bubbly goes down, a (somewhat) sobering reflection emerges. For 2015, the S&P 500 was down 0.73%, as the last trading day of the year posted a 0.94% decline, putting the year into the red.
The annual decline, however, was after three years of double-digit gains and a bull market that is 82 months old (the average is 59), with the index closing 4.08% off its all-time closing high, set on May 21, 2015, at 2,130.82. So, if 2015 was the payback, fine; however, if the economy slows even more, and if either Europe or China slide, year-end 2015 could mark the start of a decline. By year-end 2015, oil got comfortable with the mid-to-upper USD 30s, as several research reports got comfortable with USD 20 projections (oil was at USD 53 at the beginning of the year and USD 105 in June 2014).
In 2015, two-thirds of the issues moved at least 10%, and over one-quarter moved at least 25%—it will be interesting to see who did what (look for old-fashioned advertisements in newspapers declaring the victories). Contributor: Howard Silverblatt, Index Investment Strategy, Senior Industry Analyst, howard.silverblatt@spdji.com S&P Dow Jones Indices’ Market Attributes® series provides market commentary highlighting developments across various asset classes. . Market Attributes | U.S. Equities December 2015 M&A deals continued, and 2015 was already a record year by November; while a slowdown is expected, it would be from a record level. As for 2016, there appear to be many issues to watch and think about (we’ll see about trading). The Fed’s interest rate increase schedule should be topic one, but the decision will be based on the data—so keeping your eye on the data (and the trades) may be key.
New borrowing for future needs (beyond 2016, as interest rates remain low but are expected to increase) should start to show itself about halfway through the year, once we see what the Fed is doing. A reduction in M&A from the record-setting 2015 is expected, but it should remain at a high level; inversion rules may be more public talk than enforceable rules. Another thing to watch for would be the IMF’s addition of the Chinese yuan to the currency basket, set for Oct.
1, 2016. In economic news, there was a rare case of “expect and you shall get,” as the U.S. Fed increased interest rates by 0.25%, which had been expected by almost everyone, and markets moved up on the expected, and actual, event. The increase then replaced one unknown question (“When will they start?”) with another question (“When is the next one?”), with concerns over oil, corporate earnings, and spending continuing in the background.
As for the Fed statement and guidance, it was as close to scripted as could have been hoped (or traded) for. The Fed saw the economy as stronger and expected it to improve in 2016, with the unemployment rate expected to continue to decrease, and a few economists commenting that low unemployment could cause a spike in inflation. The Fed guided toward four increases of 0.25% each in 2016—or at least that was the Street’s interpretation.
The economic takeaway was for a slow, steady, and data-dependent series of interest rate increases, which removed some uncertainty—a scenario the Street could live with. In other economic news, the IMF, as expected, announced the addition of the Chinese yuan to its currencies of lending reserve, effective Oct. 1, 2016, while China said it would double the trading hours for the yuan in preparation.
In China, the official November Manufacturing PMI fell to 49.6 from 49.8, while the Services PMI increased to 53.6 from 53.1, and Chinese exports declined (6% year-over-year in November), as did imports (down 8.7% year-over-year in November). Industrial production came in higher than expected, coming in up 6.2% year-over-year in November, when a lower rate of 5.7% was expected. Japan revised its GDP to a rate of up 1.0% from the initially released 0.8% decline, meaning it was not in a recession.
The 19 EU nations grew 0.3% for the third quarter, which was down from the second quarter’s 0.4% gain, as the U.K. came in with an annual rate of 2.1%. The ECB reduced the bank deposit rate to -0.30% from the previous -0.20%, as it extended its asset buying by six months (to March 2017), but it failed to increase the USD 63 billion level of monthly buying—which was expected (helped by ECB President Draghi’s “whatever it takes” attitude).
Since the market is all about expectations, markets retreated on the news, with the euro moving up. The Bank of Japan slightly increased its quantitative easing program by buying longer-term bonds (from 7-year to 10-year maturities to 7-year to 12-year maturities). The People’s Bank of China estimated that China would grow 6.8% in 2016, slightly down from the prior expectation of 6.9%.
In the U.S., the third and final report on third-quarter GDP came in as expected, at 2.0%. The ISM Non-Manufacturing Index for November disappointed (coming in at 55.9, when a level of 59.1 was expected), as did the ISM manufacturing report (coming in at 48.6, when 50.5 was expected). Construction Spending for October came in stronger than expected, up 1.0% for the month, when a 0.6% gain was expected, as the year-over-year increase was 13.0%.
The U.S. November employment report posted 211,000 net new jobs, when 190,000 new jobs were expected for the month, and construction jobs were up (46,000), with most of that gain in residential construction (26,000). The unemployment rate was flat (at 5.0%; 7.9 million workers), as the average hours worked slightly declined to 34.5 from an upwardly restated 34.6 last month, which was originally reported at 34.5, with the average hourly wage increasing 0.2% (to USD 25.25). November exports declined more 2 .
Market Attributes | U.S. Equities December 2015 than expected, while imports came in better, with the takeaway being that exports were off 6.3% yearover-year and imports were off 9.4% year-over-year. The November CPI ex-food and energy rate was at 2.0% year-over-year. U.S.
housing news was mixed, but optimism continued. The NAHB Housing Market Index came in down, while Housing Starts, the FHFA Home Price Index, and the S&P/CaseShiller Home Price Index all came in better than expected, but the New Home Sales report missed its expectation. However, the headline grabber was the Existing Home Sales report, which came in with a 10.5% decline and a year-over-year change of -3.8%. In global M&A, 2015 was reportedly at USD 4.30 trillion through November, surpassing the record of USD 4.29 trillion in 2007, with the U.S.
component reported to be in excess of USD 2 trillion. General Electric (GE; up 4.0% for the month) said it had abandoned its plans to sell its portion of its household appliance business to Electrolux (ELUXY; off 17.6% for the month) for a planned USD 3.3 billion. JAB Holdings (which holds other coffee producers) said it would buy Keurig Green Mountain (GMCR) for USD 13.9 billion, a 78% premium.
The amazing premium, however, is relative, as Keurig Green Mountain closed the month up 71.2% but off 32.0% for the year. Chemical issues Dow Chemical (DOW; off 1.2% for the month) and E.I. Du Pont De Nemours (DD; off 1.1% for the month) said it would merge via a share swap deal, resulting in almost equal ownership.
U.K. biopharmaceutical issue AstraZeneca (AZN; off 0.3% for the month) said it was in talks to acquire privately held Dutch cancer bio issue Acerta Pharma; the Street’s price tag was USD 5 billion. Consumer products maker Newell Rubbermaid (NWL; off 1.3% for the month) said it would buy privately owned competitor Jarden for USD 15 billion.
Microcomputer parts maker Micron Technology (MU; off 11.1% for the month) said it would purchase Taiwanese chip maker Inotera Memories (Micron currently holds 33% of Inotera) for USD 3.2 billion in cash and debt. Credit card and payment transfer issue Global Payments (GPN; off 8.9% for the month) said it would buy rival Heartland Payment Systems (HPY; up 13.6% for the month) for USD 4.3 billion in cash and stock. Qatar National Bank said it would buy the National Bank of Greece’s Turkish banking unit for USD 2.9 billion.
In deal problems, railroad issue Norfolk Southern (NSC; down 11.0% for the month) formally rejected several offers from Canadian Pacific, calling them “grossly inadequate.” U.S. regulators sued on anti-trust grounds to stop the planned merger of office product superstore Staples (SPLS; off 21.5% for the month) and Office Depot (ODP; off 14.4% for the month). In other news, Standard & Poor’s Ratings Services downgraded the ratings for eight large U.S. banks, as it said, “we now consider the likelihood that the U.S.
government would provide extraordinary support to its banking system to be ‘uncertain’ and are removing the uplift based on government support from our ratings.” The issues were Bank of America (BAC), Bank of New York Mellon (BK), Citigroup (C), Goldman Sachs (GS), JPMorgan Chase (JPM), Morgan Stanley (MS), State Street (STT), and Wells Fargo (WFC). Argentina’s new president, Mauricio Macri (who assumed office Dec. 10, 2015), lifted the country’s currency control on the peso, permitting it to trade freely. In Venezuela’s mid-term elections, the opposition party won major positions, as socialist President Maduro was seen as weakened.
OPEC announced that its November production had set a three-year high (an average of 31.70 million barrels a day, as Saudi Arabia averaged 10.13 million—32% of production), and oil fell solidly under USD 40, becoming comfortable in the mid-to-high USD 30s—its lowest price since December 2008. OPEC also released its World Oil Outlook, with its estimates predicting that a basket of mixed types of oil would reach USD 70 in 2020 and USD 95 in 2040. OPEC also estimated that it would pump 30.7 million barrels of oil a day in 2020, which is less than its November 2015 production. 3 .
Market Attributes | U.S. Equities December 2015 On an issue level, U.K.-based mining issue Anglo American plc (NGLOY; off 127.7% for the month) said it would restructure its business, sell 60% of its assets, cut 85,000 workers (of 135,000), and suspend its dividend through 2016. Commodity issue Glencore International PLC (GLNCY; off 8.0% for the month) said it would cut debt, reduce operations, sell assets, and suspend its dividend. Natural gas transportation and storage issue Kinder Morgan (KMI; off 36.7% for the month) cut its dividend 75%, as mining issue Freeport-McMoRan Copper & Gold (FCX; off 17.2% for the month) suspended its dividend after the company had cut it by 84% in March.
However, natural gas issue ONEOK (OKE) issued guidance and saw its dividend as being flat for 2016, meaning no cut; the issue moved up on the news, but it still ended the month off 16.4%. Not making earnings (or expected forecasts) cost equipment and services for transportation issue Ciena (CIEN) 17.4% for the month, and it cost clothing retailer Men’s Wearhouse (MW) 26.6% for the month. Retail drug store Walgreens Boots Alliance (WBA; up 1.3% for the month) and pharmaceutical supplier Valeant Pharmaceuticals (VRX; up 13.0% for the month) announced a long-term agreement on distribution, as Valeant’s CEO took a medical leave.
Electronics issue Toshiba (TOSYY; off 16.0% for the month) said it expected to report a loss for its fiscal year, ending March 2016, and it announced it would cut 8,600 workers as part of restructuring. S&P Dow Jones Indices added personal care and product maker Church & Dwight (CHD) to the S&P 500 as it removed Altera (ALTR), while Comcast Cl ‘A’ Special (CMCSK) was deleted from the S&P 500 and was reclassified into Comcast Cl ‘A’ (CMCSA). S&P DJI announced that it would add insurance issue Willis Group Holdings (WSH) and remove Fossil Group (FOSL) from the S&P 500 after the close on Jan. 4, 2016. Interest rates were little changed for the month, as the U.S.
Fed increased interest rates 0.25% in December. The 10-year U.S. Treasury Bond closed at 2.27% (from last month’s 2.22%, year-end 2014’s 2.17%, and 2013’s 3.03%).
The 30-year U.S. Treasury Bond closed at 3.02% (2.98%, 2.92%, 2.75%). The U.S.
dollar declined against the euro (while the ECB action was seen as weak), as the euro closed at 1.0861 (1.0569, 1.1007, 1.2098), the pound closed at 1.4776 (1.5055, 1.5427, 1.5582), the yen closed at 120.66 (123.26, 120.62, 119.80 [reverse reference, which is usually used]), and the yuan closed at 6.4930 (6.3994 last month, and 6.2104 prior to the Aug. 10, 2015, devaluation). Gold decreased to close at USD 1,060.50 (1,064.30, 1,141.70, 1,183.20).
Oil moved from the low-USD 40 area to the mid-to-upper USD 30s and closed the month at USD 37.06 (41.72, 46.69, 53.27). U.S. pump prices decreased to end the month at USD 2.034 (2.094, 2.228, 2.299). VIX, “the fear factor,” increased, closing at 18.21, up from last month’s 16.13 and down from its 19.20 2014 close. INDEX REVIEW S&P 500 Historically, December is up 73.6% of the time, with the end of the year often referred to as the “Santa Clause rally.” Well, someone may have been naughty this year, because Santa never showed up, and the December decline of 1.75% pushed 2015 into the loss column, be it by just 0.73%.
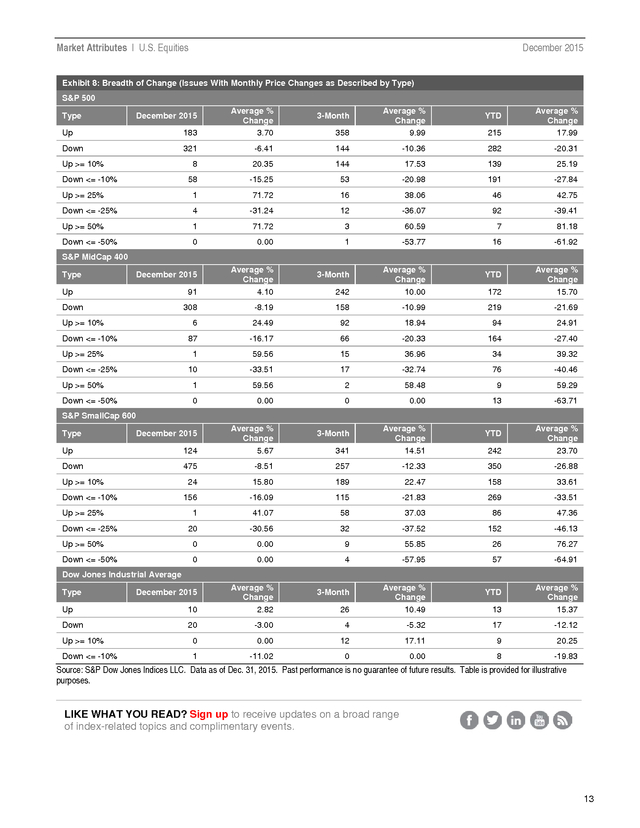
The mildly “flat” year, however, hid the underlying volatility in issues and sectors, as the index did what it typically does: melds the winners and losers. For 2015, the net change of -0.73% did not reflect the underlying swings. Three-hundred and thirty issues moved at least 10% (139 up at least 10% and 191 down at least 10%), as 137 issues, one in four, moved at least 25% (46 up at least 25% and 92 down at least 25%); despite that, the headlines said little movement.
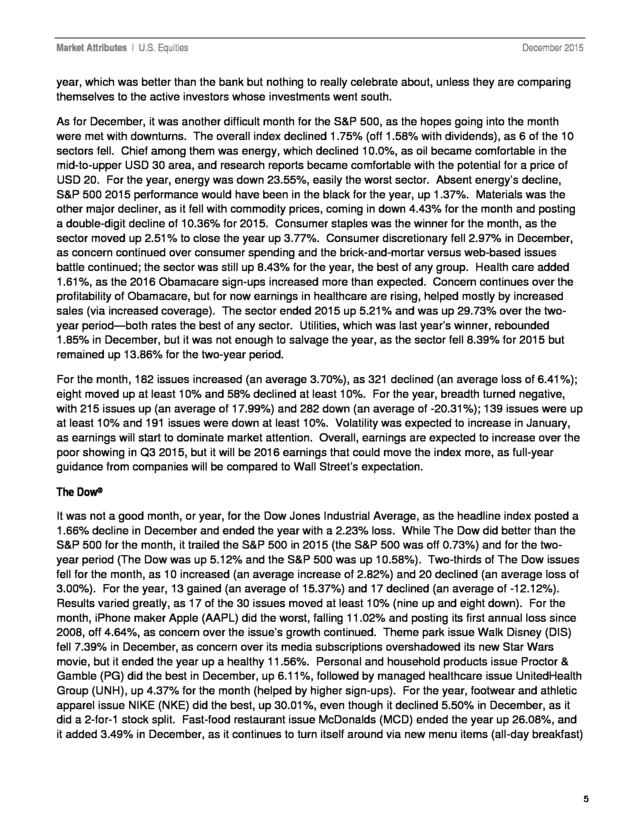
The underlying volatility made it a stock picker’s year, meaning if you were good it, you should still be celebrating; but if you were less than good, you may still be crying at the table. As for index-based investors, they received a 1.38% total return for the 4 . Market Attributes | U.S. Equities December 2015 year, which was better than the bank but nothing to really celebrate about, unless they are comparing themselves to the active investors whose investments went south. As for December, it was another difficult month for the S&P 500, as the hopes going into the month were met with downturns. The overall index declined 1.75% (off 1.58% with dividends), as 6 of the 10 sectors fell. Chief among them was energy, which declined 10.0%, as oil became comfortable in the mid-to-upper USD 30 area, and research reports became comfortable with the potential for a price of USD 20.
For the year, energy was down 23.55%, easily the worst sector. Absent energy’s decline, S&P 500 2015 performance would have been in the black for the year, up 1.37%. Materials was the other major decliner, as it fell with commodity prices, coming in down 4.43% for the month and posting a double-digit decline of 10.36% for 2015.
Consumer staples was the winner for the month, as the sector moved up 2.51% to close the year up 3.77%. Consumer discretionary fell 2.97% in December, as concern continued over consumer spending and the brick-and-mortar versus web-based issues battle continued; the sector was still up 8.43% for the year, the best of any group. Health care added 1.61%, as the 2016 Obamacare sign-ups increased more than expected.
Concern continues over the profitability of Obamacare, but for now earnings in healthcare are rising, helped mostly by increased sales (via increased coverage). The sector ended 2015 up 5.21% and was up 29.73% over the twoyear period—both rates the best of any sector. Utilities, which was last year’s winner, rebounded 1.85% in December, but it was not enough to salvage the year, as the sector fell 8.39% for 2015 but remained up 13.86% for the two-year period. For the month, 182 issues increased (an average 3.70%), as 321 declined (an average loss of 6.41%); eight moved up at least 10% and 58% declined at least 10%.
For the year, breadth turned negative, with 215 issues up (an average of 17.99%) and 282 down (an average of -20.31%); 139 issues were up at least 10% and 191 issues were down at least 10%. Volatility was expected to increase in January, as earnings will start to dominate market attention. Overall, earnings are expected to increase over the poor showing in Q3 2015, but it will be 2016 earnings that could move the index more, as full-year guidance from companies will be compared to Wall Street’s expectation. The Dow® It was not a good month, or year, for the Dow Jones Industrial Average, as the headline index posted a 1.66% decline in December and ended the year with a 2.23% loss.
While The Dow did better than the S&P 500 for the month, it trailed the S&P 500 in 2015 (the S&P 500 was off 0.73%) and for the twoyear period (The Dow was up 5.12% and the S&P 500 was up 10.58%). Two-thirds of The Dow issues fell for the month, as 10 increased (an average increase of 2.82%) and 20 declined (an average loss of 3.00%). For the year, 13 gained (an average of 15.37%) and 17 declined (an average of -12.12%). Results varied greatly, as 17 of the 30 issues moved at least 10% (nine up and eight down).
For the month, iPhone maker Apple (AAPL) did the worst, falling 11.02% and posting its first annual loss since 2008, off 4.64%, as concern over the issue’s growth continued. Theme park issue Walk Disney (DIS) fell 7.39% in December, as concern over its media subscriptions overshadowed its new Star Wars movie, but it ended the year up a healthy 11.56%. Personal and household products issue Proctor & Gamble (PG) did the best in December, up 6.11%, followed by managed healthcare issue UnitedHealth Group (UNH), up 4.37% for the month (helped by higher sign-ups).
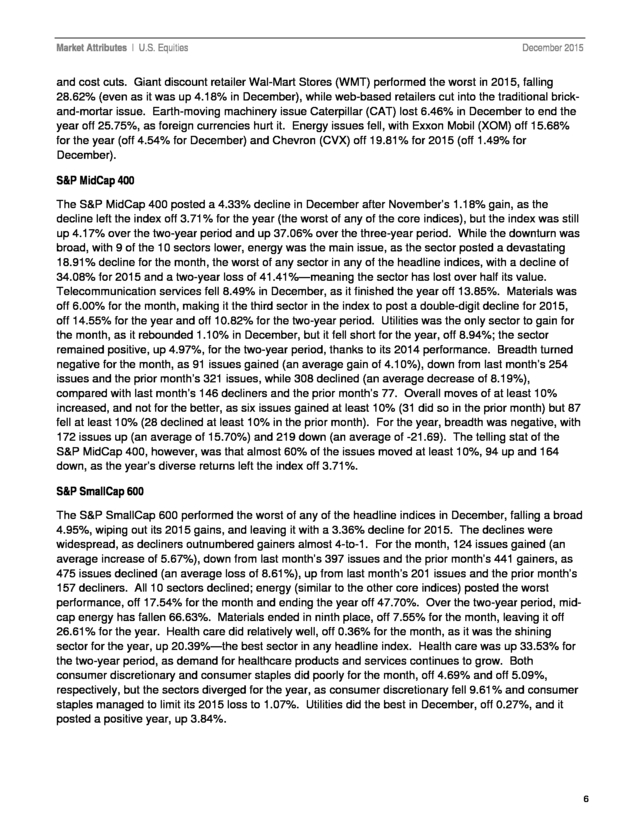
For the year, footwear and athletic apparel issue NIKE (NKE) did the best, up 30.01%, even though it declined 5.50% in December, as it did a 2-for-1 stock split. Fast-food restaurant issue McDonalds (MCD) ended the year up 26.08%, and it added 3.49% in December, as it continues to turn itself around via new menu items (all-day breakfast) 5 . Market Attributes | U.S. Equities December 2015 and cost cuts. Giant discount retailer Wal-Mart Stores (WMT) performed the worst in 2015, falling 28.62% (even as it was up 4.18% in December), while web-based retailers cut into the traditional brickand-mortar issue. Earth-moving machinery issue Caterpillar (CAT) lost 6.46% in December to end the year off 25.75%, as foreign currencies hurt it.
Energy issues fell, with Exxon Mobil (XOM) off 15.68% for the year (off 4.54% for December) and Chevron (CVX) off 19.81% for 2015 (off 1.49% for December). S&P MidCap 400 The S&P MidCap 400 posted a 4.33% decline in December after November’s 1.18% gain, as the decline left the index off 3.71% for the year (the worst of any of the core indices), but the index was still up 4.17% over the two-year period and up 37.06% over the three-year period. While the downturn was broad, with 9 of the 10 sectors lower, energy was the main issue, as the sector posted a devastating 18.91% decline for the month, the worst of any sector in any of the headline indices, with a decline of 34.08% for 2015 and a two-year loss of 41.41%—meaning the sector has lost over half its value. Telecommunication services fell 8.49% in December, as it finished the year off 13.85%. Materials was off 6.00% for the month, making it the third sector in the index to post a double-digit decline for 2015, off 14.55% for the year and off 10.82% for the two-year period.
Utilities was the only sector to gain for the month, as it rebounded 1.10% in December, but it fell short for the year, off 8.94%; the sector remained positive, up 4.97%, for the two-year period, thanks to its 2014 performance. Breadth turned negative for the month, as 91 issues gained (an average gain of 4.10%), down from last month’s 254 issues and the prior month’s 321 issues, while 308 declined (an average decrease of 8.19%), compared with last month’s 146 decliners and the prior month’s 77. Overall moves of at least 10% increased, and not for the better, as six issues gained at least 10% (31 did so in the prior month) but 87 fell at least 10% (28 declined at least 10% in the prior month).
For the year, breadth was negative, with 172 issues up (an average of 15.70%) and 219 down (an average of -21.69). The telling stat of the S&P MidCap 400, however, was that almost 60% of the issues moved at least 10%, 94 up and 164 down, as the year’s diverse returns left the index off 3.71%. S&P SmallCap 600 The S&P SmallCap 600 performed the worst of any of the headline indices in December, falling a broad 4.95%, wiping out its 2015 gains, and leaving it with a 3.36% decline for 2015. The declines were widespread, as decliners outnumbered gainers almost 4-to-1.
For the month, 124 issues gained (an average increase of 5.67%), down from last month’s 397 issues and the prior month’s 441 gainers, as 475 issues declined (an average loss of 8.61%), up from last month’s 201 issues and the prior month’s 157 decliners. All 10 sectors declined; energy (similar to the other core indices) posted the worst performance, off 17.54% for the month and ending the year off 47.70%. Over the two-year period, midcap energy has fallen 66.63%.
Materials ended in ninth place, off 7.55% for the month, leaving it off 26.61% for the year. Health care did relatively well, off 0.36% for the month, as it was the shining sector for the year, up 20.39%—the best sector in any headline index. Health care was up 33.53% for the two-year period, as demand for healthcare products and services continues to grow.
Both consumer discretionary and consumer staples did poorly for the month, off 4.69% and off 5.09%, respectively, but the sectors diverged for the year, as consumer discretionary fell 9.61% and consumer staples managed to limit its 2015 loss to 1.07%. Utilities did the best in December, off 0.27%, and it posted a positive year, up 3.84%. 6 . Market Attributes | U.S. Equities December 2015 S&P Global BMI Global markets closed out the year with a decline for the year and the month, as mixed markets resulted in a global 1.93% decline in December, with 22 of the 47 markets posting gains for the month. Markets varied less than usual, as slow trading and year-end holiday schedules affected trading. The variance, however, was quantifiable in sectors, as energy posted a broad 9.43% decline for the month, while oil and commodities continued their 18-month fall. The reason behind the oil fall was the same— high supply, with no producer willing to cut supplies, and weak demand, even as prices declined.
The combination has led to predictions of continued low prices, with the war for market share persisting. Emerging and developed markets showed similar performance in December. Emerging markets fell 1.94% for the month, as 10 of the 22 markets gained (and 12 fell). Egypt did the best, up 10.37% in December, but the rebound still left the group 27.50% in the red for the year.
South Africa did the worst for the month, off 10.46%, with its 2015 posting in the red by 26.62%. Developed markets declined 1.92% in December, as 12 of the 25 market gained (and 13 declined). New Zealand did the best, up 7.70% for the month, as it posted a 4.58% loss for 2015.
Canada did the worst in December, off 7.72%, ending the year off 26.17%. The U.S. posted a 2.19% decline for December, as its 2015 posting was in the red by 1.49%.
For the year, the impact of the U.S. was again positive, even though the country was in the red. Global markets were off 3.89% for the year, but excluding the U.S.
they were off 6.30%, as the two-year period shows global markets down 2.00% but down 11.58% without the U.S. The U.S. now accounts for 51.1% of the global equity market—it accounted for 47.8% two years ago.
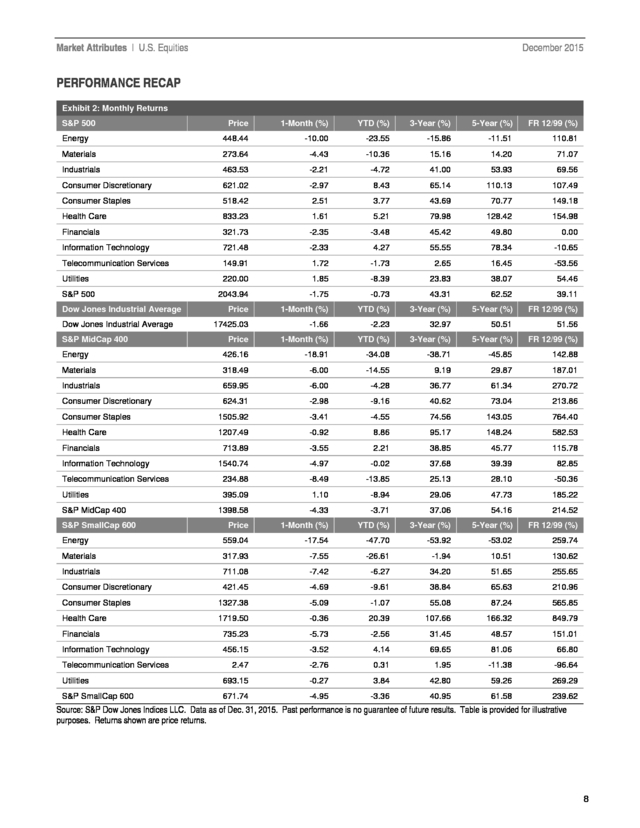
Only six of the global markets posted a gain for 2015, but three of them did so via doubledigit gains (Hungary with 28.79%, Ireland with 24.18%, and Denmark with 22.37%). Two-year returns were just as poor, as 10 markets posted gains, while the three-year period had 23 of the 47 post positive returns. 7 . Market Attributes | U.S. Equities December 2015 PERFORMANCE RECAP Exhibit 2: Monthly Returns S&P 500 Price 1-Month (%) YTD (%) 3-Year (%) 5-Year (%) FR 12/99 (%) Energy 448.44 -10.00 -23.55 -15.86 -11.51 110.81 Materials 273.64 -4.43 -10.36 15.16 14.20 71.07 Industrials 463.53 -2.21 -4.72 41.00 53.93 69.56 Consumer Discretionary 621.02 -2.97 8.43 65.14 110.13 107.49 Consumer Staples 518.42 2.51 3.77 43.69 70.77 149.18 Health Care 833.23 1.61 5.21 79.98 128.42 154.98 Financials 321.73 -2.35 -3.48 45.42 49.80 0.00 Information Technology 721.48 -2.33 4.27 55.55 78.34 -10.65 Telecommunication Services 149.91 1.72 -1.73 2.65 16.45 -53.56 Utilities 220.00 1.85 -8.39 23.83 38.07 54.46 S&P 500 Dow Jones Industrial Average Dow Jones Industrial Average S&P MidCap 400 Energy 2043.94 -1.75 -0.73 43.31 62.52 39.11 Price 1-Month (%) YTD (%) 3-Year (%) 5-Year (%) FR 12/99 (%) 17425.03 -1.66 -2.23 32.97 50.51 51.56 Price 1-Month (%) YTD (%) 3-Year (%) 5-Year (%) FR 12/99 (%) 426.16 -18.91 -34.08 -38.71 -45.85 142.88 Materials 318.49 -6.00 -14.55 9.19 29.87 187.01 Industrials 659.95 -6.00 -4.28 36.77 61.34 270.72 Consumer Discretionary 624.31 -2.98 -9.16 40.62 73.04 213.86 Consumer Staples 1505.92 -3.41 -4.55 74.56 143.05 764.40 Health Care 1207.49 -0.92 8.86 95.17 148.24 582.53 713.89 -3.55 2.21 38.85 45.77 115.78 1540.74 -4.97 -0.02 37.68 39.39 82.85 Telecommunication Services 234.88 -8.49 -13.85 25.13 28.10 -50.36 Utilities 395.09 1.10 -8.94 29.06 47.73 185.22 1398.58 -4.33 -3.71 37.06 54.16 214.52 Financials Information Technology S&P MidCap 400 S&P SmallCap 600 Price 1-Month (%) YTD (%) 3-Year (%) 5-Year (%) FR 12/99 (%) Energy 559.04 -17.54 -47.70 -53.92 -53.02 259.74 Materials 317.93 -7.55 -26.61 -1.94 10.51 130.62 Industrials 711.08 -7.42 -6.27 34.20 51.65 255.65 Consumer Discretionary 421.45 -4.69 -9.61 38.84 65.63 210.96 Consumer Staples 1327.38 -5.09 -1.07 55.08 87.24 565.85 Health Care 1719.50 -0.36 20.39 107.66 166.32 849.79 Financials 735.23 -5.73 -2.56 31.45 48.57 151.01 Information Technology 456.15 -3.52 4.14 69.65 81.06 66.80 2.47 -2.76 0.31 1.95 -11.38 -96.64 Utilities 693.15 -0.27 3.84 42.80 59.26 269.29 S&P SmallCap 600 671.74 -4.95 -3.36 40.95 61.58 239.62 Telecommunication Services Source: S&P Dow Jones Indices LLC. Data as of Dec. 31, 2015.
Past performance is no guarantee of future results. Table is provided for illustrative purposes. Returns shown are price returns. 8 .
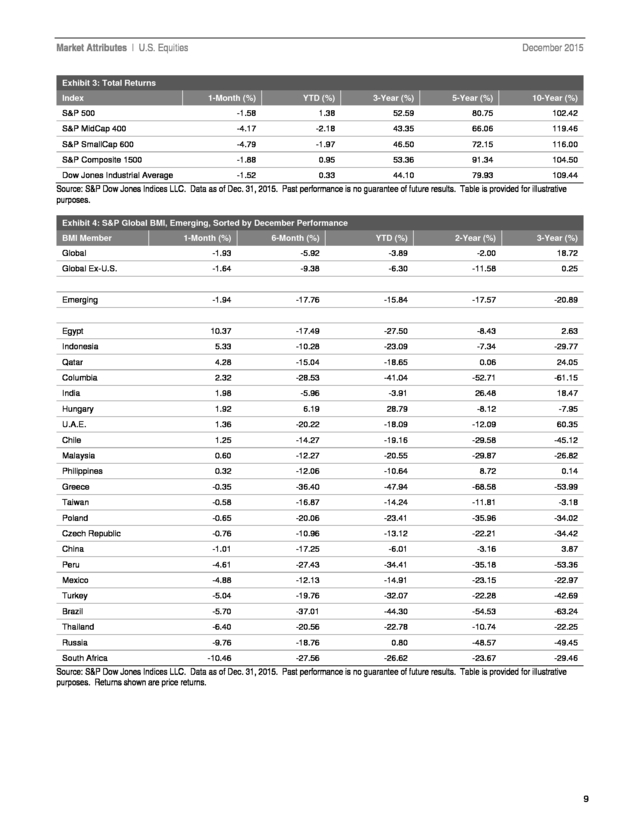
Market Attributes | U.S. Equities December 2015 Exhibit 3: Total Returns Index 1-Month (%) YTD (%) 3-Year (%) 5-Year (%) 10-Year (%) S&P 500 -1.58 1.38 52.59 80.75 102.42 S&P MidCap 400 -4.17 -2.18 43.35 66.06 119.46 S&P SmallCap 600 -4.79 -1.97 46.50 72.15 116.00 S&P Composite 1500 -1.88 0.95 53.36 91.34 104.50 Dow Jones Industrial Average -1.52 0.33 44.10 79.93 109.44 Source: S&P Dow Jones Indices LLC. Data as of Dec. 31, 2015.
Past performance is no guarantee of future results. Table is provided for illustrative purposes. Exhibit 4: S&P Global BMI, Emerging, Sorted by December Performance BMI Member 1-Month (%) 6-Month (%) YTD (%) 2-Year (%) 3-Year (%) Global -1.93 -5.92 Global Ex-U.S. -1.64 -9.38 -3.89 -2.00 18.72 -6.30 -11.58 0.25 Emerging -1.94 -17.76 -15.84 -17.57 -20.89 Egypt 10.37 -17.49 -27.50 -8.43 2.63 5.33 -10.28 -23.09 -7.34 -29.77 Qatar 4.28 -15.04 -18.65 0.06 24.05 Columbia 2.32 -28.53 -41.04 -52.71 -61.15 India 1.98 -5.96 -3.91 26.48 18.47 Hungary 1.92 6.19 28.79 -8.12 -7.95 U.A.E. 1.36 -20.22 -18.09 -12.09 60.35 Chile 1.25 -14.27 -19.16 -29.58 -45.12 Malaysia 0.60 -12.27 -20.55 -29.87 -26.82 Philippines 0.32 -12.06 -10.64 8.72 0.14 Greece -0.35 -36.40 -47.94 -68.58 -53.99 Taiwan -0.58 -16.87 -14.24 -11.81 -3.18 Poland -0.65 -20.06 -23.41 -35.96 -34.02 Czech Republic -0.76 -10.96 -13.12 -22.21 -34.42 China -1.01 -17.25 -6.01 -3.16 3.87 Peru -4.61 -27.43 -34.41 -35.18 -53.36 Mexico -4.88 -12.13 -14.91 -23.15 -22.97 Turkey -5.04 -19.76 -32.07 -22.28 -42.69 Brazil -5.70 -37.01 -44.30 -54.53 -63.24 Thailand -6.40 -20.56 -22.78 -10.74 -22.25 Russia -9.76 -18.76 0.80 -48.57 -49.45 -10.46 -27.56 -26.62 -23.67 -29.46 Indonesia South Africa Source: S&P Dow Jones Indices LLC. Data as of Dec.
31, 2015. Past performance is no guarantee of future results. Table is provided for illustrative purposes.
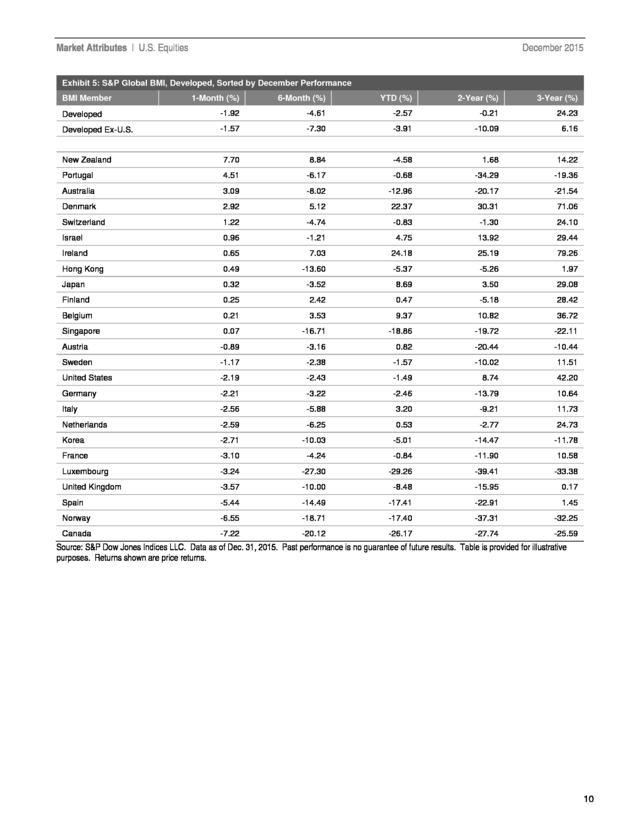
Returns shown are price returns. 9 . Market Attributes | U.S. Equities December 2015 Exhibit 5: S&P Global BMI, Developed, Sorted by December Performance BMI Member 1-Month (%) 6-Month (%) YTD (%) 2-Year (%) 3-Year (%) Developed -1.92 -4.61 -2.57 -0.21 24.23 Developed Ex-U.S. -1.57 -7.30 -3.91 -10.09 6.16 New Zealand 7.70 8.84 -4.58 1.68 14.22 Portugal 4.51 -6.17 -0.68 -34.29 -19.36 Australia 3.09 -8.02 -12.96 -20.17 -21.54 Denmark 2.92 5.12 22.37 30.31 71.06 Switzerland 1.22 -4.74 -0.83 -1.30 24.10 Israel 0.96 -1.21 4.75 13.92 29.44 Ireland 0.65 7.03 24.18 25.19 79.26 Hong Kong 0.49 -13.60 -5.37 -5.26 1.97 Japan 0.32 -3.52 8.69 3.50 29.08 Finland 0.25 2.42 0.47 -5.18 28.42 Belgium 0.21 3.53 9.37 10.82 36.72 Singapore 0.07 -16.71 -18.86 -19.72 -22.11 Austria -0.89 -3.16 0.82 -20.44 -10.44 Sweden -1.17 -2.38 -1.57 -10.02 11.51 United States -2.19 -2.43 -1.49 8.74 42.20 Germany -2.21 -3.22 -2.46 -13.79 10.64 Italy -2.56 -5.88 3.20 -9.21 11.73 Netherlands -2.59 -6.25 0.53 -2.77 24.73 Korea -2.71 -10.03 -5.01 -14.47 -11.78 France -3.10 -4.24 -0.84 -11.90 10.58 Luxembourg -3.24 -27.30 -29.26 -39.41 -33.38 United Kingdom -3.57 -10.00 -8.48 -15.95 0.17 Spain -5.44 -14.49 -17.41 -22.91 1.45 Norway -6.55 -18.71 -17.40 -37.31 -32.25 Canada -7.22 -20.12 -26.17 -27.74 -25.59 Source: S&P Dow Jones Indices LLC. Data as of Dec. 31, 2015.
Past performance is no guarantee of future results. Table is provided for illustrative purposes. Returns shown are price returns. 10 .
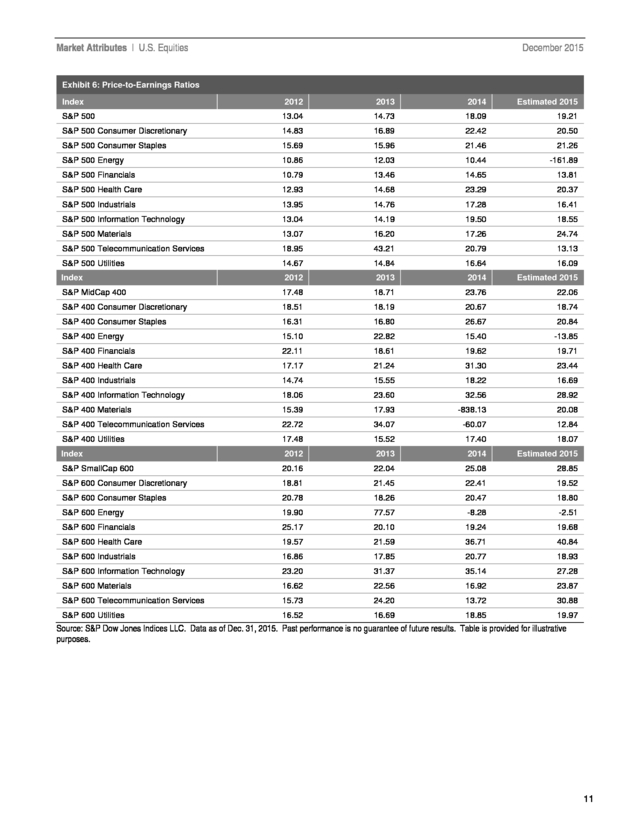
Market Attributes | U.S. Equities December 2015 Exhibit 6: Price-to-Earnings Ratios Index 2012 2013 2014 Estimated 2015 S&P 500 13.04 14.73 18.09 19.21 S&P 500 Consumer Discretionary 14.83 16.89 22.42 20.50 S&P 500 Consumer Staples 15.69 15.96 21.46 21.26 S&P 500 Energy 10.86 12.03 10.44 -161.89 S&P 500 Financials 10.79 13.46 14.65 13.81 S&P 500 Health Care 12.93 14.68 23.29 20.37 S&P 500 Industrials 13.95 14.76 17.28 16.41 S&P 500 Information Technology 13.04 14.19 19.50 18.55 S&P 500 Materials 13.07 16.20 17.26 24.74 S&P 500 Telecommunication Services 18.95 43.21 20.79 13.13 S&P 500 Utilities 14.67 14.84 16.64 16.09 Index 2012 2013 2014 Estimated 2015 S&P MidCap 400 17.48 18.71 23.76 22.06 S&P 400 Consumer Discretionary 18.51 18.19 20.67 18.74 S&P 400 Consumer Staples 16.31 16.80 26.67 20.84 S&P 400 Energy 15.10 22.82 15.40 -13.85 S&P 400 Financials 22.11 18.61 19.62 19.71 S&P 400 Health Care 17.17 21.24 31.30 23.44 S&P 400 Industrials 14.74 15.55 18.22 16.69 S&P 400 Information Technology 18.06 23.60 32.56 28.92 S&P 400 Materials 15.39 17.93 -838.13 20.08 S&P 400 Telecommunication Services 22.72 34.07 -60.07 12.84 S&P 400 Utilities 17.48 15.52 17.40 18.07 Index 2012 2013 2014 Estimated 2015 S&P SmallCap 600 20.16 22.04 25.08 28.85 S&P 600 Consumer Discretionary 18.81 21.45 22.41 19.52 S&P 600 Consumer Staples 20.78 18.26 20.47 18.80 S&P 600 Energy 19.90 77.57 -8.28 -2.51 S&P 600 Financials 25.17 20.10 19.24 19.68 S&P 600 Health Care 19.57 21.59 36.71 40.84 S&P 600 Industrials 16.86 17.85 20.77 18.93 S&P 600 Information Technology 23.20 31.37 35.14 27.28 S&P 600 Materials 16.62 22.56 16.92 23.87 S&P 600 Telecommunication Services 15.73 24.20 13.72 30.88 S&P 600 Utilities 16.52 16.69 18.85 19.97 Source: S&P Dow Jones Indices LLC. Data as of Dec. 31, 2015.
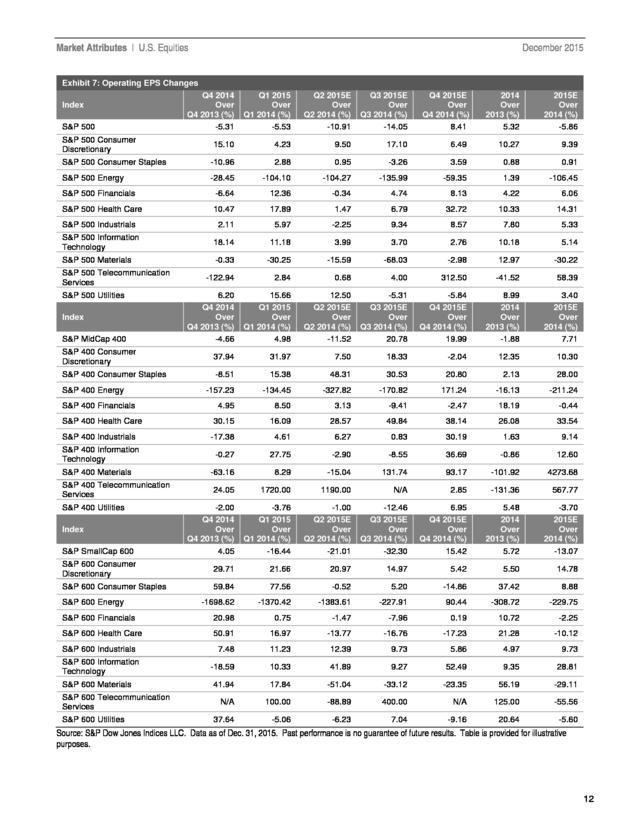
Past performance is no guarantee of future results. Table is provided for illustrative purposes. 11 . Market Attributes | U.S. Equities December 2015 Exhibit 7: Operating EPS Changes Q4 2014 Over Q4 2013 (%) -5.31 Q1 2015 Over Q1 2014 (%) -5.53 Q2 2015E Over Q2 2014 (%) -10.91 Q3 2015E Over Q3 2014 (%) -14.05 15.10 4.23 9.50 17.10 S&P 500 Consumer Staples -10.96 2.88 0.95 S&P 500 Energy Index S&P 500 S&P 500 Consumer Discretionary Q4 2015E Over Q4 2014 (%) 8.41 2014 Over 2013 (%) 5.32 2015E Over 2014 (%) -5.86 6.49 10.27 9.39 -3.26 3.59 0.88 0.91 -28.45 -104.10 -104.27 -135.99 -59.35 1.39 -106.45 S&P 500 Financials -6.64 12.36 -0.34 4.74 8.13 4.22 6.06 S&P 500 Health Care 10.47 17.89 1.47 6.79 32.72 10.33 14.31 S&P 500 Industrials 2.11 5.97 -2.25 9.34 8.57 7.80 5.33 S&P 500 Information Technology 18.14 11.18 3.99 3.70 2.76 10.18 5.14 S&P 500 Materials -0.33 -30.25 -15.59 -68.03 -2.98 12.97 -30.22 -122.94 2.84 0.68 4.00 312.50 -41.52 58.39 6.20 Q4 2014 Over Q4 2013 (%) -4.66 15.66 Q1 2015 Over Q1 2014 (%) 4.98 12.50 Q2 2015E Over Q2 2014 (%) -11.52 -5.31 Q3 2015E Over Q3 2014 (%) 20.78 -5.84 Q4 2015E Over Q4 2014 (%) 19.99 8.99 2014 Over 2013 (%) -1.88 3.40 2015E Over 2014 (%) 7.71 37.94 31.97 7.50 18.33 -2.04 12.35 10.30 S&P 500 Telecommunication Services S&P 500 Utilities Index S&P MidCap 400 S&P 400 Consumer Discretionary S&P 400 Consumer Staples -8.51 15.38 48.31 30.53 20.80 2.13 28.00 -157.23 -134.45 -327.82 -170.82 171.24 -16.13 -211.24 4.95 8.50 3.13 -9.41 -2.47 18.19 -0.44 30.15 16.09 28.57 49.84 38.14 26.08 33.54 S&P 400 Industrials -17.38 4.61 6.27 0.83 30.19 1.63 9.14 S&P 400 Information Technology -0.27 27.75 -2.90 -8.55 36.69 -0.86 12.60 -63.16 8.29 -15.04 131.74 93.17 -101.92 4273.68 24.05 1720.00 1190.00 N/A 2.85 -131.36 567.77 -2.00 Q4 2014 Over Q4 2013 (%) 4.05 -3.76 Q1 2015 Over Q1 2014 (%) -16.44 -1.00 Q2 2015E Over Q2 2014 (%) -21.01 -12.46 Q3 2015E Over Q3 2014 (%) -32.30 6.95 Q4 2015E Over Q4 2014 (%) 15.42 5.48 2014 Over 2013 (%) 5.72 -3.70 2015E Over 2014 (%) -13.07 S&P 600 Consumer Discretionary 29.71 21.66 20.97 14.97 5.42 5.50 14.78 S&P 600 Consumer Staples 59.84 77.56 -0.52 5.20 -14.86 37.42 8.88 -1698.62 -1370.42 -1383.61 -227.91 90.44 -308.72 -229.75 S&P 600 Financials 20.98 0.75 -1.47 -7.96 0.19 10.72 -2.25 S&P 600 Health Care 50.91 16.97 -13.77 -16.76 -17.23 21.28 -10.12 7.48 11.23 12.39 9.73 5.86 4.97 9.73 -18.59 10.33 41.89 9.27 52.49 9.35 28.81 41.94 17.84 -51.04 -33.12 -23.35 56.19 -29.11 N/A 100.00 -88.89 400.00 N/A 125.00 -55.56 37.64 -5.06 -6.23 7.04 -9.16 20.64 -5.60 S&P 400 Energy S&P 400 Financials S&P 400 Health Care S&P 400 Materials S&P 400 Telecommunication Services S&P 400 Utilities Index S&P SmallCap 600 S&P 600 Energy S&P 600 Industrials S&P 600 Information Technology S&P 600 Materials S&P 600 Telecommunication Services S&P 600 Utilities Source: S&P Dow Jones Indices LLC. Data as of Dec. 31, 2015.
Past performance is no guarantee of future results. Table is provided for illustrative purposes. 12 . Market Attributes | U.S. Equities December 2015 Exhibit 8: Breadth of Change (Issues With Monthly Price Changes as Described by Type) S&P 500 358 Average % Change 9.99 -6.41 144 20.35 144 -15.25 1 Down <= -25% Up >= 50% Down <= -50% Type 215 Average % Change 17.99 -10.36 282 -20.31 17.53 139 25.19 53 -20.98 191 -27.84 71.72 16 38.06 46 42.75 4 -31.24 12 -36.07 92 -39.41 1 71.72 3 60.59 7 81.18 0 0.00 1 -53.77 16 -61.92 December 2015 Up 183 Down 321 8 58 Up >= 25% Up >= 10% Down <= -10% Average % Change 3.70 3-Month YTD S&P MidCap 400 Type December 2015 Up 91 Down Average % Change 4.10 242 Average % Change 10.00 3-Month 172 Average % Change 15.70 YTD 308 Down <= -25% -10.99 219 -21.69 92 18.94 94 24.91 -16.17 66 -20.33 164 -27.40 1 Up >= 25% 158 24.49 87 Down <= -10% -8.19 6 Up >= 10% 59.56 15 36.96 34 39.32 10 -33.51 17 -32.74 76 -40.46 Up >= 50% 1 59.56 2 58.48 9 59.29 Down <= -50% 0 0.00 0 0.00 13 -63.71 S&P SmallCap 600 Type 341 Average % Change 14.51 -8.51 257 15.80 189 -16.09 1 December 2015 Up 124 Down 475 24 156 Up >= 10% Down <= -10% Up >= 25% Down <= -25% Average % Change 5.67 242 Average % Change 23.70 -12.33 350 -26.88 22.47 158 33.61 115 -21.83 269 -33.51 41.07 58 37.03 86 47.36 3-Month YTD 20 -30.56 32 -37.52 152 -46.13 Up >= 50% 0 0.00 9 55.85 26 76.27 Down <= -50% 0 0.00 4 -57.95 57 -64.91 Dow Jones Industrial Average Up 10 Average % Change 2.82 Down Type December 2015 3-Month 26 Average % Change 10.49 13 Average % Change 15.37 YTD 20 -3.00 4 -5.32 17 -12.12 Up >= 10% 0 0.00 12 17.11 9 20.25 Down <= -10% 1 -11.02 0 0.00 8 -19.83 Source: S&P Dow Jones Indices LLC. Data as of Dec. 31, 2015.
Past performance is no guarantee of future results. Table is provided for illustrative purposes. LIKE WHAT YOU READ? Sign up to receive updates on a broad range of index-related topics and complimentary events. 13 . Market Attributes | U.S. Equities December 2015 GENERAL DISCLAIMER © 2016 by S&P Dow Jones Indices LLC, a part of McGraw Hill Financial, Inc. All rights reserved. Standard & Poor’s® and S&P® are registered trademarks of Standard & Poor’s Financial Services LLC (“S&P”), a subsidiary of McGraw Hill Financial. ® Dow Jones is a registered trademark of Dow Jones Trademark Holdings LLC (“Dow Jones”).
Trademarks have been licensed to S&P Dow Jones Indices LLC. Redistribution, reproduction and/or photocopying in whole or in part are prohibited without written permission. This document does not constitute an offer of services in jurisdictions where S&P Dow Jones Indices LLC, Dow Jones, S&P or their respective affiliates (collectively “S&P Dow Jones Indices”) do not have the necessary licenses.
All information provided by S&P Dow Jones Indices is impersonal and not tailored to the needs of any person, entity or group of persons. S&P Dow Jones Indices receives compensation in connection with licensing its indices to third parties. Past performance of an index is not a guarantee of future results It is not possible to invest directly in an index.
Exposure to an asset class represented by an index is available through investable instruments based on that index. S&P Dow Jones Indices does not sponsor, endorse, sell, promote or manage any investment fund or other investment vehicle that is offered by third parties and that seeks to provide an investment return based on the performance of any index. S&P Dow Jones Indices makes no assurance that investment products based on the index will accurately track index performance or provide positive investment returns.
S&P Dow Jones Indices LLC is not an investment advisor, and S&P Dow Jones Indices makes no representation regarding the advisability of investing in any such investment fund or other investment vehicle. A decision to invest in any such investment fund or other investment vehicle should not be made in reliance on any of the statements set forth in this document. Prospective investors are advised to make an investment in any such fund or other vehicle only after carefully considering the risks associated with investing in such funds, as detailed in an offering memorandum or similar document that is prepared by or on behalf of the issuer of the investment fund or other vehicle.
Inclusion of a security within an index is not a recommendation by S&P Dow Jones Indices to buy, sell, or hold such security, nor is it considered to be investment advice. Closing prices for S&P US benchmark indices and Dow Jones US benchmark indices are calculated by S&P Dow Jones Indices based on the closing price of the individual constituents of the index as set by their primary exchange. Closing prices are received by S&P Dow Jones Indices from one of its third party vendors and verified by comparing them with prices from an alternative vendor.
The vendors receive the closing price from the primary exchanges. Real-time intraday prices are calculated similarly without a second verification.] These materials have been prepared solely for informational purposes based upon information generally available to the public and from sources believed to be reliable. No content contained in these materials (including index data, ratings, credit-related analyses and data, research, valuations, model, software or other application or output therefrom) or any part thereof (Content) may be modified, reverse-engineered, reproduced or distributed in any form or by any means, or stored in a database or retrieval system, without the prior written permission of S&P Dow Jones Indices.
The Content shall not be used for any unlawful or unauthorized purposes. S&P Dow Jones Indices and its third-party data providers and licensors (collectively “S&P Dow Jones Indices Parties”) do not guarantee the accuracy, completeness, timeliness or availability of the Content. S&P Dow Jones Indices Parties are not responsible for any errors or omissions, regardless of the cause, for the results obtained from the use of the Content. The Content is provided on an “as is” basis.
S&P DOW JONES INDICES PARTIES DISCLAIM ANY AND ALL EXPRESS OR IMPLIED WARRANTIES, INCLUDING, BUT NOT LIMITED TO, ANY WARRANTIES OF MERCHANTABILITY OR FITNESS FOR A PARTICULAR PURPOSE OR USE, FREEDOM FROM BUGS, SOFTWARE ERRORS OR DEFECTS, THAT THE CONTENT’S FUNCTIONING WILL BE UNINTERRUPTED OR THAT THE CONTENT WILL OPERATE WITH ANY SOFTWARE OR HARDWARE CONFIGURATION. In no event shall S&P Dow Jones Indices Parties be liable to any party for any direct, indirect, incidental, exemplary, compensatory, punitive, special or consequential damages, costs, expenses, legal fees, or losses (including, without limitation, lost income or lost profits and opportunity costs) in connection with any use of the Content even if advised of the possibility of such damages. S&P Dow Jones Indices keeps certain activities of its business units separate from each other in order to preserve the independence and objectivity of their respective activities. As a result, certain business units of S&P Dow Jones Indices may have information that is not available to other business units.
S&P Dow Jones Indices has established policies and procedures to maintain the confidentiality of certain non-public information received in connection with each analytical process. In addition, S&P Dow Jones Indices provides a wide range of services to, or relating to, many organizations, including issuers of securities, investment advisers, broker-dealers, investment banks, other financial institutions and financial intermediaries, and accordingly may receive fees or other economic benefits from those organizations, including organizations whose securities or services they may recommend, rate, include in model portfolios, evaluate or otherwise address. 14 .
Past performance is no guarantee of future results. Table is provided for illustrative purposes. Returns shown are price returns. MARKET SNAPSHOT 2015 is in the history books, and as the bubbly goes down, a (somewhat) sobering reflection emerges. For 2015, the S&P 500 was down 0.73%, as the last trading day of the year posted a 0.94% decline, putting the year into the red.
The annual decline, however, was after three years of double-digit gains and a bull market that is 82 months old (the average is 59), with the index closing 4.08% off its all-time closing high, set on May 21, 2015, at 2,130.82. So, if 2015 was the payback, fine; however, if the economy slows even more, and if either Europe or China slide, year-end 2015 could mark the start of a decline. By year-end 2015, oil got comfortable with the mid-to-upper USD 30s, as several research reports got comfortable with USD 20 projections (oil was at USD 53 at the beginning of the year and USD 105 in June 2014).
In 2015, two-thirds of the issues moved at least 10%, and over one-quarter moved at least 25%—it will be interesting to see who did what (look for old-fashioned advertisements in newspapers declaring the victories). Contributor: Howard Silverblatt, Index Investment Strategy, Senior Industry Analyst, howard.silverblatt@spdji.com S&P Dow Jones Indices’ Market Attributes® series provides market commentary highlighting developments across various asset classes. . Market Attributes | U.S. Equities December 2015 M&A deals continued, and 2015 was already a record year by November; while a slowdown is expected, it would be from a record level. As for 2016, there appear to be many issues to watch and think about (we’ll see about trading). The Fed’s interest rate increase schedule should be topic one, but the decision will be based on the data—so keeping your eye on the data (and the trades) may be key.
New borrowing for future needs (beyond 2016, as interest rates remain low but are expected to increase) should start to show itself about halfway through the year, once we see what the Fed is doing. A reduction in M&A from the record-setting 2015 is expected, but it should remain at a high level; inversion rules may be more public talk than enforceable rules. Another thing to watch for would be the IMF’s addition of the Chinese yuan to the currency basket, set for Oct.
1, 2016. In economic news, there was a rare case of “expect and you shall get,” as the U.S. Fed increased interest rates by 0.25%, which had been expected by almost everyone, and markets moved up on the expected, and actual, event. The increase then replaced one unknown question (“When will they start?”) with another question (“When is the next one?”), with concerns over oil, corporate earnings, and spending continuing in the background.
As for the Fed statement and guidance, it was as close to scripted as could have been hoped (or traded) for. The Fed saw the economy as stronger and expected it to improve in 2016, with the unemployment rate expected to continue to decrease, and a few economists commenting that low unemployment could cause a spike in inflation. The Fed guided toward four increases of 0.25% each in 2016—or at least that was the Street’s interpretation.
The economic takeaway was for a slow, steady, and data-dependent series of interest rate increases, which removed some uncertainty—a scenario the Street could live with. In other economic news, the IMF, as expected, announced the addition of the Chinese yuan to its currencies of lending reserve, effective Oct. 1, 2016, while China said it would double the trading hours for the yuan in preparation.
In China, the official November Manufacturing PMI fell to 49.6 from 49.8, while the Services PMI increased to 53.6 from 53.1, and Chinese exports declined (6% year-over-year in November), as did imports (down 8.7% year-over-year in November). Industrial production came in higher than expected, coming in up 6.2% year-over-year in November, when a lower rate of 5.7% was expected. Japan revised its GDP to a rate of up 1.0% from the initially released 0.8% decline, meaning it was not in a recession.
The 19 EU nations grew 0.3% for the third quarter, which was down from the second quarter’s 0.4% gain, as the U.K. came in with an annual rate of 2.1%. The ECB reduced the bank deposit rate to -0.30% from the previous -0.20%, as it extended its asset buying by six months (to March 2017), but it failed to increase the USD 63 billion level of monthly buying—which was expected (helped by ECB President Draghi’s “whatever it takes” attitude).
Since the market is all about expectations, markets retreated on the news, with the euro moving up. The Bank of Japan slightly increased its quantitative easing program by buying longer-term bonds (from 7-year to 10-year maturities to 7-year to 12-year maturities). The People’s Bank of China estimated that China would grow 6.8% in 2016, slightly down from the prior expectation of 6.9%.
In the U.S., the third and final report on third-quarter GDP came in as expected, at 2.0%. The ISM Non-Manufacturing Index for November disappointed (coming in at 55.9, when a level of 59.1 was expected), as did the ISM manufacturing report (coming in at 48.6, when 50.5 was expected). Construction Spending for October came in stronger than expected, up 1.0% for the month, when a 0.6% gain was expected, as the year-over-year increase was 13.0%.
The U.S. November employment report posted 211,000 net new jobs, when 190,000 new jobs were expected for the month, and construction jobs were up (46,000), with most of that gain in residential construction (26,000). The unemployment rate was flat (at 5.0%; 7.9 million workers), as the average hours worked slightly declined to 34.5 from an upwardly restated 34.6 last month, which was originally reported at 34.5, with the average hourly wage increasing 0.2% (to USD 25.25). November exports declined more 2 .
Market Attributes | U.S. Equities December 2015 than expected, while imports came in better, with the takeaway being that exports were off 6.3% yearover-year and imports were off 9.4% year-over-year. The November CPI ex-food and energy rate was at 2.0% year-over-year. U.S.
housing news was mixed, but optimism continued. The NAHB Housing Market Index came in down, while Housing Starts, the FHFA Home Price Index, and the S&P/CaseShiller Home Price Index all came in better than expected, but the New Home Sales report missed its expectation. However, the headline grabber was the Existing Home Sales report, which came in with a 10.5% decline and a year-over-year change of -3.8%. In global M&A, 2015 was reportedly at USD 4.30 trillion through November, surpassing the record of USD 4.29 trillion in 2007, with the U.S.
component reported to be in excess of USD 2 trillion. General Electric (GE; up 4.0% for the month) said it had abandoned its plans to sell its portion of its household appliance business to Electrolux (ELUXY; off 17.6% for the month) for a planned USD 3.3 billion. JAB Holdings (which holds other coffee producers) said it would buy Keurig Green Mountain (GMCR) for USD 13.9 billion, a 78% premium.
The amazing premium, however, is relative, as Keurig Green Mountain closed the month up 71.2% but off 32.0% for the year. Chemical issues Dow Chemical (DOW; off 1.2% for the month) and E.I. Du Pont De Nemours (DD; off 1.1% for the month) said it would merge via a share swap deal, resulting in almost equal ownership.
U.K. biopharmaceutical issue AstraZeneca (AZN; off 0.3% for the month) said it was in talks to acquire privately held Dutch cancer bio issue Acerta Pharma; the Street’s price tag was USD 5 billion. Consumer products maker Newell Rubbermaid (NWL; off 1.3% for the month) said it would buy privately owned competitor Jarden for USD 15 billion.
Microcomputer parts maker Micron Technology (MU; off 11.1% for the month) said it would purchase Taiwanese chip maker Inotera Memories (Micron currently holds 33% of Inotera) for USD 3.2 billion in cash and debt. Credit card and payment transfer issue Global Payments (GPN; off 8.9% for the month) said it would buy rival Heartland Payment Systems (HPY; up 13.6% for the month) for USD 4.3 billion in cash and stock. Qatar National Bank said it would buy the National Bank of Greece’s Turkish banking unit for USD 2.9 billion.
In deal problems, railroad issue Norfolk Southern (NSC; down 11.0% for the month) formally rejected several offers from Canadian Pacific, calling them “grossly inadequate.” U.S. regulators sued on anti-trust grounds to stop the planned merger of office product superstore Staples (SPLS; off 21.5% for the month) and Office Depot (ODP; off 14.4% for the month). In other news, Standard & Poor’s Ratings Services downgraded the ratings for eight large U.S. banks, as it said, “we now consider the likelihood that the U.S.
government would provide extraordinary support to its banking system to be ‘uncertain’ and are removing the uplift based on government support from our ratings.” The issues were Bank of America (BAC), Bank of New York Mellon (BK), Citigroup (C), Goldman Sachs (GS), JPMorgan Chase (JPM), Morgan Stanley (MS), State Street (STT), and Wells Fargo (WFC). Argentina’s new president, Mauricio Macri (who assumed office Dec. 10, 2015), lifted the country’s currency control on the peso, permitting it to trade freely. In Venezuela’s mid-term elections, the opposition party won major positions, as socialist President Maduro was seen as weakened.
OPEC announced that its November production had set a three-year high (an average of 31.70 million barrels a day, as Saudi Arabia averaged 10.13 million—32% of production), and oil fell solidly under USD 40, becoming comfortable in the mid-to-high USD 30s—its lowest price since December 2008. OPEC also released its World Oil Outlook, with its estimates predicting that a basket of mixed types of oil would reach USD 70 in 2020 and USD 95 in 2040. OPEC also estimated that it would pump 30.7 million barrels of oil a day in 2020, which is less than its November 2015 production. 3 .
Market Attributes | U.S. Equities December 2015 On an issue level, U.K.-based mining issue Anglo American plc (NGLOY; off 127.7% for the month) said it would restructure its business, sell 60% of its assets, cut 85,000 workers (of 135,000), and suspend its dividend through 2016. Commodity issue Glencore International PLC (GLNCY; off 8.0% for the month) said it would cut debt, reduce operations, sell assets, and suspend its dividend. Natural gas transportation and storage issue Kinder Morgan (KMI; off 36.7% for the month) cut its dividend 75%, as mining issue Freeport-McMoRan Copper & Gold (FCX; off 17.2% for the month) suspended its dividend after the company had cut it by 84% in March.
However, natural gas issue ONEOK (OKE) issued guidance and saw its dividend as being flat for 2016, meaning no cut; the issue moved up on the news, but it still ended the month off 16.4%. Not making earnings (or expected forecasts) cost equipment and services for transportation issue Ciena (CIEN) 17.4% for the month, and it cost clothing retailer Men’s Wearhouse (MW) 26.6% for the month. Retail drug store Walgreens Boots Alliance (WBA; up 1.3% for the month) and pharmaceutical supplier Valeant Pharmaceuticals (VRX; up 13.0% for the month) announced a long-term agreement on distribution, as Valeant’s CEO took a medical leave.
Electronics issue Toshiba (TOSYY; off 16.0% for the month) said it expected to report a loss for its fiscal year, ending March 2016, and it announced it would cut 8,600 workers as part of restructuring. S&P Dow Jones Indices added personal care and product maker Church & Dwight (CHD) to the S&P 500 as it removed Altera (ALTR), while Comcast Cl ‘A’ Special (CMCSK) was deleted from the S&P 500 and was reclassified into Comcast Cl ‘A’ (CMCSA). S&P DJI announced that it would add insurance issue Willis Group Holdings (WSH) and remove Fossil Group (FOSL) from the S&P 500 after the close on Jan. 4, 2016. Interest rates were little changed for the month, as the U.S.
Fed increased interest rates 0.25% in December. The 10-year U.S. Treasury Bond closed at 2.27% (from last month’s 2.22%, year-end 2014’s 2.17%, and 2013’s 3.03%).
The 30-year U.S. Treasury Bond closed at 3.02% (2.98%, 2.92%, 2.75%). The U.S.
dollar declined against the euro (while the ECB action was seen as weak), as the euro closed at 1.0861 (1.0569, 1.1007, 1.2098), the pound closed at 1.4776 (1.5055, 1.5427, 1.5582), the yen closed at 120.66 (123.26, 120.62, 119.80 [reverse reference, which is usually used]), and the yuan closed at 6.4930 (6.3994 last month, and 6.2104 prior to the Aug. 10, 2015, devaluation). Gold decreased to close at USD 1,060.50 (1,064.30, 1,141.70, 1,183.20).
Oil moved from the low-USD 40 area to the mid-to-upper USD 30s and closed the month at USD 37.06 (41.72, 46.69, 53.27). U.S. pump prices decreased to end the month at USD 2.034 (2.094, 2.228, 2.299). VIX, “the fear factor,” increased, closing at 18.21, up from last month’s 16.13 and down from its 19.20 2014 close. INDEX REVIEW S&P 500 Historically, December is up 73.6% of the time, with the end of the year often referred to as the “Santa Clause rally.” Well, someone may have been naughty this year, because Santa never showed up, and the December decline of 1.75% pushed 2015 into the loss column, be it by just 0.73%.
The mildly “flat” year, however, hid the underlying volatility in issues and sectors, as the index did what it typically does: melds the winners and losers. For 2015, the net change of -0.73% did not reflect the underlying swings. Three-hundred and thirty issues moved at least 10% (139 up at least 10% and 191 down at least 10%), as 137 issues, one in four, moved at least 25% (46 up at least 25% and 92 down at least 25%); despite that, the headlines said little movement.
The underlying volatility made it a stock picker’s year, meaning if you were good it, you should still be celebrating; but if you were less than good, you may still be crying at the table. As for index-based investors, they received a 1.38% total return for the 4 . Market Attributes | U.S. Equities December 2015 year, which was better than the bank but nothing to really celebrate about, unless they are comparing themselves to the active investors whose investments went south. As for December, it was another difficult month for the S&P 500, as the hopes going into the month were met with downturns. The overall index declined 1.75% (off 1.58% with dividends), as 6 of the 10 sectors fell. Chief among them was energy, which declined 10.0%, as oil became comfortable in the mid-to-upper USD 30 area, and research reports became comfortable with the potential for a price of USD 20.
For the year, energy was down 23.55%, easily the worst sector. Absent energy’s decline, S&P 500 2015 performance would have been in the black for the year, up 1.37%. Materials was the other major decliner, as it fell with commodity prices, coming in down 4.43% for the month and posting a double-digit decline of 10.36% for 2015.
Consumer staples was the winner for the month, as the sector moved up 2.51% to close the year up 3.77%. Consumer discretionary fell 2.97% in December, as concern continued over consumer spending and the brick-and-mortar versus web-based issues battle continued; the sector was still up 8.43% for the year, the best of any group. Health care added 1.61%, as the 2016 Obamacare sign-ups increased more than expected.
Concern continues over the profitability of Obamacare, but for now earnings in healthcare are rising, helped mostly by increased sales (via increased coverage). The sector ended 2015 up 5.21% and was up 29.73% over the twoyear period—both rates the best of any sector. Utilities, which was last year’s winner, rebounded 1.85% in December, but it was not enough to salvage the year, as the sector fell 8.39% for 2015 but remained up 13.86% for the two-year period. For the month, 182 issues increased (an average 3.70%), as 321 declined (an average loss of 6.41%); eight moved up at least 10% and 58% declined at least 10%.
For the year, breadth turned negative, with 215 issues up (an average of 17.99%) and 282 down (an average of -20.31%); 139 issues were up at least 10% and 191 issues were down at least 10%. Volatility was expected to increase in January, as earnings will start to dominate market attention. Overall, earnings are expected to increase over the poor showing in Q3 2015, but it will be 2016 earnings that could move the index more, as full-year guidance from companies will be compared to Wall Street’s expectation. The Dow® It was not a good month, or year, for the Dow Jones Industrial Average, as the headline index posted a 1.66% decline in December and ended the year with a 2.23% loss.
While The Dow did better than the S&P 500 for the month, it trailed the S&P 500 in 2015 (the S&P 500 was off 0.73%) and for the twoyear period (The Dow was up 5.12% and the S&P 500 was up 10.58%). Two-thirds of The Dow issues fell for the month, as 10 increased (an average increase of 2.82%) and 20 declined (an average loss of 3.00%). For the year, 13 gained (an average of 15.37%) and 17 declined (an average of -12.12%). Results varied greatly, as 17 of the 30 issues moved at least 10% (nine up and eight down).
For the month, iPhone maker Apple (AAPL) did the worst, falling 11.02% and posting its first annual loss since 2008, off 4.64%, as concern over the issue’s growth continued. Theme park issue Walk Disney (DIS) fell 7.39% in December, as concern over its media subscriptions overshadowed its new Star Wars movie, but it ended the year up a healthy 11.56%. Personal and household products issue Proctor & Gamble (PG) did the best in December, up 6.11%, followed by managed healthcare issue UnitedHealth Group (UNH), up 4.37% for the month (helped by higher sign-ups).
For the year, footwear and athletic apparel issue NIKE (NKE) did the best, up 30.01%, even though it declined 5.50% in December, as it did a 2-for-1 stock split. Fast-food restaurant issue McDonalds (MCD) ended the year up 26.08%, and it added 3.49% in December, as it continues to turn itself around via new menu items (all-day breakfast) 5 . Market Attributes | U.S. Equities December 2015 and cost cuts. Giant discount retailer Wal-Mart Stores (WMT) performed the worst in 2015, falling 28.62% (even as it was up 4.18% in December), while web-based retailers cut into the traditional brickand-mortar issue. Earth-moving machinery issue Caterpillar (CAT) lost 6.46% in December to end the year off 25.75%, as foreign currencies hurt it.
Energy issues fell, with Exxon Mobil (XOM) off 15.68% for the year (off 4.54% for December) and Chevron (CVX) off 19.81% for 2015 (off 1.49% for December). S&P MidCap 400 The S&P MidCap 400 posted a 4.33% decline in December after November’s 1.18% gain, as the decline left the index off 3.71% for the year (the worst of any of the core indices), but the index was still up 4.17% over the two-year period and up 37.06% over the three-year period. While the downturn was broad, with 9 of the 10 sectors lower, energy was the main issue, as the sector posted a devastating 18.91% decline for the month, the worst of any sector in any of the headline indices, with a decline of 34.08% for 2015 and a two-year loss of 41.41%—meaning the sector has lost over half its value. Telecommunication services fell 8.49% in December, as it finished the year off 13.85%. Materials was off 6.00% for the month, making it the third sector in the index to post a double-digit decline for 2015, off 14.55% for the year and off 10.82% for the two-year period.
Utilities was the only sector to gain for the month, as it rebounded 1.10% in December, but it fell short for the year, off 8.94%; the sector remained positive, up 4.97%, for the two-year period, thanks to its 2014 performance. Breadth turned negative for the month, as 91 issues gained (an average gain of 4.10%), down from last month’s 254 issues and the prior month’s 321 issues, while 308 declined (an average decrease of 8.19%), compared with last month’s 146 decliners and the prior month’s 77. Overall moves of at least 10% increased, and not for the better, as six issues gained at least 10% (31 did so in the prior month) but 87 fell at least 10% (28 declined at least 10% in the prior month).
For the year, breadth was negative, with 172 issues up (an average of 15.70%) and 219 down (an average of -21.69). The telling stat of the S&P MidCap 400, however, was that almost 60% of the issues moved at least 10%, 94 up and 164 down, as the year’s diverse returns left the index off 3.71%. S&P SmallCap 600 The S&P SmallCap 600 performed the worst of any of the headline indices in December, falling a broad 4.95%, wiping out its 2015 gains, and leaving it with a 3.36% decline for 2015. The declines were widespread, as decliners outnumbered gainers almost 4-to-1.
For the month, 124 issues gained (an average increase of 5.67%), down from last month’s 397 issues and the prior month’s 441 gainers, as 475 issues declined (an average loss of 8.61%), up from last month’s 201 issues and the prior month’s 157 decliners. All 10 sectors declined; energy (similar to the other core indices) posted the worst performance, off 17.54% for the month and ending the year off 47.70%. Over the two-year period, midcap energy has fallen 66.63%.
Materials ended in ninth place, off 7.55% for the month, leaving it off 26.61% for the year. Health care did relatively well, off 0.36% for the month, as it was the shining sector for the year, up 20.39%—the best sector in any headline index. Health care was up 33.53% for the two-year period, as demand for healthcare products and services continues to grow.
Both consumer discretionary and consumer staples did poorly for the month, off 4.69% and off 5.09%, respectively, but the sectors diverged for the year, as consumer discretionary fell 9.61% and consumer staples managed to limit its 2015 loss to 1.07%. Utilities did the best in December, off 0.27%, and it posted a positive year, up 3.84%. 6 . Market Attributes | U.S. Equities December 2015 S&P Global BMI Global markets closed out the year with a decline for the year and the month, as mixed markets resulted in a global 1.93% decline in December, with 22 of the 47 markets posting gains for the month. Markets varied less than usual, as slow trading and year-end holiday schedules affected trading. The variance, however, was quantifiable in sectors, as energy posted a broad 9.43% decline for the month, while oil and commodities continued their 18-month fall. The reason behind the oil fall was the same— high supply, with no producer willing to cut supplies, and weak demand, even as prices declined.
The combination has led to predictions of continued low prices, with the war for market share persisting. Emerging and developed markets showed similar performance in December. Emerging markets fell 1.94% for the month, as 10 of the 22 markets gained (and 12 fell). Egypt did the best, up 10.37% in December, but the rebound still left the group 27.50% in the red for the year.
South Africa did the worst for the month, off 10.46%, with its 2015 posting in the red by 26.62%. Developed markets declined 1.92% in December, as 12 of the 25 market gained (and 13 declined). New Zealand did the best, up 7.70% for the month, as it posted a 4.58% loss for 2015.
Canada did the worst in December, off 7.72%, ending the year off 26.17%. The U.S. posted a 2.19% decline for December, as its 2015 posting was in the red by 1.49%.
For the year, the impact of the U.S. was again positive, even though the country was in the red. Global markets were off 3.89% for the year, but excluding the U.S.
they were off 6.30%, as the two-year period shows global markets down 2.00% but down 11.58% without the U.S. The U.S. now accounts for 51.1% of the global equity market—it accounted for 47.8% two years ago.
Only six of the global markets posted a gain for 2015, but three of them did so via doubledigit gains (Hungary with 28.79%, Ireland with 24.18%, and Denmark with 22.37%). Two-year returns were just as poor, as 10 markets posted gains, while the three-year period had 23 of the 47 post positive returns. 7 . Market Attributes | U.S. Equities December 2015 PERFORMANCE RECAP Exhibit 2: Monthly Returns S&P 500 Price 1-Month (%) YTD (%) 3-Year (%) 5-Year (%) FR 12/99 (%) Energy 448.44 -10.00 -23.55 -15.86 -11.51 110.81 Materials 273.64 -4.43 -10.36 15.16 14.20 71.07 Industrials 463.53 -2.21 -4.72 41.00 53.93 69.56 Consumer Discretionary 621.02 -2.97 8.43 65.14 110.13 107.49 Consumer Staples 518.42 2.51 3.77 43.69 70.77 149.18 Health Care 833.23 1.61 5.21 79.98 128.42 154.98 Financials 321.73 -2.35 -3.48 45.42 49.80 0.00 Information Technology 721.48 -2.33 4.27 55.55 78.34 -10.65 Telecommunication Services 149.91 1.72 -1.73 2.65 16.45 -53.56 Utilities 220.00 1.85 -8.39 23.83 38.07 54.46 S&P 500 Dow Jones Industrial Average Dow Jones Industrial Average S&P MidCap 400 Energy 2043.94 -1.75 -0.73 43.31 62.52 39.11 Price 1-Month (%) YTD (%) 3-Year (%) 5-Year (%) FR 12/99 (%) 17425.03 -1.66 -2.23 32.97 50.51 51.56 Price 1-Month (%) YTD (%) 3-Year (%) 5-Year (%) FR 12/99 (%) 426.16 -18.91 -34.08 -38.71 -45.85 142.88 Materials 318.49 -6.00 -14.55 9.19 29.87 187.01 Industrials 659.95 -6.00 -4.28 36.77 61.34 270.72 Consumer Discretionary 624.31 -2.98 -9.16 40.62 73.04 213.86 Consumer Staples 1505.92 -3.41 -4.55 74.56 143.05 764.40 Health Care 1207.49 -0.92 8.86 95.17 148.24 582.53 713.89 -3.55 2.21 38.85 45.77 115.78 1540.74 -4.97 -0.02 37.68 39.39 82.85 Telecommunication Services 234.88 -8.49 -13.85 25.13 28.10 -50.36 Utilities 395.09 1.10 -8.94 29.06 47.73 185.22 1398.58 -4.33 -3.71 37.06 54.16 214.52 Financials Information Technology S&P MidCap 400 S&P SmallCap 600 Price 1-Month (%) YTD (%) 3-Year (%) 5-Year (%) FR 12/99 (%) Energy 559.04 -17.54 -47.70 -53.92 -53.02 259.74 Materials 317.93 -7.55 -26.61 -1.94 10.51 130.62 Industrials 711.08 -7.42 -6.27 34.20 51.65 255.65 Consumer Discretionary 421.45 -4.69 -9.61 38.84 65.63 210.96 Consumer Staples 1327.38 -5.09 -1.07 55.08 87.24 565.85 Health Care 1719.50 -0.36 20.39 107.66 166.32 849.79 Financials 735.23 -5.73 -2.56 31.45 48.57 151.01 Information Technology 456.15 -3.52 4.14 69.65 81.06 66.80 2.47 -2.76 0.31 1.95 -11.38 -96.64 Utilities 693.15 -0.27 3.84 42.80 59.26 269.29 S&P SmallCap 600 671.74 -4.95 -3.36 40.95 61.58 239.62 Telecommunication Services Source: S&P Dow Jones Indices LLC. Data as of Dec. 31, 2015.
Past performance is no guarantee of future results. Table is provided for illustrative purposes. Returns shown are price returns. 8 .
Market Attributes | U.S. Equities December 2015 Exhibit 3: Total Returns Index 1-Month (%) YTD (%) 3-Year (%) 5-Year (%) 10-Year (%) S&P 500 -1.58 1.38 52.59 80.75 102.42 S&P MidCap 400 -4.17 -2.18 43.35 66.06 119.46 S&P SmallCap 600 -4.79 -1.97 46.50 72.15 116.00 S&P Composite 1500 -1.88 0.95 53.36 91.34 104.50 Dow Jones Industrial Average -1.52 0.33 44.10 79.93 109.44 Source: S&P Dow Jones Indices LLC. Data as of Dec. 31, 2015.
Past performance is no guarantee of future results. Table is provided for illustrative purposes. Exhibit 4: S&P Global BMI, Emerging, Sorted by December Performance BMI Member 1-Month (%) 6-Month (%) YTD (%) 2-Year (%) 3-Year (%) Global -1.93 -5.92 Global Ex-U.S. -1.64 -9.38 -3.89 -2.00 18.72 -6.30 -11.58 0.25 Emerging -1.94 -17.76 -15.84 -17.57 -20.89 Egypt 10.37 -17.49 -27.50 -8.43 2.63 5.33 -10.28 -23.09 -7.34 -29.77 Qatar 4.28 -15.04 -18.65 0.06 24.05 Columbia 2.32 -28.53 -41.04 -52.71 -61.15 India 1.98 -5.96 -3.91 26.48 18.47 Hungary 1.92 6.19 28.79 -8.12 -7.95 U.A.E. 1.36 -20.22 -18.09 -12.09 60.35 Chile 1.25 -14.27 -19.16 -29.58 -45.12 Malaysia 0.60 -12.27 -20.55 -29.87 -26.82 Philippines 0.32 -12.06 -10.64 8.72 0.14 Greece -0.35 -36.40 -47.94 -68.58 -53.99 Taiwan -0.58 -16.87 -14.24 -11.81 -3.18 Poland -0.65 -20.06 -23.41 -35.96 -34.02 Czech Republic -0.76 -10.96 -13.12 -22.21 -34.42 China -1.01 -17.25 -6.01 -3.16 3.87 Peru -4.61 -27.43 -34.41 -35.18 -53.36 Mexico -4.88 -12.13 -14.91 -23.15 -22.97 Turkey -5.04 -19.76 -32.07 -22.28 -42.69 Brazil -5.70 -37.01 -44.30 -54.53 -63.24 Thailand -6.40 -20.56 -22.78 -10.74 -22.25 Russia -9.76 -18.76 0.80 -48.57 -49.45 -10.46 -27.56 -26.62 -23.67 -29.46 Indonesia South Africa Source: S&P Dow Jones Indices LLC. Data as of Dec.
31, 2015. Past performance is no guarantee of future results. Table is provided for illustrative purposes.
Returns shown are price returns. 9 . Market Attributes | U.S. Equities December 2015 Exhibit 5: S&P Global BMI, Developed, Sorted by December Performance BMI Member 1-Month (%) 6-Month (%) YTD (%) 2-Year (%) 3-Year (%) Developed -1.92 -4.61 -2.57 -0.21 24.23 Developed Ex-U.S. -1.57 -7.30 -3.91 -10.09 6.16 New Zealand 7.70 8.84 -4.58 1.68 14.22 Portugal 4.51 -6.17 -0.68 -34.29 -19.36 Australia 3.09 -8.02 -12.96 -20.17 -21.54 Denmark 2.92 5.12 22.37 30.31 71.06 Switzerland 1.22 -4.74 -0.83 -1.30 24.10 Israel 0.96 -1.21 4.75 13.92 29.44 Ireland 0.65 7.03 24.18 25.19 79.26 Hong Kong 0.49 -13.60 -5.37 -5.26 1.97 Japan 0.32 -3.52 8.69 3.50 29.08 Finland 0.25 2.42 0.47 -5.18 28.42 Belgium 0.21 3.53 9.37 10.82 36.72 Singapore 0.07 -16.71 -18.86 -19.72 -22.11 Austria -0.89 -3.16 0.82 -20.44 -10.44 Sweden -1.17 -2.38 -1.57 -10.02 11.51 United States -2.19 -2.43 -1.49 8.74 42.20 Germany -2.21 -3.22 -2.46 -13.79 10.64 Italy -2.56 -5.88 3.20 -9.21 11.73 Netherlands -2.59 -6.25 0.53 -2.77 24.73 Korea -2.71 -10.03 -5.01 -14.47 -11.78 France -3.10 -4.24 -0.84 -11.90 10.58 Luxembourg -3.24 -27.30 -29.26 -39.41 -33.38 United Kingdom -3.57 -10.00 -8.48 -15.95 0.17 Spain -5.44 -14.49 -17.41 -22.91 1.45 Norway -6.55 -18.71 -17.40 -37.31 -32.25 Canada -7.22 -20.12 -26.17 -27.74 -25.59 Source: S&P Dow Jones Indices LLC. Data as of Dec. 31, 2015.
Past performance is no guarantee of future results. Table is provided for illustrative purposes. Returns shown are price returns. 10 .
Market Attributes | U.S. Equities December 2015 Exhibit 6: Price-to-Earnings Ratios Index 2012 2013 2014 Estimated 2015 S&P 500 13.04 14.73 18.09 19.21 S&P 500 Consumer Discretionary 14.83 16.89 22.42 20.50 S&P 500 Consumer Staples 15.69 15.96 21.46 21.26 S&P 500 Energy 10.86 12.03 10.44 -161.89 S&P 500 Financials 10.79 13.46 14.65 13.81 S&P 500 Health Care 12.93 14.68 23.29 20.37 S&P 500 Industrials 13.95 14.76 17.28 16.41 S&P 500 Information Technology 13.04 14.19 19.50 18.55 S&P 500 Materials 13.07 16.20 17.26 24.74 S&P 500 Telecommunication Services 18.95 43.21 20.79 13.13 S&P 500 Utilities 14.67 14.84 16.64 16.09 Index 2012 2013 2014 Estimated 2015 S&P MidCap 400 17.48 18.71 23.76 22.06 S&P 400 Consumer Discretionary 18.51 18.19 20.67 18.74 S&P 400 Consumer Staples 16.31 16.80 26.67 20.84 S&P 400 Energy 15.10 22.82 15.40 -13.85 S&P 400 Financials 22.11 18.61 19.62 19.71 S&P 400 Health Care 17.17 21.24 31.30 23.44 S&P 400 Industrials 14.74 15.55 18.22 16.69 S&P 400 Information Technology 18.06 23.60 32.56 28.92 S&P 400 Materials 15.39 17.93 -838.13 20.08 S&P 400 Telecommunication Services 22.72 34.07 -60.07 12.84 S&P 400 Utilities 17.48 15.52 17.40 18.07 Index 2012 2013 2014 Estimated 2015 S&P SmallCap 600 20.16 22.04 25.08 28.85 S&P 600 Consumer Discretionary 18.81 21.45 22.41 19.52 S&P 600 Consumer Staples 20.78 18.26 20.47 18.80 S&P 600 Energy 19.90 77.57 -8.28 -2.51 S&P 600 Financials 25.17 20.10 19.24 19.68 S&P 600 Health Care 19.57 21.59 36.71 40.84 S&P 600 Industrials 16.86 17.85 20.77 18.93 S&P 600 Information Technology 23.20 31.37 35.14 27.28 S&P 600 Materials 16.62 22.56 16.92 23.87 S&P 600 Telecommunication Services 15.73 24.20 13.72 30.88 S&P 600 Utilities 16.52 16.69 18.85 19.97 Source: S&P Dow Jones Indices LLC. Data as of Dec. 31, 2015.
Past performance is no guarantee of future results. Table is provided for illustrative purposes. 11 . Market Attributes | U.S. Equities December 2015 Exhibit 7: Operating EPS Changes Q4 2014 Over Q4 2013 (%) -5.31 Q1 2015 Over Q1 2014 (%) -5.53 Q2 2015E Over Q2 2014 (%) -10.91 Q3 2015E Over Q3 2014 (%) -14.05 15.10 4.23 9.50 17.10 S&P 500 Consumer Staples -10.96 2.88 0.95 S&P 500 Energy Index S&P 500 S&P 500 Consumer Discretionary Q4 2015E Over Q4 2014 (%) 8.41 2014 Over 2013 (%) 5.32 2015E Over 2014 (%) -5.86 6.49 10.27 9.39 -3.26 3.59 0.88 0.91 -28.45 -104.10 -104.27 -135.99 -59.35 1.39 -106.45 S&P 500 Financials -6.64 12.36 -0.34 4.74 8.13 4.22 6.06 S&P 500 Health Care 10.47 17.89 1.47 6.79 32.72 10.33 14.31 S&P 500 Industrials 2.11 5.97 -2.25 9.34 8.57 7.80 5.33 S&P 500 Information Technology 18.14 11.18 3.99 3.70 2.76 10.18 5.14 S&P 500 Materials -0.33 -30.25 -15.59 -68.03 -2.98 12.97 -30.22 -122.94 2.84 0.68 4.00 312.50 -41.52 58.39 6.20 Q4 2014 Over Q4 2013 (%) -4.66 15.66 Q1 2015 Over Q1 2014 (%) 4.98 12.50 Q2 2015E Over Q2 2014 (%) -11.52 -5.31 Q3 2015E Over Q3 2014 (%) 20.78 -5.84 Q4 2015E Over Q4 2014 (%) 19.99 8.99 2014 Over 2013 (%) -1.88 3.40 2015E Over 2014 (%) 7.71 37.94 31.97 7.50 18.33 -2.04 12.35 10.30 S&P 500 Telecommunication Services S&P 500 Utilities Index S&P MidCap 400 S&P 400 Consumer Discretionary S&P 400 Consumer Staples -8.51 15.38 48.31 30.53 20.80 2.13 28.00 -157.23 -134.45 -327.82 -170.82 171.24 -16.13 -211.24 4.95 8.50 3.13 -9.41 -2.47 18.19 -0.44 30.15 16.09 28.57 49.84 38.14 26.08 33.54 S&P 400 Industrials -17.38 4.61 6.27 0.83 30.19 1.63 9.14 S&P 400 Information Technology -0.27 27.75 -2.90 -8.55 36.69 -0.86 12.60 -63.16 8.29 -15.04 131.74 93.17 -101.92 4273.68 24.05 1720.00 1190.00 N/A 2.85 -131.36 567.77 -2.00 Q4 2014 Over Q4 2013 (%) 4.05 -3.76 Q1 2015 Over Q1 2014 (%) -16.44 -1.00 Q2 2015E Over Q2 2014 (%) -21.01 -12.46 Q3 2015E Over Q3 2014 (%) -32.30 6.95 Q4 2015E Over Q4 2014 (%) 15.42 5.48 2014 Over 2013 (%) 5.72 -3.70 2015E Over 2014 (%) -13.07 S&P 600 Consumer Discretionary 29.71 21.66 20.97 14.97 5.42 5.50 14.78 S&P 600 Consumer Staples 59.84 77.56 -0.52 5.20 -14.86 37.42 8.88 -1698.62 -1370.42 -1383.61 -227.91 90.44 -308.72 -229.75 S&P 600 Financials 20.98 0.75 -1.47 -7.96 0.19 10.72 -2.25 S&P 600 Health Care 50.91 16.97 -13.77 -16.76 -17.23 21.28 -10.12 7.48 11.23 12.39 9.73 5.86 4.97 9.73 -18.59 10.33 41.89 9.27 52.49 9.35 28.81 41.94 17.84 -51.04 -33.12 -23.35 56.19 -29.11 N/A 100.00 -88.89 400.00 N/A 125.00 -55.56 37.64 -5.06 -6.23 7.04 -9.16 20.64 -5.60 S&P 400 Energy S&P 400 Financials S&P 400 Health Care S&P 400 Materials S&P 400 Telecommunication Services S&P 400 Utilities Index S&P SmallCap 600 S&P 600 Energy S&P 600 Industrials S&P 600 Information Technology S&P 600 Materials S&P 600 Telecommunication Services S&P 600 Utilities Source: S&P Dow Jones Indices LLC. Data as of Dec. 31, 2015.
Past performance is no guarantee of future results. Table is provided for illustrative purposes. 12 . Market Attributes | U.S. Equities December 2015 Exhibit 8: Breadth of Change (Issues With Monthly Price Changes as Described by Type) S&P 500 358 Average % Change 9.99 -6.41 144 20.35 144 -15.25 1 Down <= -25% Up >= 50% Down <= -50% Type 215 Average % Change 17.99 -10.36 282 -20.31 17.53 139 25.19 53 -20.98 191 -27.84 71.72 16 38.06 46 42.75 4 -31.24 12 -36.07 92 -39.41 1 71.72 3 60.59 7 81.18 0 0.00 1 -53.77 16 -61.92 December 2015 Up 183 Down 321 8 58 Up >= 25% Up >= 10% Down <= -10% Average % Change 3.70 3-Month YTD S&P MidCap 400 Type December 2015 Up 91 Down Average % Change 4.10 242 Average % Change 10.00 3-Month 172 Average % Change 15.70 YTD 308 Down <= -25% -10.99 219 -21.69 92 18.94 94 24.91 -16.17 66 -20.33 164 -27.40 1 Up >= 25% 158 24.49 87 Down <= -10% -8.19 6 Up >= 10% 59.56 15 36.96 34 39.32 10 -33.51 17 -32.74 76 -40.46 Up >= 50% 1 59.56 2 58.48 9 59.29 Down <= -50% 0 0.00 0 0.00 13 -63.71 S&P SmallCap 600 Type 341 Average % Change 14.51 -8.51 257 15.80 189 -16.09 1 December 2015 Up 124 Down 475 24 156 Up >= 10% Down <= -10% Up >= 25% Down <= -25% Average % Change 5.67 242 Average % Change 23.70 -12.33 350 -26.88 22.47 158 33.61 115 -21.83 269 -33.51 41.07 58 37.03 86 47.36 3-Month YTD 20 -30.56 32 -37.52 152 -46.13 Up >= 50% 0 0.00 9 55.85 26 76.27 Down <= -50% 0 0.00 4 -57.95 57 -64.91 Dow Jones Industrial Average Up 10 Average % Change 2.82 Down Type December 2015 3-Month 26 Average % Change 10.49 13 Average % Change 15.37 YTD 20 -3.00 4 -5.32 17 -12.12 Up >= 10% 0 0.00 12 17.11 9 20.25 Down <= -10% 1 -11.02 0 0.00 8 -19.83 Source: S&P Dow Jones Indices LLC. Data as of Dec. 31, 2015.
Past performance is no guarantee of future results. Table is provided for illustrative purposes. LIKE WHAT YOU READ? Sign up to receive updates on a broad range of index-related topics and complimentary events. 13 . Market Attributes | U.S. Equities December 2015 GENERAL DISCLAIMER © 2016 by S&P Dow Jones Indices LLC, a part of McGraw Hill Financial, Inc. All rights reserved. Standard & Poor’s® and S&P® are registered trademarks of Standard & Poor’s Financial Services LLC (“S&P”), a subsidiary of McGraw Hill Financial. ® Dow Jones is a registered trademark of Dow Jones Trademark Holdings LLC (“Dow Jones”).
Trademarks have been licensed to S&P Dow Jones Indices LLC. Redistribution, reproduction and/or photocopying in whole or in part are prohibited without written permission. This document does not constitute an offer of services in jurisdictions where S&P Dow Jones Indices LLC, Dow Jones, S&P or their respective affiliates (collectively “S&P Dow Jones Indices”) do not have the necessary licenses.
All information provided by S&P Dow Jones Indices is impersonal and not tailored to the needs of any person, entity or group of persons. S&P Dow Jones Indices receives compensation in connection with licensing its indices to third parties. Past performance of an index is not a guarantee of future results It is not possible to invest directly in an index.
Exposure to an asset class represented by an index is available through investable instruments based on that index. S&P Dow Jones Indices does not sponsor, endorse, sell, promote or manage any investment fund or other investment vehicle that is offered by third parties and that seeks to provide an investment return based on the performance of any index. S&P Dow Jones Indices makes no assurance that investment products based on the index will accurately track index performance or provide positive investment returns.
S&P Dow Jones Indices LLC is not an investment advisor, and S&P Dow Jones Indices makes no representation regarding the advisability of investing in any such investment fund or other investment vehicle. A decision to invest in any such investment fund or other investment vehicle should not be made in reliance on any of the statements set forth in this document. Prospective investors are advised to make an investment in any such fund or other vehicle only after carefully considering the risks associated with investing in such funds, as detailed in an offering memorandum or similar document that is prepared by or on behalf of the issuer of the investment fund or other vehicle.
Inclusion of a security within an index is not a recommendation by S&P Dow Jones Indices to buy, sell, or hold such security, nor is it considered to be investment advice. Closing prices for S&P US benchmark indices and Dow Jones US benchmark indices are calculated by S&P Dow Jones Indices based on the closing price of the individual constituents of the index as set by their primary exchange. Closing prices are received by S&P Dow Jones Indices from one of its third party vendors and verified by comparing them with prices from an alternative vendor.
The vendors receive the closing price from the primary exchanges. Real-time intraday prices are calculated similarly without a second verification.] These materials have been prepared solely for informational purposes based upon information generally available to the public and from sources believed to be reliable. No content contained in these materials (including index data, ratings, credit-related analyses and data, research, valuations, model, software or other application or output therefrom) or any part thereof (Content) may be modified, reverse-engineered, reproduced or distributed in any form or by any means, or stored in a database or retrieval system, without the prior written permission of S&P Dow Jones Indices.
The Content shall not be used for any unlawful or unauthorized purposes. S&P Dow Jones Indices and its third-party data providers and licensors (collectively “S&P Dow Jones Indices Parties”) do not guarantee the accuracy, completeness, timeliness or availability of the Content. S&P Dow Jones Indices Parties are not responsible for any errors or omissions, regardless of the cause, for the results obtained from the use of the Content. The Content is provided on an “as is” basis.
S&P DOW JONES INDICES PARTIES DISCLAIM ANY AND ALL EXPRESS OR IMPLIED WARRANTIES, INCLUDING, BUT NOT LIMITED TO, ANY WARRANTIES OF MERCHANTABILITY OR FITNESS FOR A PARTICULAR PURPOSE OR USE, FREEDOM FROM BUGS, SOFTWARE ERRORS OR DEFECTS, THAT THE CONTENT’S FUNCTIONING WILL BE UNINTERRUPTED OR THAT THE CONTENT WILL OPERATE WITH ANY SOFTWARE OR HARDWARE CONFIGURATION. In no event shall S&P Dow Jones Indices Parties be liable to any party for any direct, indirect, incidental, exemplary, compensatory, punitive, special or consequential damages, costs, expenses, legal fees, or losses (including, without limitation, lost income or lost profits and opportunity costs) in connection with any use of the Content even if advised of the possibility of such damages. S&P Dow Jones Indices keeps certain activities of its business units separate from each other in order to preserve the independence and objectivity of their respective activities. As a result, certain business units of S&P Dow Jones Indices may have information that is not available to other business units.
S&P Dow Jones Indices has established policies and procedures to maintain the confidentiality of certain non-public information received in connection with each analytical process. In addition, S&P Dow Jones Indices provides a wide range of services to, or relating to, many organizations, including issuers of securities, investment advisers, broker-dealers, investment banks, other financial institutions and financial intermediaries, and accordingly may receive fees or other economic benefits from those organizations, including organizations whose securities or services they may recommend, rate, include in model portfolios, evaluate or otherwise address. 14 .


